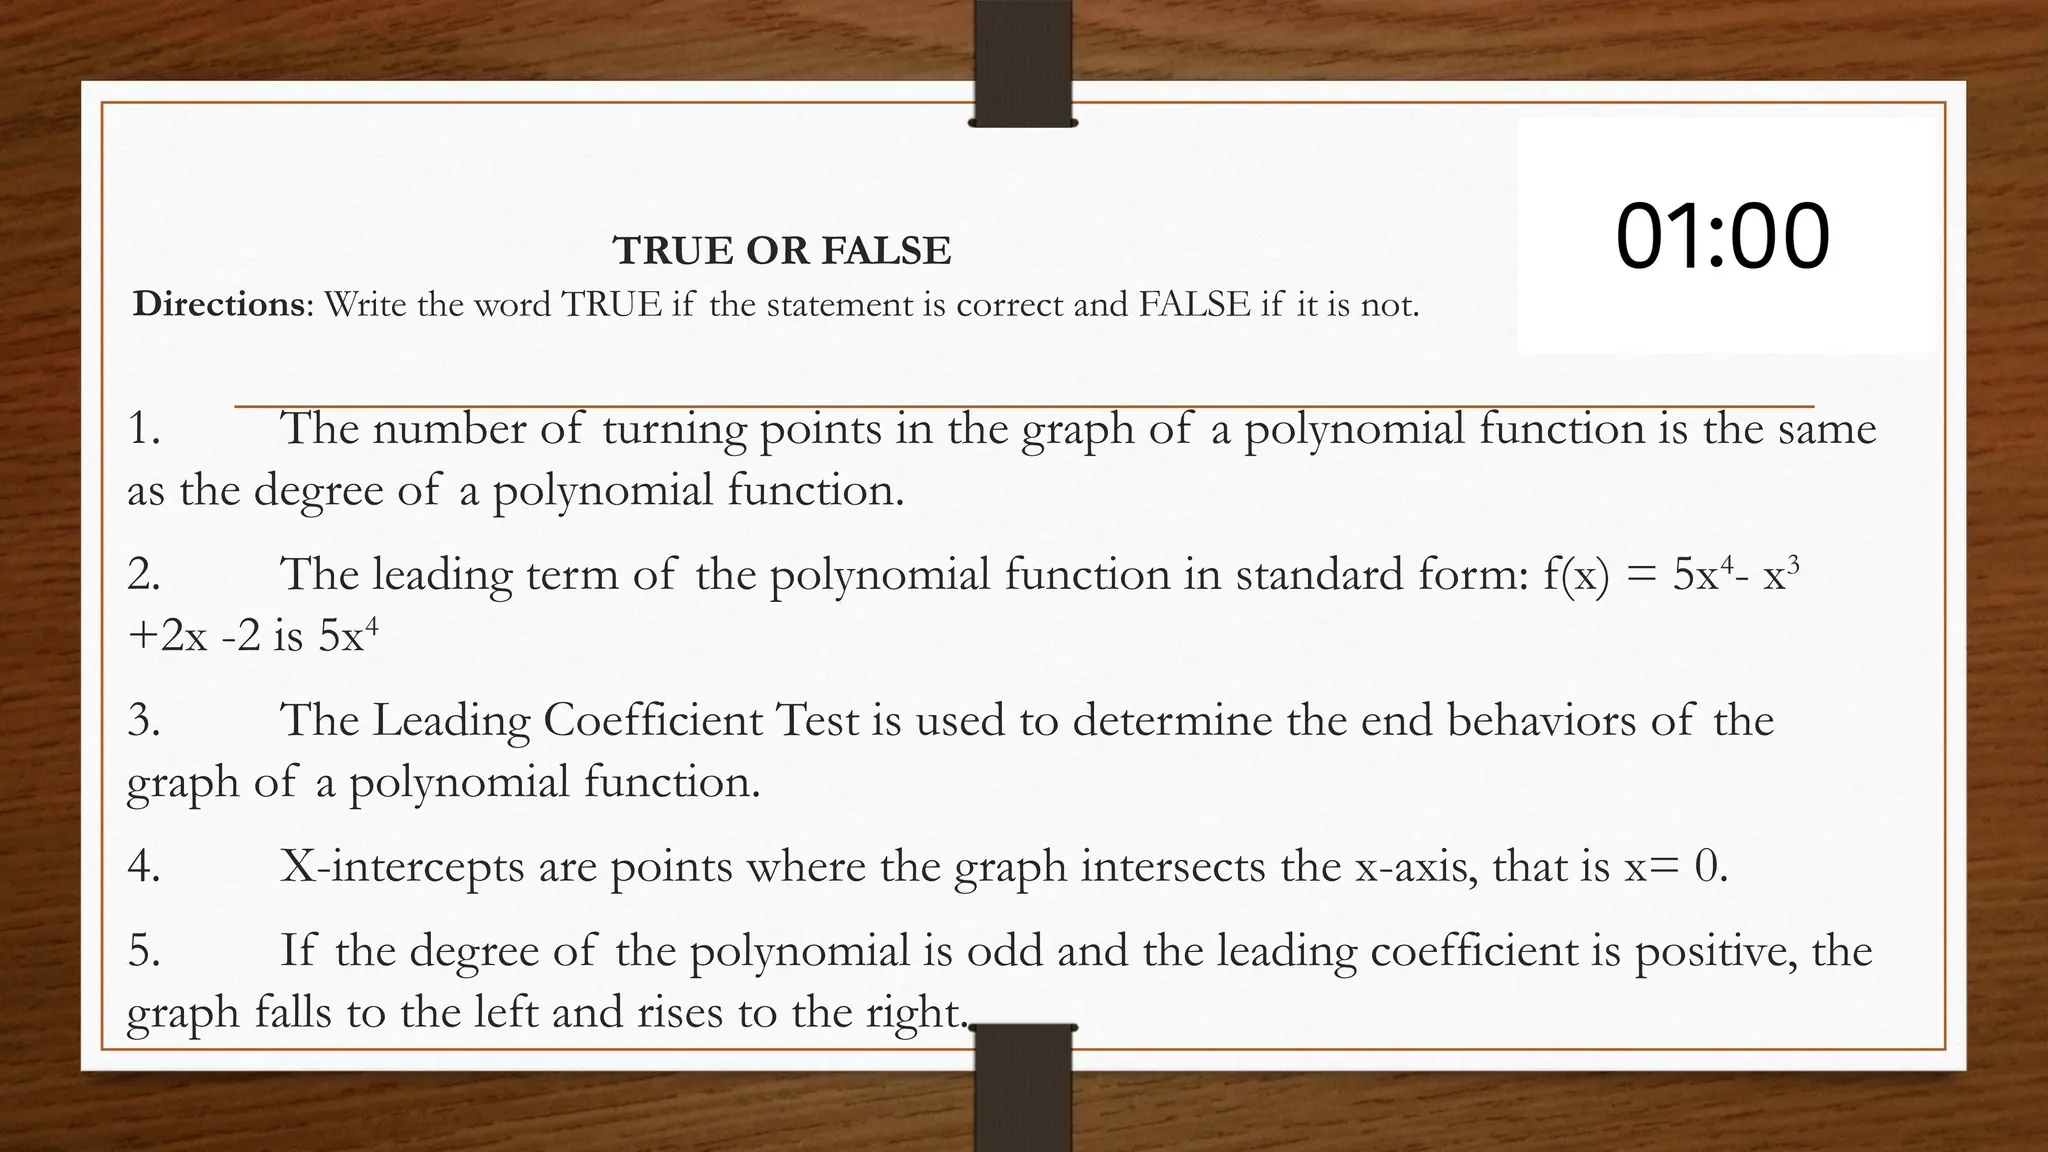
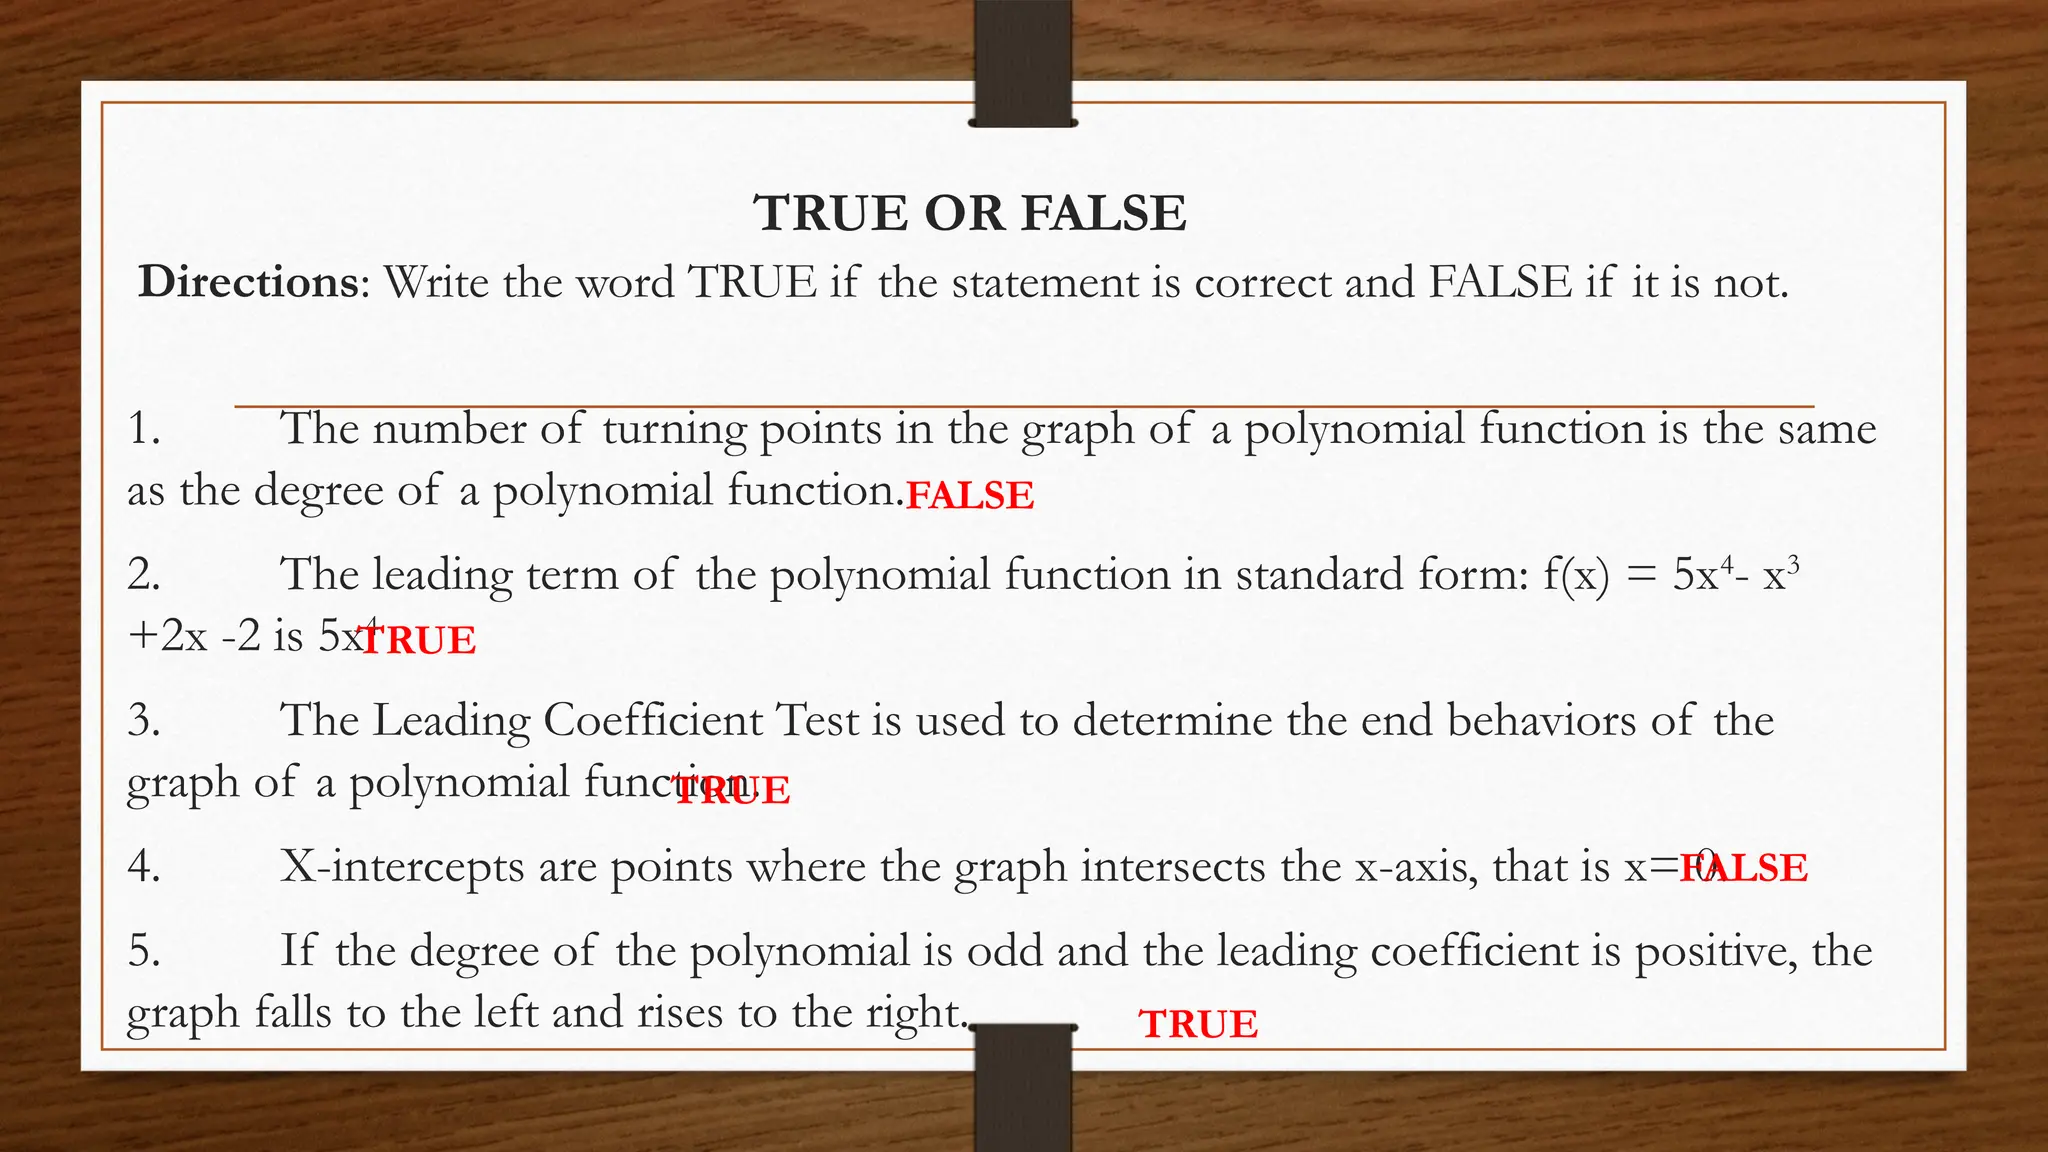
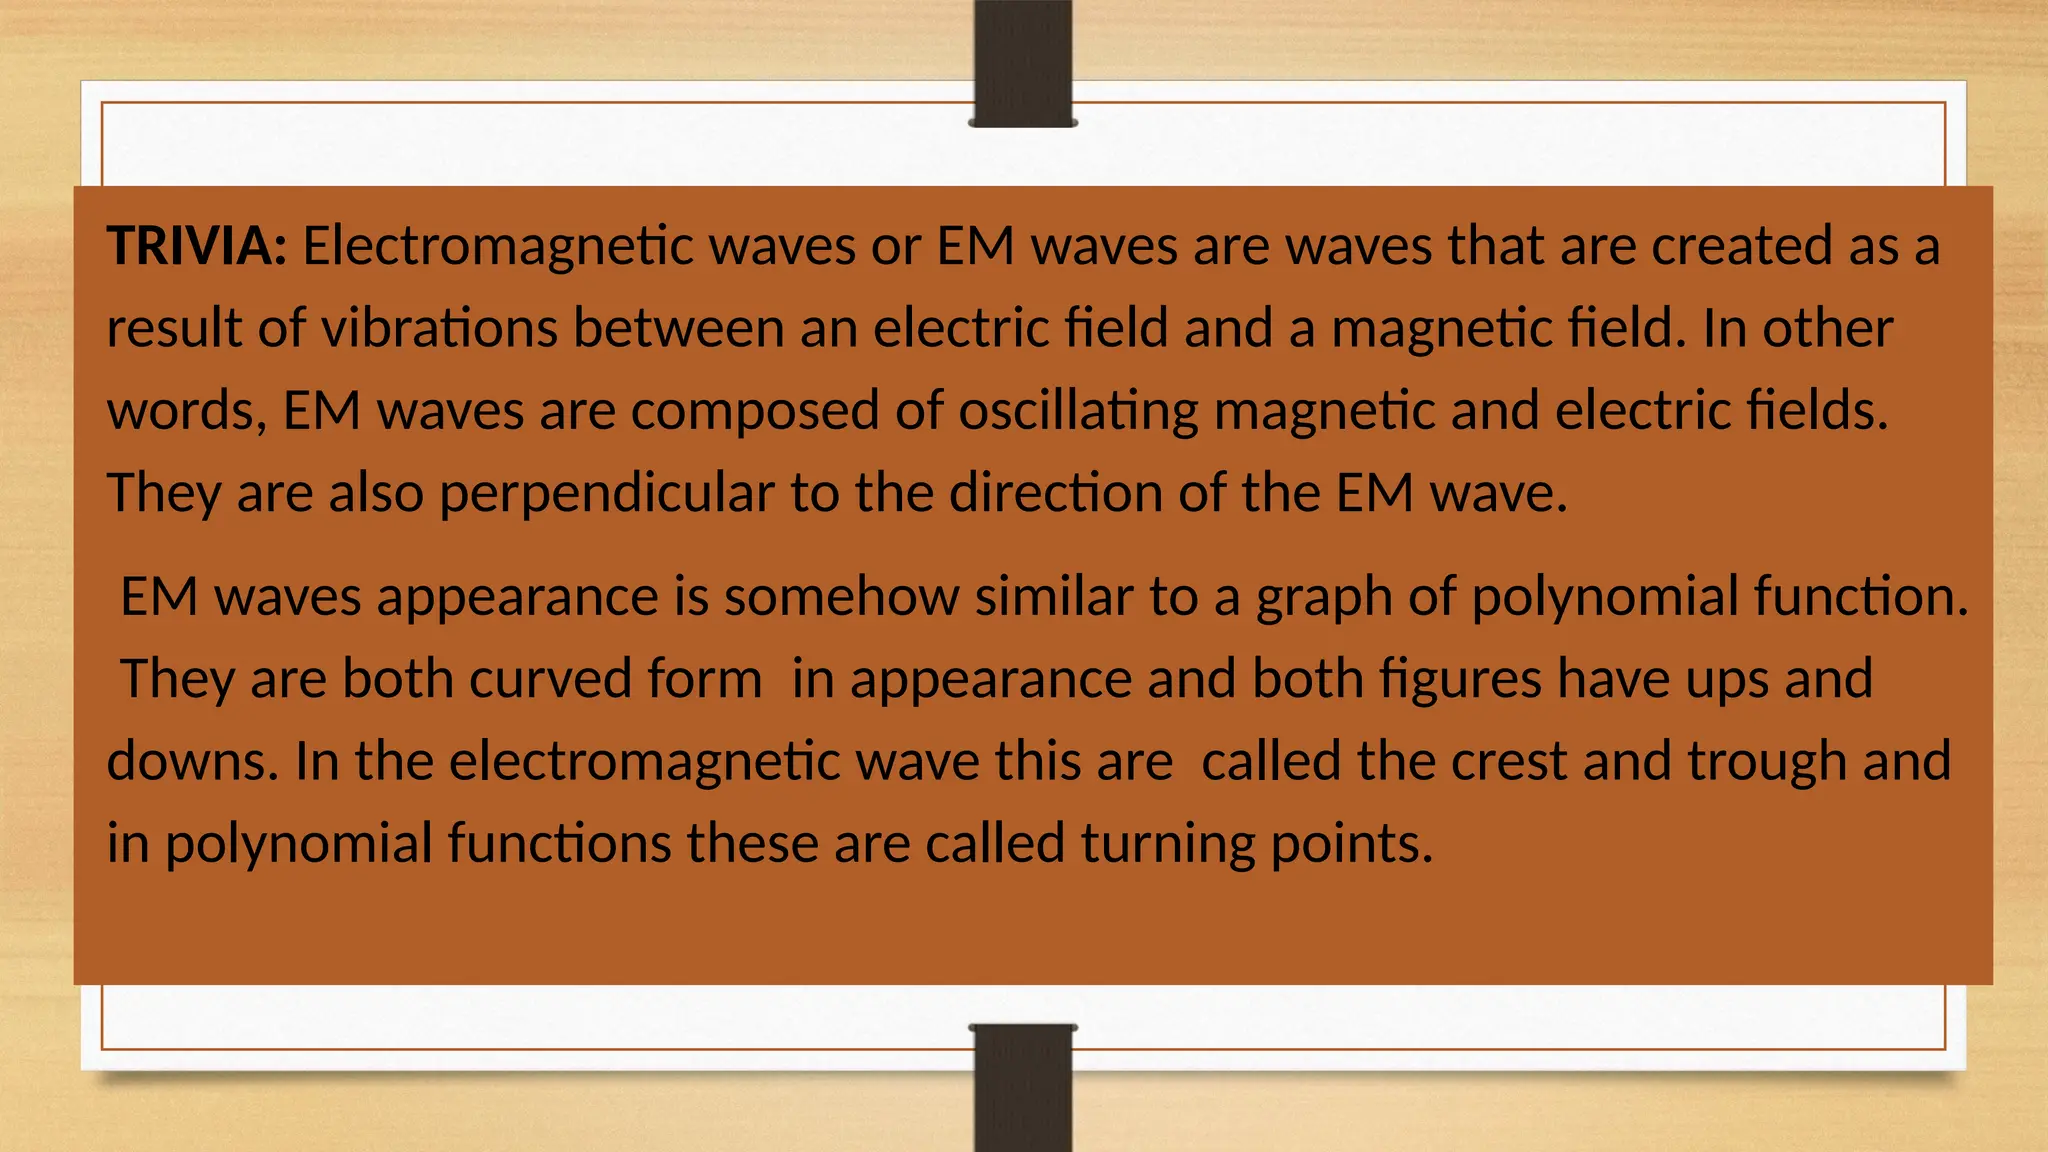
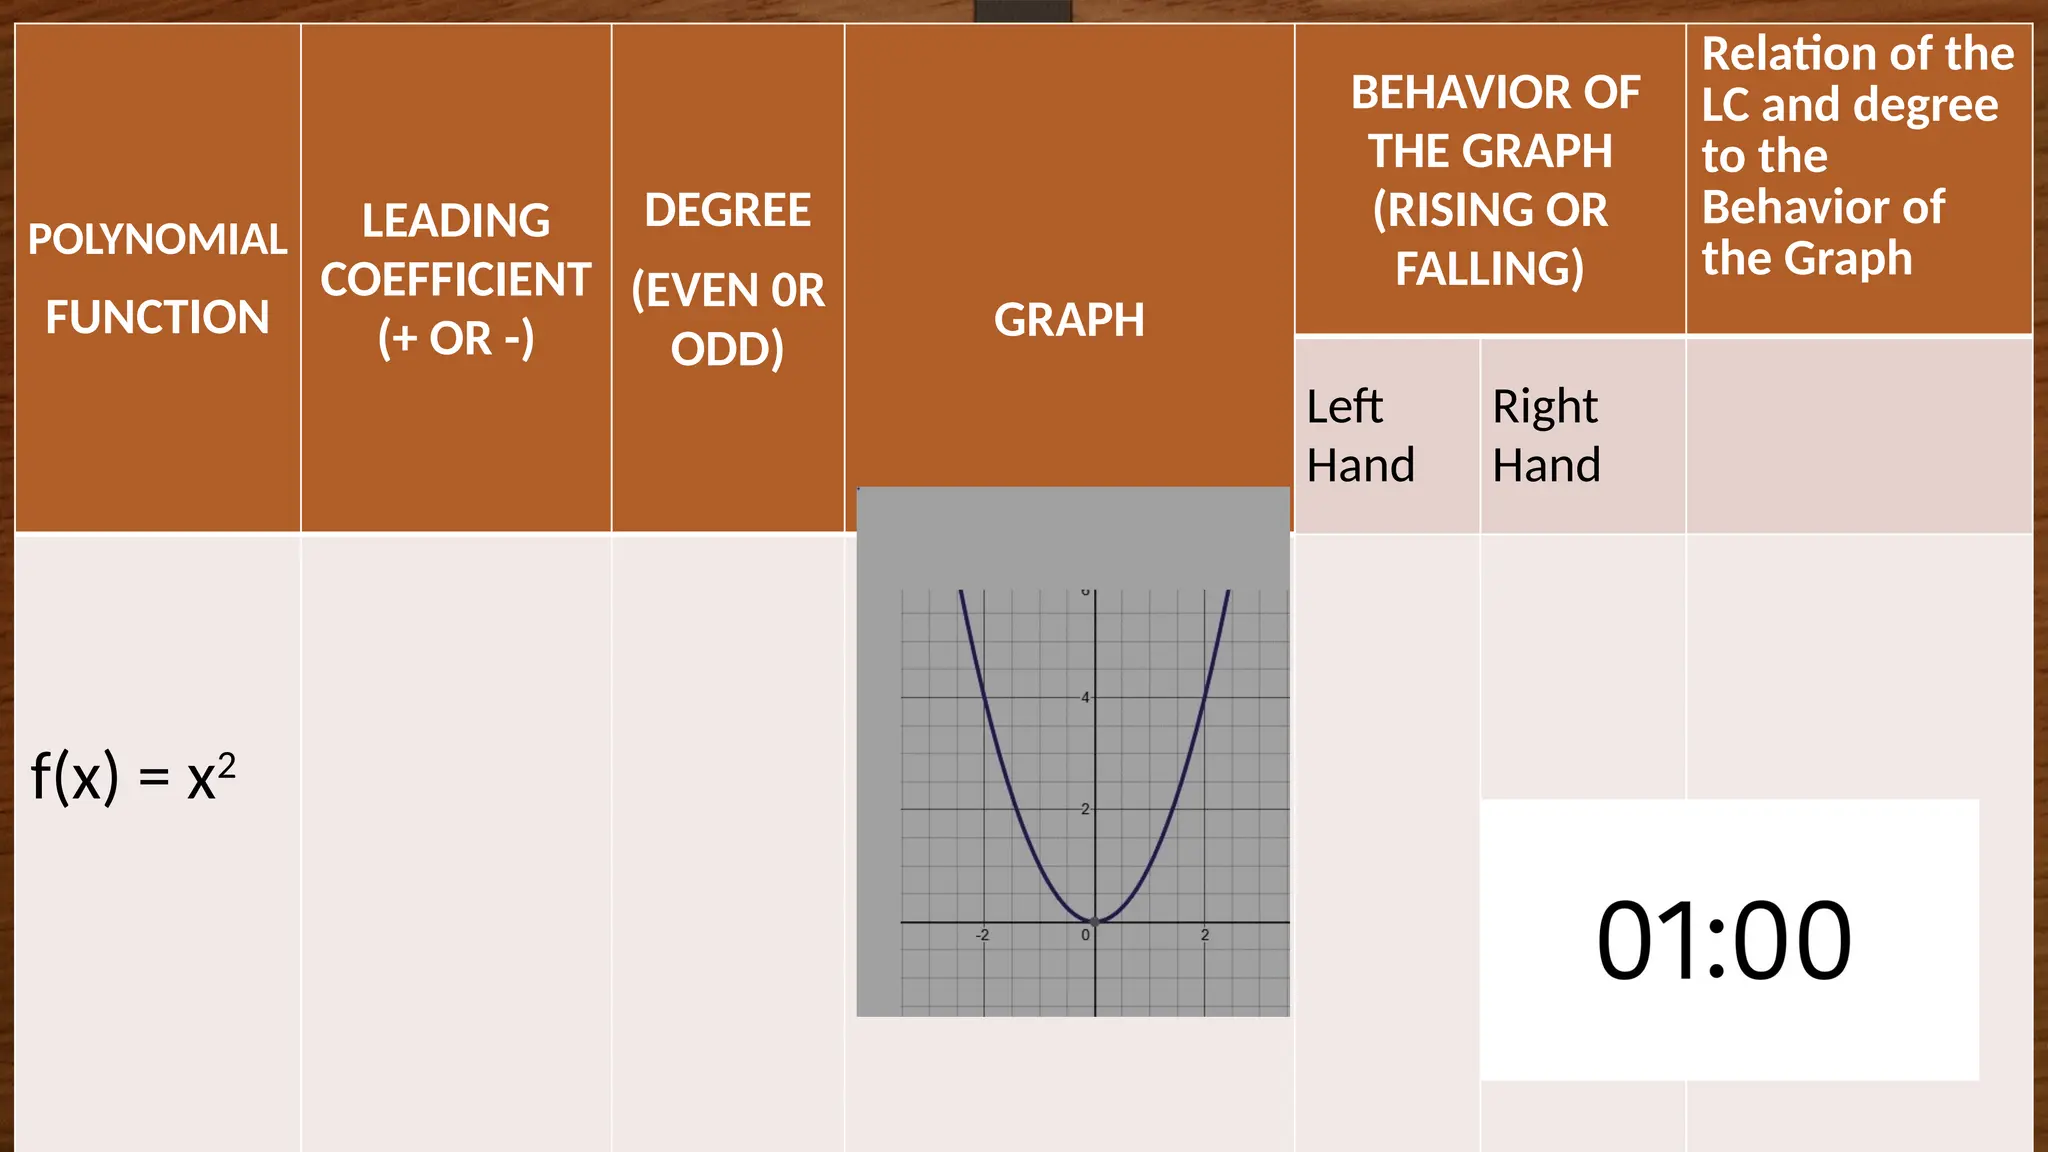
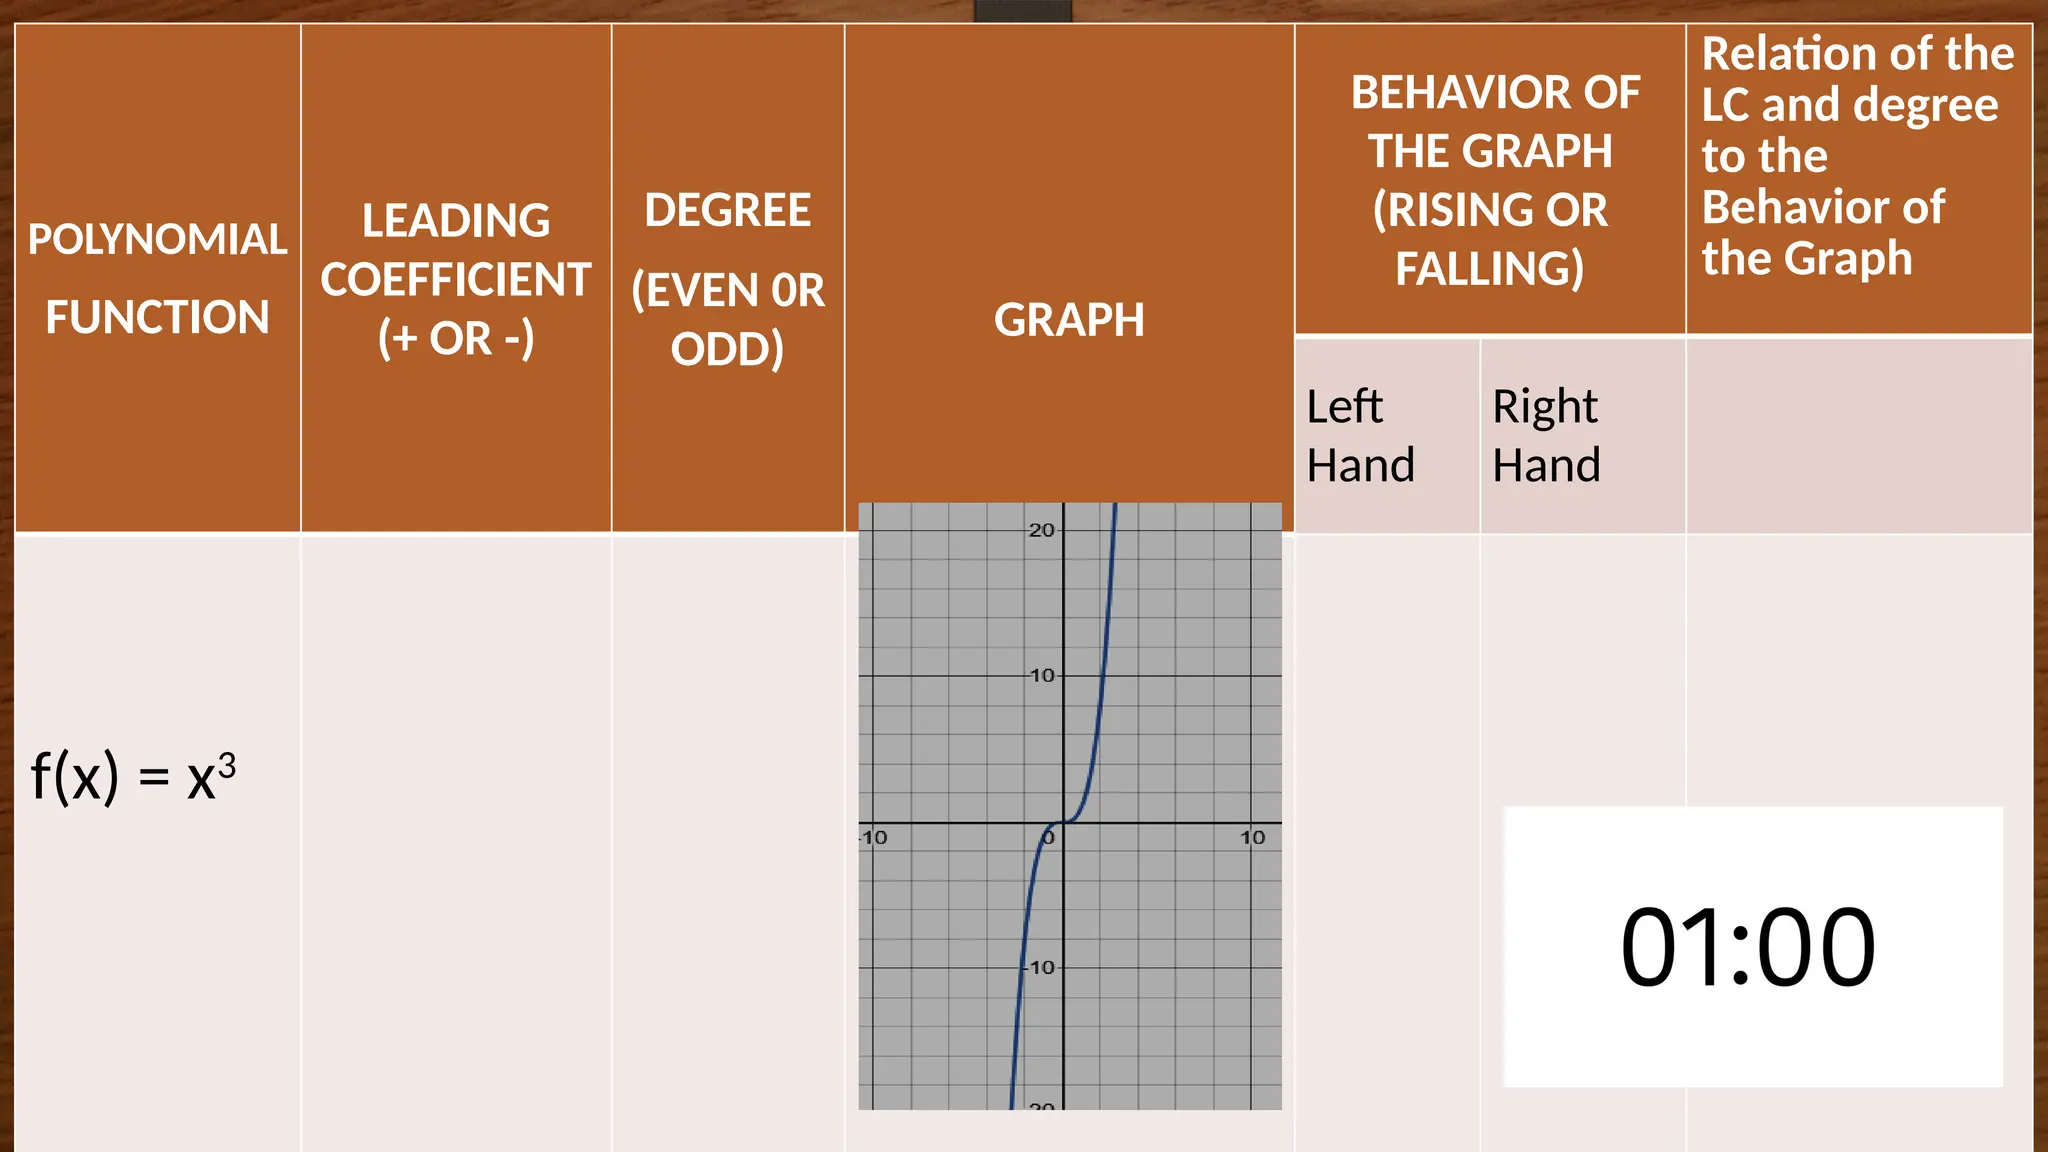
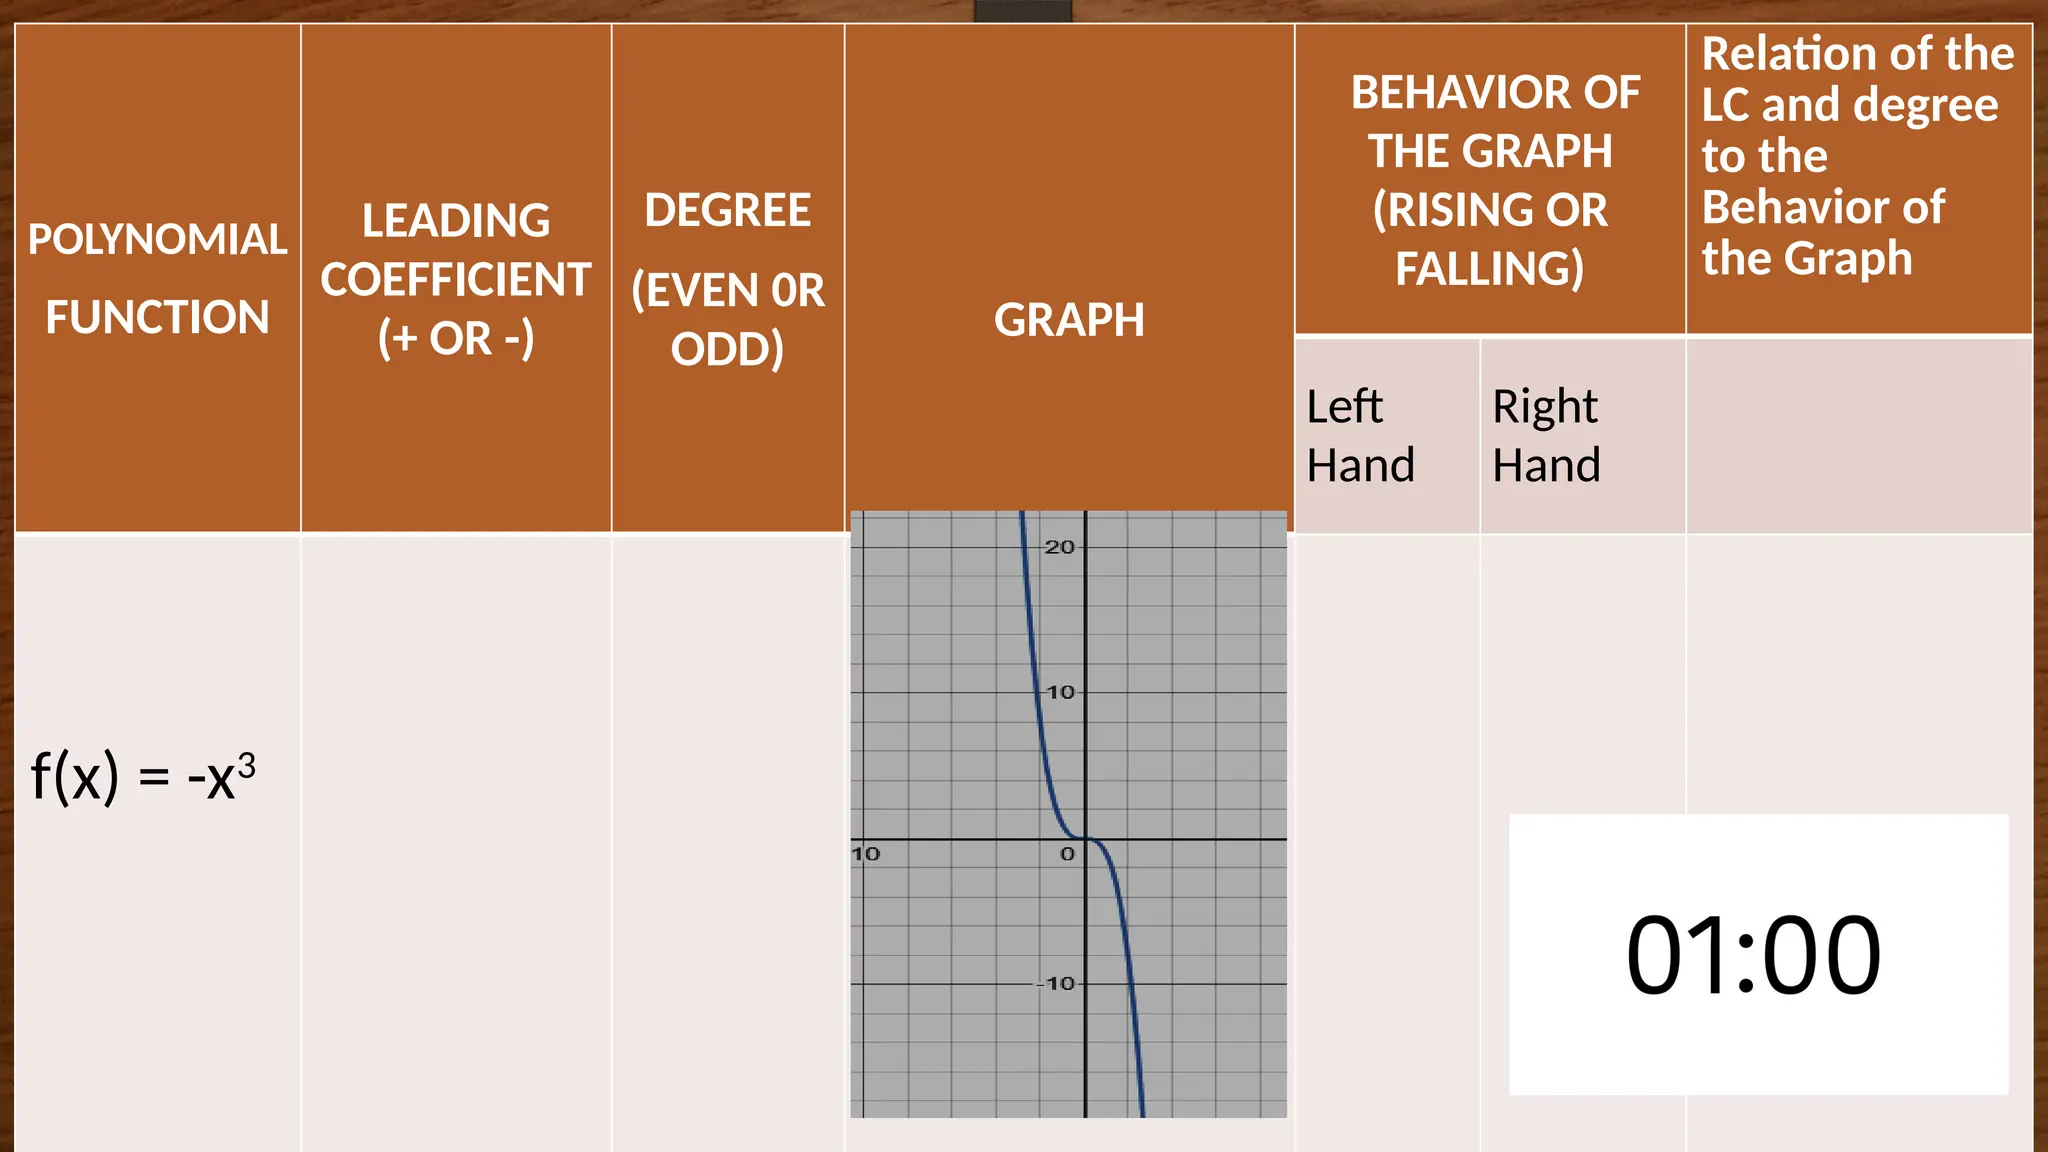
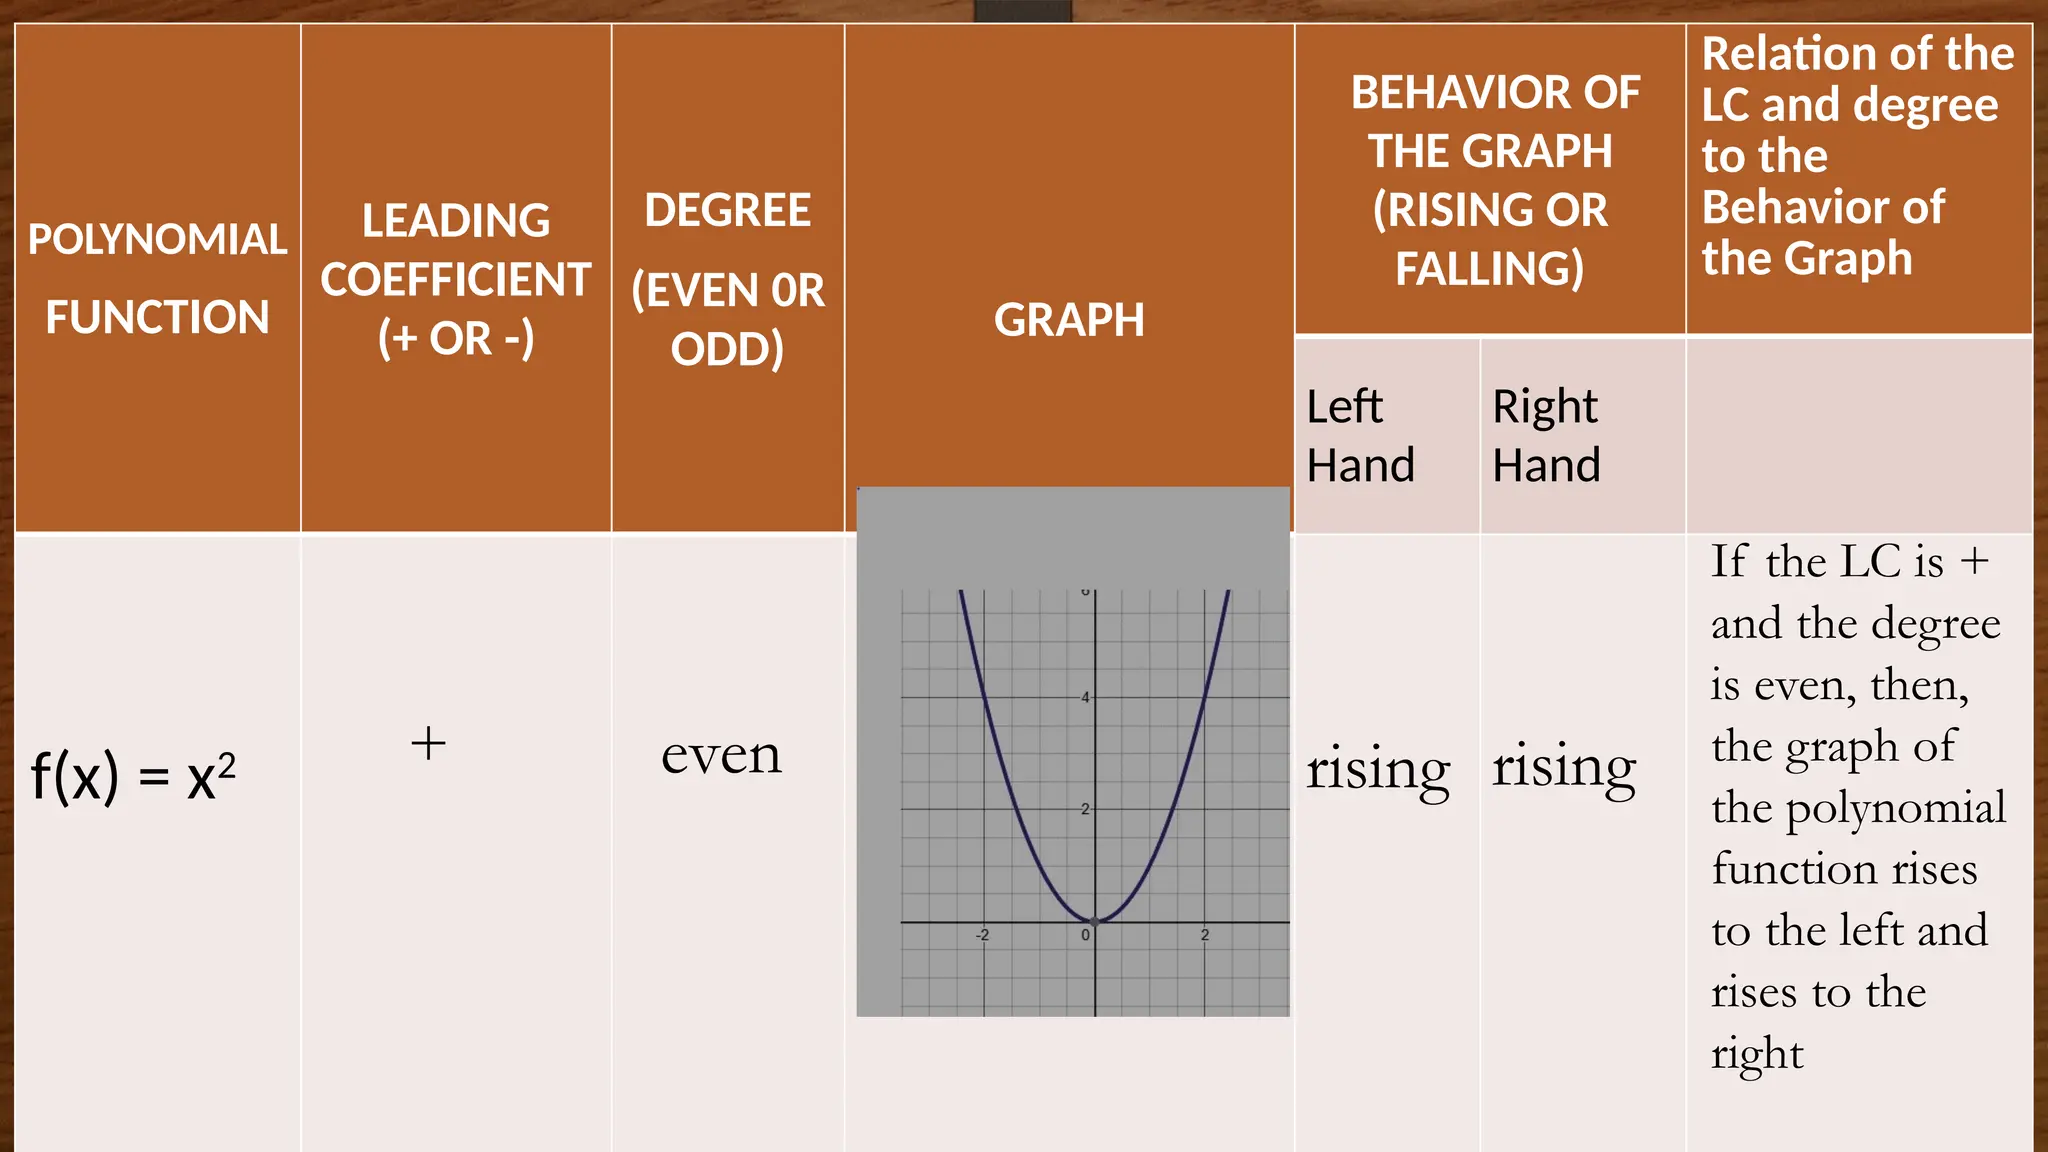
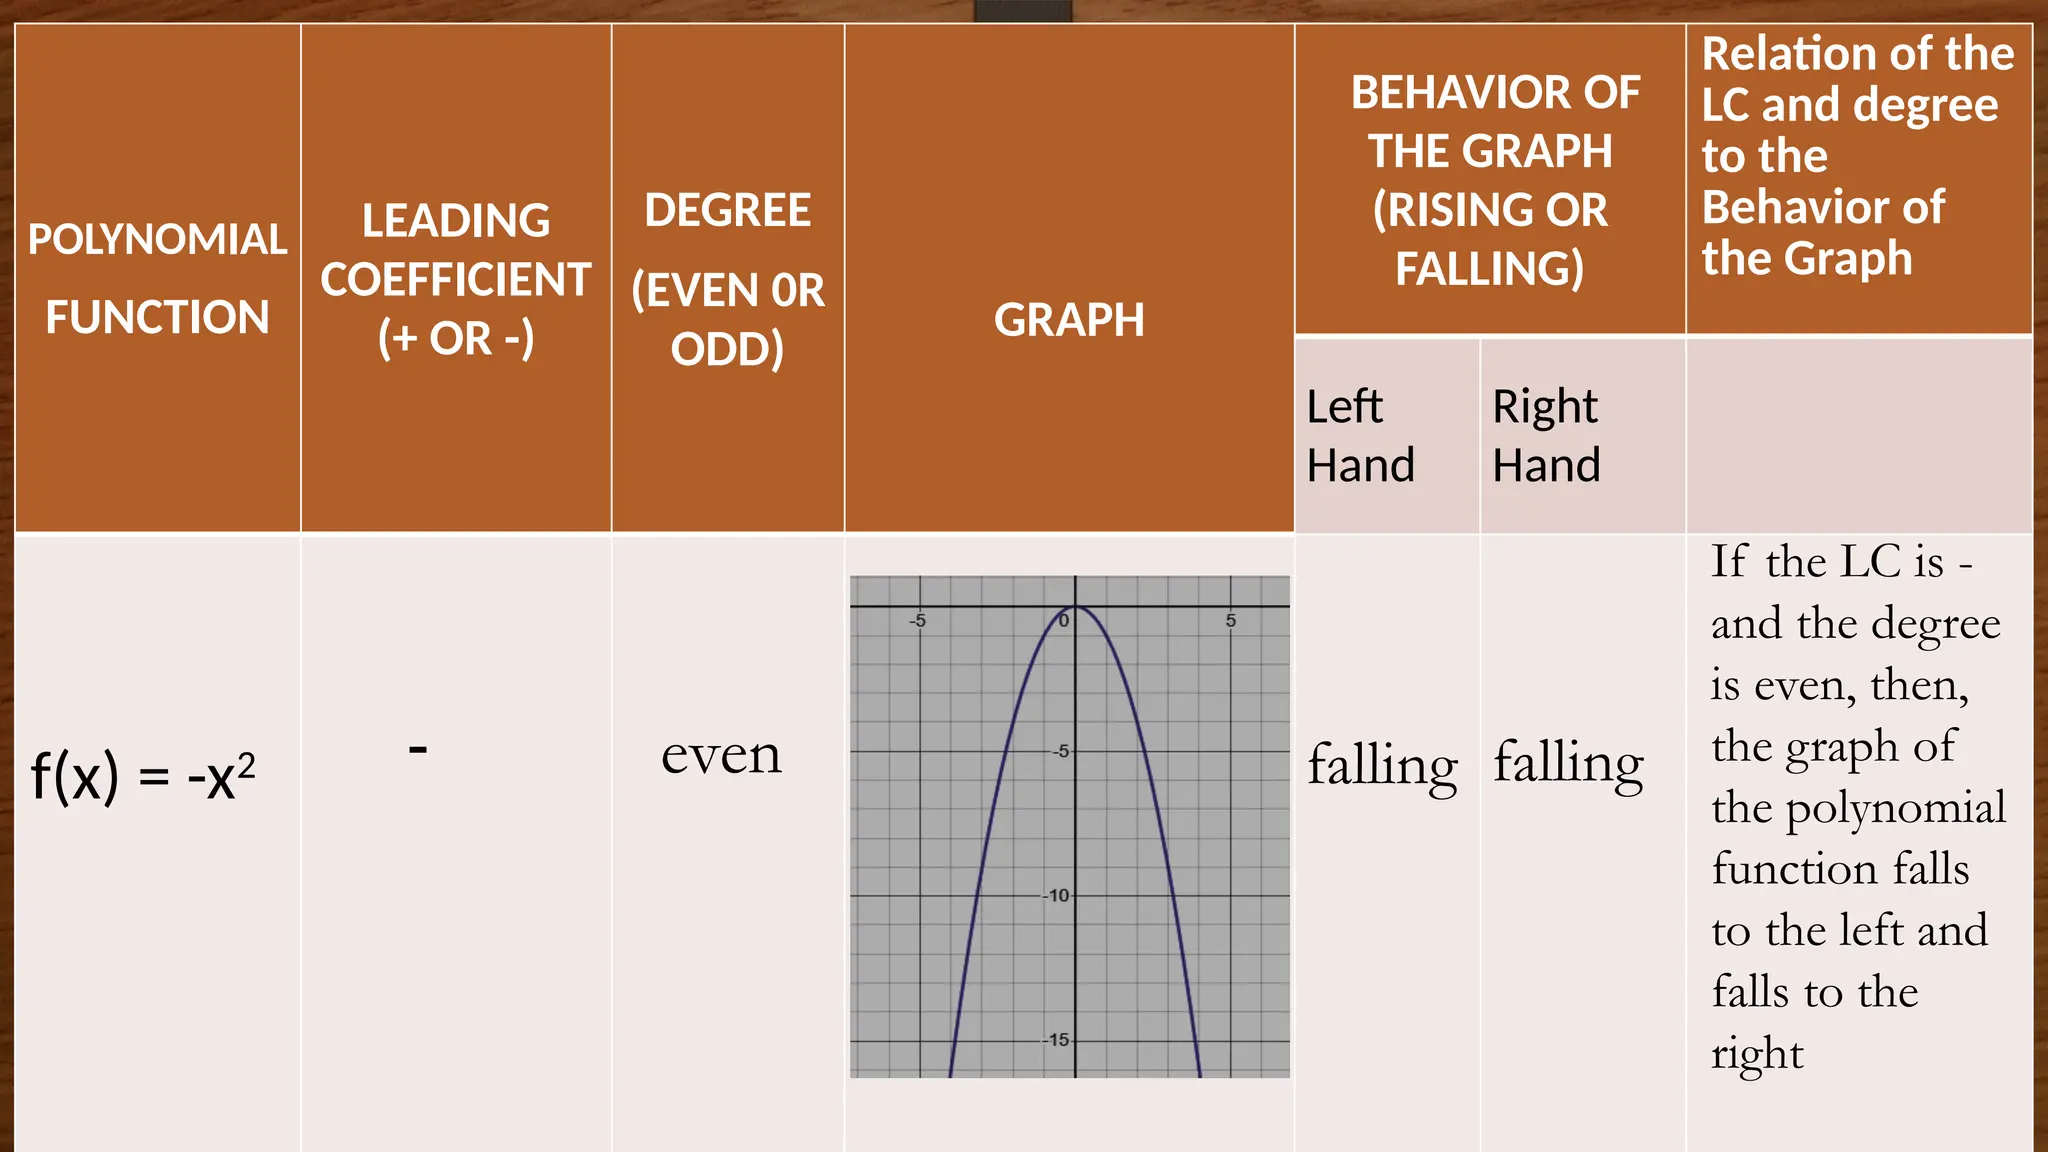
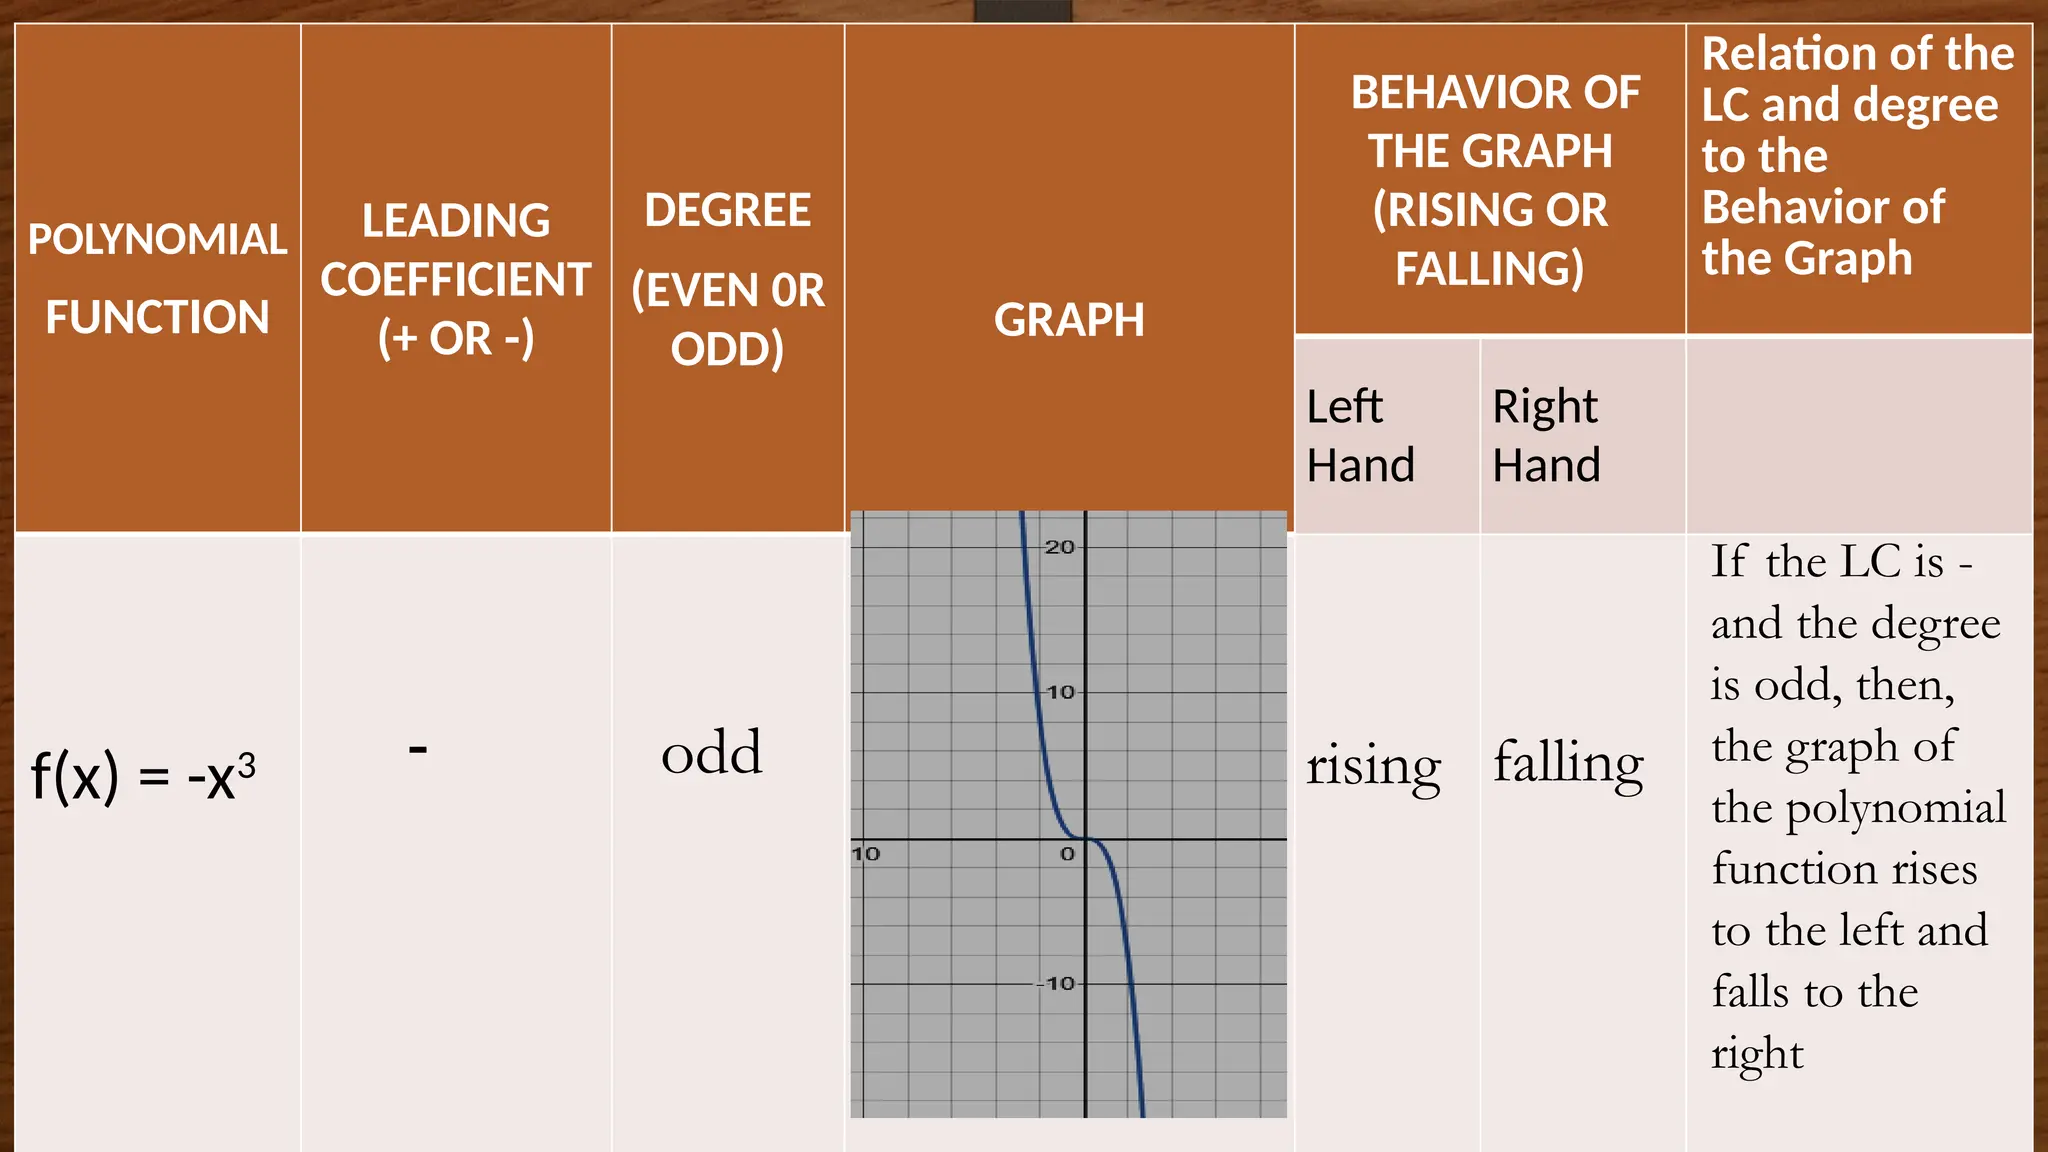
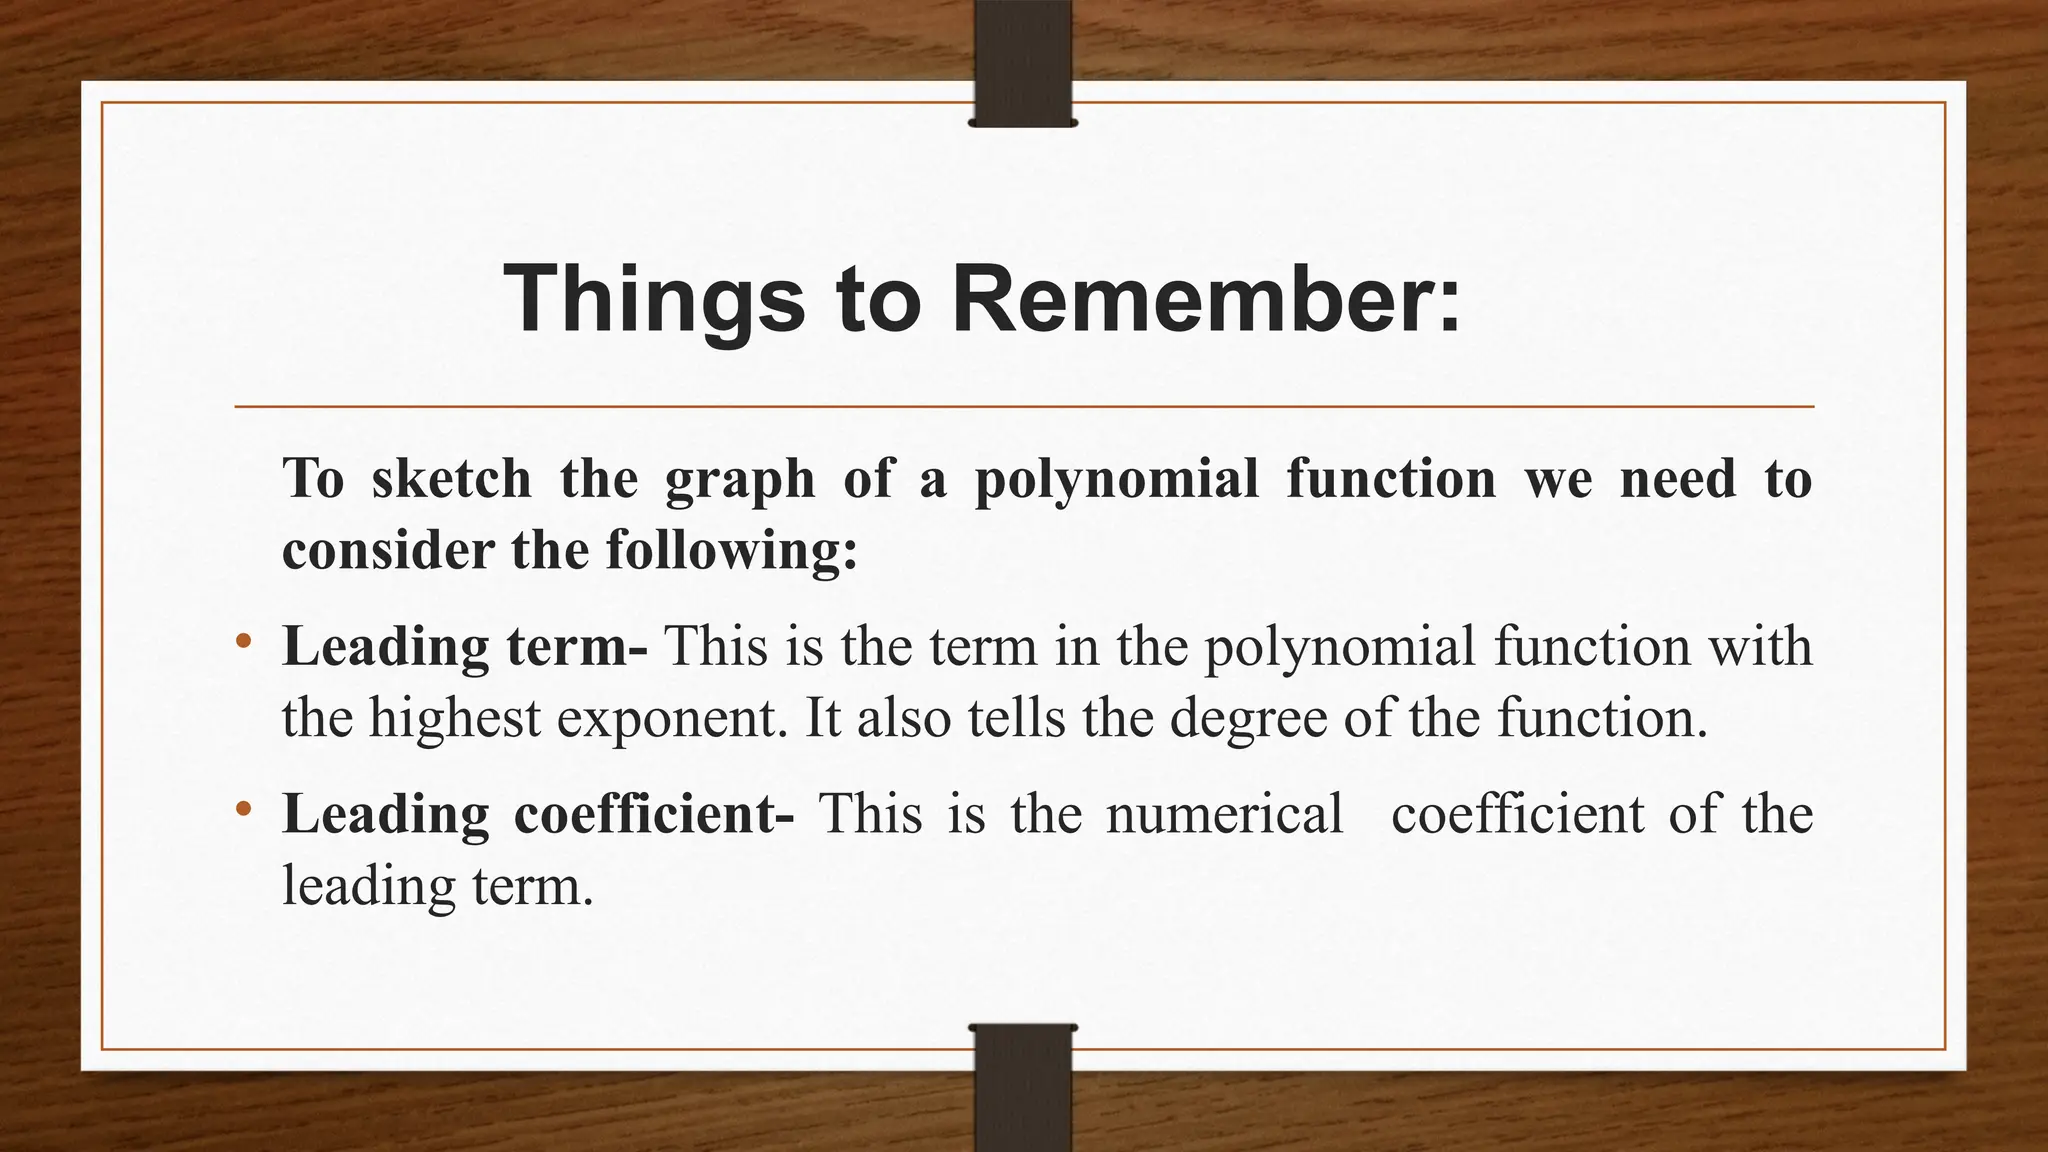
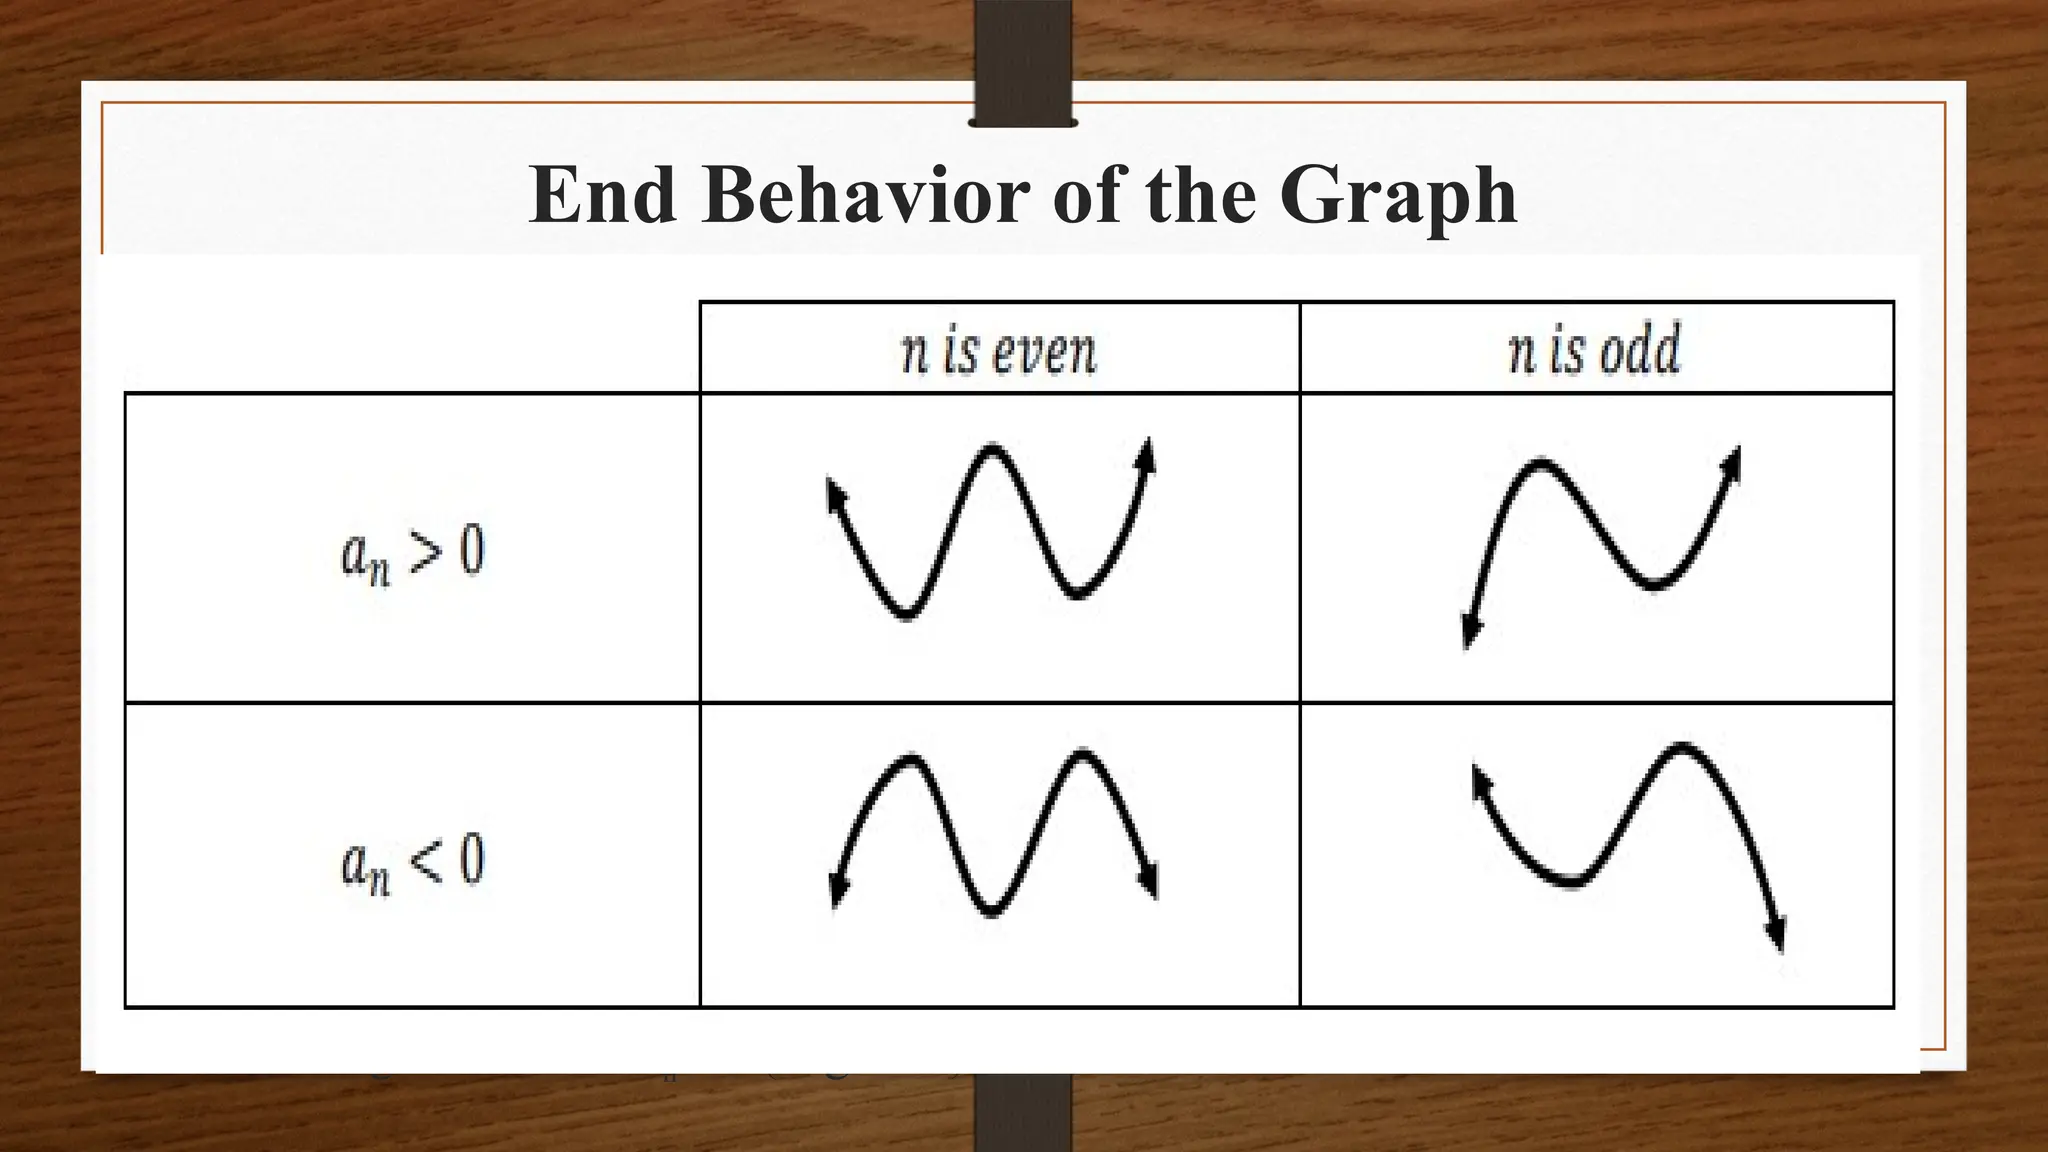
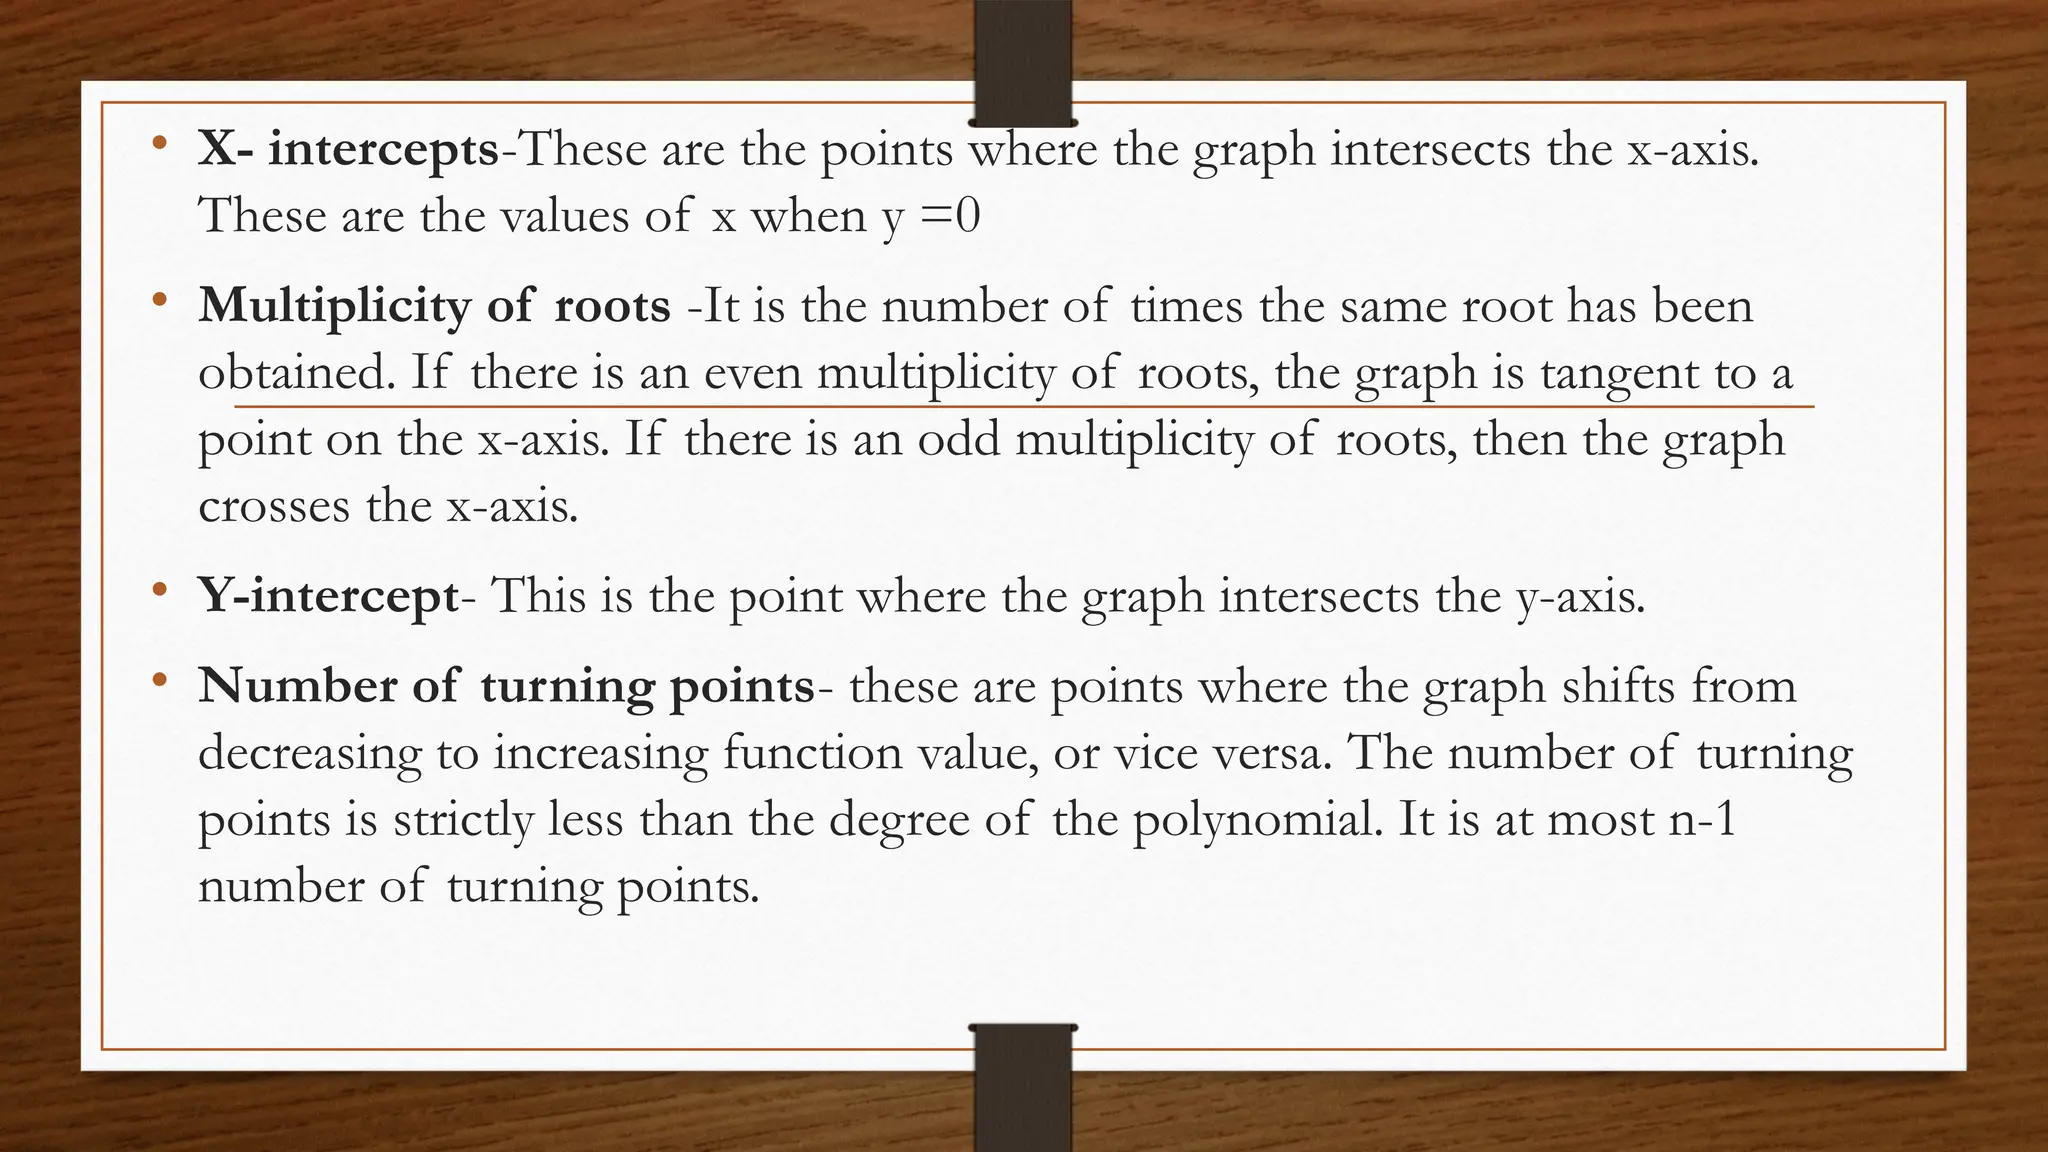
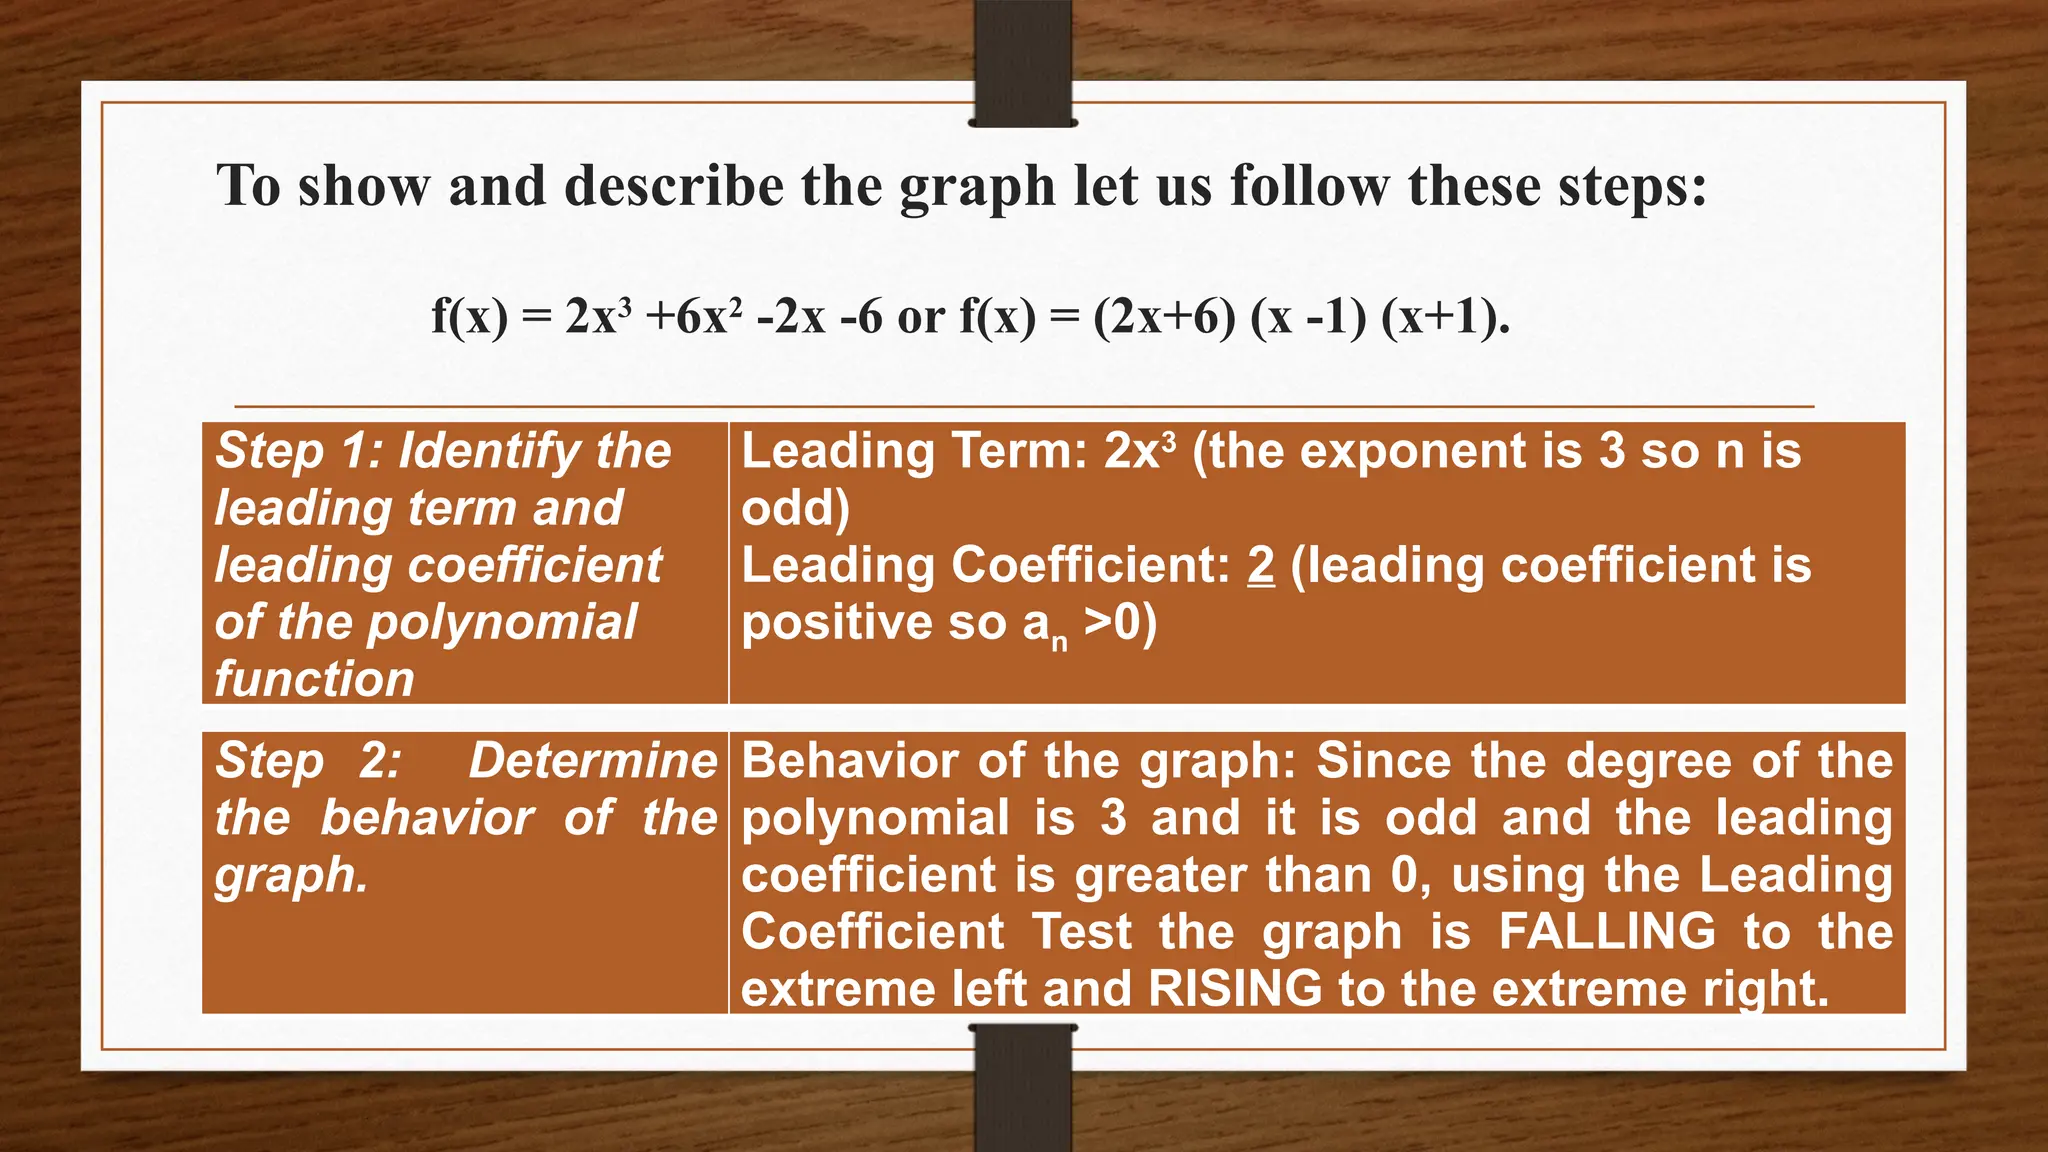
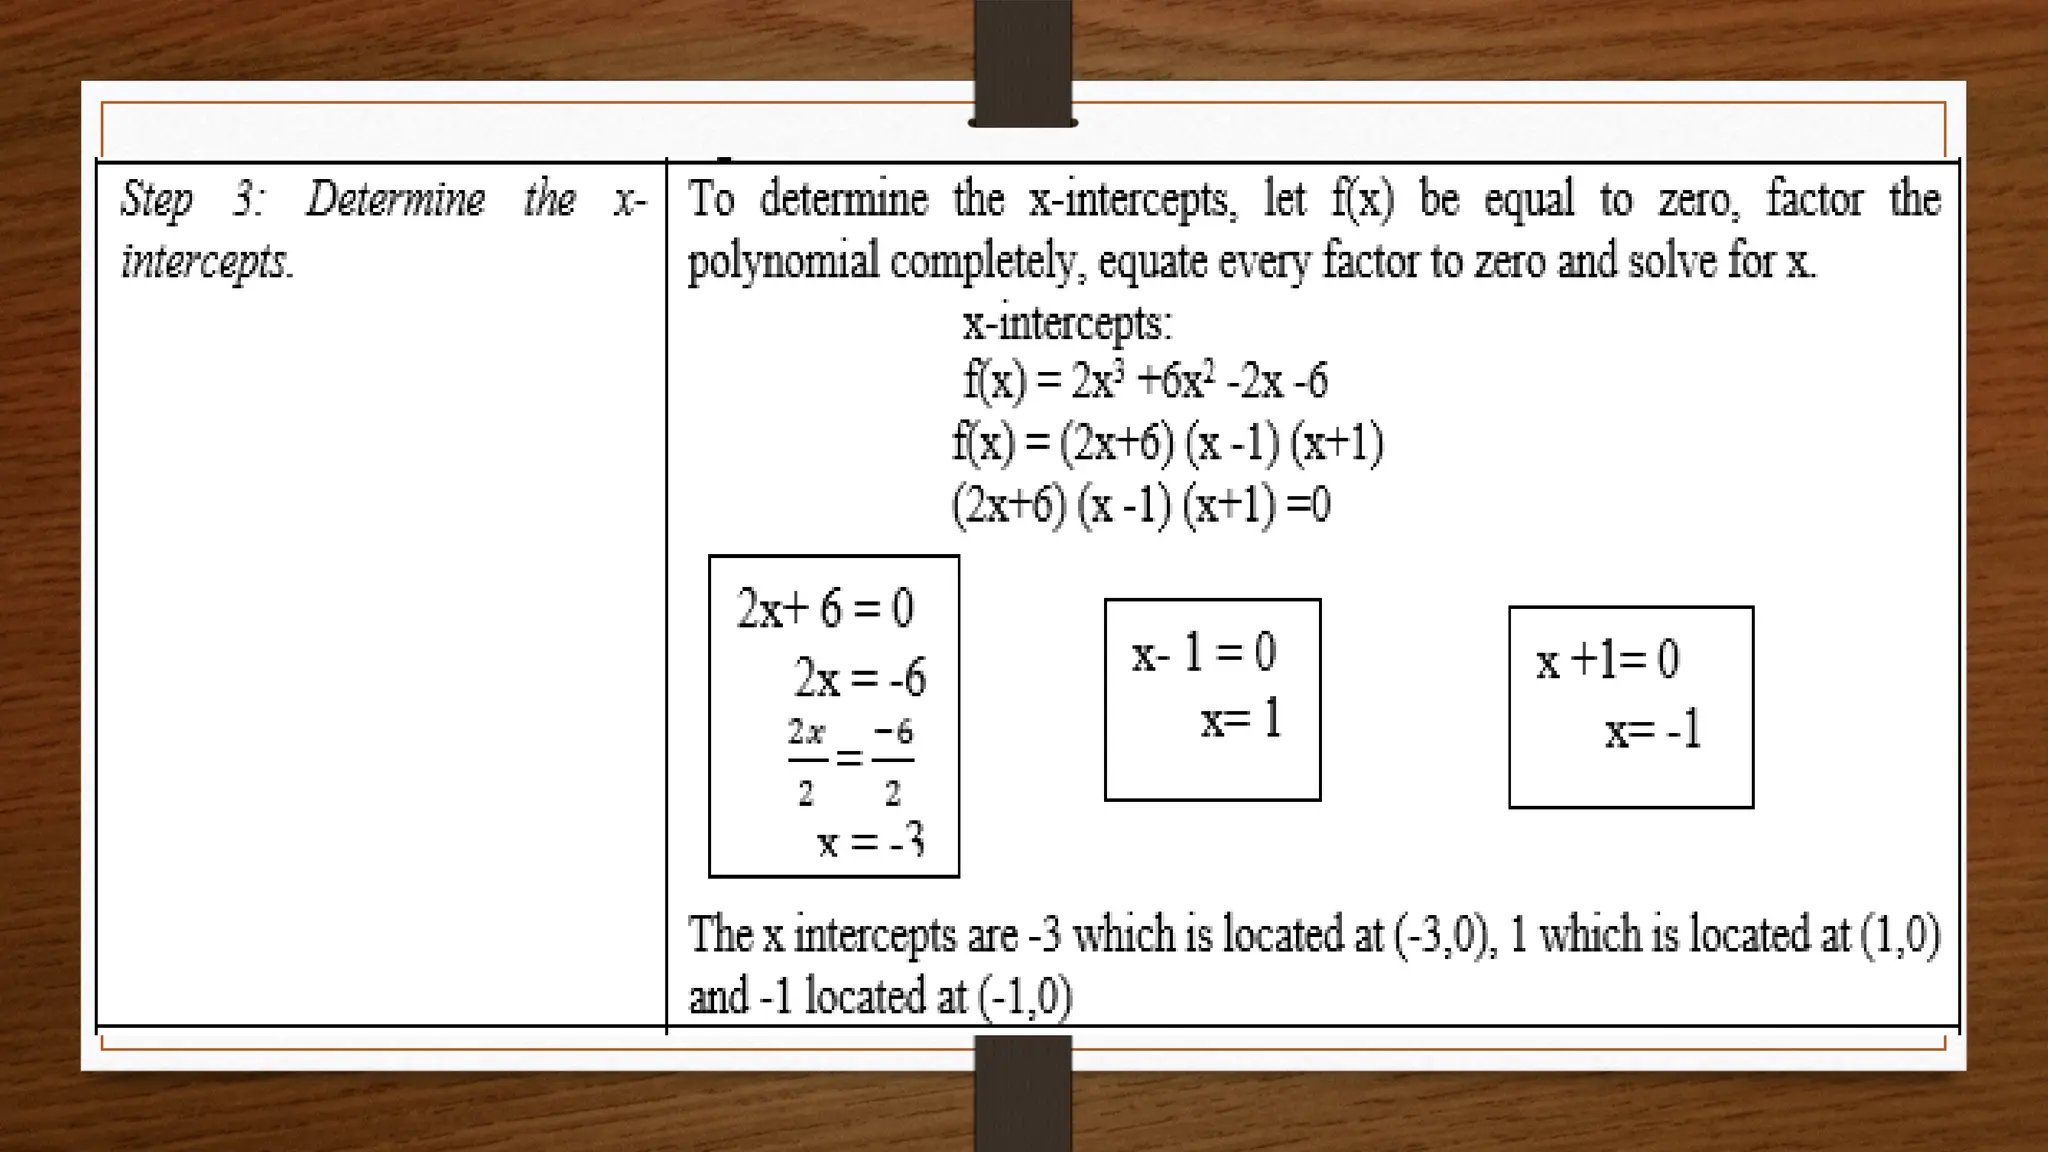
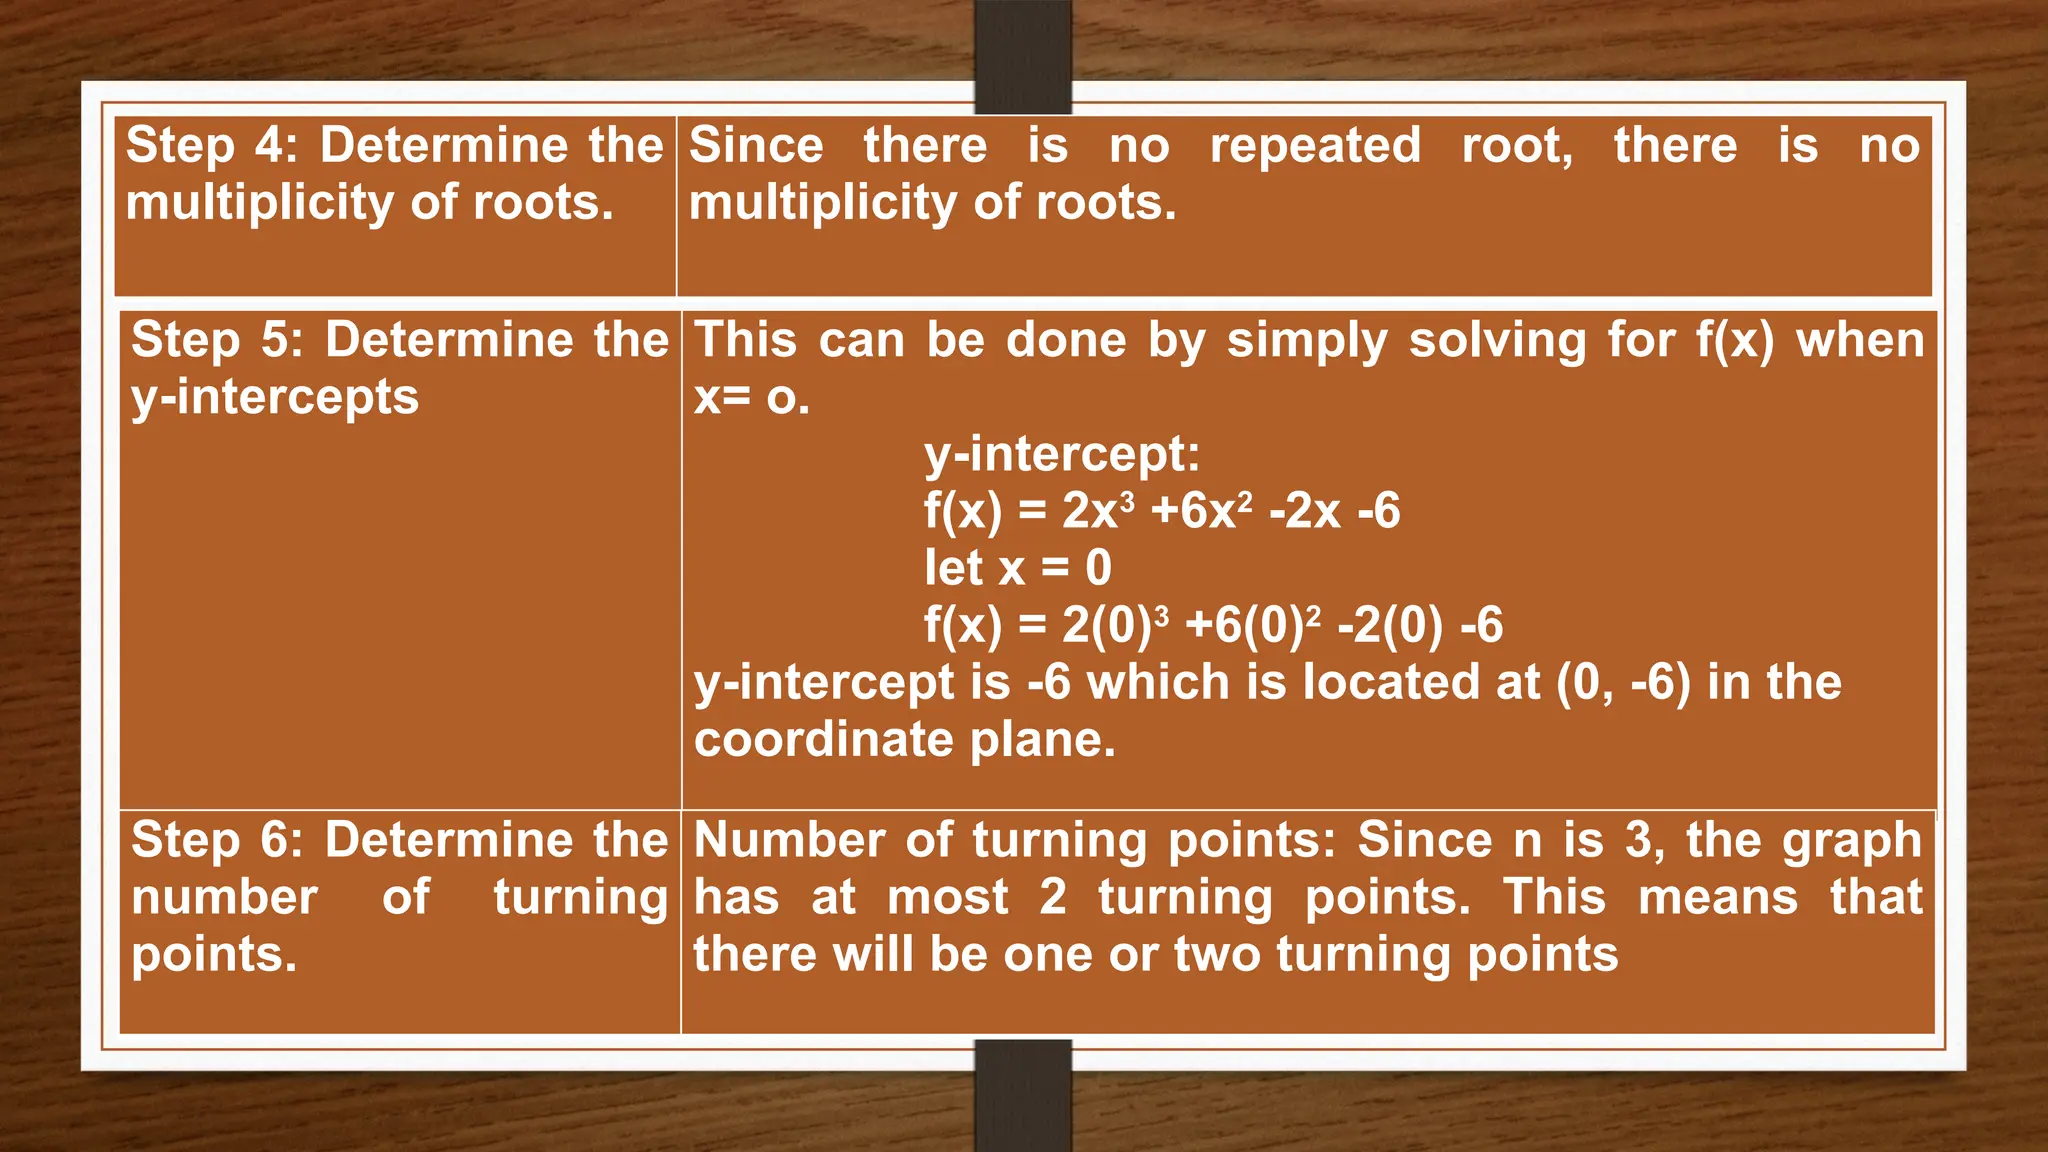
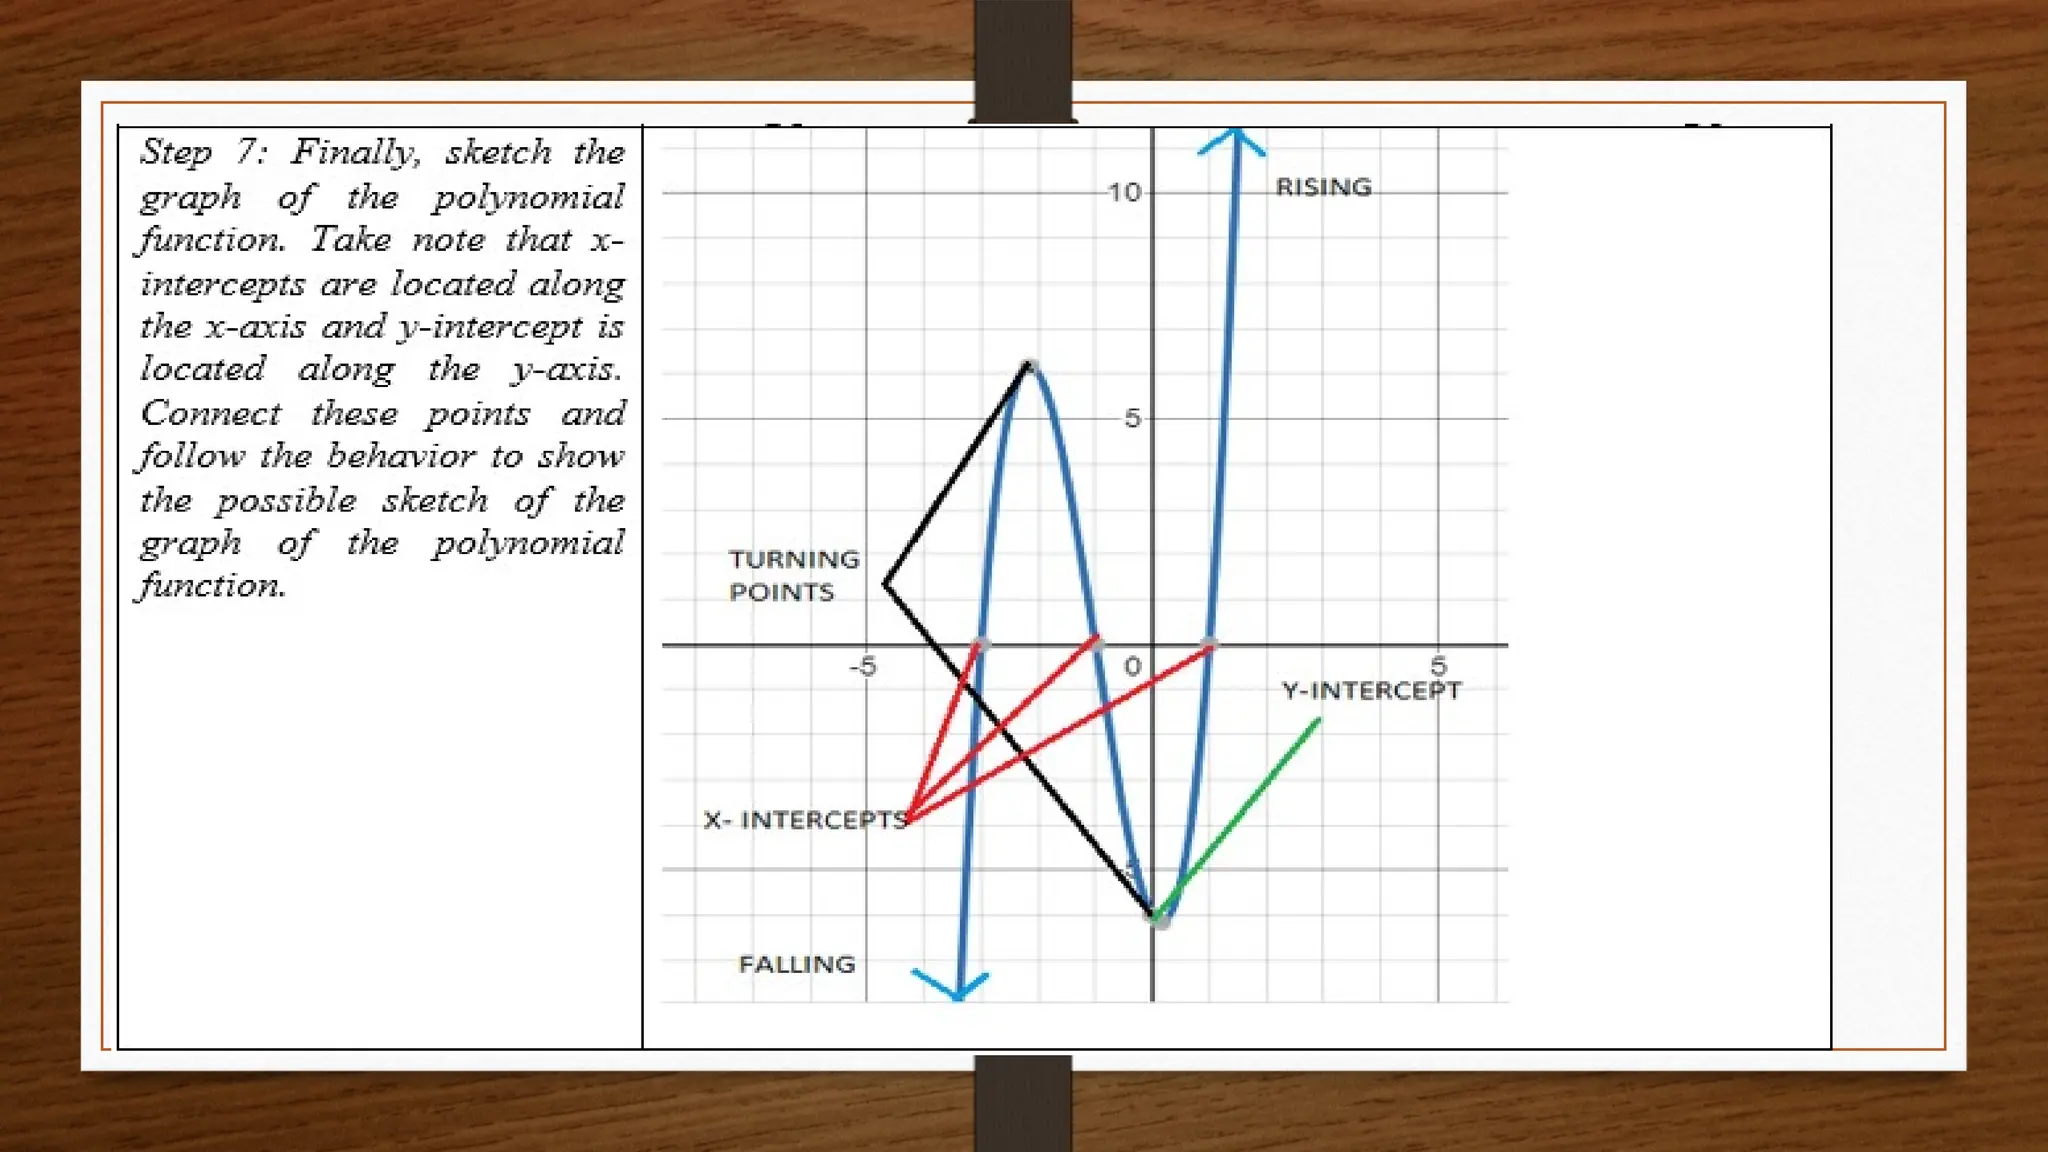
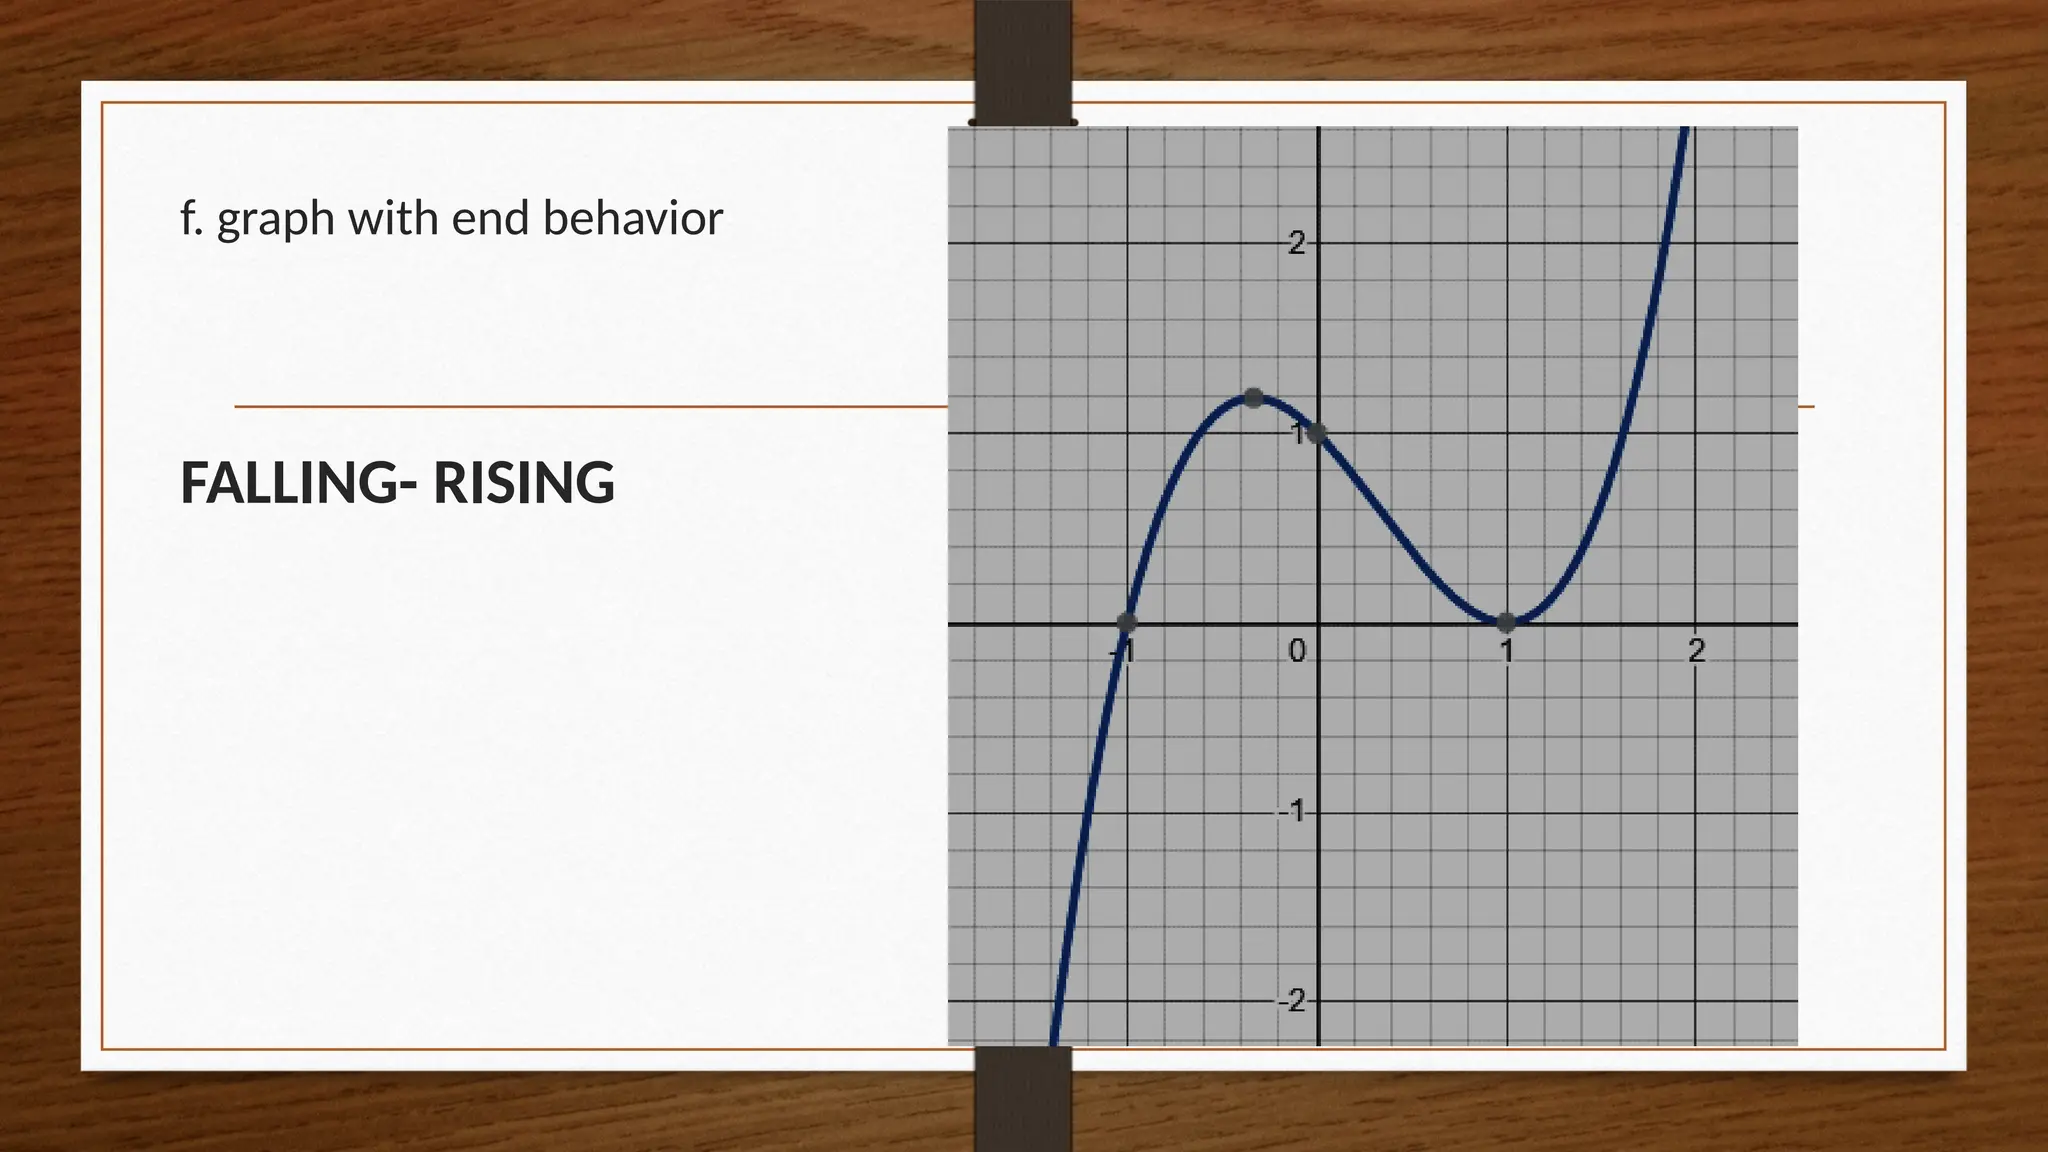
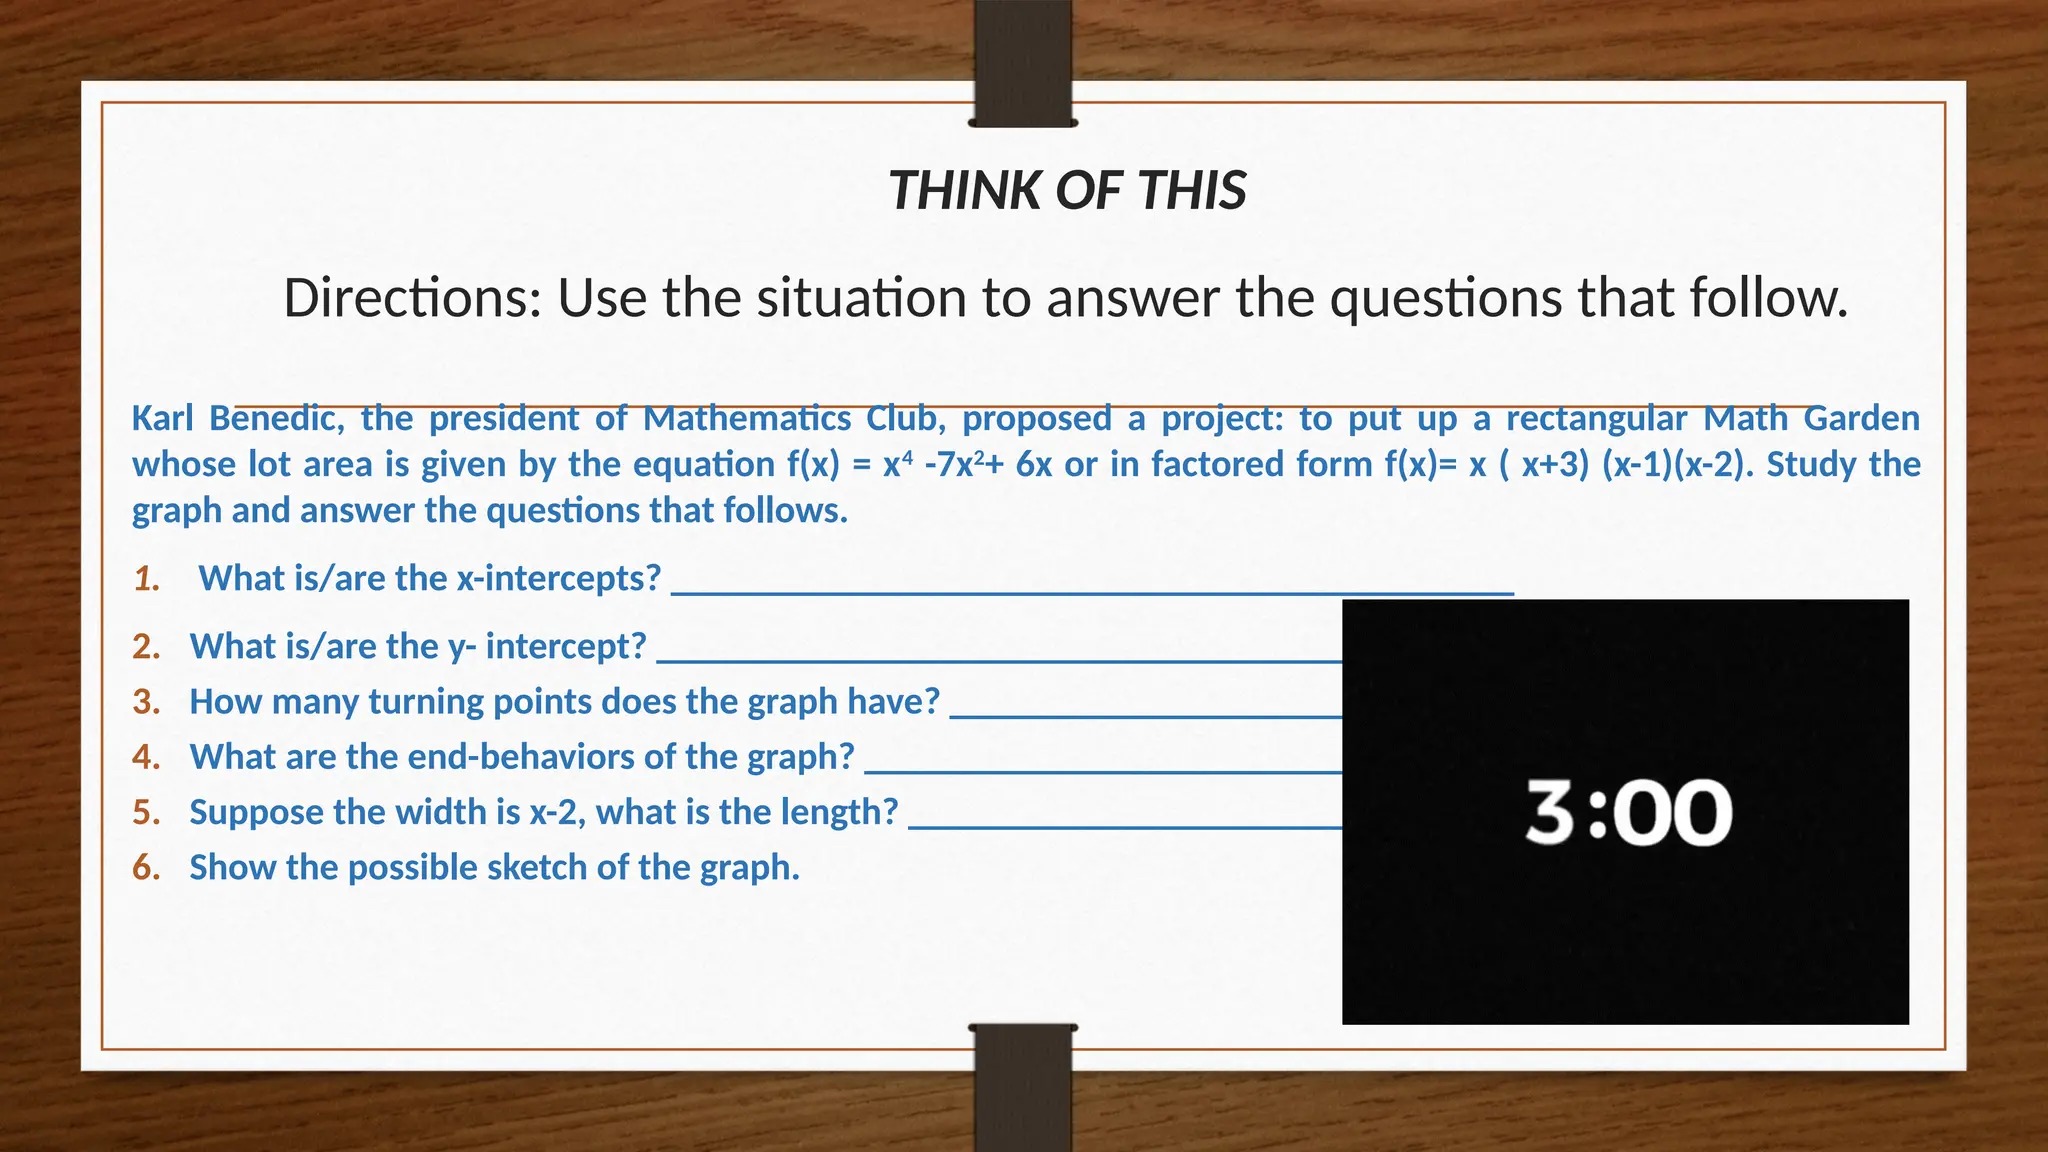
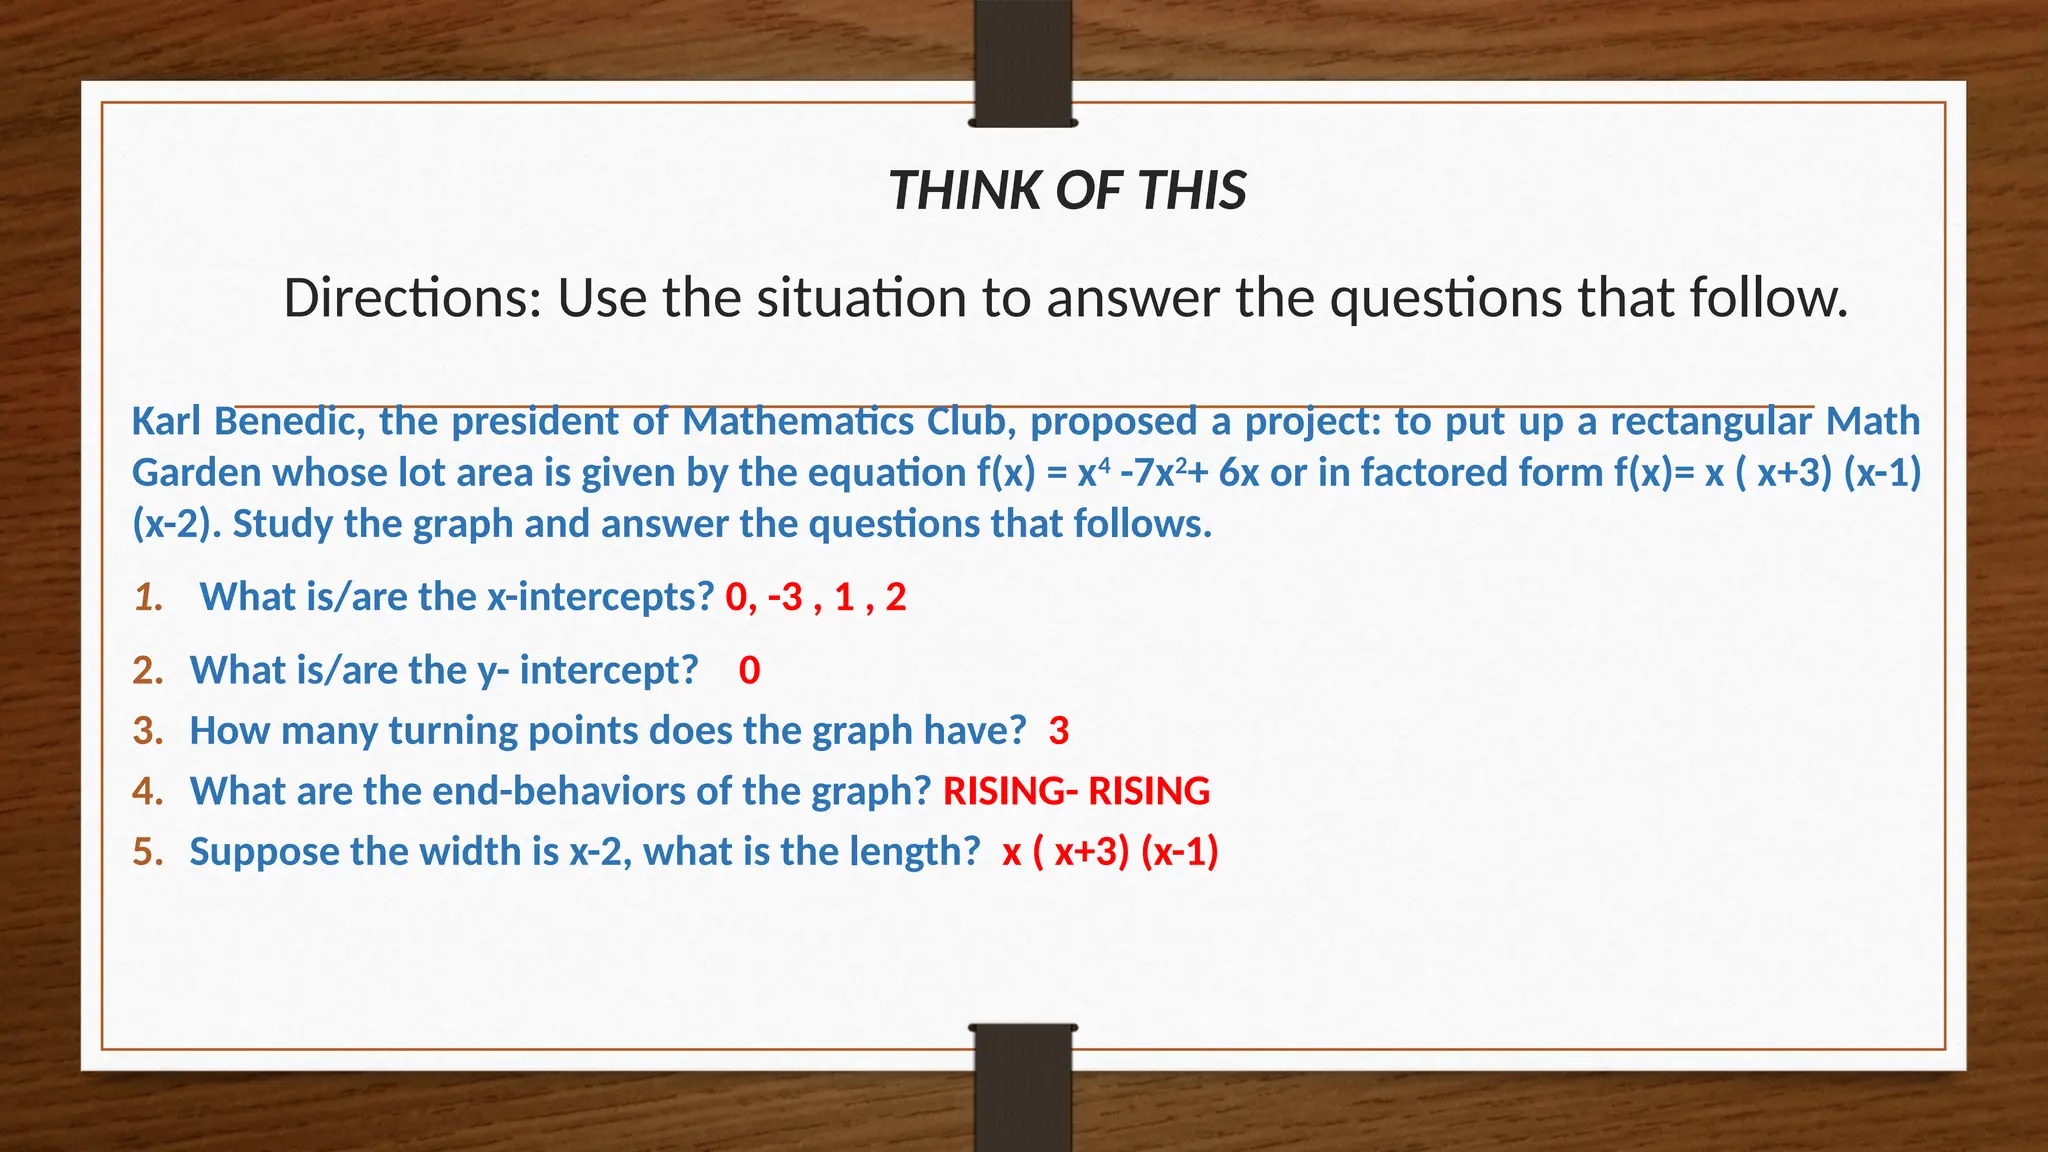
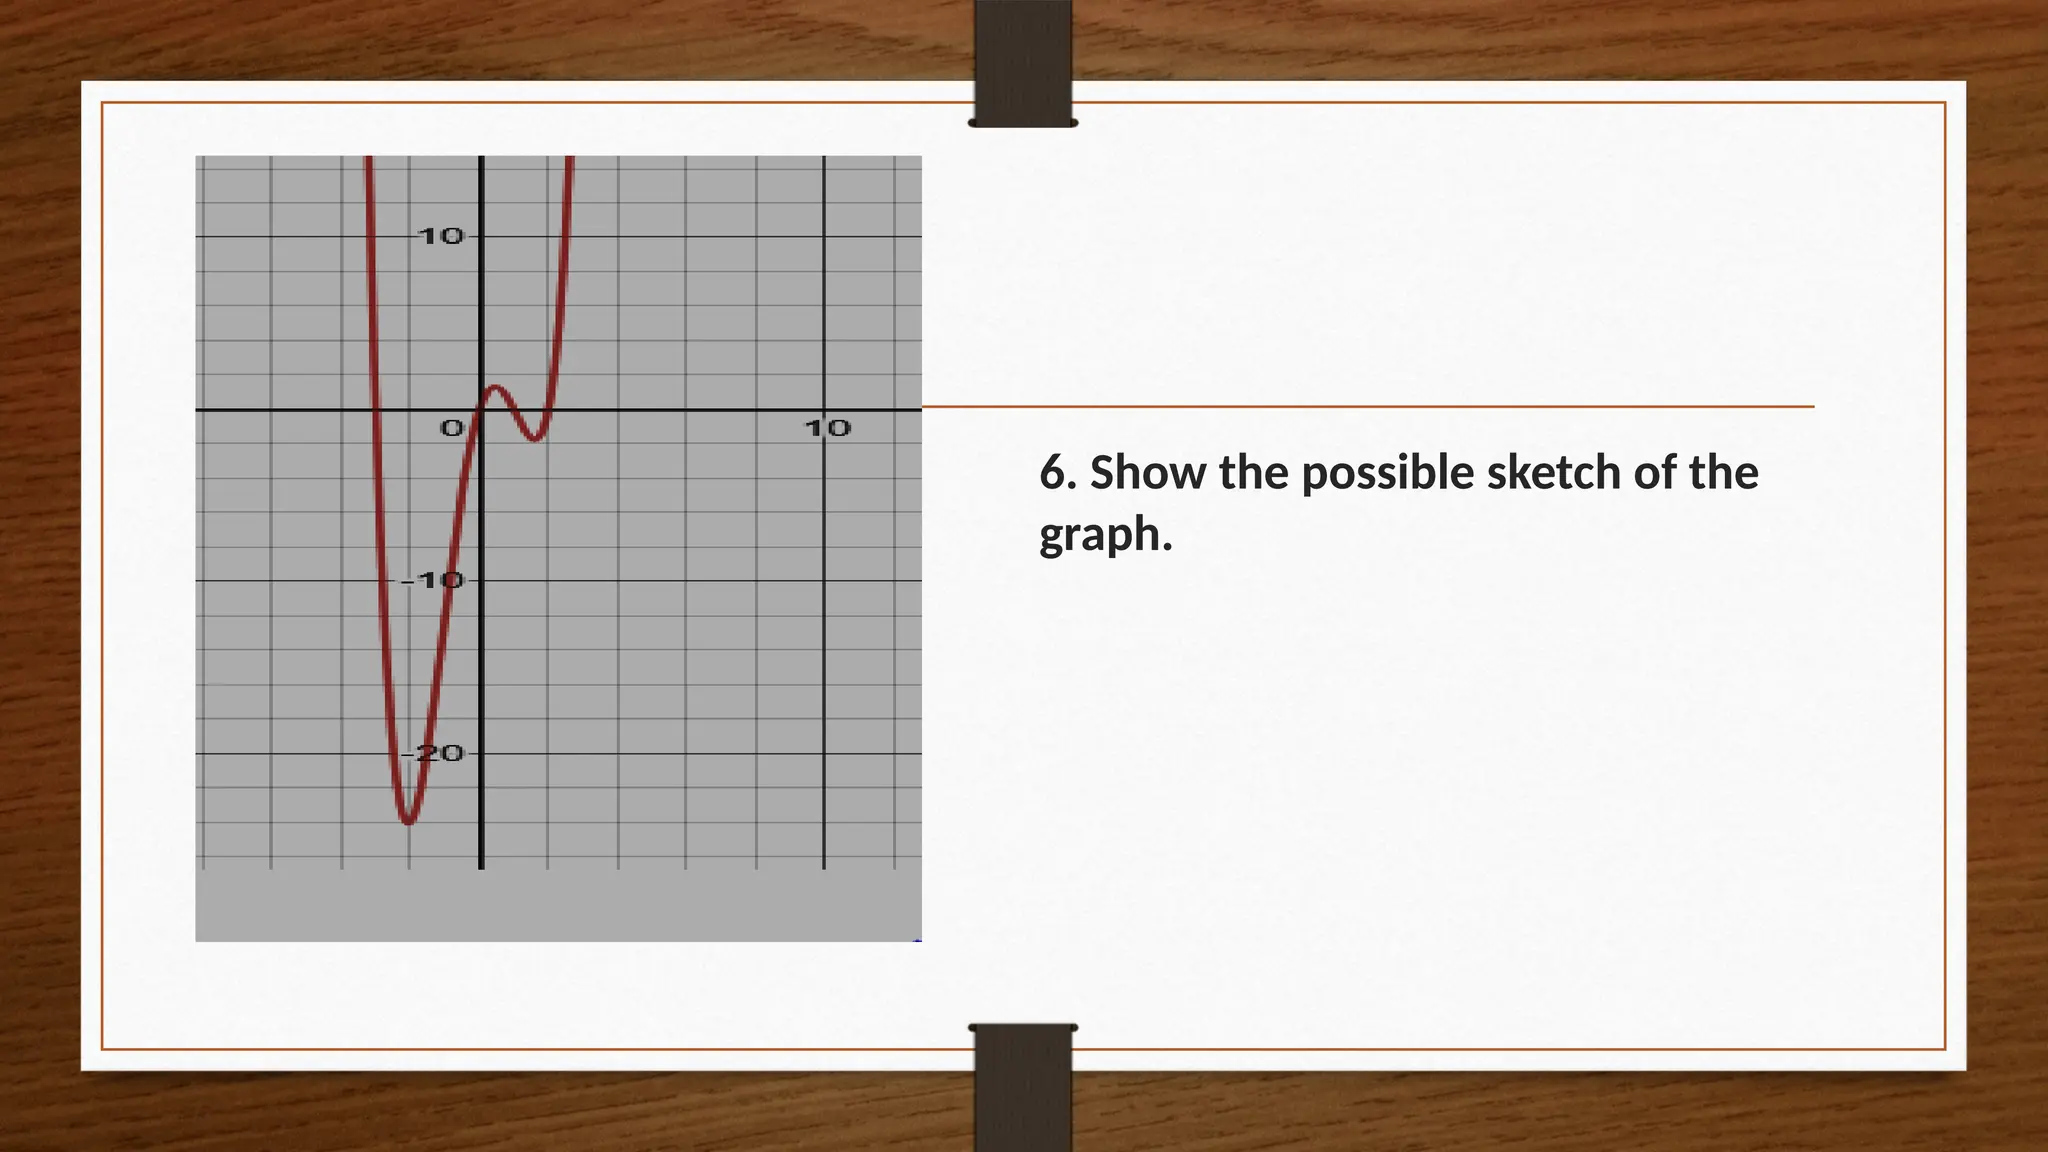
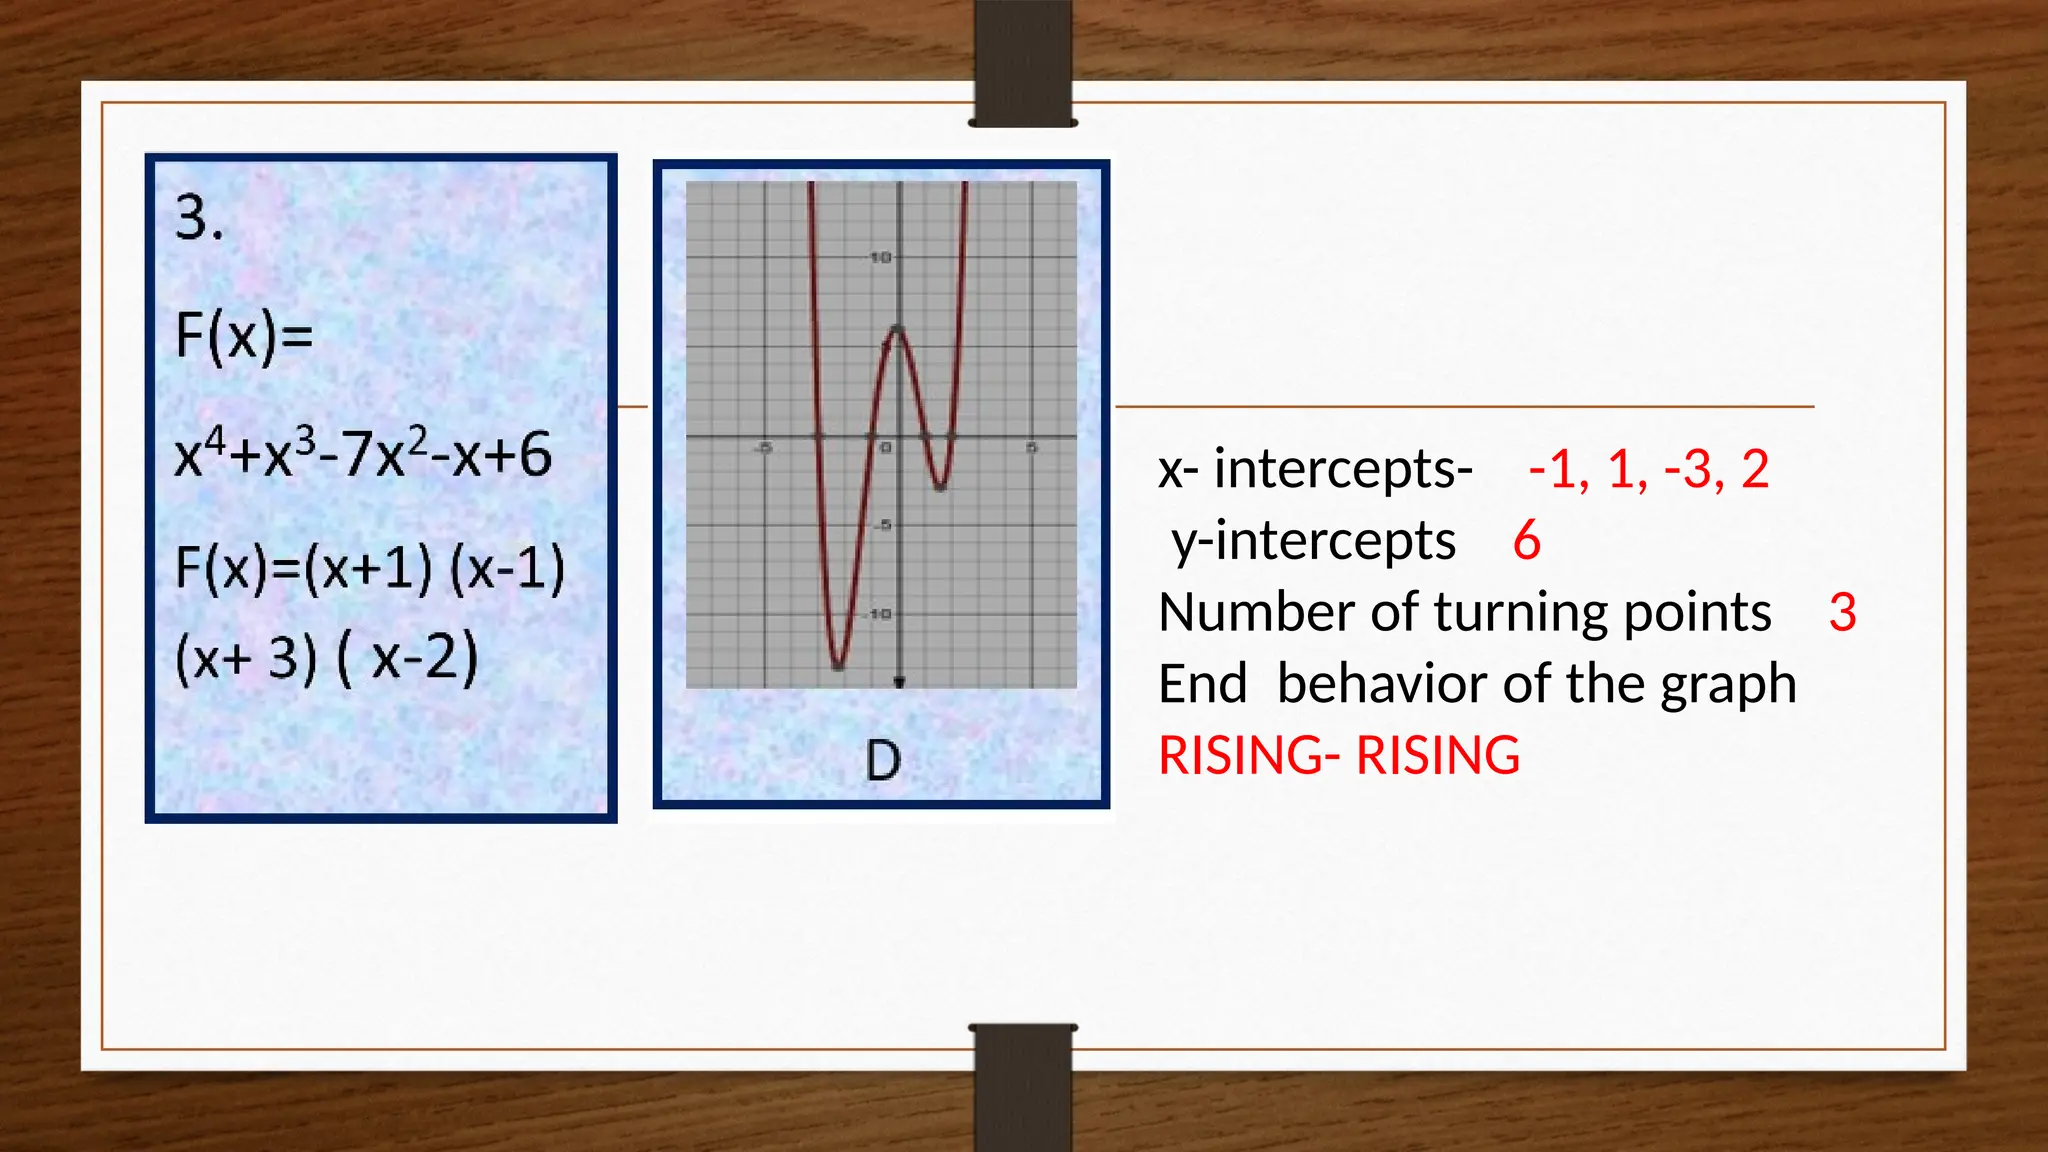
GRAPHS OF POLYNOMIAL
FUNCTIONS
MOST ESSENTIAL LEARNING
COMPETENCY
• Understands, describes, and
interprets graph of polynomial
functions (MELC 13).
LEARNING OBJECTIVES
At the end of the lesson, learners are expected to:
1. Understand the properties of the graph of a polynomial
function.
2. Describes and interprets graph of a polynomial function.
3. Appreciate graphs of polynomial functions as applied in
some real-life situations.
Do you remember when an equation is a polynomial function? What makes an equation not a
polynomial?
An equation is a polynomial function if:
There is no negative exponent in one of the variables
There is no fractional exponent
There is no radical exponent.
It is considered a polynomial function if the exponents of
the variable are all positive integers
TRUE OR FALSE
Directions: Write the word TRUE if the statement is correct and FALSE if it is not.
1. The number of turning points in the graph of a polynomial function is the same
as the degree of a polynomial function.
2. The leading term of the polynomial function in standard form: f(x) = 5x4
- x3
+2x -2 is 5x4
3. The Leading Coefficient Test is used to determine the end behaviors of the
graph of a polynomial function.
4. X-intercepts are points where the graph intersects the x-axis, that is x= 0.
5. If the degree of the polynomial is odd and the leading coefficient is positive, the
graph falls to the left and rises to the right.
FALSE
TRUE
TRUE
TRUE
FALSE
LET’S COMPARE
• Observe and determine the similarities
the figure of an electromagnetic wave and
the graph of a polynomial function.
TRIVIA: Electromagnetic waves or EM waves are waves that are created as a
result of vibrations between an electric field and a magnetic field. In other
words, EM waves are composed of oscillating magnetic and electric fields.
They are also perpendicular to the direction of the EM wave.
EM waves appearance is somehow similar to a graph of polynomial function.
They are both curved form in appearance and both figures have ups and
downs. In the electromagnetic wave this are called the crest and trough and
in polynomial functions these are called turning points.
LET’S INVESTIGATE
Complete the table. This activity will
help you understand how to use the
Leading Coefficient Test to describe
the behavior of the graph
POLYNOMIAL
FUNCTION
LEADING
COEFFICIENT
(+ OR -)
DEGREE
(EVEN 0R
ODD)
GRAPH
BEHAVIOR OF
THE GRAPH
(RISING OR
FALLING)
Relation of the
LC and degree
to the
Behavior of
the Graph
Left
Hand
Right
Hand
f(x) = x2
POLYNOMIAL
FUNCTION
LEADING
COEFFICIENT
(+ OR -)
DEGREE
(EVEN 0R
ODD)
GRAPH
BEHAVIOR OF
THE GRAPH
(RISING OR
FALLING)
Relation of the
LC and degree
to the
Behavior of
the Graph
Left
Hand
Right
Hand
f(x)= -x2
POLYNOMIAL
FUNCTION
LEADING
COEFFICIENT
(+ OR -)
DEGREE
(EVEN 0R
ODD)
GRAPH
BEHAVIOR OF
THE GRAPH
(RISING OR
FALLING)
Relation of the
LC and degree
to the
Behavior of
the Graph
Left
Hand
Right
Hand
f(x) = x3
POLYNOMIAL
FUNCTION
LEADING
COEFFICIENT
(+ OR -)
DEGREE
(EVEN 0R
ODD)
GRAPH
BEHAVIOR OF
THE GRAPH
(RISING OR
FALLING)
Relation of the
LC and degree
to the
Behavior of
the Graph
Left
Hand
Right
Hand
f(x) = -x3
POLYNOMIAL
FUNCTION
LEADING
COEFFICIENT
(+ OR -)
DEGREE
(EVEN 0R
ODD)
GRAPH
BEHAVIOR OF
THE GRAPH
(RISING OR
FALLING)
Relation of the
LC and degree
to the
Behavior of
the Graph
Left
Hand
Right
Hand
f(x) = x2 + even rising rising
If the LC is +
and the degree
is even, then,
the graph of
the polynomial
function rises
to the left and
rises to the
right
POLYNOMIAL
FUNCTION
LEADING
COEFFICIENT
(+ OR -)
DEGREE
(EVEN 0R
ODD)
GRAPH
BEHAVIOR OF
THE GRAPH
(RISING OR
FALLING)
Relation of the
LC and degree
to the
Behavior of
the Graph
Left
Hand
Right
Hand
f(x) = -x2 - even falling falling
If the LC is -
and the degree
is even, then,
the graph of
the polynomial
function falls
to the left and
falls to the
right
POLYNOMIAL
FUNCTION
LEADING
COEFFICIENT
(+ OR -)
DEGREE
(EVEN 0R
ODD)
GRAPH
BEHAVIOR OF
THE GRAPH
(RISING OR
FALLING)
Relation of the
LC and degree
to the
Behavior of
the Graph
Left
Hand
Right
Hand
f(x) = x3 + odd falling rising
If the LC is +
and the degree
is odd, then,
the graph of
the polynomial
function falls
to the left and
rises to the
right
POLYNOMIAL
FUNCTION
LEADING
COEFFICIENT
(+ OR -)
DEGREE
(EVEN 0R
ODD)
GRAPH
BEHAVIOR OF
THE GRAPH
(RISING OR
FALLING)
Relation of the
LC and degree
to the
Behavior of
the Graph
Left
Hand
Right
Hand
f(x) = -x3 - odd rising falling
If the LC is -
and the degree
is odd, then,
the graph of
the polynomial
function rises
to the left and
falls to the
right
Read and study Things to
Remember of the
Supplementary Learning
Material
Things to Remember:
To sketch the graph of a polynomial function we need to
consider the following:
• Leading term- This is the term in the polynomial function with
the highest exponent. It also tells the degree of the function.
• Leading coefficient- This is the numerical coefficient of the
leading term.
End Behavior of the Graph
• Leading Coefficient Test is used to determine the right-hand and the left-hand
behaviors of the graph of a polynomial function.
• The graph of a polynomial function is:
⮚ Rising to the extreme left and rising to the extreme right if the degree n is even and
the leading coefficient an > 0 (positive)
⮚ Falling to the extreme left and rising to the extreme right if the degree n is odd and
the leading coefficient an > 0 (positive)
⮚ Falling to the extreme left and falling to the extreme right if the degree n is even
and the leading coefficient an < 0 (negative)
⮚ Rising to the extreme left and falling to the extreme right if the degree n is odd and
the leading coefficient an < 0(negative)
• X- intercepts-These are the points where the graph intersects the x-axis.
These are the values of x when y =0
• Multiplicity of roots -It is the number of times the same root has been
obtained. If there is an even multiplicity of roots, the graph is tangent to a
point on the x-axis. If there is an odd multiplicity of roots, then the graph
crosses the x-axis.
• Y-intercept- This is the point where the graph intersects the y-axis.
• Number of turning points- these are points where the graph shifts from
decreasing to increasing function value, or vice versa. The number of turning
points is strictly less than the degree of the polynomial. It is at most n-1
number of turning points.
To show and describe the graph let us follow these steps:
f(x) = 2x3
+6x2
-2x -6 or f(x) = (2x+6) (x -1) (x+1).
Step 1: Identify the
leading term and
leading coefficient
of the polynomial
function
Leading Term: 2x3
(the exponent is 3 so n is
odd)
Leading Coefficient: 2 (leading coefficient is
positive so an >0)
Step 2: Determine
the behavior of the
graph.
Behavior of the graph: Since the degree of the
polynomial is 3 and it is odd and the leading
coefficient is greater than 0, using the Leading
Coefficient Test the graph is FALLING to the
extreme left and RISING to the extreme right.
Step 4: Determine the
multiplicity of roots.
Since there is no repeated root, there is no
multiplicity of roots.
Step 5: Determine the
y-intercepts
This can be done by simply solving for f(x) when
x= o.
y-intercept:
f(x) = 2x3
+6x2
-2x -6
let x = 0
f(x) = 2(0)3
+6(0)2
-2(0) -6
y-intercept is -6 which is located at (0, -6) in the
coordinate plane.
Step 6: Determine the
number of turning
points.
Number of turning points: Since n is 3, the graph
has at most 2 turning points. This means that
there will be one or two turning points
DESCRIBE ME!!!
Describe the properties of the graph of the polynomial function F(x) = (x-1)2
(x+1) as to the following:
a. Standard Form
b. Leading Term
c. x-intercepts
d. y-intercepts
e. number of turning points
f. possible graph with end behavior
(Refer to Learning Task 2, Letter B of PIVOT Learners Material for Grade 10,
Quarter 2 page 10)
•
DESCRIBE ME!!!
Describe the properties of the graph of the polynomial function F(x) = (x-1)2
(x+1) as to the following:
a. Standard Form F(x) = x3
- x2
-x +1
b. Leading Term x3
c. x-intercepts 1 with mult. of 2 and -1
d. y-intercepts 1
e. number of turning points 2
f. graph with end behavior
FALLING- RISING
THINK OF THIS
Directions: Use the situation to answer the questions that follow.
Karl Benedic, the president of Mathematics Club, proposed a project: to put up a rectangular Math Garden
whose lot area is given by the equation f(x) = x4
-7x2
+ 6x or in factored form f(x)= x ( x+3) (x-1)(x-2). Study the
graph and answer the questions that follows.
1. What is/are the x-intercepts? ____________________________________________
2. What is/are the y- intercept? ____________________________________________
3. How many turning points does the graph have? _____________________________
4. What are the end-behaviors of the graph? _____________________________
5. Suppose the width is x-2, what is the length? _______________________________
6. Show the possible sketch of the graph.
THINK OF THIS
Directions: Use the situation to answer the questions that follow.
Karl Benedic, the president of Mathematics Club, proposed a project: to put up a rectangular Math
Garden whose lot area is given by the equation f(x) = x4
-7x2
+ 6x or in factored form f(x)= x ( x+3) (x-1)
(x-2). Study the graph and answer the questions that follows.
1. What is/are the x-intercepts? 0, -3 , 1 , 2
2. What is/are the y- intercept? 0
3. How many turning points does the graph have? 3
4. What are the end-behaviors of the graph? RISING- RISING
5. Suppose the width is x-2, what is the length? x ( x+3) (x-1)
6. Show the possible sketch of the
graph.
CARD MATCH
• Directions: Match the card that contains the POLYNOMIAL
FUNCTION to the card that contains its corresponding GRAPH
and determine the properties of the graph such as:
x- intercepts
y-intercepts
Number of turning points
End behavior of the graph
x- intercepts- -2, 1, 3
y-intercepts -6
Number of turning points 2
End behavior of the graph
RISING- FALLING
x- intercepts- -2, -3
y-intercepts 6
Number of turning points 1
End behavior of the graph
RISING- RISING
x- intercepts- -1, 1, -3, 2
y-intercepts 6
Number of turning points 3
End behavior of the graph
RISING- RISING
What I have learned
Answer the following questions based on their understanding
1. How do you determine the intercepts in the graph of a
polynomial function?
2. How do you know the number of turning points of the graph
of a polynomial function?
3. What is the use of the Leading Coefficient Test and how do we
use it?
ASSESSMENT
Directions: Choose the letter of the best answer.
B
C
B
A
C
CLOSURE
3-2-1 Exit Card
List 3 things you learned today.
List 2 things you’d like to learn more about.
List 1 question you have.

G10 Math Q2 Week 1- Graph of Polynomial Functions.pptx

  • 1.
  • 2.
    MOST ESSENTIAL LEARNING COMPETENCY •Understands, describes, and interprets graph of polynomial functions (MELC 13).
  • 3.
    LEARNING OBJECTIVES At theend of the lesson, learners are expected to: 1. Understand the properties of the graph of a polynomial function. 2. Describes and interprets graph of a polynomial function. 3. Appreciate graphs of polynomial functions as applied in some real-life situations.
  • 4.
    Do you rememberwhen an equation is a polynomial function? What makes an equation not a polynomial? An equation is a polynomial function if: There is no negative exponent in one of the variables There is no fractional exponent There is no radical exponent. It is considered a polynomial function if the exponents of the variable are all positive integers
  • 5.
    TRUE OR FALSE Directions:Write the word TRUE if the statement is correct and FALSE if it is not. 1. The number of turning points in the graph of a polynomial function is the same as the degree of a polynomial function. 2. The leading term of the polynomial function in standard form: f(x) = 5x4 - x3 +2x -2 is 5x4 3. The Leading Coefficient Test is used to determine the end behaviors of the graph of a polynomial function. 4. X-intercepts are points where the graph intersects the x-axis, that is x= 0. 5. If the degree of the polynomial is odd and the leading coefficient is positive, the graph falls to the left and rises to the right.
  • 6.
    TRUE OR FALSE Directions:Write the word TRUE if the statement is correct and FALSE if it is not. 1. The number of turning points in the graph of a polynomial function is the same as the degree of a polynomial function. 2. The leading term of the polynomial function in standard form: f(x) = 5x4 - x3 +2x -2 is 5x4 3. The Leading Coefficient Test is used to determine the end behaviors of the graph of a polynomial function. 4. X-intercepts are points where the graph intersects the x-axis, that is x= 0. 5. If the degree of the polynomial is odd and the leading coefficient is positive, the graph falls to the left and rises to the right. FALSE TRUE TRUE TRUE FALSE
  • 7.
    LET’S COMPARE • Observeand determine the similarities the figure of an electromagnetic wave and the graph of a polynomial function.
  • 8.
    TRIVIA: Electromagnetic wavesor EM waves are waves that are created as a result of vibrations between an electric field and a magnetic field. In other words, EM waves are composed of oscillating magnetic and electric fields. They are also perpendicular to the direction of the EM wave. EM waves appearance is somehow similar to a graph of polynomial function. They are both curved form in appearance and both figures have ups and downs. In the electromagnetic wave this are called the crest and trough and in polynomial functions these are called turning points.
  • 9.
    LET’S INVESTIGATE Complete thetable. This activity will help you understand how to use the Leading Coefficient Test to describe the behavior of the graph
  • 10.
    POLYNOMIAL FUNCTION LEADING COEFFICIENT (+ OR -) DEGREE (EVEN0R ODD) GRAPH BEHAVIOR OF THE GRAPH (RISING OR FALLING) Relation of the LC and degree to the Behavior of the Graph Left Hand Right Hand f(x) = x2
  • 11.
    POLYNOMIAL FUNCTION LEADING COEFFICIENT (+ OR -) DEGREE (EVEN0R ODD) GRAPH BEHAVIOR OF THE GRAPH (RISING OR FALLING) Relation of the LC and degree to the Behavior of the Graph Left Hand Right Hand f(x)= -x2
  • 12.
    POLYNOMIAL FUNCTION LEADING COEFFICIENT (+ OR -) DEGREE (EVEN0R ODD) GRAPH BEHAVIOR OF THE GRAPH (RISING OR FALLING) Relation of the LC and degree to the Behavior of the Graph Left Hand Right Hand f(x) = x3
  • 13.
    POLYNOMIAL FUNCTION LEADING COEFFICIENT (+ OR -) DEGREE (EVEN0R ODD) GRAPH BEHAVIOR OF THE GRAPH (RISING OR FALLING) Relation of the LC and degree to the Behavior of the Graph Left Hand Right Hand f(x) = -x3
  • 14.
    POLYNOMIAL FUNCTION LEADING COEFFICIENT (+ OR -) DEGREE (EVEN0R ODD) GRAPH BEHAVIOR OF THE GRAPH (RISING OR FALLING) Relation of the LC and degree to the Behavior of the Graph Left Hand Right Hand f(x) = x2 + even rising rising If the LC is + and the degree is even, then, the graph of the polynomial function rises to the left and rises to the right
  • 15.
    POLYNOMIAL FUNCTION LEADING COEFFICIENT (+ OR -) DEGREE (EVEN0R ODD) GRAPH BEHAVIOR OF THE GRAPH (RISING OR FALLING) Relation of the LC and degree to the Behavior of the Graph Left Hand Right Hand f(x) = -x2 - even falling falling If the LC is - and the degree is even, then, the graph of the polynomial function falls to the left and falls to the right
  • 16.
    POLYNOMIAL FUNCTION LEADING COEFFICIENT (+ OR -) DEGREE (EVEN0R ODD) GRAPH BEHAVIOR OF THE GRAPH (RISING OR FALLING) Relation of the LC and degree to the Behavior of the Graph Left Hand Right Hand f(x) = x3 + odd falling rising If the LC is + and the degree is odd, then, the graph of the polynomial function falls to the left and rises to the right
  • 17.
    POLYNOMIAL FUNCTION LEADING COEFFICIENT (+ OR -) DEGREE (EVEN0R ODD) GRAPH BEHAVIOR OF THE GRAPH (RISING OR FALLING) Relation of the LC and degree to the Behavior of the Graph Left Hand Right Hand f(x) = -x3 - odd rising falling If the LC is - and the degree is odd, then, the graph of the polynomial function rises to the left and falls to the right
  • 18.
    Read and studyThings to Remember of the Supplementary Learning Material
  • 19.
    Things to Remember: Tosketch the graph of a polynomial function we need to consider the following: • Leading term- This is the term in the polynomial function with the highest exponent. It also tells the degree of the function. • Leading coefficient- This is the numerical coefficient of the leading term.
  • 20.
    End Behavior ofthe Graph • Leading Coefficient Test is used to determine the right-hand and the left-hand behaviors of the graph of a polynomial function. • The graph of a polynomial function is: ⮚ Rising to the extreme left and rising to the extreme right if the degree n is even and the leading coefficient an > 0 (positive) ⮚ Falling to the extreme left and rising to the extreme right if the degree n is odd and the leading coefficient an > 0 (positive) ⮚ Falling to the extreme left and falling to the extreme right if the degree n is even and the leading coefficient an < 0 (negative) ⮚ Rising to the extreme left and falling to the extreme right if the degree n is odd and the leading coefficient an < 0(negative)
  • 21.
    • X- intercepts-Theseare the points where the graph intersects the x-axis. These are the values of x when y =0 • Multiplicity of roots -It is the number of times the same root has been obtained. If there is an even multiplicity of roots, the graph is tangent to a point on the x-axis. If there is an odd multiplicity of roots, then the graph crosses the x-axis. • Y-intercept- This is the point where the graph intersects the y-axis. • Number of turning points- these are points where the graph shifts from decreasing to increasing function value, or vice versa. The number of turning points is strictly less than the degree of the polynomial. It is at most n-1 number of turning points.
  • 22.
    To show anddescribe the graph let us follow these steps: f(x) = 2x3 +6x2 -2x -6 or f(x) = (2x+6) (x -1) (x+1). Step 1: Identify the leading term and leading coefficient of the polynomial function Leading Term: 2x3 (the exponent is 3 so n is odd) Leading Coefficient: 2 (leading coefficient is positive so an >0) Step 2: Determine the behavior of the graph. Behavior of the graph: Since the degree of the polynomial is 3 and it is odd and the leading coefficient is greater than 0, using the Leading Coefficient Test the graph is FALLING to the extreme left and RISING to the extreme right.
  • 24.
    Step 4: Determinethe multiplicity of roots. Since there is no repeated root, there is no multiplicity of roots. Step 5: Determine the y-intercepts This can be done by simply solving for f(x) when x= o. y-intercept: f(x) = 2x3 +6x2 -2x -6 let x = 0 f(x) = 2(0)3 +6(0)2 -2(0) -6 y-intercept is -6 which is located at (0, -6) in the coordinate plane. Step 6: Determine the number of turning points. Number of turning points: Since n is 3, the graph has at most 2 turning points. This means that there will be one or two turning points
  • 26.
    DESCRIBE ME!!! Describe theproperties of the graph of the polynomial function F(x) = (x-1)2 (x+1) as to the following: a. Standard Form b. Leading Term c. x-intercepts d. y-intercepts e. number of turning points f. possible graph with end behavior (Refer to Learning Task 2, Letter B of PIVOT Learners Material for Grade 10, Quarter 2 page 10) •
  • 27.
    DESCRIBE ME!!! Describe theproperties of the graph of the polynomial function F(x) = (x-1)2 (x+1) as to the following: a. Standard Form F(x) = x3 - x2 -x +1 b. Leading Term x3 c. x-intercepts 1 with mult. of 2 and -1 d. y-intercepts 1 e. number of turning points 2
  • 28.
    f. graph withend behavior FALLING- RISING
  • 29.
    THINK OF THIS Directions:Use the situation to answer the questions that follow. Karl Benedic, the president of Mathematics Club, proposed a project: to put up a rectangular Math Garden whose lot area is given by the equation f(x) = x4 -7x2 + 6x or in factored form f(x)= x ( x+3) (x-1)(x-2). Study the graph and answer the questions that follows. 1. What is/are the x-intercepts? ____________________________________________ 2. What is/are the y- intercept? ____________________________________________ 3. How many turning points does the graph have? _____________________________ 4. What are the end-behaviors of the graph? _____________________________ 5. Suppose the width is x-2, what is the length? _______________________________ 6. Show the possible sketch of the graph.
  • 30.
    THINK OF THIS Directions:Use the situation to answer the questions that follow. Karl Benedic, the president of Mathematics Club, proposed a project: to put up a rectangular Math Garden whose lot area is given by the equation f(x) = x4 -7x2 + 6x or in factored form f(x)= x ( x+3) (x-1) (x-2). Study the graph and answer the questions that follows. 1. What is/are the x-intercepts? 0, -3 , 1 , 2 2. What is/are the y- intercept? 0 3. How many turning points does the graph have? 3 4. What are the end-behaviors of the graph? RISING- RISING 5. Suppose the width is x-2, what is the length? x ( x+3) (x-1)
  • 31.
    6. Show thepossible sketch of the graph.
  • 32.
    CARD MATCH • Directions:Match the card that contains the POLYNOMIAL FUNCTION to the card that contains its corresponding GRAPH and determine the properties of the graph such as: x- intercepts y-intercepts Number of turning points End behavior of the graph
  • 34.
    x- intercepts- -2,1, 3 y-intercepts -6 Number of turning points 2 End behavior of the graph RISING- FALLING
  • 35.
    x- intercepts- -2,-3 y-intercepts 6 Number of turning points 1 End behavior of the graph RISING- RISING
  • 36.
    x- intercepts- -1,1, -3, 2 y-intercepts 6 Number of turning points 3 End behavior of the graph RISING- RISING
  • 37.
    What I havelearned Answer the following questions based on their understanding 1. How do you determine the intercepts in the graph of a polynomial function? 2. How do you know the number of turning points of the graph of a polynomial function? 3. What is the use of the Leading Coefficient Test and how do we use it?
  • 38.
    ASSESSMENT Directions: Choose theletter of the best answer. B C B A C
  • 39.
    CLOSURE 3-2-1 Exit Card List3 things you learned today. List 2 things you’d like to learn more about. List 1 question you have.