Downloaded 105 times
![Experiment No.7 Date:
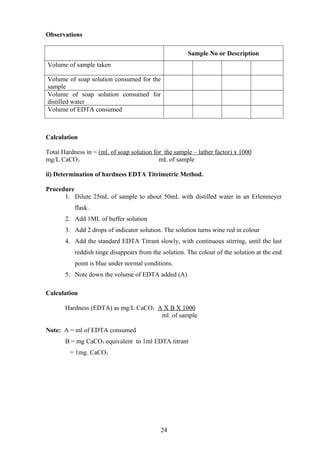
DETERMINATION OF CHLORIDES
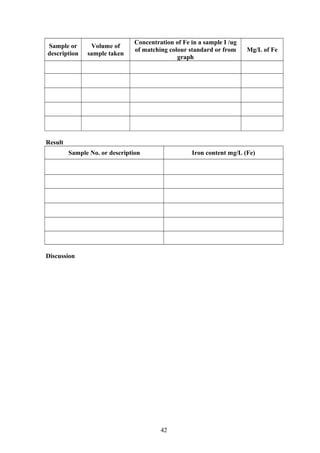
Aim
The aim of the experiment is to determine the amount of chlorides present in the
given sample (s) by Argentomeric method
Principle
In nature or slightly alkaline solution, potassium chromate can indicate the end
point of the silver nitrate titration of chloride. Silver chloride is quantitatively precipitated
before red silver chromate is formed.
Apparatus
1. Burette
2. Pipette
3. Erlenmeyer flask
Reagents
1. Chloride – free distilled water
2. Potassium chromate indicator (xiii)
3. Standard silver nitrate titrant (0.0141 N) (xiv)
4. Standard sodium chloride (0.0141 N) ( xv)
Procedure
1. Take 100 mL sample in an Erlenmeyer flask.
2. If the sample is highly coloured, add 3mL [AL (OH)3], suspension mix, allow
to settle, filter, wash and combine filtrate and washing.
3. Titrate samples in the pH range 7-10 directly. Adjust the samples not in this
range with sulphuric acid or sodium hydroxide solution.
4. Add 1 mL potassium chromate indicator solution.
5. Titrate with standard silver nitrate titrant to a pinkish yellow end point.
6. Note down the volume of silver nitrate titrant added (A)
7. Take 100 mL distilled water in another Erlenmeyer flask and repeat the
procedure outlined in step 3 to 5 above.
8. Note down the volume of silver nitrate titrant added (B)
26](https://image.slidesharecdn.com/eeexperiments-140806050258-phpapp01/85/E-e-experiments-26-320.jpg)
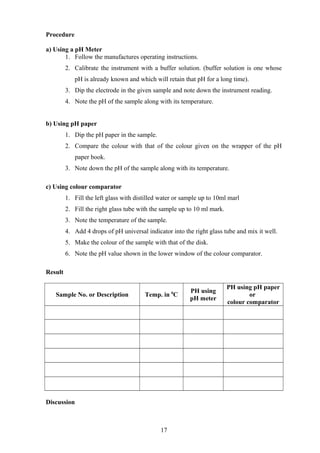
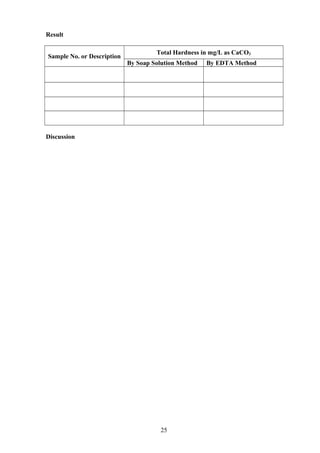
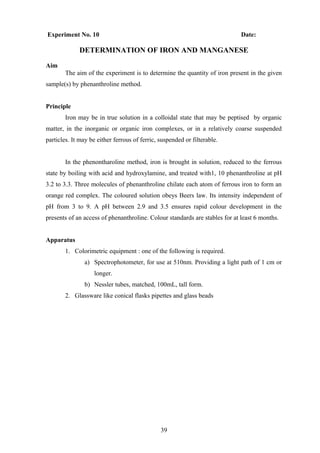
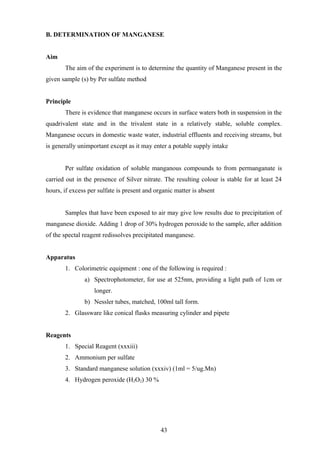
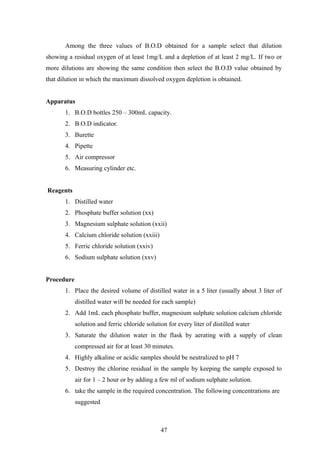
![Note : Blank titration is necessary to take care of
i) The oxidizing or reducing reagent impurities
ii) The iodine bound to starch at the end point.
Calculations
Mg/ml Cl = [(A-B1) or (A+B2)] x N x 35.45 =
Ml of Bleaching Powder solution taken
N = Normality of sodium thiosulphate solution = 0.025
000 mL of Bleaching Powder solution contains
= 1000 x ______ mg. of chlorine
=
i.e. 1000mg of Bleaching Powder contains ______ mg of chlorine
100 mg of Bleaching Powder contains _______ mg of chlorine.
Percentage of chlorine available in Bleaching Powder
= _______ (x)
30](https://image.slidesharecdn.com/eeexperiments-140806050258-phpapp01/85/E-e-experiments-30-320.jpg)
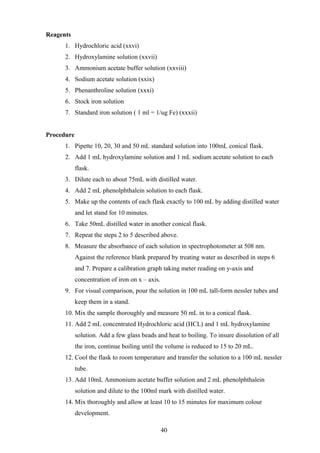
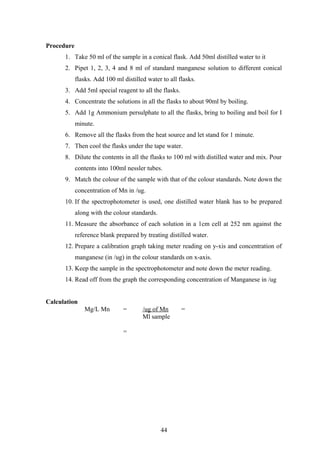
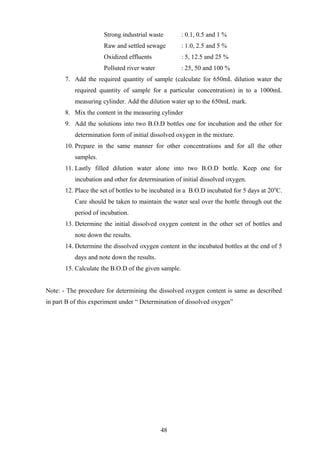

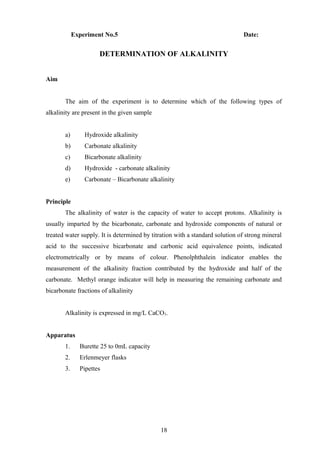
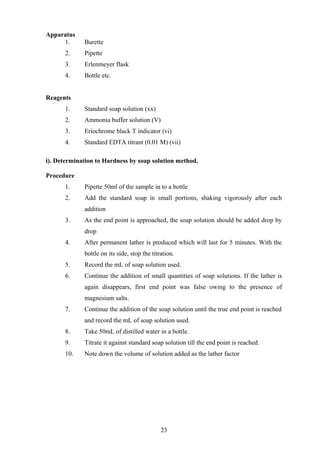
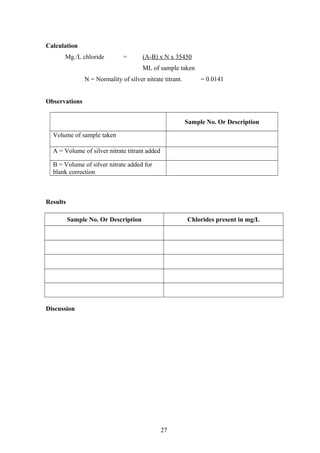
![xxviii) Ammonium Acetate Buffer Solution
Dissolve 250g ammonium acetate in 150 ml distilled water. Add 700ml
concentrated acetic acid. Prepare a new reference standard with each buffer
preparation.
xxix) Sodium Acetate Solution
Dissolve 200g sodium acetate in 800ml distilled water.
xxx) Phenanthroline Solution
Dissolve 100mg 1,10- Phenanthroline monohydrate C12H8N2.H2O, in 100ml
distilled water by stirring and heating to 800
C. Do not boil, discard the solution if it
darkens. Heating is unnecessary if two drops of concentrated HCL are added to the
distilled water.
xxxi) Stock Iron Solution
Add slowly 20 lm concentrated H2 SO4 to 50 ml distilled water and dissolve 1.404g
Ferrous Ammonium sulphate [Fe(NH4 )26H2]. Add 0.1Pottassium permanganate
drop wise until faint pink colour persists. Dilute to 1000ml with iron free distilled
water and mix. Each 1 ml = 200/ug Fe.
xxxii) Standard Iron Solution
Pipette 5ml stock solution into 1liter volumetric flask and dilute to the mark with
iron free distilled water. 1ml = 1/ug Fe
xxxiii) Special Reagent
Dissolve 75g mercuric sulphate, (HgSO4) in 400 ml concentrated (HnO3) nitric
acid and 200ml distilled water. Add 200 ml 85% Phosphoric acid (H3PO4) and 35mg
silver nitrate. Dilute the cooled solution to 1 liter.
xxxiv) Standard Manganese Solution
Prepare a 0.1NKMnO4 (Potassium permanganate) solution by dissolving 3.2g of
KMnO4 in distilled water and making up to 1 liter. Age for several weeks in sunlight or
62](https://image.slidesharecdn.com/eeexperiments-140806050258-phpapp01/85/E-e-experiments-61-320.jpg)
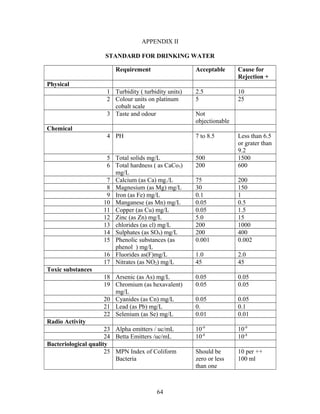
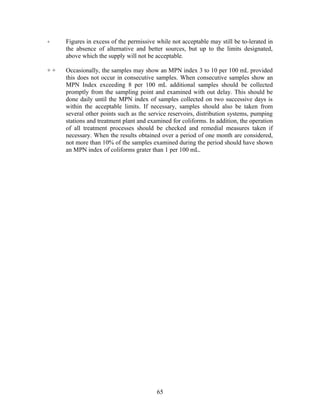
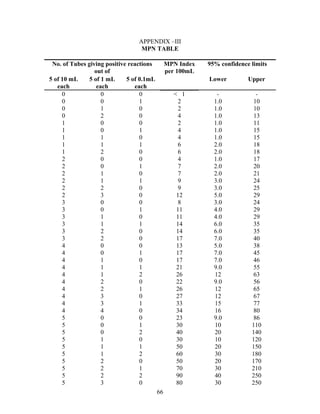
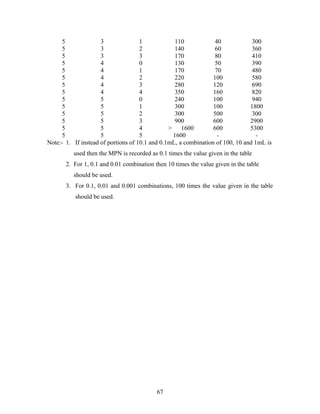


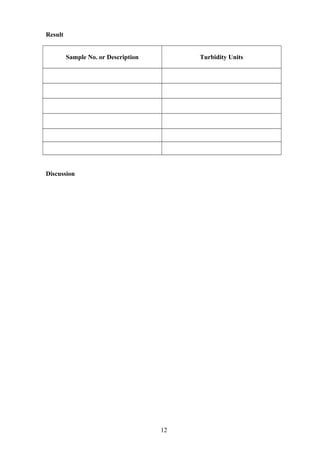
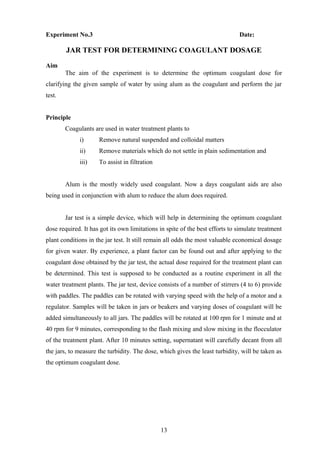
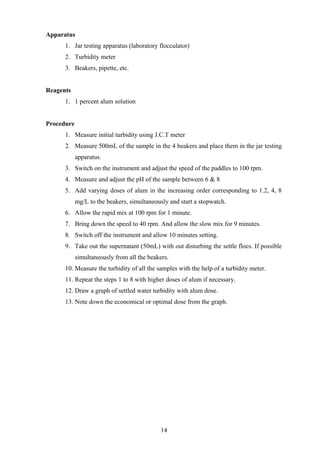
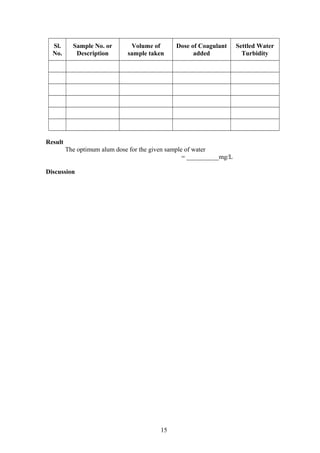
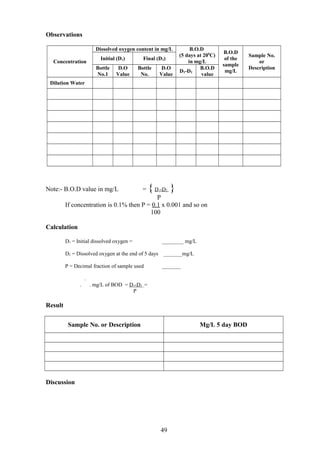
The document provides instructions for performing several water quality tests to determine various characteristics including total solids, turbidity, coagulant dosage, pH, alkalinity, hardness, chlorides, sulfates, iron, manganese, biochemical oxygen demand, and coliforms. The jar test procedure is described to determine the optimal coagulant dose (alum) for clarifying a water sample by measuring turbidity at different coagulant dosages and identifying the lowest turbidity dose.