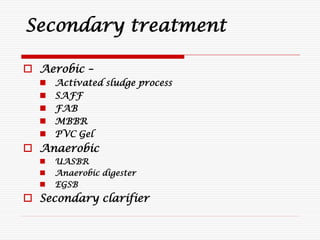
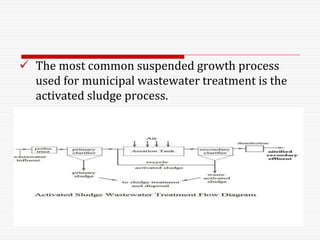
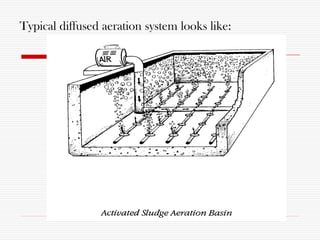
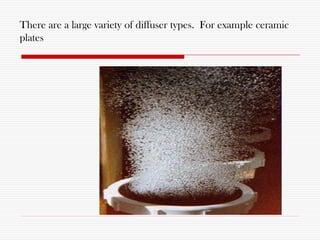
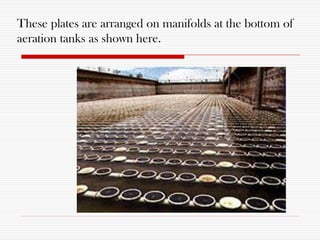
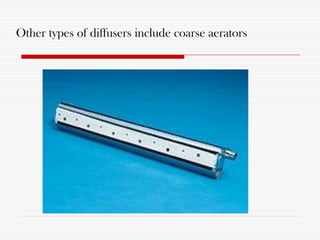
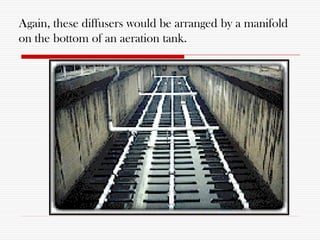
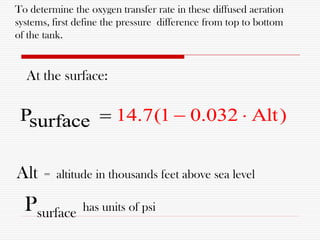
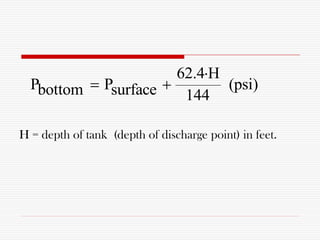
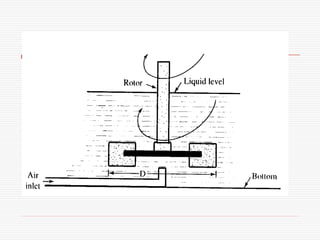
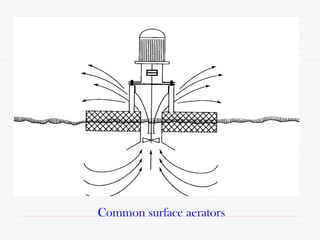
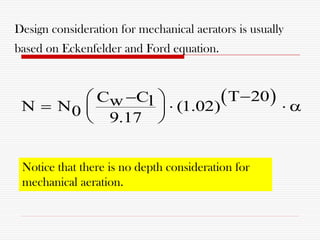
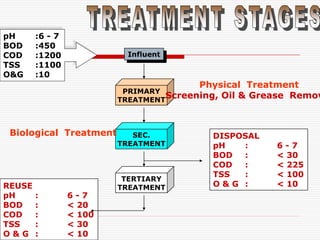
Turnkey solution for water and waste water
Creating difference in the similarities
6/27/2013 2
Topics covered underneath
 Bioaugmentation
 ETP designing brief
 Screens design
 Primary clarifier
 Biological process
 Sedimentation tank
 Practical issues faced by Paper industry
 How bioaugmentation helps
 Cost saving measures
With Bioaugmentation……..
 Reduction of BOD, COD of effluent.
 Lesser retention time as compared to normal microbes
• Increased rate of decomposition - breaks down proteins,
carbohydrates, fats, oils, for effective waste digestion and odor
reduction.
• Same plant treat more amount of influent with conventional design.
 Effective at :
 pH range(5.5 to 9.5)
 Low D.O. (0.8)
 Temperature Range (5-45 degree centigrade)
 And very importantly F/M ratio is kept balance
Bonus Benefits………
 Odour Reduction upto 95%,
 Significant Energy Saving,
 Substantial Chemical Saving,
 Reduced Sludge Formation,
 Less Operation and Maintenance Cost,
 Upto 90-95% Water Recycling
Roebic Technology
Active bacteria
In Active bacteria
Isolated Active
bacterial strain and
cultured in
R & D lab
Cultured bacteria
packed in in active
form.
Inoculation of active
bacteria by utilizing
roebic Technology to
increase MLVSS
Percentage of
MLVSS increase
so treatment
level also
General plant design
 Primary treatment
 Primary settling tank
 Primary clarifier
 High rate clarifier (i.e. Sedicell, Krofta)
 Secondary Treatment
 Secondary treatment
 Aeration tank
 Anaerobic digester
 Tertiary Treatment
 DMF
 PSF
 ACF
6/27/2013 10
Collection
sump
Clarified
Water
Tank
Chlorine
Dosing
Treated
wastewater
to process
Secondary
Clarifier
SC1
Sludge re-circulation pumps
Filter Feed
Pumps
Paper stream
Inlet
Aeration tank
Pressure
Sand
filter
Activated
Carbon
Filter
Micron
Filter
High
Pressure
pump
RO
Treated Wastewater Reuse Scheme
Primary
Clarifier
PC2
pH-7.2
TSS < 1100 ppm
COD < 1000 ppm
TDS < 800 ppm
pH-7.5
TSS < 60 ppm
COD < 80 ppm
TDS < 800 ppm
pH-6.8-7.2
TSS < Nil
COD < 30 ppm
TDS < 50 ppm
Primary Treatment
 Bar screen
 Oil & Grease tank.
 Primary settling tank.
 Primary clarifier.
 High rate clarifier like sedicell, krofta.
6/27/2013 12
Bar Screen and Fine Screen
6/27/2013 13
Figure Definition sketch for types of screens used in wastewater treatment
Design Consideration
Velocity
 The velocity of flow ahead of and through the screen
varies and affects its operation.
 The lower the velocity through the screen, the greater
is the amount of screenings that would be removed
from effluent.
 However, the lower the velocity, the greater would be
the amount of solids deposited in the channel.
 Hence, the design velocity should be such as to
permit 100% removal of material of certain size
without undue depositions.
 Velocities of 0.6 to 1.2 mps through the open area for
the peak flows have been used satisfactorily.
 Further, the velocity at low flows in the approach
channel should not be less than 0.3 mps to avoid
deposition of solids.
Head loss
 Head loss varies with the quantity and nature of
screenings allowed to accumulate between cleanings.
 Head loss through screens mainly depends on:
 Size and amount of solids in waste water
 Clear openings between bar
 Method of cleaning and its frequency
 Velocity of flow through the screens
 The head loss through clean flat bar screens is
calculated from the following formula:
h = 0.0729 (V2 - v2)
where, h = head loss in m
V = velocity through the screen in mps
v = velocity before the screen in mps
Another formula often used to determine the head loss
through a bar rack is Kirschmer's equation:
where h = head loss, m
b = bar shape factor (2.42 for sharp edge rectangular bar, 1.83
for rectangular bar with semicircle upstream, 1.79 for
circular bar and 1.67 for rectangular bar with both u/s and
d/s face as semicircular).
W = maximum width of bar u/s of flow, m
b = minimum clear spacing between bars, m
hv = velocity head of flow approaching rack, m = v2/2g
q = angle of inclination of rack with horizontal
h = b (W/b)4/3 hv sin q
The head loss through fine screen is given by
where, h = head loss, m
Q = discharge, m3/s
C = coefficient of discharge (typical value 0.6)
A = effective submerged open area, m2
h = (1/2g) (Q/CA)
Oil & Grease Trap
 Grease traps (also known as grease interceptors, grease
recovery devices and grease converters) are plumbing devices
designed to intercept most greases and solids before they enter a
wastewater disposal system.
6/27/2013 21
Primary Clarifier
 Purpose: to remove settleable organics and floating
scum (grease and oils).
 Efficiencies:
 Suspended solids 50 – 65%
 BOD 30 – 35%
 Primary clarifiers are either circular or rectangular. They
are very similar to sedimentation basins used in water
treatment except that scum removal is always provided
in addition to sludge collection.
23
A Circular Primary clarifier Tank
 Aerobic –
 Activated sludge process
 SAFF
 FAB
 MBBR
 PVC Gel
 Anaerobic
 UASBR
 Anaerobic digester
 EGSB
 Secondary clarifier
Secondary treatment
 The most common suspended growth process
used for municipal wastewater treatment is the
activated sludge process.
Activated sludge plant involves:
1.wastewater aeration in the presence of a
microbial suspension,
2.solid-liquid separation following aeration,
3.discharge of clarified effluent,
4.wasting of excess biomass, and
5.return of remaining biomass to the aeration
tank.
Process
 The process involves air or oxygen being introduced into a mixture of
primary treated or screened sewage or industrial wastewater
combined with organisms to develop a biological floc which reduces
the organic content of the sewage.
 The combination of wastewater and biological mass is commonly
known as mixed liquor.
 In all activated sludge plants, once the wastewater has received
sufficient treatment, excess mixed liquor is discharged into settling
tanks and the treated supernatant is run off to undergo further
treatment before discharge.
Design Consideration
 The quality or characteristics of raw waste water to be treated.
 The desired quality or characteristics of effluent or treated
waste water.
 The type of reactor that will be used.
 Volumetric and organic loading that will be applied to the
reactor.
 Amount of O2 required and the aeration system will
provide to supply O2 and to support mixing.
 The quantity of sludge that will be generated and
wasted for its further management.
 Besides these nutrient requirements of microbes,
environmental conditions under which plant
operated.
Design steps
 The design computations require the
determination of:
 Volume or dimensions of the aeration tank
 Flow of the influent.
 Amount of O2 required and power needed for
aeration
 Quantity of sludge that will produced for particular
waste and treatment conditions
 Volume and dimensions of sec. settling tank
Design criteria
 No of aeration tanks, N= min. 2 (small plants)
= 4 or more (large plants)
 Depth of waste water in tank= 3-4.5 m (usually)
= 4.5-7.5 m (diffuse aeration)
= 1-6 m (surface aeration)
 Freeboard= 0.3-6 m (diffuse aeration)
= 1-1.5 m (surface aeration)
 Rectangular aeration tank L:B= 5:1 and B:D=3:1 to 4:1
(depends on the aeration system)
Methods of aeration
 Diffused aeration
 Spray aeration
 Turbine aeration
 Surface aeration
Diffused aeration
 Providing maximum water surface per unit volume of
air.
 Air bubbles brought with water in a mixing or contact
chamber.
 A common way to aerate water is via diffused air.
 Air is pumped through some sort of diffuser to
generate small bubbles.
 Usually gas is injected into the bottom of the aeration
tank and is allowed to rise to the surface in an open
tank.
 The rising bubbles transfer oxygen to the water, as
well as transport bottom water to the surface.
 The bubbles raising through water create turbulence.
 Untreated water is allowed to enter the tank from top
and exit from bottom.
Efficiency of diffused aeration can be improved:
 Fine bubbles (0.2 cm dia) as compared to coarse
bubble (2.5 cm dia)
 By increasing water depth (9-15 ft)
 By improving the basin geometry (width to depth
ratio not exceed 2)
 By increasing the retention time (10-30 min)
Typical diffused aeration system looks like:
There are a large variety of diffuser types. For example ceramic
plates
These plates are arranged on manifolds at the bottom of
aeration tanks as shown here.
Other types of diffusers include coarse aerators
Again, these diffusers would be arranged by a manifold
on the bottom of an aeration tank.
To determine the oxygen transfer rate in these diffused aeration
systems, first define the pressure difference from top to bottom
of the tank.
14.7(1 0.032 AlPsurfac t)e  
Alt = altitude in thousands feet above sea level
Psurface has units of psi
At the surface:
62.4 H
P P (psi)bottom surface 144

 
H = depth of tank (depth of discharge point) in feet.
Mechanical Aeration
Basically there are two types of mechanical aeration.
Turbine Aeration:
 In this system coarse bubbles are injected into the
bottom of the tank and then a turbine shears the
bubbles for better oxygen transfer.
 Efficiency of turbine aerators is generally higher than
diffused aeration.
Surface Aeration:
 In this case a mixing device is used to agitate the
surface so that there is increased interfacial area
between liquid and air.
 There are many different proprietary types of
surface aerators .
Common surface aerators
Design consideration for mechanical aerators is usually
based on Eckenfelder and Ford equation.
 T 20C Cw lN N (1.02)0 9.17
 
    
 
Notice that there is no depth consideration for
mechanical aeration.
Where as:
 N = actual transfer rate (lb-O2/hr)
 N0 = manufacturer specified transfer rate ( lb/hr)
for clean water, 20oC, zero DO.
 Cw = saturation value for oxygen for wastewater
under operating conditions.
 9.17 = saturation DO for clean water, 20oC.
 Cl = the design oxygen concentration in the
aeration basin.
 T = Temp.
 α = oxygen transfer correction factor for waste
water
Anaerobic Process
 Untreated wastewater is mixed with
recycled sludge solids and then digested
in a sealed reactor
 The mixture is separated in a clarifier
 The supernatant is discharged as
effluent, and settled sludge is recycled
Advantages/Disadvantages
Advantages
 Methane recovery
 Small area required
 Volatile solids
destruction
Disadvantages
 Heat required
 Effluent in reduced
chemical form requires
further treatment
 Requires skilled
operation
 Sludge to be disposed
off is minimal
Upflow Anaerobic Sludge Blanket
 Wastewater flows upward
through a sludge blanket
composed of biological
granules that decompose
organic matter
 Some of the generated gas
attaches to granules that rise
and strike degassing baffles
releasing the gas
 Free gas is collected by
special domes
 The effluent passes into a
settling chamber
Advantages/Disadvantages
Advantages
 Low energy demand
 Low land requirement
 Low sludge production
 Less expensive than
other anaerobic
processes
 High organic removal
eficiency
Disadvantages
 Long start-up period
 Requires sufficient
amount of granular
seed sludge for faster
start-up
 Significant wash out of
sludge during initial
phase of process
 Lower gas yield than
other anaerobic
processes
 Solid liquid separation process in which a
suspension is separated into two phases –
 Clarified supernatant leaving the top of the
sedimentation tank (overflow).
 Concentrated sludge leaving the bottom of the
sedimentation tank (underflow).
Secondary Clarifier
Purpose of Settling
 To remove coarse dispersed phase.
 To remove coagulated and flocculated impurities.
 To remove precipitated impurities after chemical
treatment.
 To settle the sludge (biomass) after activated
sludge process / tricking filters.
Principle of Settling
 Suspended solids present in water having specific
gravity greater than that of water tend to settle down
by gravity as soon as the turbulence is retarded by
offering storage.
 Basin in which the flow is retarded is called settling
tank.
 Theoretical average time for which the water is
detained in the settling tank is called the detention
period.
Types of Settling
 Type I settling (free settling)
 Type II settling (settling of flocculated
particles)
 Type III settling (zone or hindered
settling)
 Type IV settling (compression settling)
Design parameters for clarifier
Types of settling
Overflow rate
m3m2/day
Solids loading
kg/m2/day
Depth
Detentio
n time
Average Peak Average Peak
Primary settling only 25-30 50-60 - - 2.5-3.5 2.0-2.5
Primary settling followed by
secondary treatment
35-50 60-120 - - 2.5-3.5
Primary settling with
activated sludge return
25-35 50-60 - - 3.5-4.5 -
Secondary settling for
trickling filters
15-25 40-50 70-120 190 2.5-3.5 1.5-2.0
Secondary settling for
activated sludge (excluding
extended aeration)
15-35 40-50 70-140 210 3.5-4.5 -
Secondary settling for
extended aeration
8-15 25-35 25-120 170 3.5-4.5 -
Design Details
 Detention period: for plain sedimentation: 3 to 4
h, and for coagulated sedimentation: 2 to 2.5 h.
 Velocity of flow: Not greater than 30 cm/min
(horizontal flow).
 Tank dimensions: L:B = 3 to 5:1. Generally L= 30
m (common) maximum 100 m. Breadth= 6 m to
10 m. Circular: Diameter not greater than 60 m.
generally 20 to 40 m.
 Depth 2.5 to 5.0 m (3 m).
 Surface Overflow Rate: For plain sedimentation
12000 to 18000 L/d/m2 tank area; for
thoroughly flocculated water 24000 to 30000
L/d/m2 tank area.
 Slopes: Rectangular 1% towards inlet and
circular 8%.
Tertiary treatment
 Sand filter
 Multigrade filter
 Pressure sand filter
 Clariflocculator
 Activated carbon filter
6/27/2013 61
FILTERING SAND
. MANHOLE WITH
COVER
AIR RELEASE
WATER DISTRIBUTION
HEADER
ANTHRACITE
DRAIN
PEBBLES
CRUSHED
GRAVEL
DUAL
MEDIA
FILTER
Ht: 300
mm
size
16/32
inch
Ht: 300
mm
size 0.6
to 0.8
mm
Ht: 100
mm
size 6
to 2
mm
Ht: 100
mm
size 10
to 3
mm
Pebbles
Ht: 225
mm
size 40
to 6
mm
. MANHOLE WITH
COVER
AIR RELEASE
WATER DISTRIBUTION
HEADER
ACTIVATED CARBON
FILTER
DRAIN
COARSE SILEX
FINE SILEX
PEBBLES
ACTIVATED
CARBON
FILTER
Ht: 900
mm,
size
suitable
Ht: 75
mm
size
suiable
Ht: 75
mm
size
suitable
Ht: 200
mm
size 20
mm to
6 mm
GOOD HOUSE-KEEPING
PURIFICATION
WASTE /
CHEMICAL
REUSE / SALE
WATER
RECYCLE
POLLUTION ABATEMENT
PURIFICATION
WATER RECYCLE
RESOURCE RECOVERY
Our Approach………….
efuse
educe
euse
eclaim
ecycle
TERTIARY
TREATMENT
DISPOSAL
pH : 6 - 7
BOD : < 30
COD : < 225
TSS : < 100
O & G : < 10
Influent
pH :6 - 7
BOD :450
COD :1200
TSS :1100
O&G :10
PRIMARY
TREATMENT
Physical Treatment
Screening, Oil & Grease Remov
SEC.
TREATMENT
Biological Treatment
REUSE
pH : 6 - 7
BOD : < 20
COD : < 100
TSS : < 30
O & G : < 10
1. Inadequate ETP in terms of its sizing.
2. Inadequacy of the Electro mechanical equipment.
3. Manpower issues
1. Less educated
2. Proper monitoring or guidance not done.
4. Laboratory facility not available to monitor the plant.
5. Lack of knowledge on the waste water treatment
process have let them use various techniques on a
single unit.
6. Water consumption very high on per ton paper
resulting to high flow.
PRESENT CONSTRAINTS TO
INDUTRY ETP
Action plan
 System feasibility check
 knowledge and nature check of employees at ETP
(Client side).
 Design modification if required
 Desilting of all tanks
 Commissioing startup
 Regular laboratory check like OUR, DO, MLVSS
 After 500ppm Mlss shock dosage of bioaugmentation
start.
 After 1500ppm MLSS controlled flow taken in the
system.
 After 2500ppm complete focus towards the quality of
the water
Common Plant faults
 Recirculation from aeration to secondary clarifier
missing.
 Flocculating well missing in clarifier.
 Relative velocity water at the surface is not zero.
 Bioculture missing.
 Surface aerators installed at height 3m which need to be
ideally at 2.25mt.
 Irregular sludge drainage.
 No any Lab facility.
 If plants are at
6/27/2013 68
Settling
cylinder
missing
Settling
cylinder
designed
Bioaugmentation support in
cost optimization
 Aeration hour saving (power
consumption).
 Sludge handling cost reduction.
 Chemical saving.
 Environmental friendly process
6/27/2013 70
Cost reduction by optimization of
Dissolved Oxygen
After inoculation the running of all aerators is
must to avoid the anoxic condition in the
aeration system.
With inoculation the oxygen demand of the
system will reduce so we can run the aerators
on rotational basis diagonally as per the oxygen
uptake.
Scheme of aerators in
aeration tank (Top
View)
Sectional View
6/27/2013 72
Dosing of Nutrient
 Urea: Source of Nitrogen
 DAP: Di-Ammonium Phosphate,
Source of phosphate as well as
nitrogen in a less quantity.
 Jaggery: Source of carbon.
Ratio to be maintained
Aeration Tank: 100:5:1
Anaerobic tank: 250:5:1
6/27/2013 73
Thank You
We wish to provide complete
knowledge, quality and economical
solutions to paper and pulp industry.
We look forward for your support….

Etp presentation

  • 1.
    Turnkey solution forwater and waste water Creating difference in the similarities
  • 2.
    6/27/2013 2 Topics coveredunderneath  Bioaugmentation  ETP designing brief  Screens design  Primary clarifier  Biological process  Sedimentation tank  Practical issues faced by Paper industry  How bioaugmentation helps  Cost saving measures
  • 3.
    With Bioaugmentation……..  Reductionof BOD, COD of effluent.  Lesser retention time as compared to normal microbes • Increased rate of decomposition - breaks down proteins, carbohydrates, fats, oils, for effective waste digestion and odor reduction. • Same plant treat more amount of influent with conventional design.  Effective at :  pH range(5.5 to 9.5)  Low D.O. (0.8)  Temperature Range (5-45 degree centigrade)  And very importantly F/M ratio is kept balance
  • 4.
    Bonus Benefits………  OdourReduction upto 95%,  Significant Energy Saving,  Substantial Chemical Saving,  Reduced Sludge Formation,  Less Operation and Maintenance Cost,  Upto 90-95% Water Recycling
  • 9.
    Roebic Technology Active bacteria InActive bacteria Isolated Active bacterial strain and cultured in R & D lab Cultured bacteria packed in in active form. Inoculation of active bacteria by utilizing roebic Technology to increase MLVSS Percentage of MLVSS increase so treatment level also
  • 10.
    General plant design Primary treatment  Primary settling tank  Primary clarifier  High rate clarifier (i.e. Sedicell, Krofta)  Secondary Treatment  Secondary treatment  Aeration tank  Anaerobic digester  Tertiary Treatment  DMF  PSF  ACF 6/27/2013 10
  • 11.
    Collection sump Clarified Water Tank Chlorine Dosing Treated wastewater to process Secondary Clarifier SC1 Sludge re-circulationpumps Filter Feed Pumps Paper stream Inlet Aeration tank Pressure Sand filter Activated Carbon Filter Micron Filter High Pressure pump RO Treated Wastewater Reuse Scheme Primary Clarifier PC2 pH-7.2 TSS < 1100 ppm COD < 1000 ppm TDS < 800 ppm pH-7.5 TSS < 60 ppm COD < 80 ppm TDS < 800 ppm pH-6.8-7.2 TSS < Nil COD < 30 ppm TDS < 50 ppm
  • 12.
    Primary Treatment  Barscreen  Oil & Grease tank.  Primary settling tank.  Primary clarifier.  High rate clarifier like sedicell, krofta. 6/27/2013 12
  • 13.
    Bar Screen andFine Screen 6/27/2013 13
  • 14.
    Figure Definition sketchfor types of screens used in wastewater treatment
  • 15.
    Design Consideration Velocity  Thevelocity of flow ahead of and through the screen varies and affects its operation.  The lower the velocity through the screen, the greater is the amount of screenings that would be removed from effluent.  However, the lower the velocity, the greater would be the amount of solids deposited in the channel.
  • 16.
     Hence, thedesign velocity should be such as to permit 100% removal of material of certain size without undue depositions.  Velocities of 0.6 to 1.2 mps through the open area for the peak flows have been used satisfactorily.  Further, the velocity at low flows in the approach channel should not be less than 0.3 mps to avoid deposition of solids.
  • 17.
    Head loss  Headloss varies with the quantity and nature of screenings allowed to accumulate between cleanings.  Head loss through screens mainly depends on:  Size and amount of solids in waste water  Clear openings between bar  Method of cleaning and its frequency  Velocity of flow through the screens
  • 18.
     The headloss through clean flat bar screens is calculated from the following formula: h = 0.0729 (V2 - v2) where, h = head loss in m V = velocity through the screen in mps v = velocity before the screen in mps
  • 19.
    Another formula oftenused to determine the head loss through a bar rack is Kirschmer's equation: where h = head loss, m b = bar shape factor (2.42 for sharp edge rectangular bar, 1.83 for rectangular bar with semicircle upstream, 1.79 for circular bar and 1.67 for rectangular bar with both u/s and d/s face as semicircular). W = maximum width of bar u/s of flow, m b = minimum clear spacing between bars, m hv = velocity head of flow approaching rack, m = v2/2g q = angle of inclination of rack with horizontal h = b (W/b)4/3 hv sin q
  • 20.
    The head lossthrough fine screen is given by where, h = head loss, m Q = discharge, m3/s C = coefficient of discharge (typical value 0.6) A = effective submerged open area, m2 h = (1/2g) (Q/CA)
  • 21.
    Oil & GreaseTrap  Grease traps (also known as grease interceptors, grease recovery devices and grease converters) are plumbing devices designed to intercept most greases and solids before they enter a wastewater disposal system. 6/27/2013 21
  • 22.
    Primary Clarifier  Purpose:to remove settleable organics and floating scum (grease and oils).  Efficiencies:  Suspended solids 50 – 65%  BOD 30 – 35%  Primary clarifiers are either circular or rectangular. They are very similar to sedimentation basins used in water treatment except that scum removal is always provided in addition to sludge collection.
  • 23.
    23 A Circular Primaryclarifier Tank
  • 24.
     Aerobic – Activated sludge process  SAFF  FAB  MBBR  PVC Gel  Anaerobic  UASBR  Anaerobic digester  EGSB  Secondary clarifier Secondary treatment
  • 25.
     The mostcommon suspended growth process used for municipal wastewater treatment is the activated sludge process.
  • 26.
    Activated sludge plantinvolves: 1.wastewater aeration in the presence of a microbial suspension, 2.solid-liquid separation following aeration, 3.discharge of clarified effluent, 4.wasting of excess biomass, and 5.return of remaining biomass to the aeration tank.
  • 27.
    Process  The processinvolves air or oxygen being introduced into a mixture of primary treated or screened sewage or industrial wastewater combined with organisms to develop a biological floc which reduces the organic content of the sewage.  The combination of wastewater and biological mass is commonly known as mixed liquor.  In all activated sludge plants, once the wastewater has received sufficient treatment, excess mixed liquor is discharged into settling tanks and the treated supernatant is run off to undergo further treatment before discharge.
  • 28.
    Design Consideration  Thequality or characteristics of raw waste water to be treated.  The desired quality or characteristics of effluent or treated waste water.  The type of reactor that will be used.  Volumetric and organic loading that will be applied to the reactor.
  • 29.
     Amount ofO2 required and the aeration system will provide to supply O2 and to support mixing.  The quantity of sludge that will be generated and wasted for its further management.  Besides these nutrient requirements of microbes, environmental conditions under which plant operated.
  • 30.
    Design steps  Thedesign computations require the determination of:  Volume or dimensions of the aeration tank  Flow of the influent.  Amount of O2 required and power needed for aeration  Quantity of sludge that will produced for particular waste and treatment conditions  Volume and dimensions of sec. settling tank
  • 31.
    Design criteria  Noof aeration tanks, N= min. 2 (small plants) = 4 or more (large plants)  Depth of waste water in tank= 3-4.5 m (usually) = 4.5-7.5 m (diffuse aeration) = 1-6 m (surface aeration)  Freeboard= 0.3-6 m (diffuse aeration) = 1-1.5 m (surface aeration)  Rectangular aeration tank L:B= 5:1 and B:D=3:1 to 4:1 (depends on the aeration system)
  • 32.
    Methods of aeration Diffused aeration  Spray aeration  Turbine aeration  Surface aeration
  • 33.
    Diffused aeration  Providingmaximum water surface per unit volume of air.  Air bubbles brought with water in a mixing or contact chamber.  A common way to aerate water is via diffused air.  Air is pumped through some sort of diffuser to generate small bubbles.
  • 34.
     Usually gasis injected into the bottom of the aeration tank and is allowed to rise to the surface in an open tank.  The rising bubbles transfer oxygen to the water, as well as transport bottom water to the surface.  The bubbles raising through water create turbulence.  Untreated water is allowed to enter the tank from top and exit from bottom.
  • 35.
    Efficiency of diffusedaeration can be improved:  Fine bubbles (0.2 cm dia) as compared to coarse bubble (2.5 cm dia)  By increasing water depth (9-15 ft)  By improving the basin geometry (width to depth ratio not exceed 2)  By increasing the retention time (10-30 min)
  • 36.
    Typical diffused aerationsystem looks like:
  • 37.
    There are alarge variety of diffuser types. For example ceramic plates
  • 38.
    These plates arearranged on manifolds at the bottom of aeration tanks as shown here.
  • 39.
    Other types ofdiffusers include coarse aerators
  • 40.
    Again, these diffuserswould be arranged by a manifold on the bottom of an aeration tank.
  • 41.
    To determine theoxygen transfer rate in these diffused aeration systems, first define the pressure difference from top to bottom of the tank. 14.7(1 0.032 AlPsurfac t)e   Alt = altitude in thousands feet above sea level Psurface has units of psi At the surface:
  • 42.
    62.4 H P P(psi)bottom surface 144    H = depth of tank (depth of discharge point) in feet.
  • 43.
    Mechanical Aeration Basically thereare two types of mechanical aeration. Turbine Aeration:  In this system coarse bubbles are injected into the bottom of the tank and then a turbine shears the bubbles for better oxygen transfer.  Efficiency of turbine aerators is generally higher than diffused aeration.
  • 45.
    Surface Aeration:  Inthis case a mixing device is used to agitate the surface so that there is increased interfacial area between liquid and air.  There are many different proprietary types of surface aerators .
  • 46.
  • 47.
    Design consideration formechanical aerators is usually based on Eckenfelder and Ford equation.  T 20C Cw lN N (1.02)0 9.17          Notice that there is no depth consideration for mechanical aeration.
  • 48.
    Where as:  N= actual transfer rate (lb-O2/hr)  N0 = manufacturer specified transfer rate ( lb/hr) for clean water, 20oC, zero DO.  Cw = saturation value for oxygen for wastewater under operating conditions.  9.17 = saturation DO for clean water, 20oC.  Cl = the design oxygen concentration in the aeration basin.  T = Temp.  α = oxygen transfer correction factor for waste water
  • 49.
    Anaerobic Process  Untreatedwastewater is mixed with recycled sludge solids and then digested in a sealed reactor  The mixture is separated in a clarifier  The supernatant is discharged as effluent, and settled sludge is recycled
  • 50.
    Advantages/Disadvantages Advantages  Methane recovery Small area required  Volatile solids destruction Disadvantages  Heat required  Effluent in reduced chemical form requires further treatment  Requires skilled operation  Sludge to be disposed off is minimal
  • 51.
    Upflow Anaerobic SludgeBlanket  Wastewater flows upward through a sludge blanket composed of biological granules that decompose organic matter  Some of the generated gas attaches to granules that rise and strike degassing baffles releasing the gas  Free gas is collected by special domes  The effluent passes into a settling chamber
  • 52.
    Advantages/Disadvantages Advantages  Low energydemand  Low land requirement  Low sludge production  Less expensive than other anaerobic processes  High organic removal eficiency Disadvantages  Long start-up period  Requires sufficient amount of granular seed sludge for faster start-up  Significant wash out of sludge during initial phase of process  Lower gas yield than other anaerobic processes
  • 53.
     Solid liquidseparation process in which a suspension is separated into two phases –  Clarified supernatant leaving the top of the sedimentation tank (overflow).  Concentrated sludge leaving the bottom of the sedimentation tank (underflow). Secondary Clarifier
  • 54.
    Purpose of Settling To remove coarse dispersed phase.  To remove coagulated and flocculated impurities.  To remove precipitated impurities after chemical treatment.  To settle the sludge (biomass) after activated sludge process / tricking filters.
  • 55.
    Principle of Settling Suspended solids present in water having specific gravity greater than that of water tend to settle down by gravity as soon as the turbulence is retarded by offering storage.  Basin in which the flow is retarded is called settling tank.  Theoretical average time for which the water is detained in the settling tank is called the detention period.
  • 57.
    Types of Settling Type I settling (free settling)  Type II settling (settling of flocculated particles)  Type III settling (zone or hindered settling)  Type IV settling (compression settling)
  • 58.
    Design parameters forclarifier Types of settling Overflow rate m3m2/day Solids loading kg/m2/day Depth Detentio n time Average Peak Average Peak Primary settling only 25-30 50-60 - - 2.5-3.5 2.0-2.5 Primary settling followed by secondary treatment 35-50 60-120 - - 2.5-3.5 Primary settling with activated sludge return 25-35 50-60 - - 3.5-4.5 - Secondary settling for trickling filters 15-25 40-50 70-120 190 2.5-3.5 1.5-2.0 Secondary settling for activated sludge (excluding extended aeration) 15-35 40-50 70-140 210 3.5-4.5 - Secondary settling for extended aeration 8-15 25-35 25-120 170 3.5-4.5 -
  • 59.
    Design Details  Detentionperiod: for plain sedimentation: 3 to 4 h, and for coagulated sedimentation: 2 to 2.5 h.  Velocity of flow: Not greater than 30 cm/min (horizontal flow).  Tank dimensions: L:B = 3 to 5:1. Generally L= 30 m (common) maximum 100 m. Breadth= 6 m to 10 m. Circular: Diameter not greater than 60 m. generally 20 to 40 m.
  • 60.
     Depth 2.5to 5.0 m (3 m).  Surface Overflow Rate: For plain sedimentation 12000 to 18000 L/d/m2 tank area; for thoroughly flocculated water 24000 to 30000 L/d/m2 tank area.  Slopes: Rectangular 1% towards inlet and circular 8%.
  • 61.
    Tertiary treatment  Sandfilter  Multigrade filter  Pressure sand filter  Clariflocculator  Activated carbon filter 6/27/2013 61
  • 62.
    FILTERING SAND . MANHOLEWITH COVER AIR RELEASE WATER DISTRIBUTION HEADER ANTHRACITE DRAIN PEBBLES CRUSHED GRAVEL DUAL MEDIA FILTER Ht: 300 mm size 16/32 inch Ht: 300 mm size 0.6 to 0.8 mm Ht: 100 mm size 6 to 2 mm Ht: 100 mm size 10 to 3 mm Pebbles Ht: 225 mm size 40 to 6 mm
  • 63.
    . MANHOLE WITH COVER AIRRELEASE WATER DISTRIBUTION HEADER ACTIVATED CARBON FILTER DRAIN COARSE SILEX FINE SILEX PEBBLES ACTIVATED CARBON FILTER Ht: 900 mm, size suitable Ht: 75 mm size suiable Ht: 75 mm size suitable Ht: 200 mm size 20 mm to 6 mm
  • 64.
    GOOD HOUSE-KEEPING PURIFICATION WASTE / CHEMICAL REUSE/ SALE WATER RECYCLE POLLUTION ABATEMENT PURIFICATION WATER RECYCLE RESOURCE RECOVERY Our Approach…………. efuse educe euse eclaim ecycle
  • 65.
    TERTIARY TREATMENT DISPOSAL pH : 6- 7 BOD : < 30 COD : < 225 TSS : < 100 O & G : < 10 Influent pH :6 - 7 BOD :450 COD :1200 TSS :1100 O&G :10 PRIMARY TREATMENT Physical Treatment Screening, Oil & Grease Remov SEC. TREATMENT Biological Treatment REUSE pH : 6 - 7 BOD : < 20 COD : < 100 TSS : < 30 O & G : < 10
  • 66.
    1. Inadequate ETPin terms of its sizing. 2. Inadequacy of the Electro mechanical equipment. 3. Manpower issues 1. Less educated 2. Proper monitoring or guidance not done. 4. Laboratory facility not available to monitor the plant. 5. Lack of knowledge on the waste water treatment process have let them use various techniques on a single unit. 6. Water consumption very high on per ton paper resulting to high flow. PRESENT CONSTRAINTS TO INDUTRY ETP
  • 67.
    Action plan  Systemfeasibility check  knowledge and nature check of employees at ETP (Client side).  Design modification if required  Desilting of all tanks  Commissioing startup  Regular laboratory check like OUR, DO, MLVSS  After 500ppm Mlss shock dosage of bioaugmentation start.  After 1500ppm MLSS controlled flow taken in the system.  After 2500ppm complete focus towards the quality of the water
  • 68.
    Common Plant faults Recirculation from aeration to secondary clarifier missing.  Flocculating well missing in clarifier.  Relative velocity water at the surface is not zero.  Bioculture missing.  Surface aerators installed at height 3m which need to be ideally at 2.25mt.  Irregular sludge drainage.  No any Lab facility.  If plants are at 6/27/2013 68
  • 69.
  • 70.
    Bioaugmentation support in costoptimization  Aeration hour saving (power consumption).  Sludge handling cost reduction.  Chemical saving.  Environmental friendly process 6/27/2013 70
  • 71.
    Cost reduction byoptimization of Dissolved Oxygen After inoculation the running of all aerators is must to avoid the anoxic condition in the aeration system. With inoculation the oxygen demand of the system will reduce so we can run the aerators on rotational basis diagonally as per the oxygen uptake. Scheme of aerators in aeration tank (Top View) Sectional View
  • 72.
    6/27/2013 72 Dosing ofNutrient  Urea: Source of Nitrogen  DAP: Di-Ammonium Phosphate, Source of phosphate as well as nitrogen in a less quantity.  Jaggery: Source of carbon. Ratio to be maintained Aeration Tank: 100:5:1 Anaerobic tank: 250:5:1
  • 73.
    6/27/2013 73 Thank You Wewish to provide complete knowledge, quality and economical solutions to paper and pulp industry. We look forward for your support….