Download to read offline
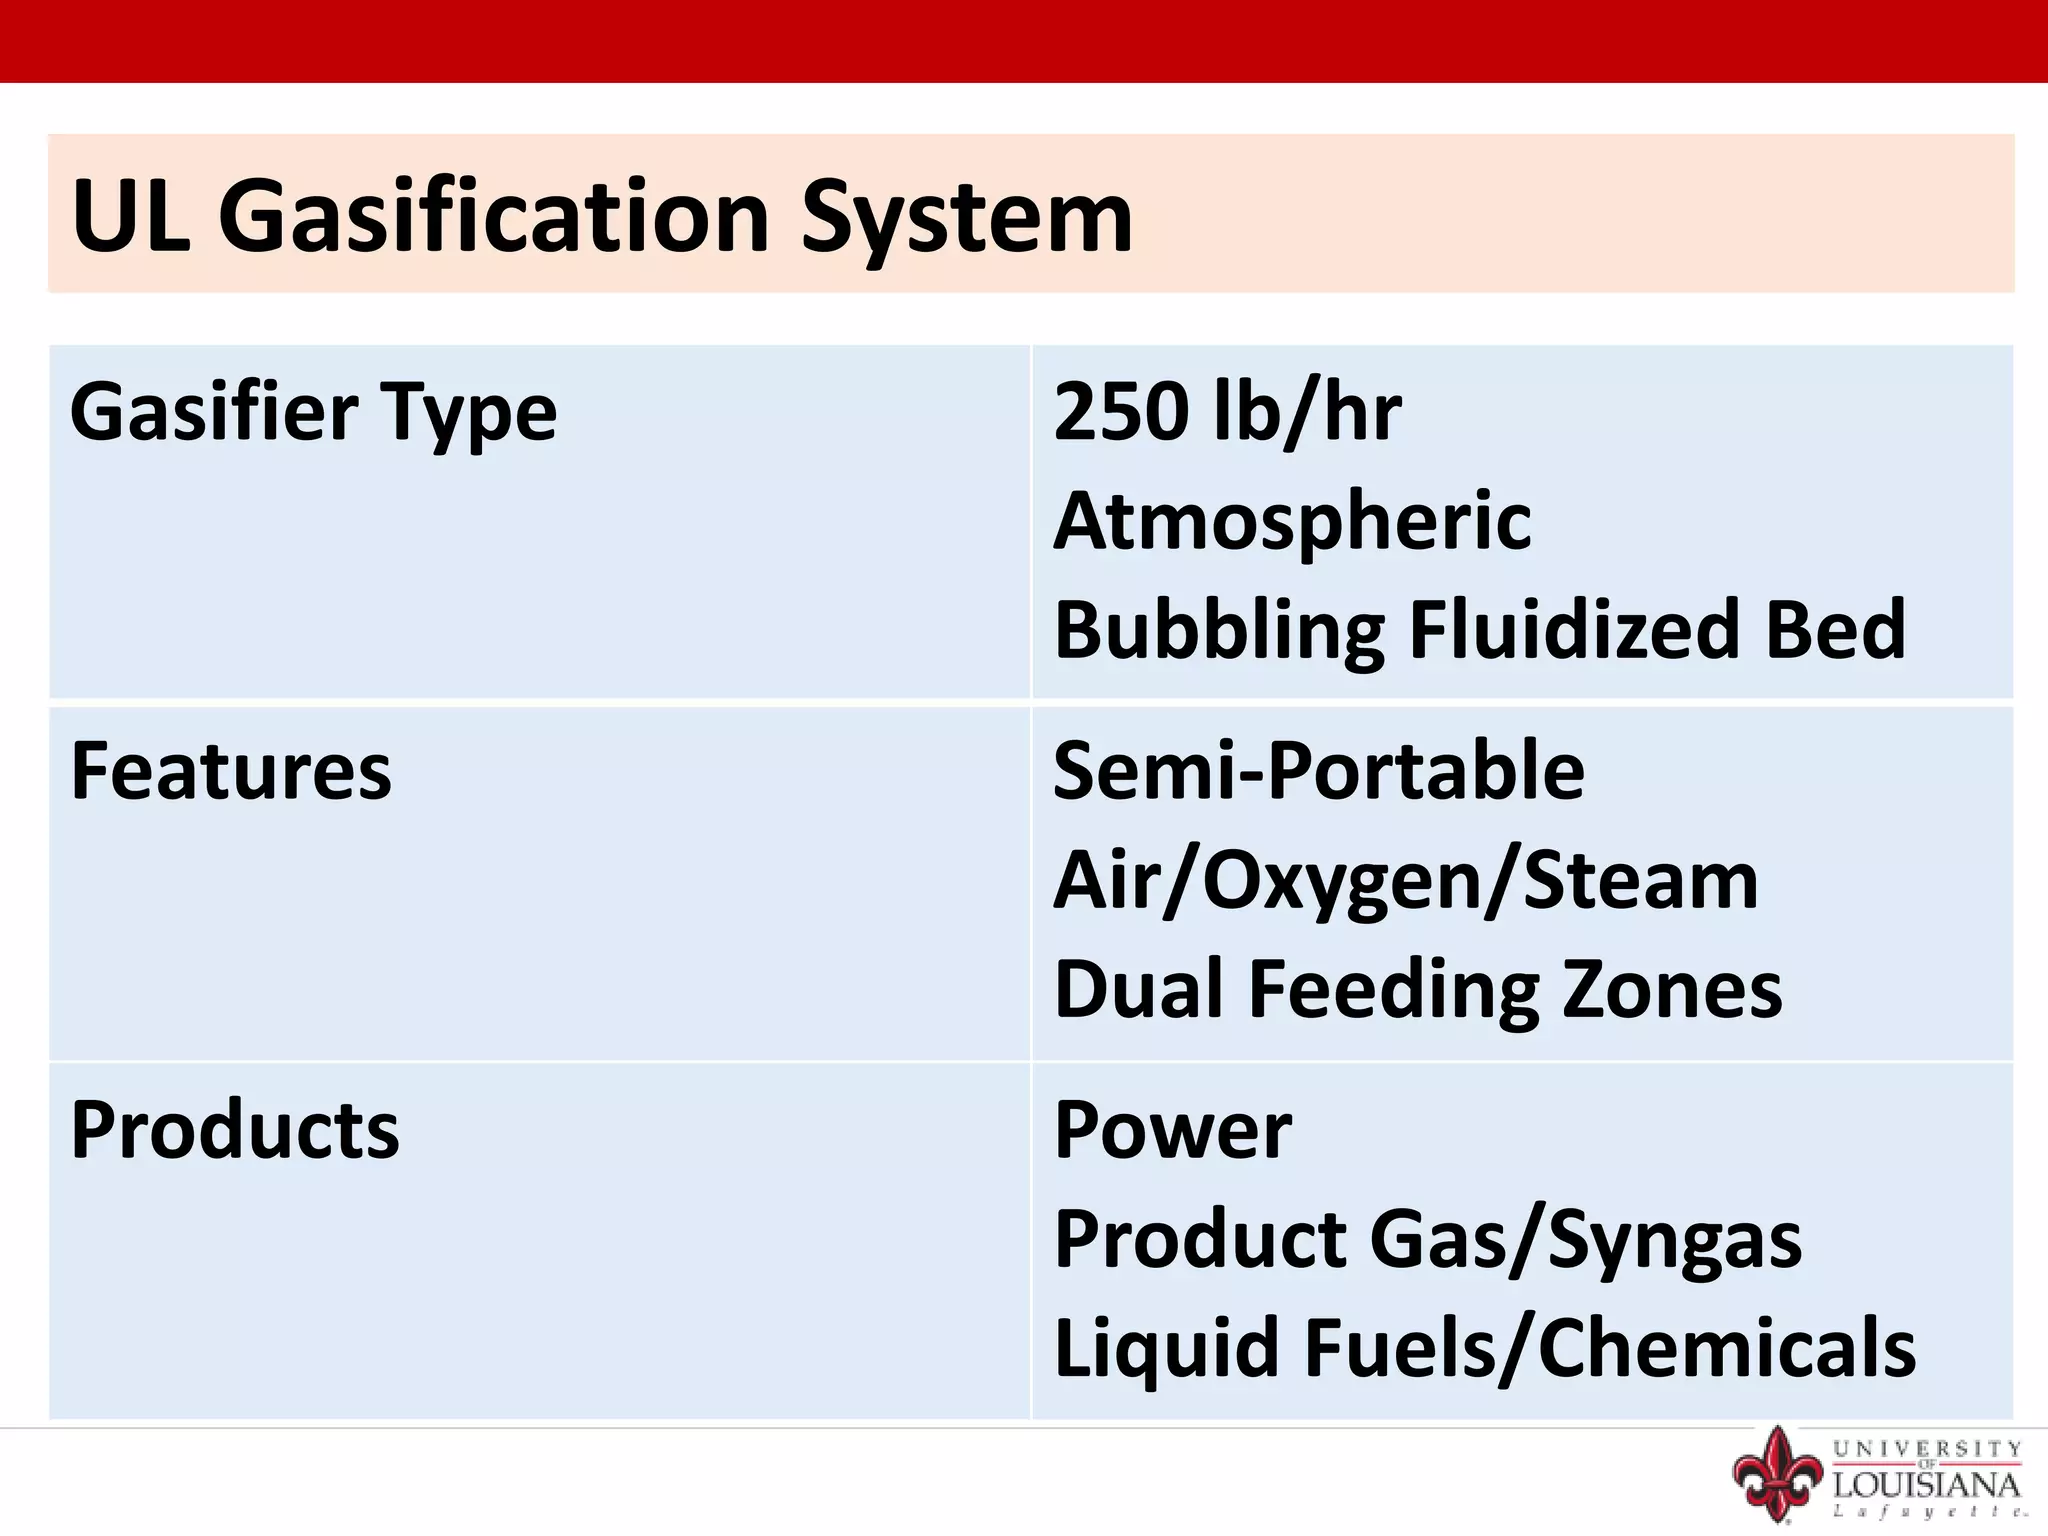
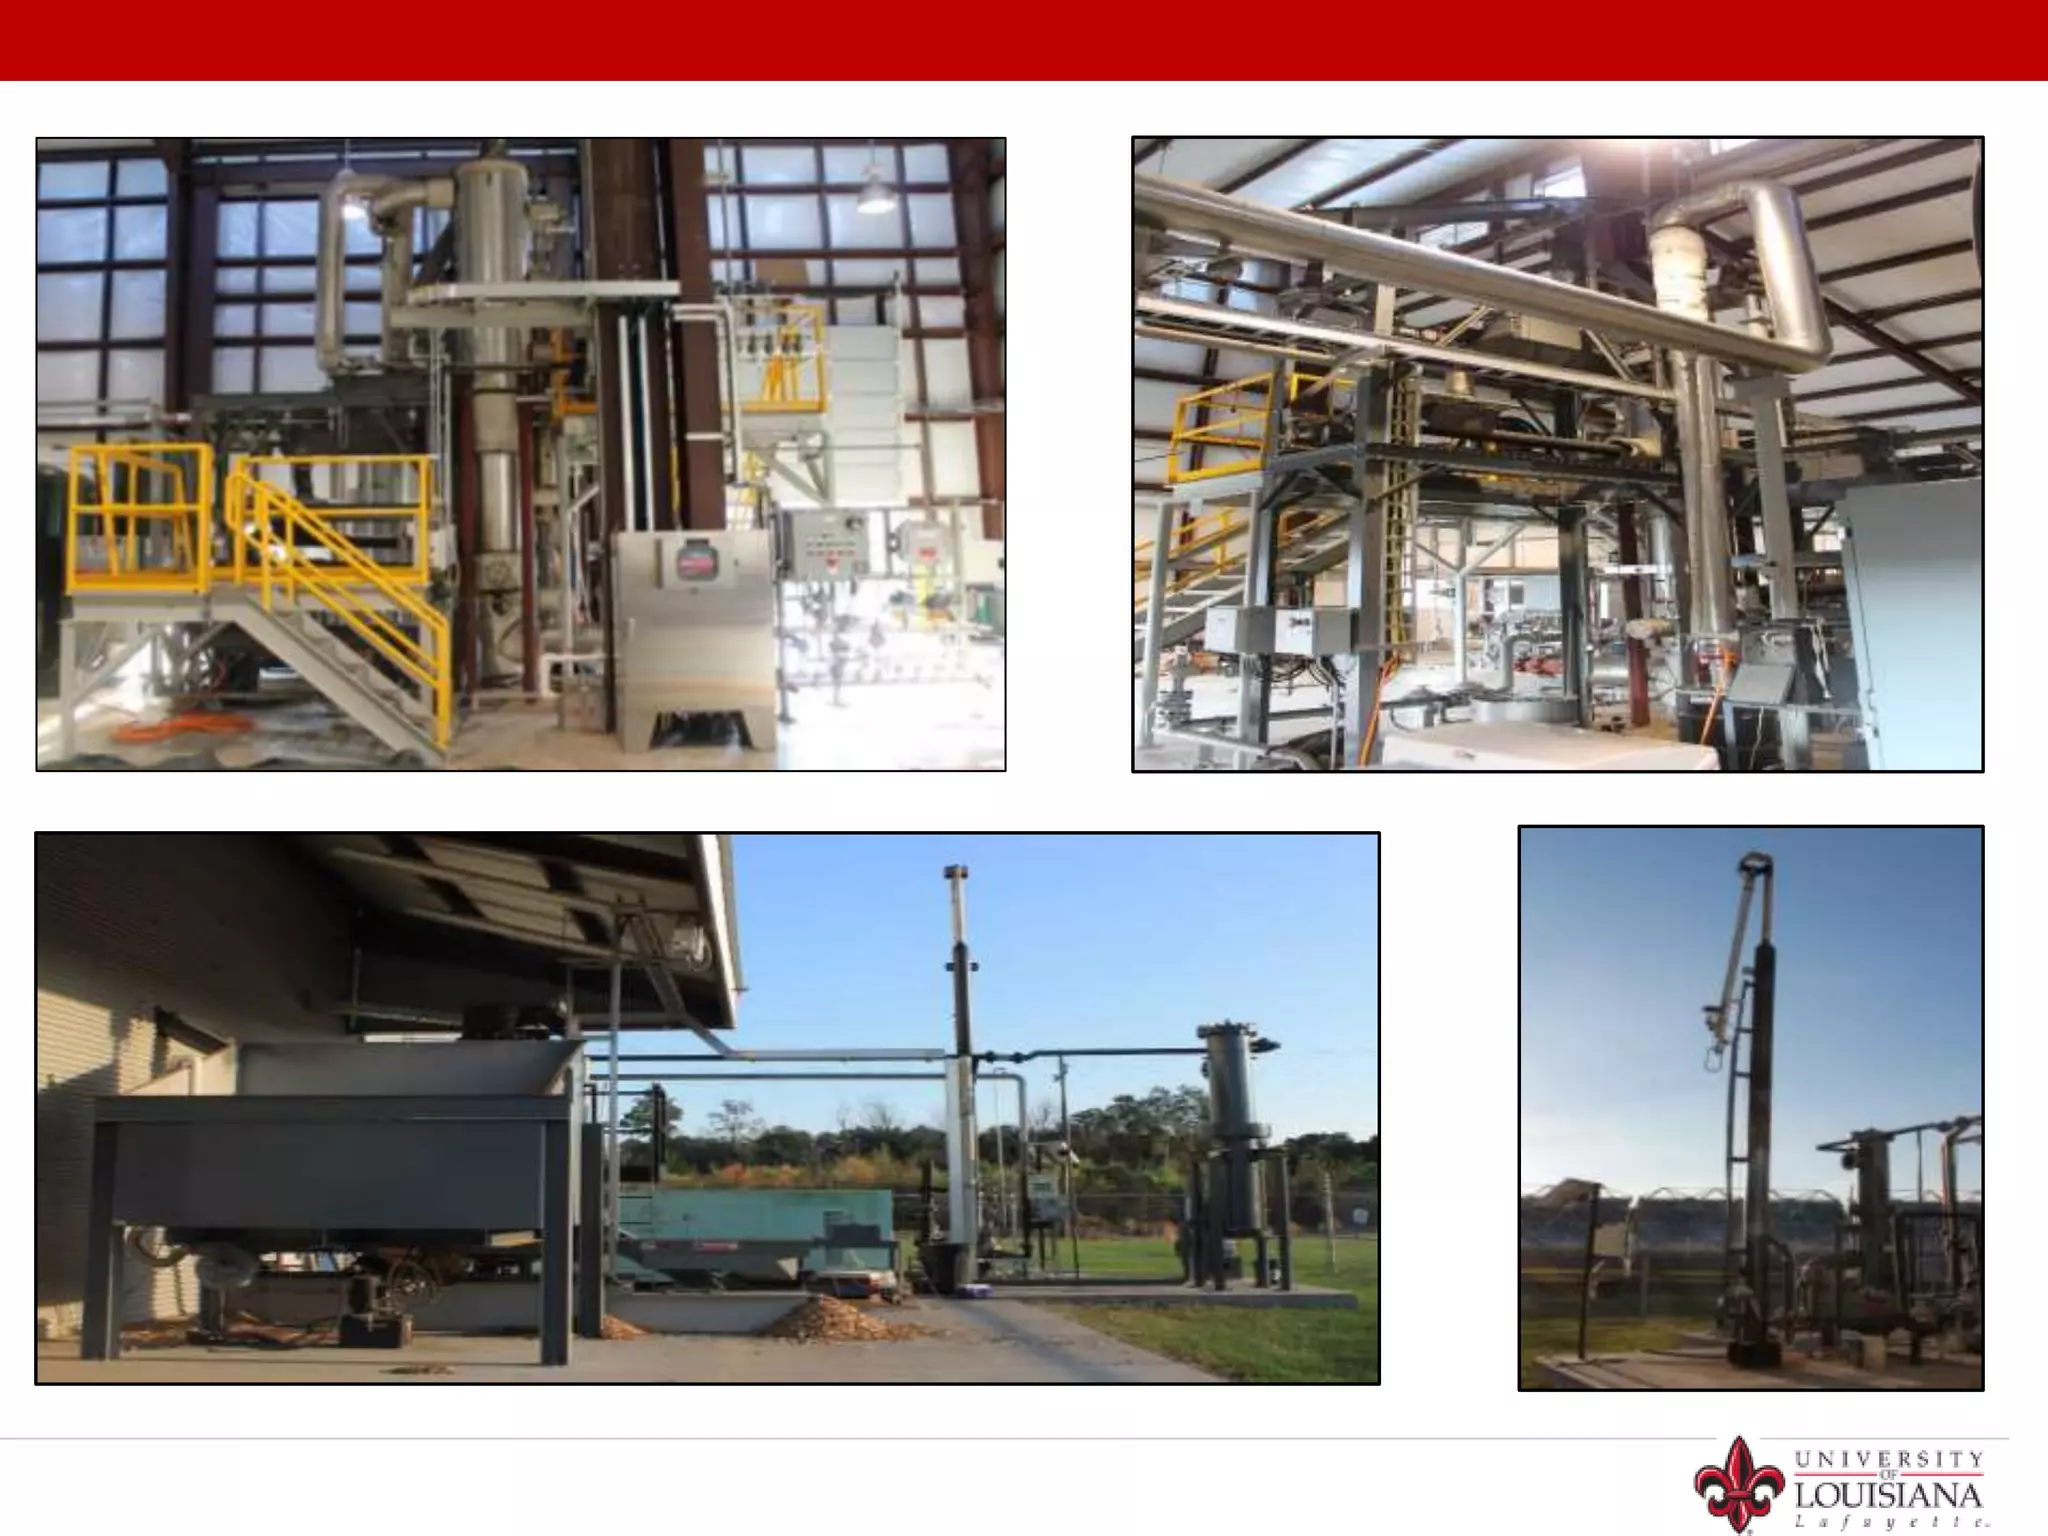
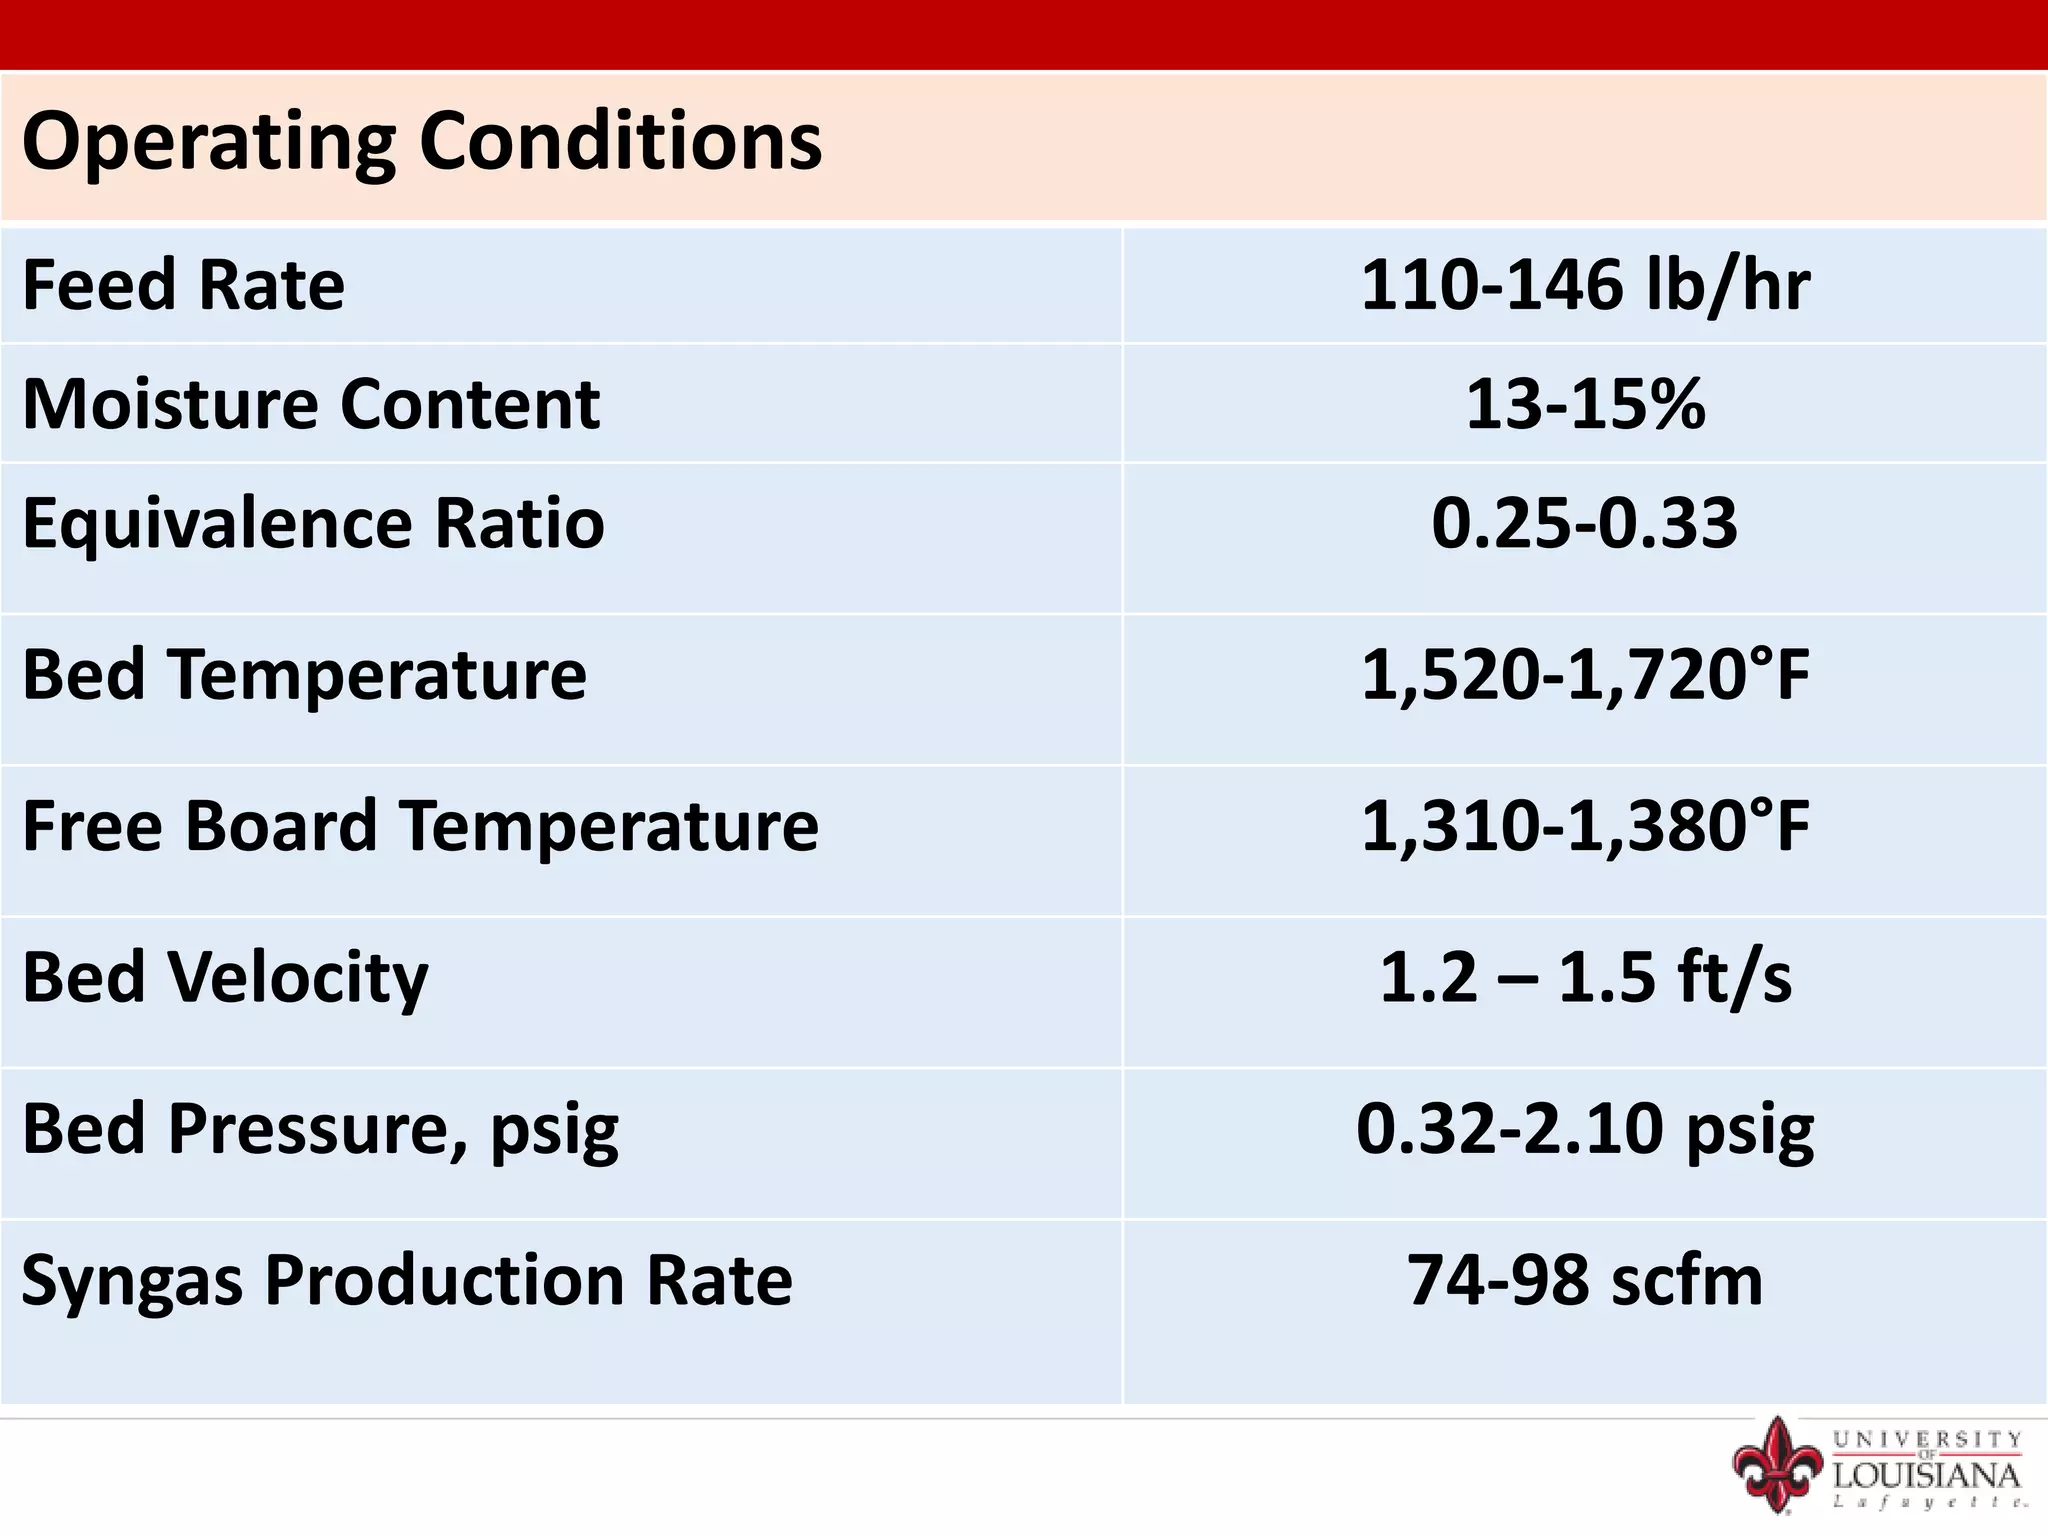
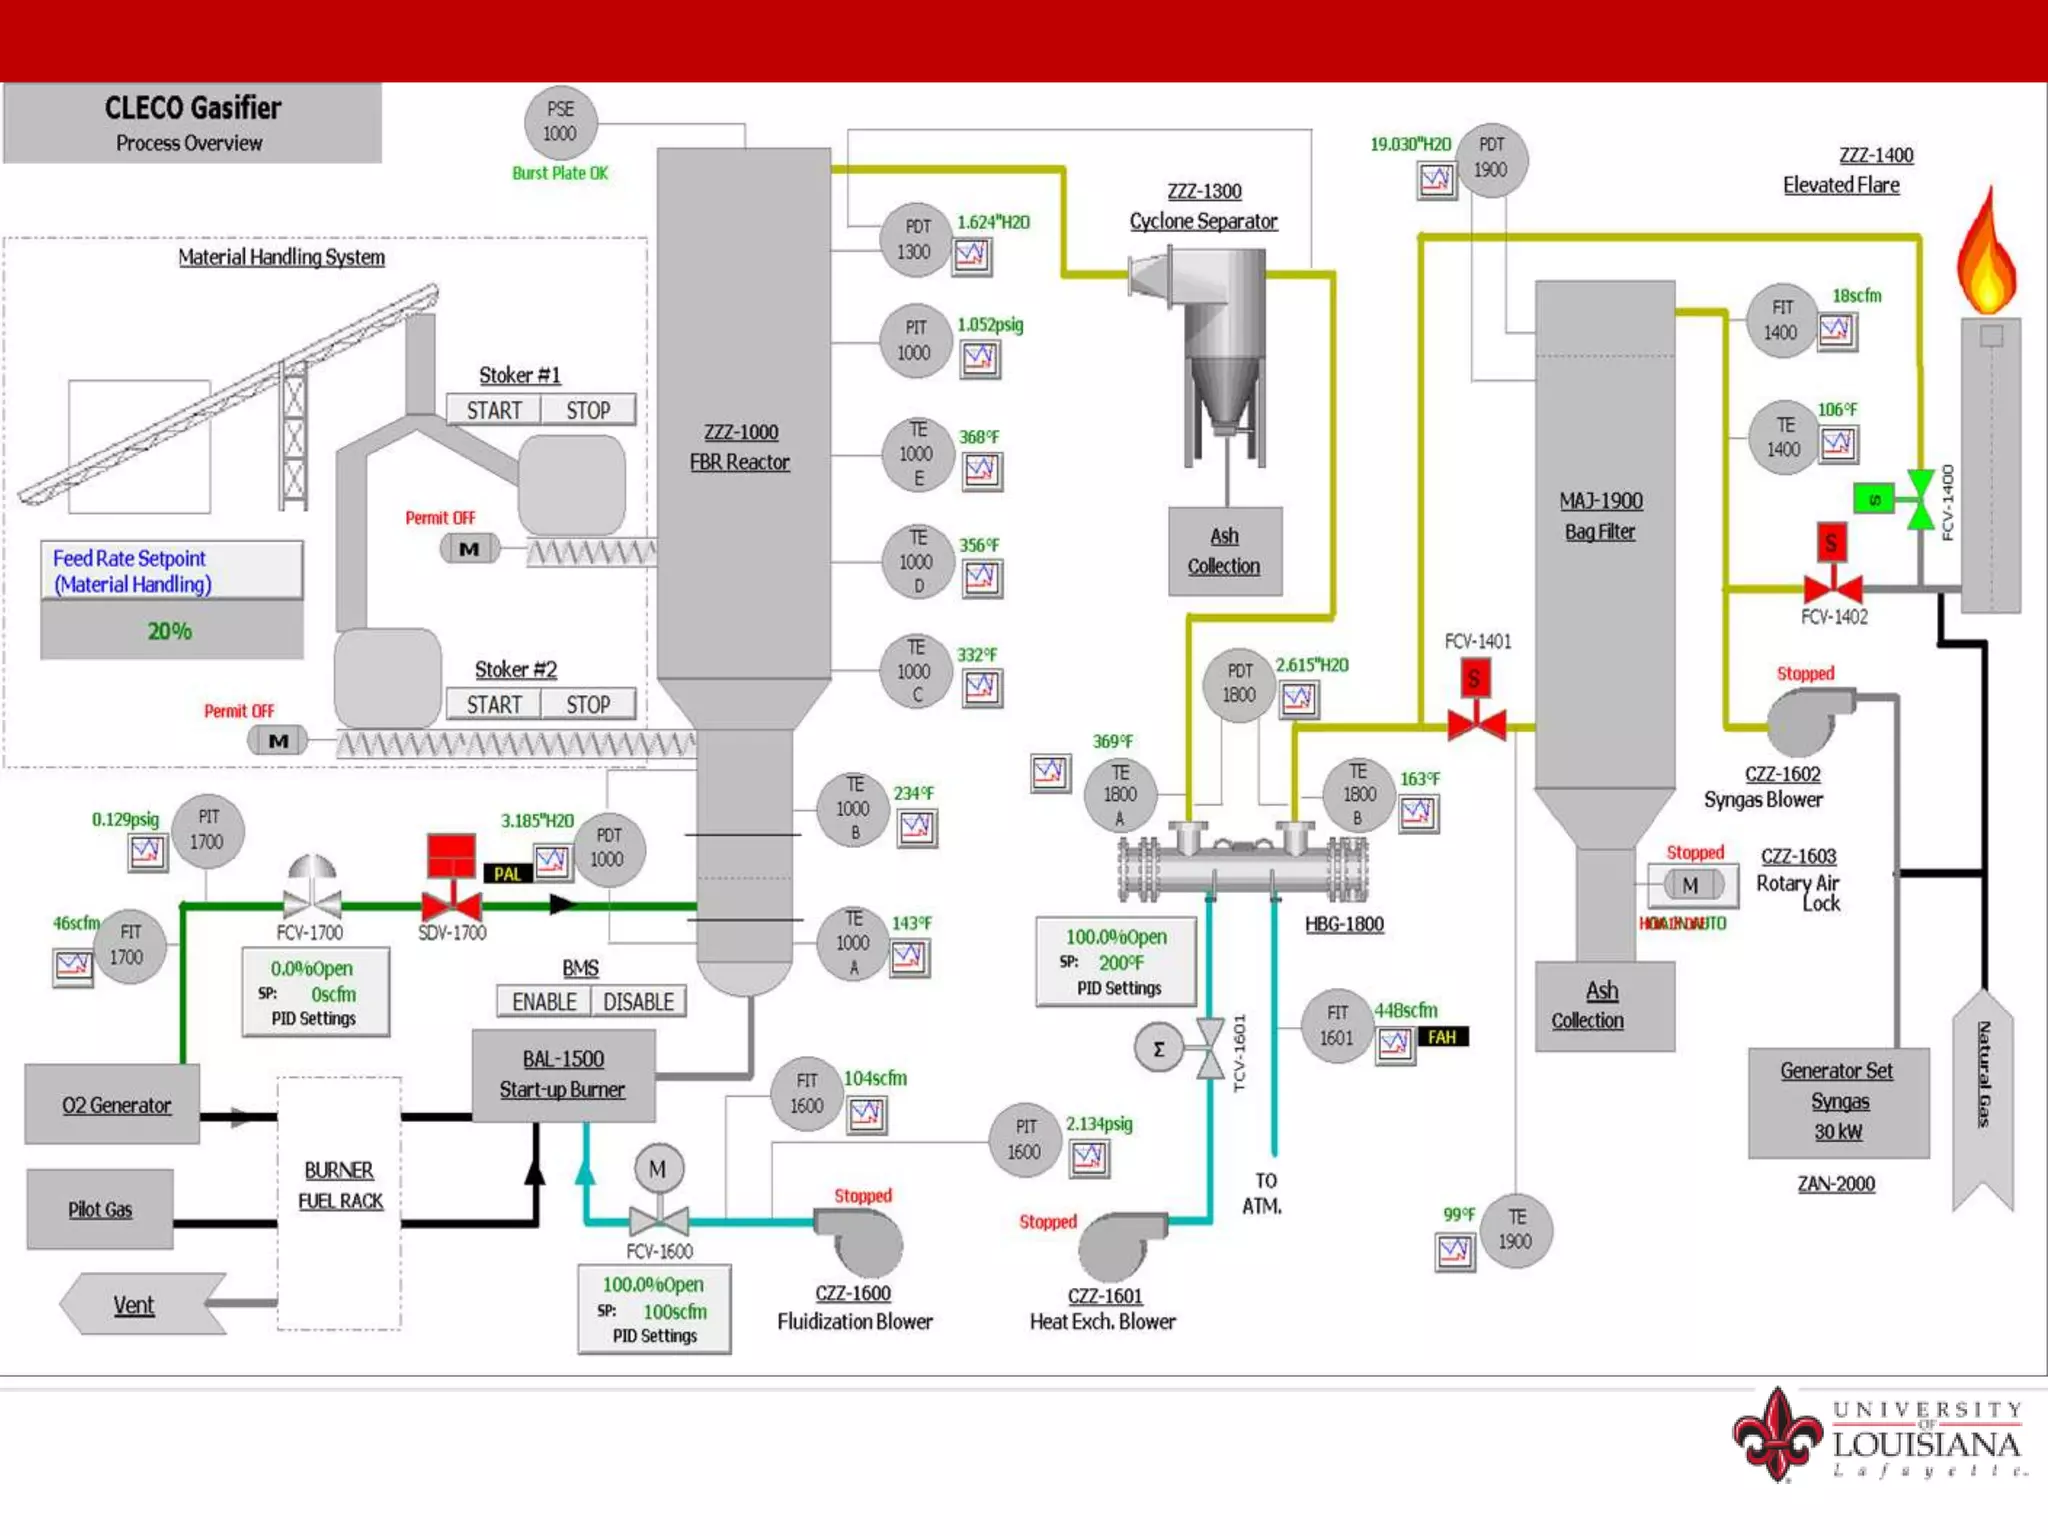
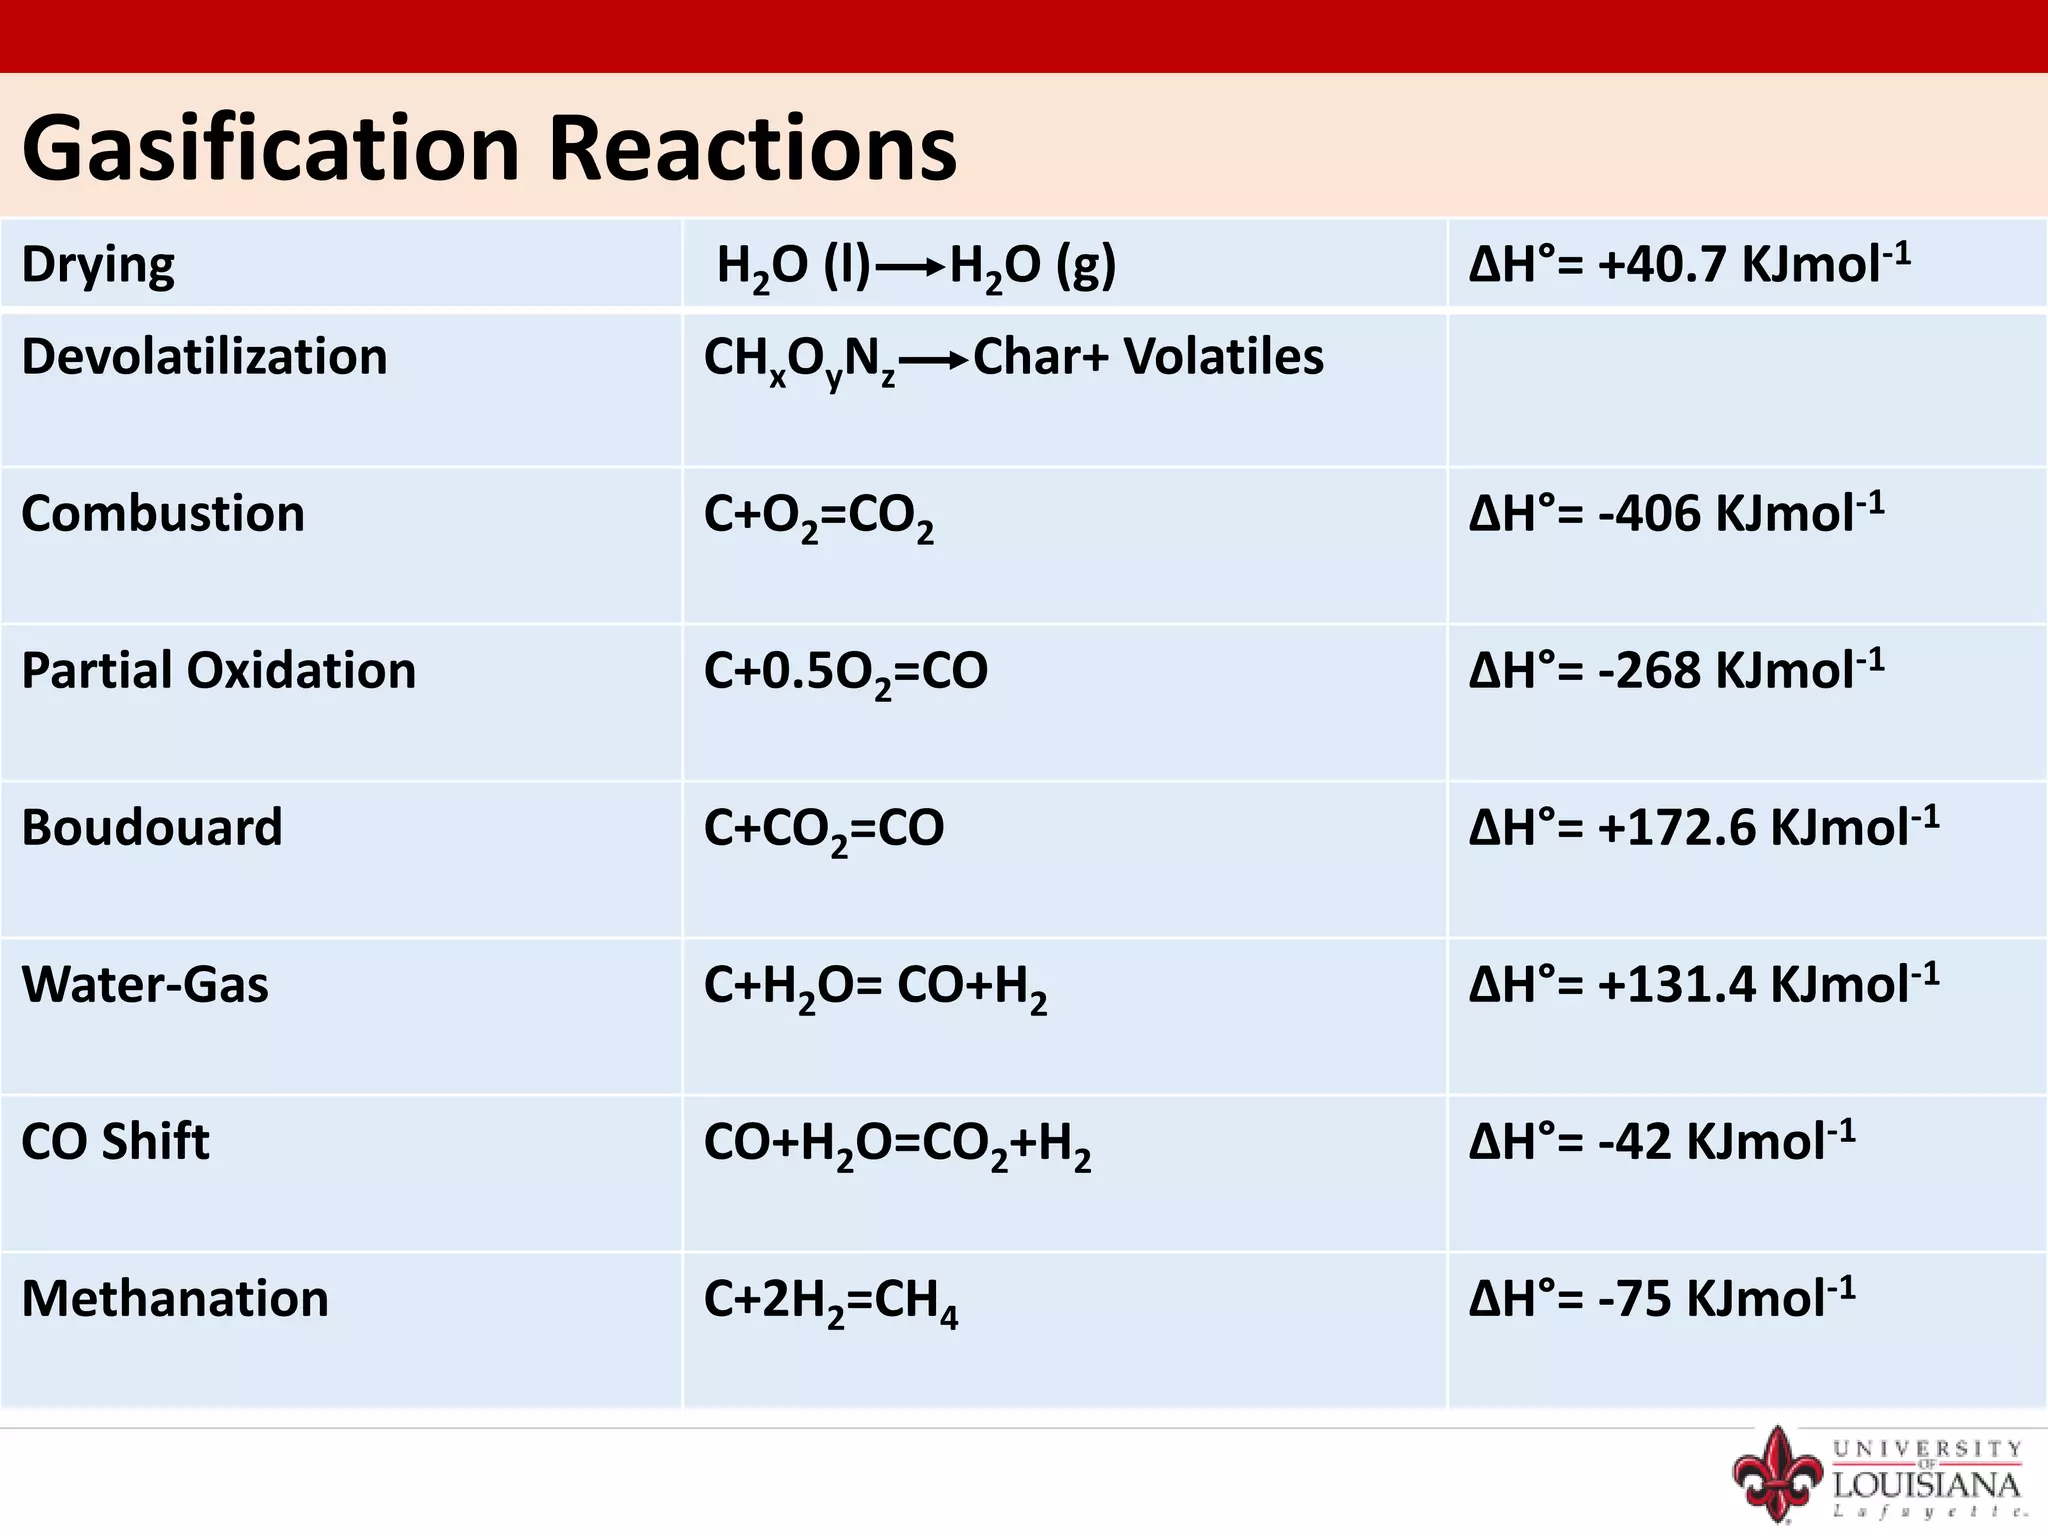
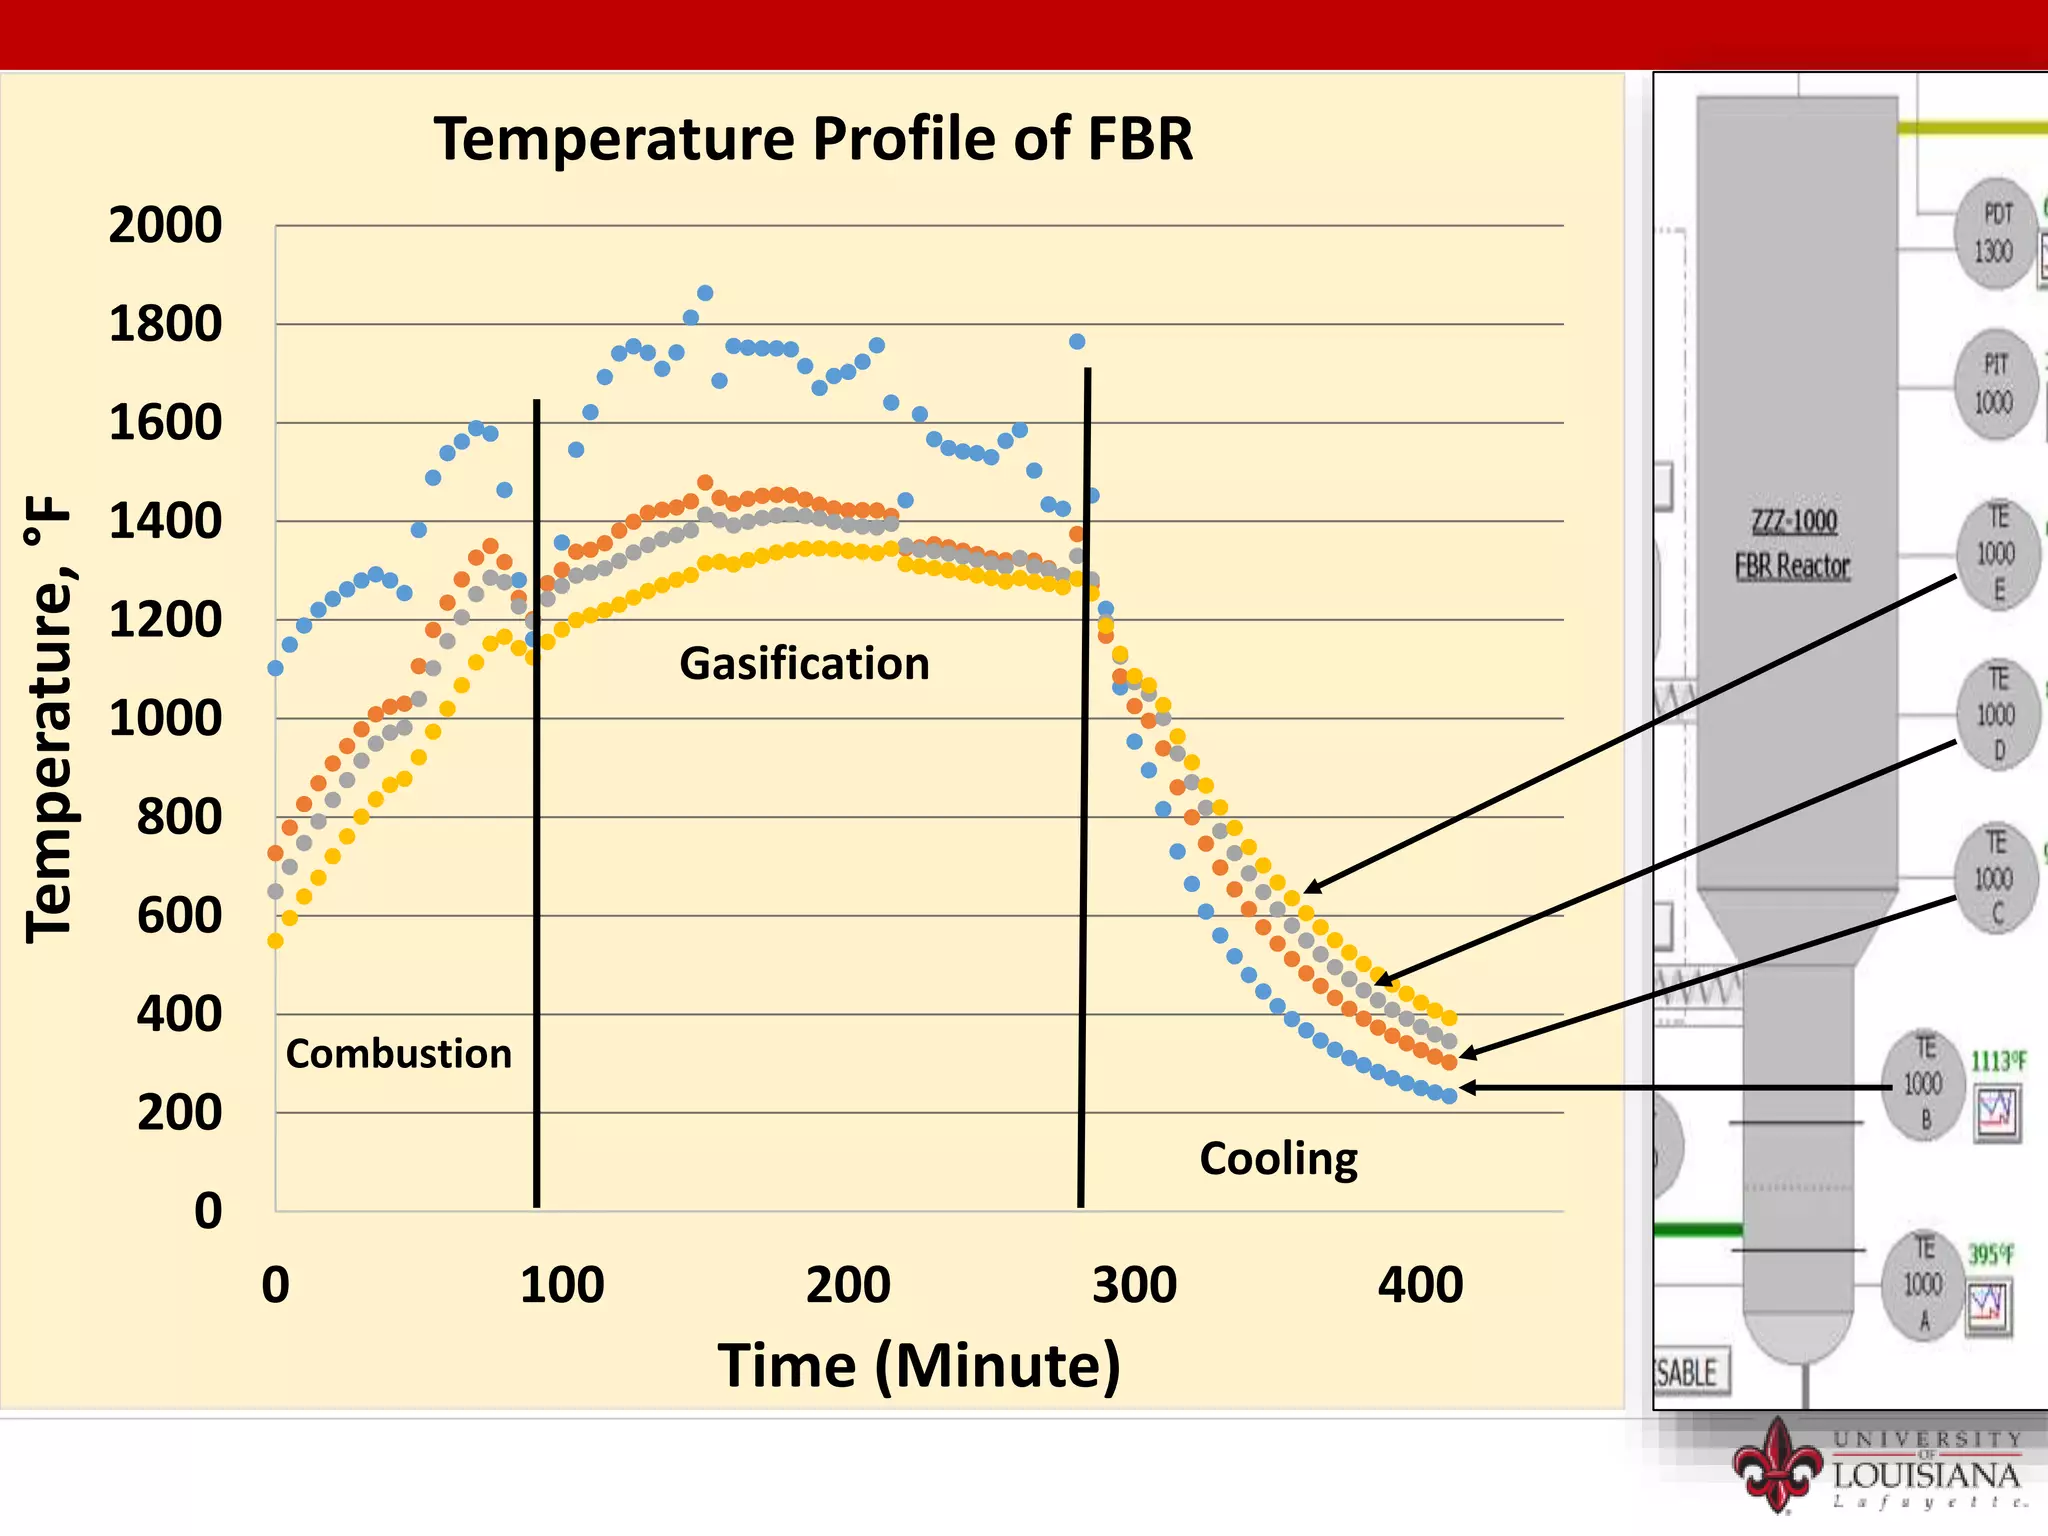
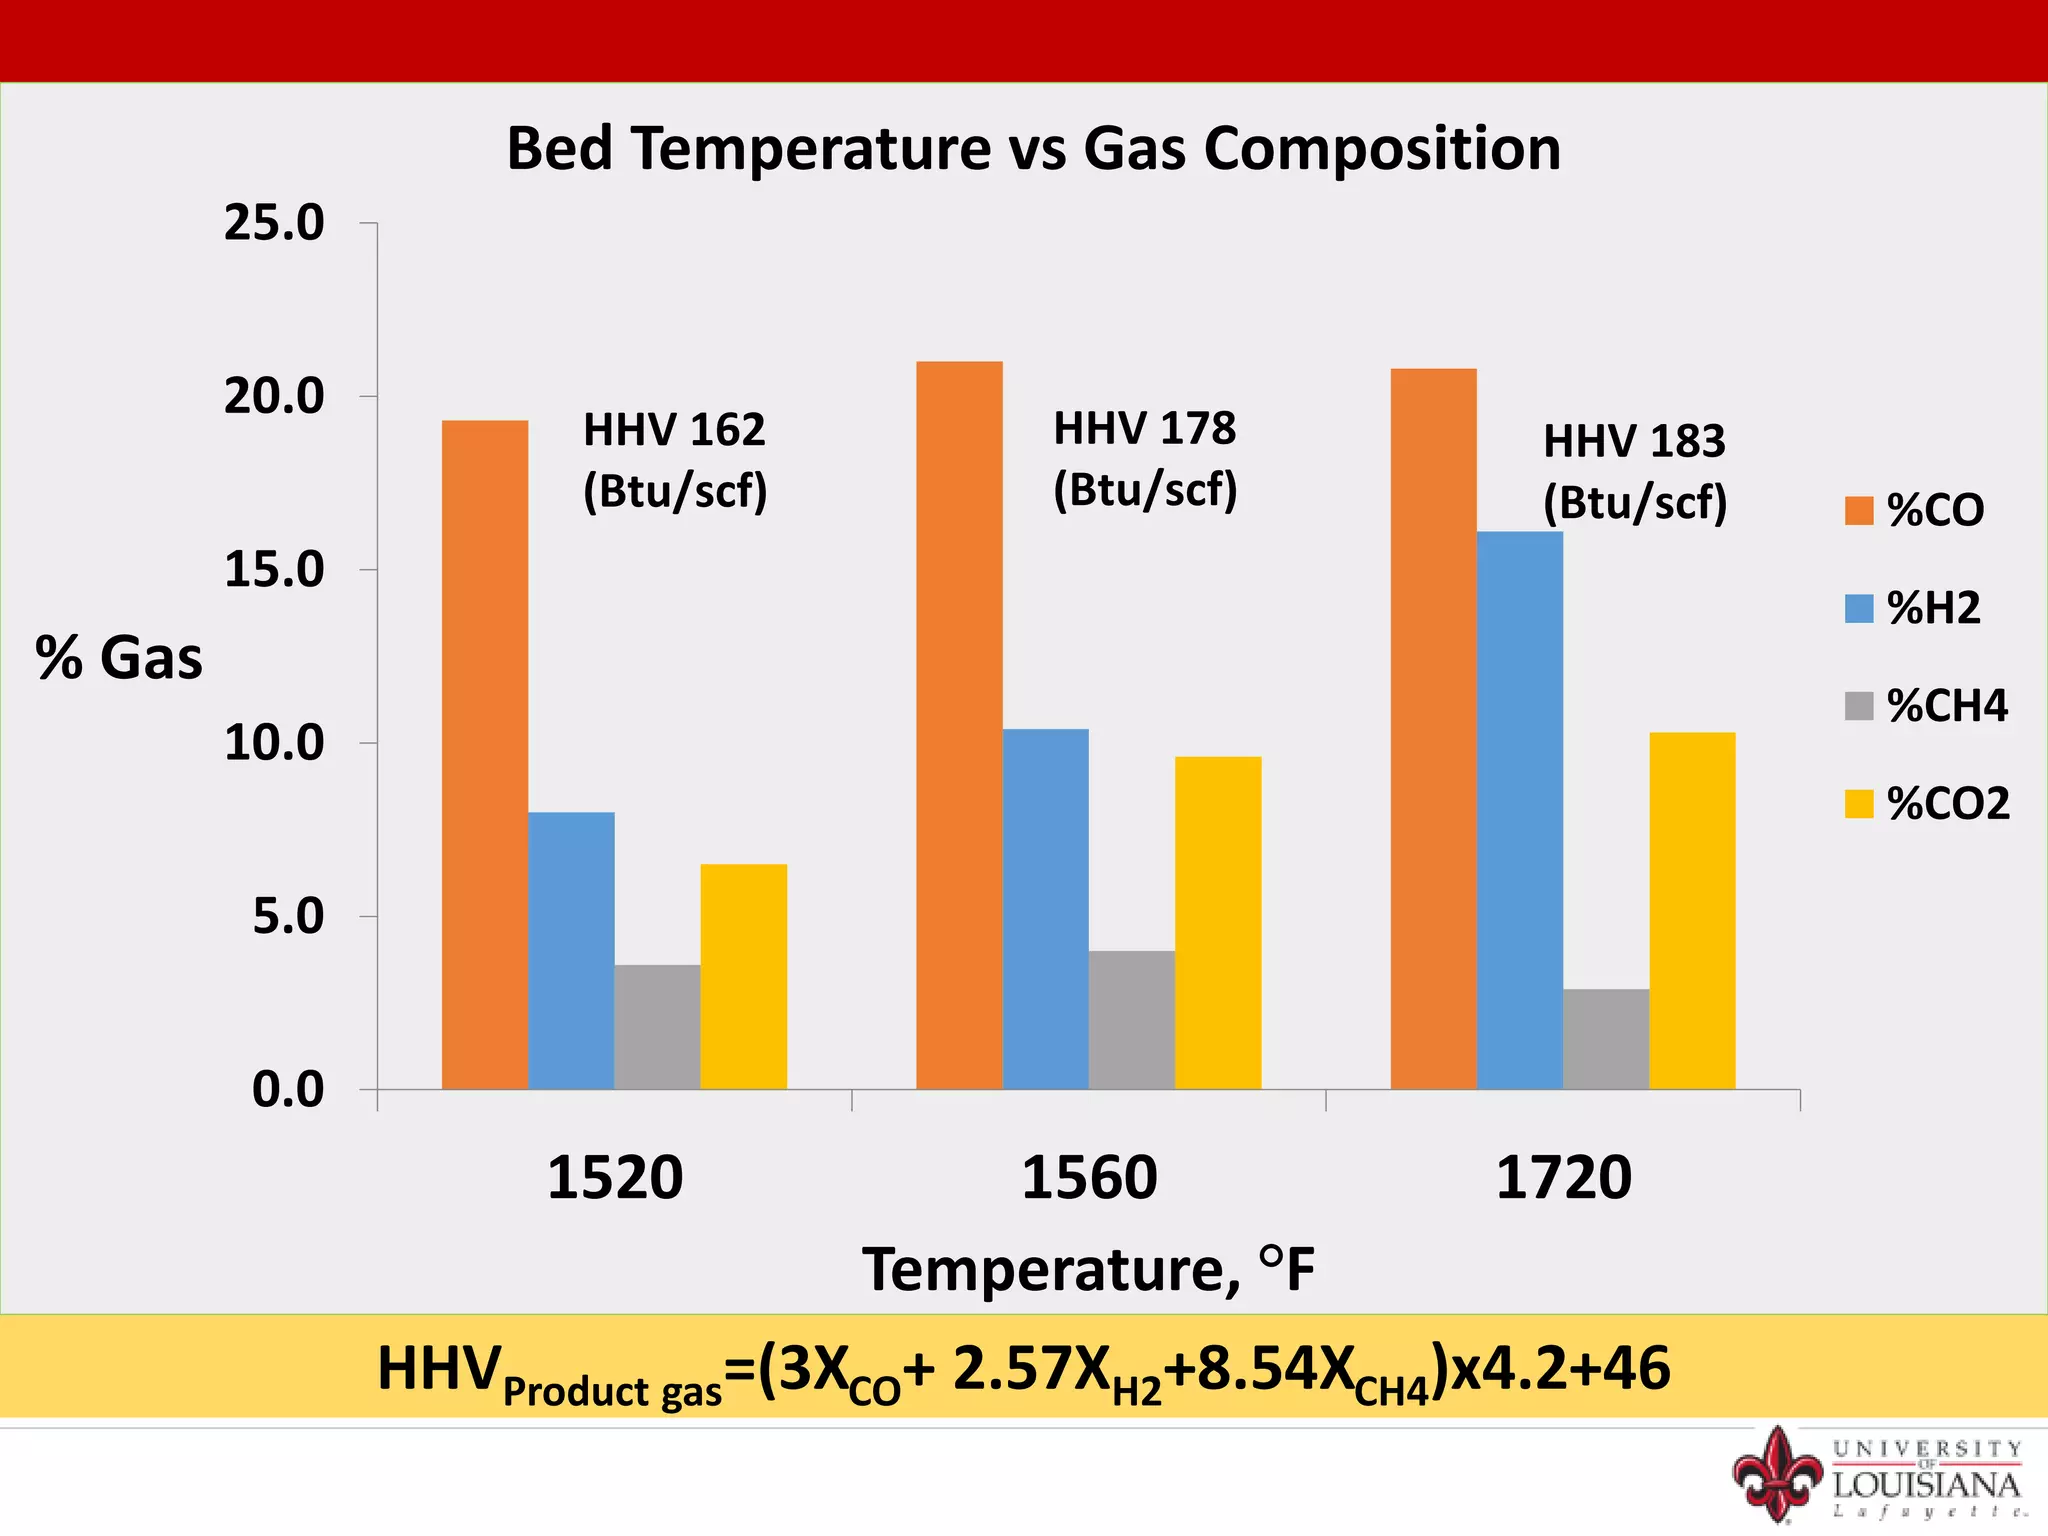
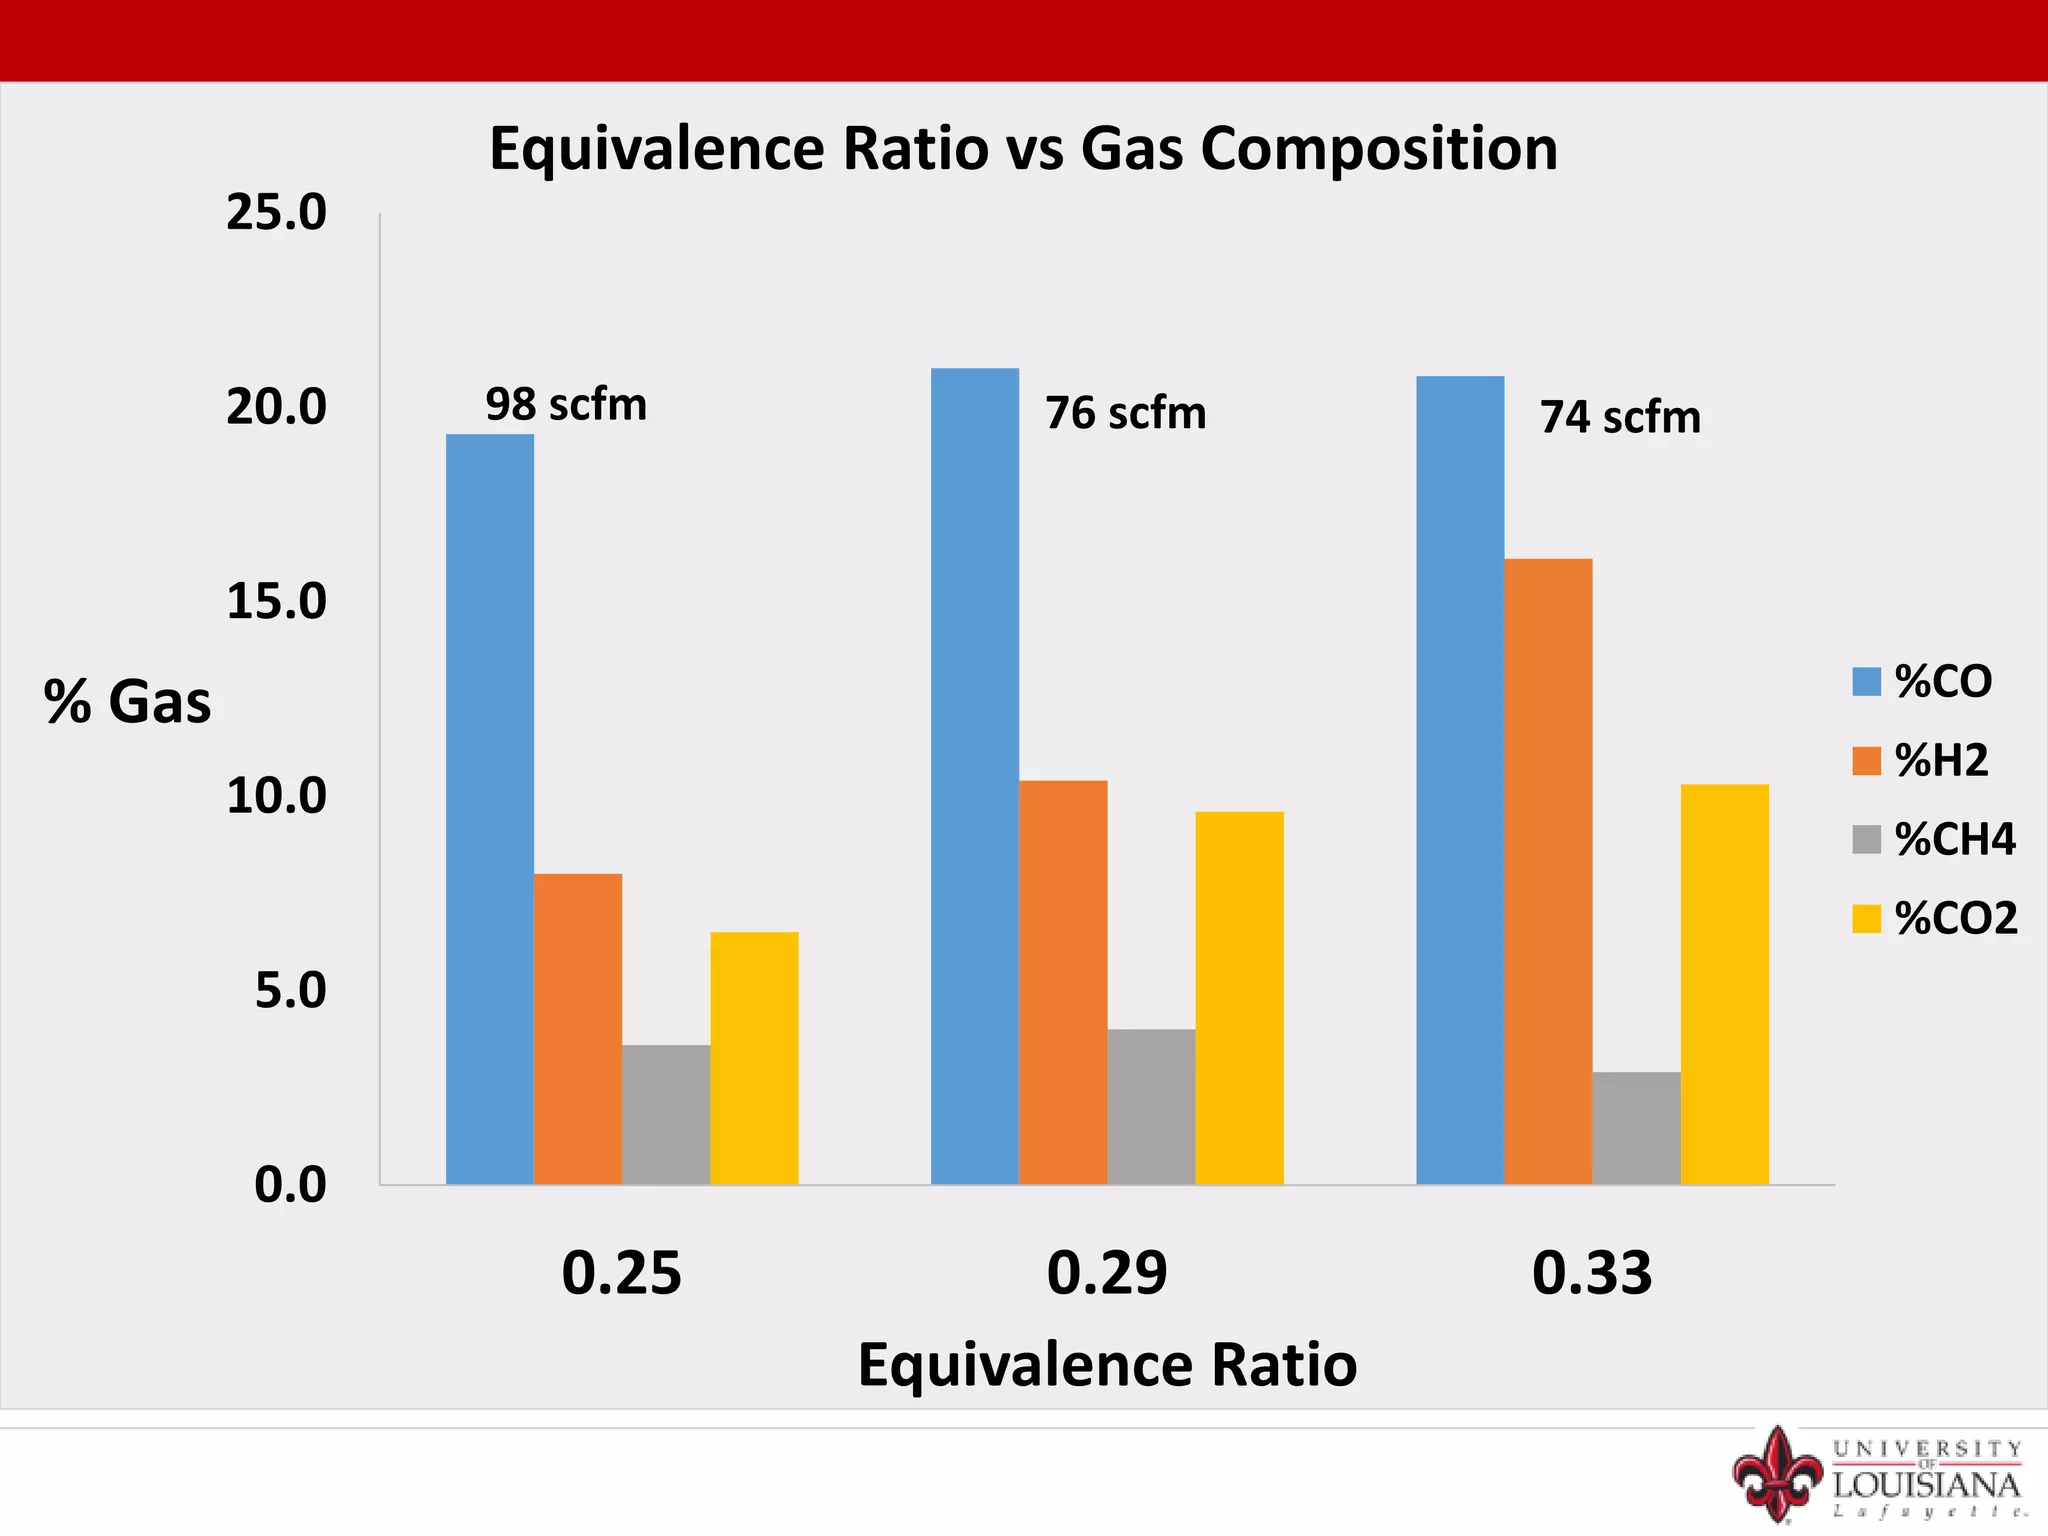
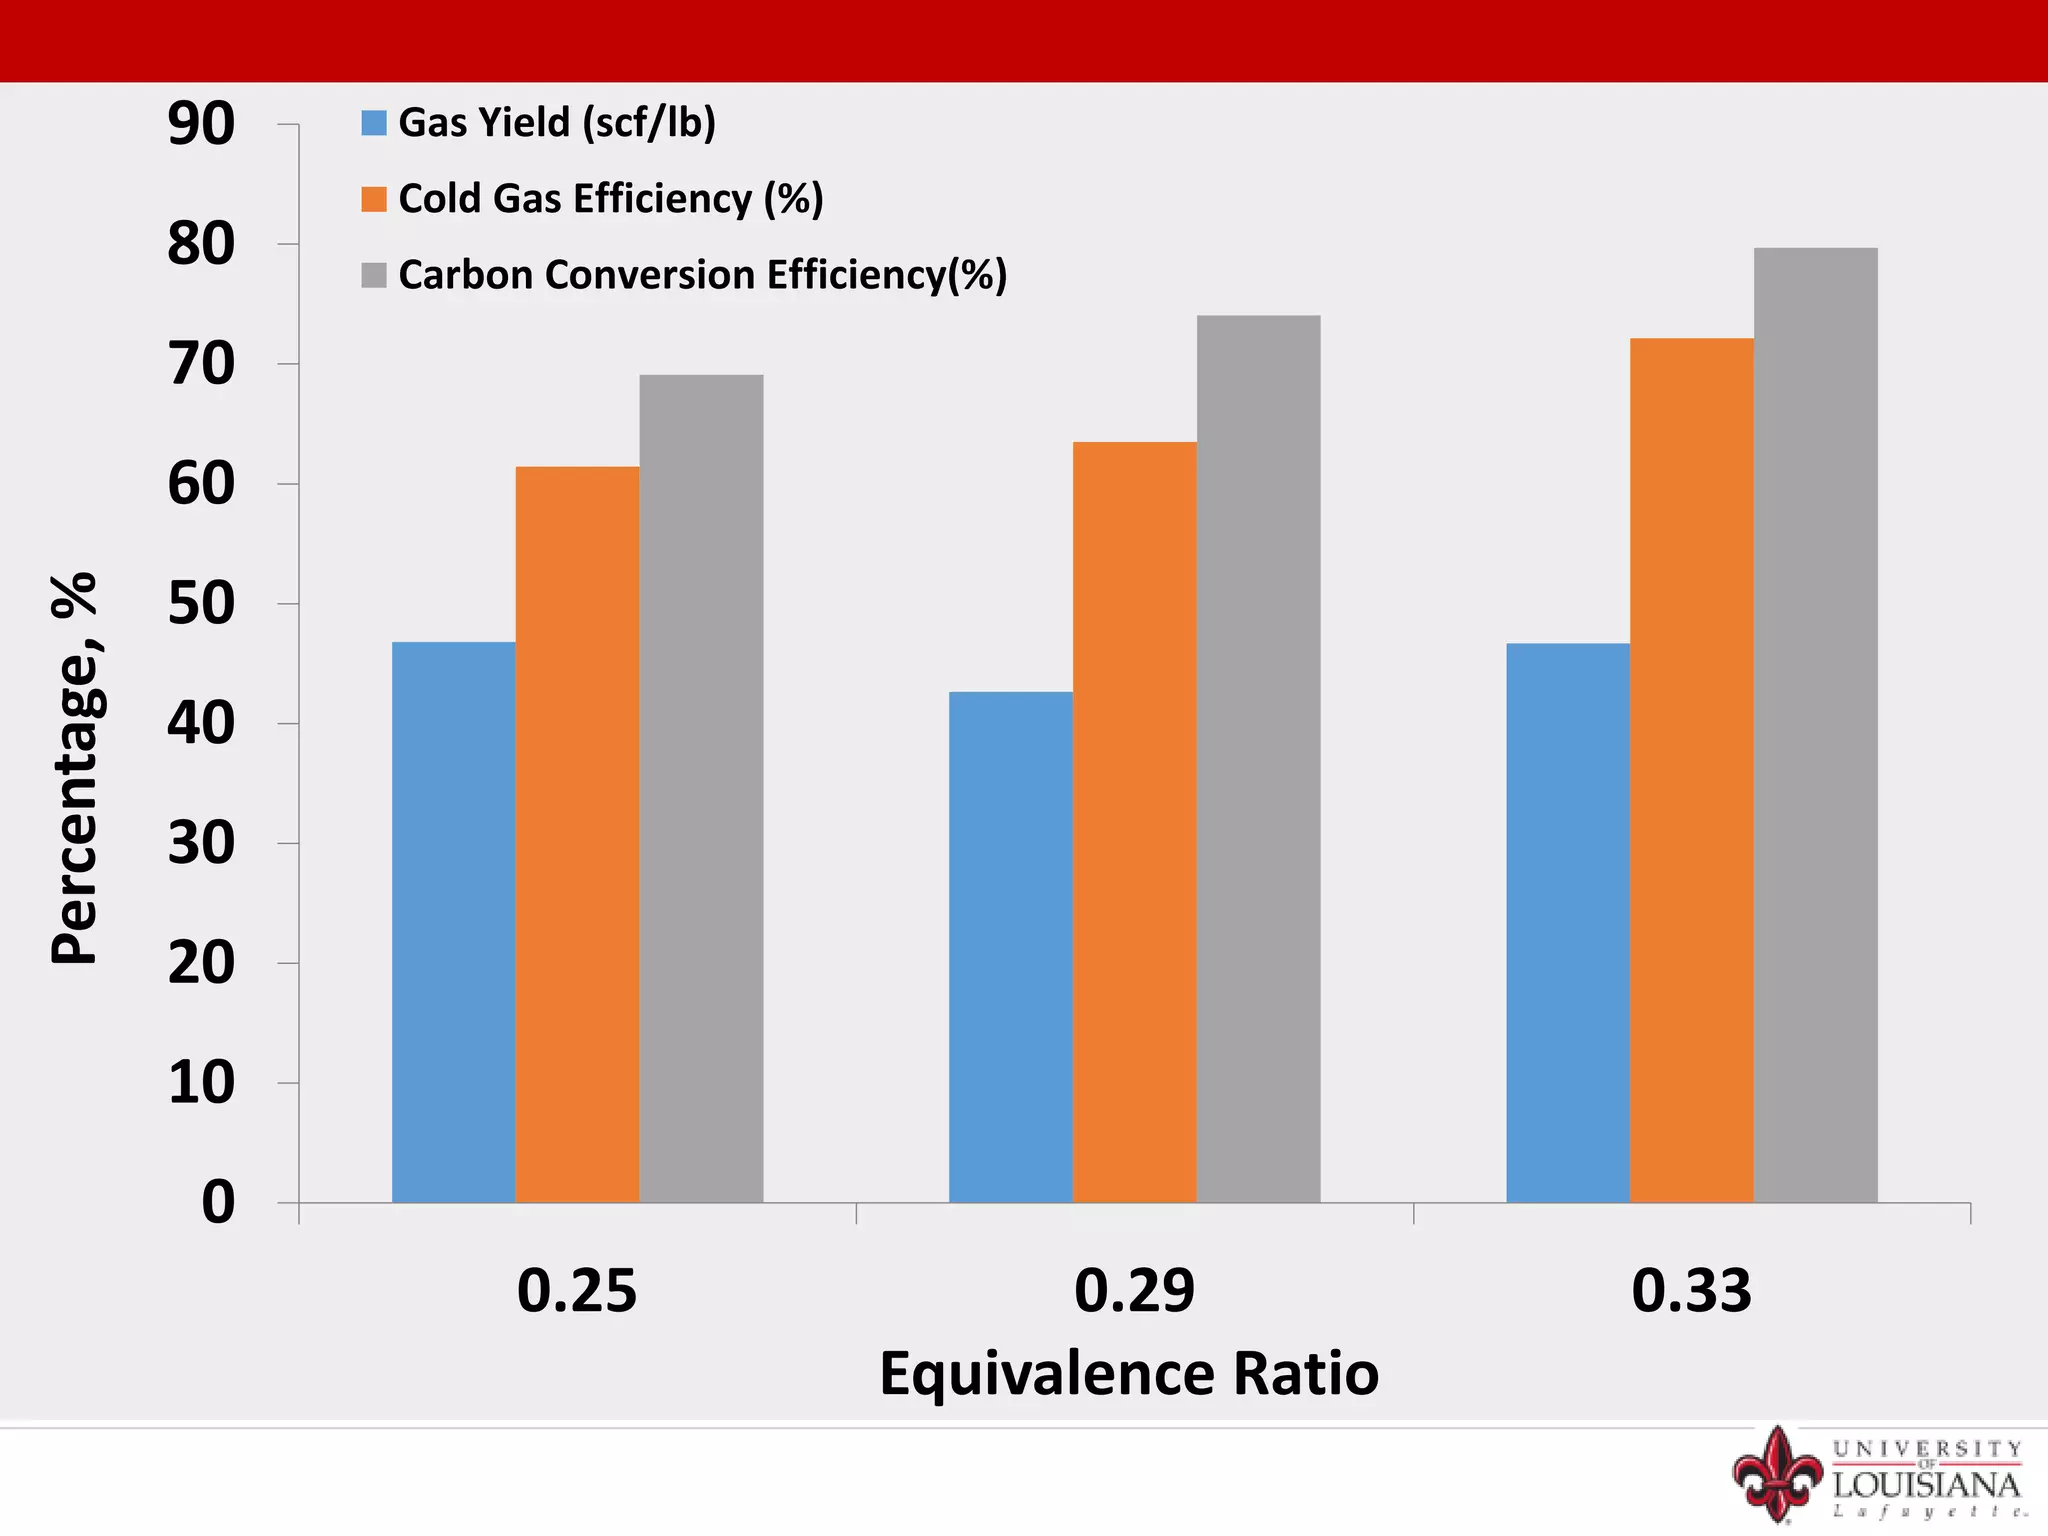
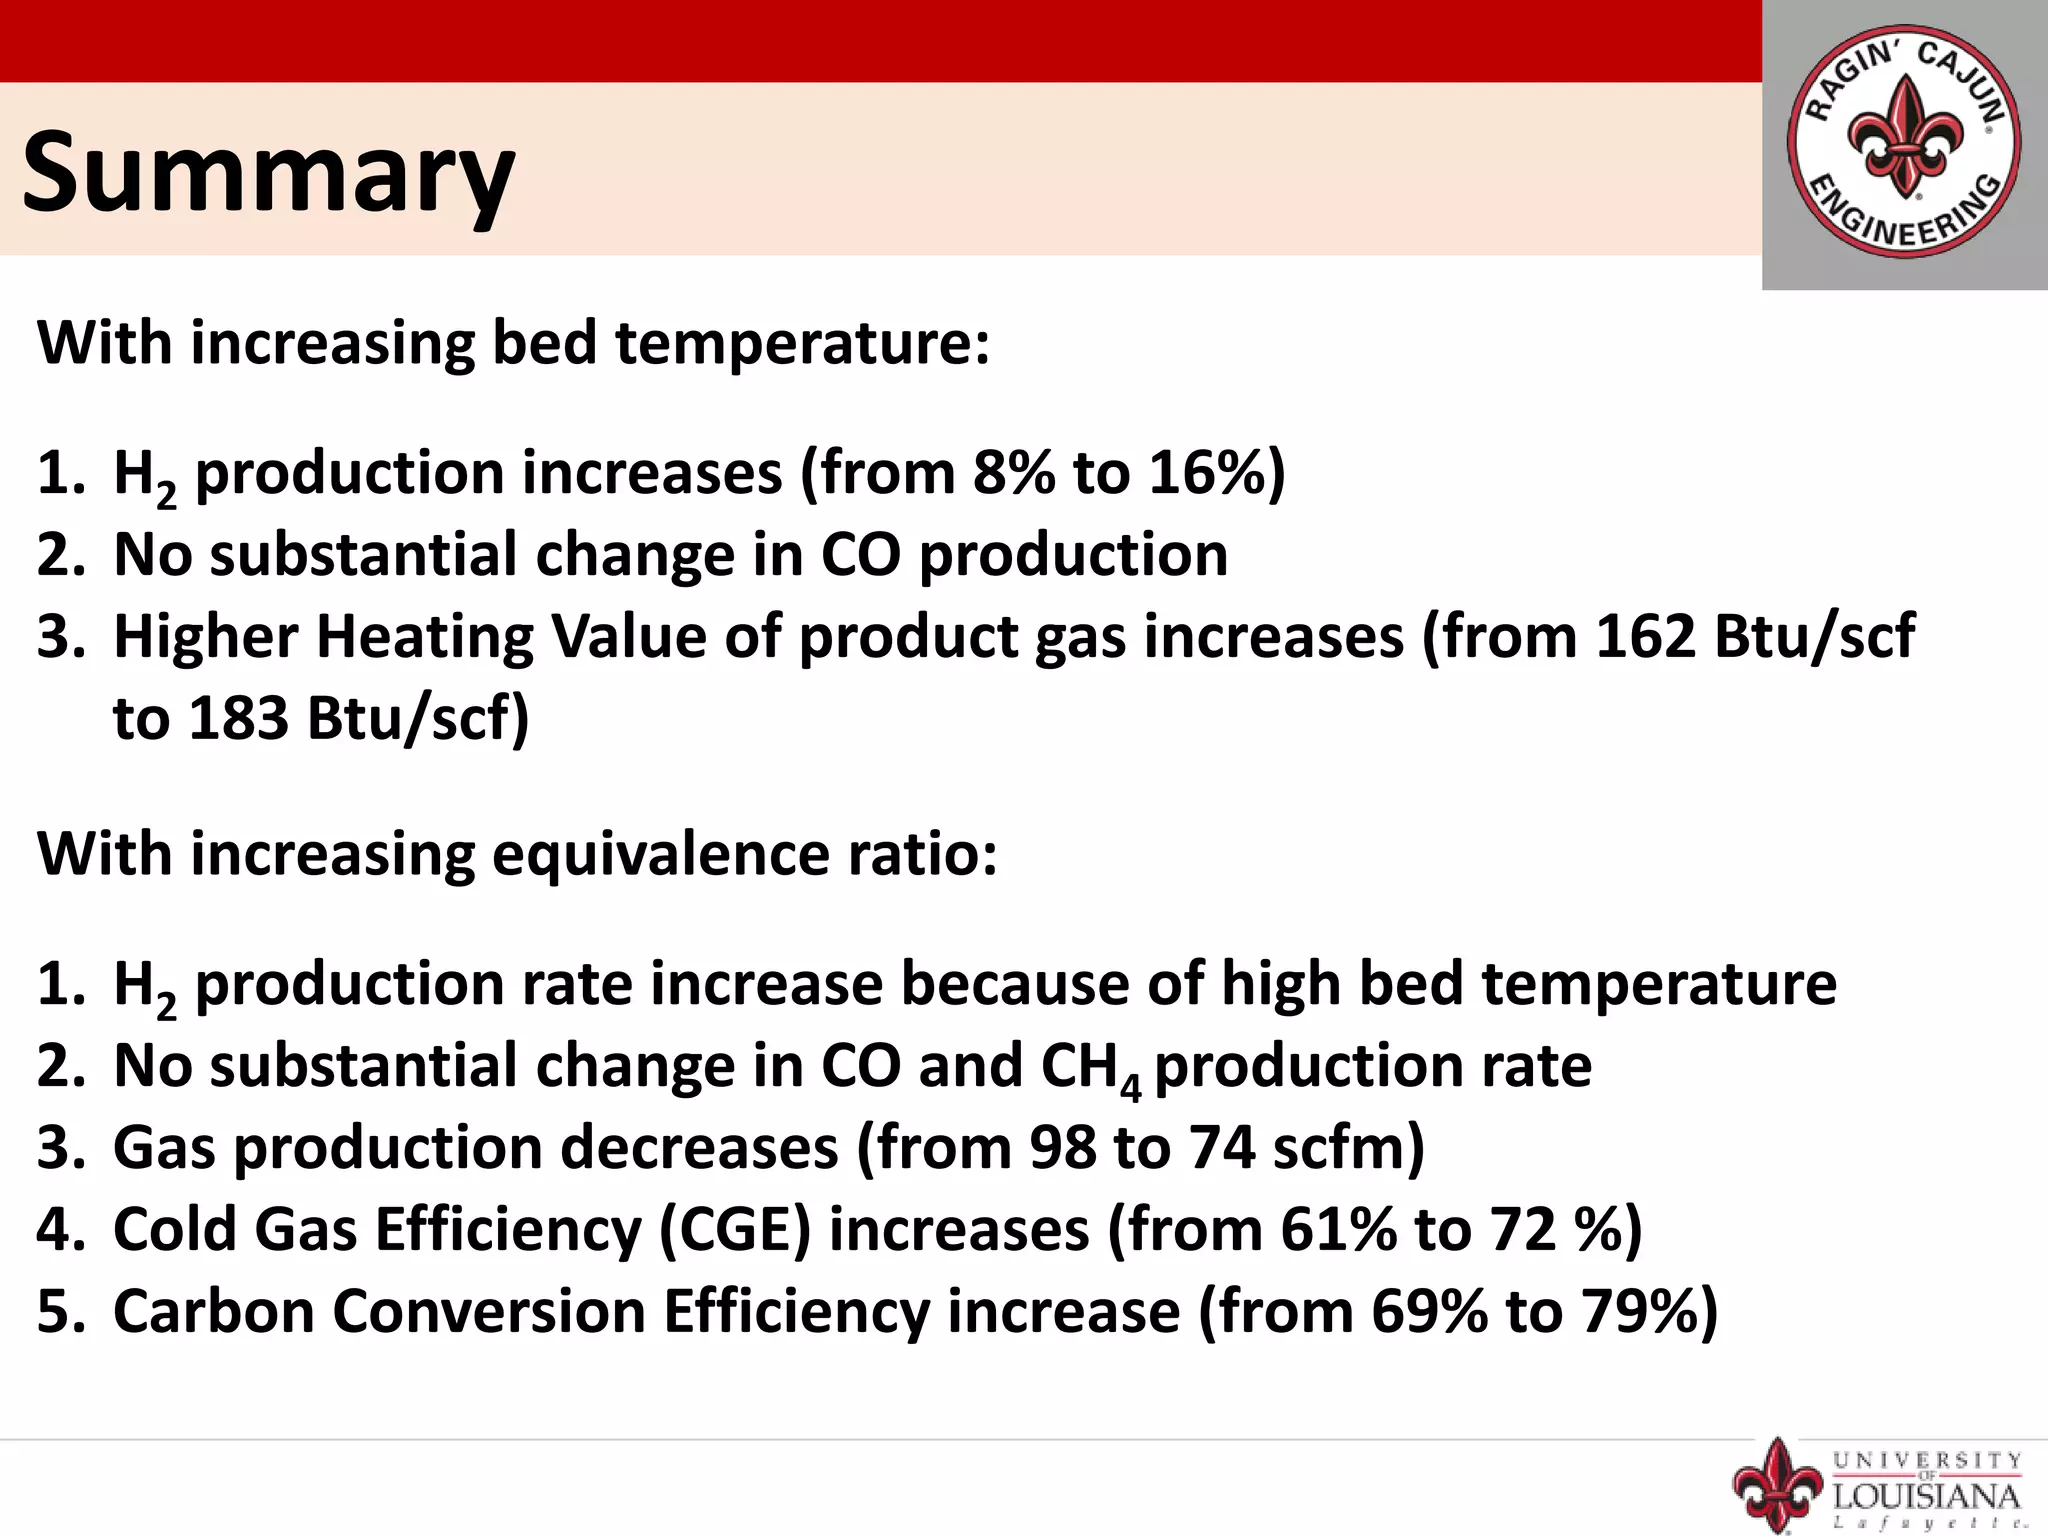


1. The document summarizes the performance of a 3 ton/day bubbling fluidized bed gasification system using pine wood chips as a feedstock. 2. Key findings include hydrogen production and heating value of the product gas increasing with higher bed temperature, while gas production and efficiencies increase with higher equivalence ratio. 3. Future goals are listed as installing tar reforming, testing steam/oxygen gasification, and using bed catalysts to improve syngas quality.


