Downloaded 178 times

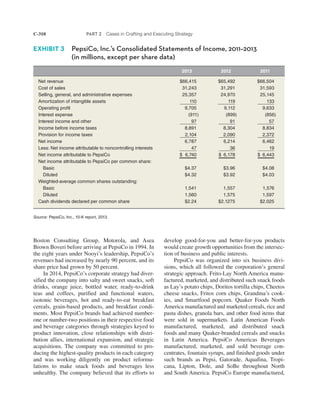
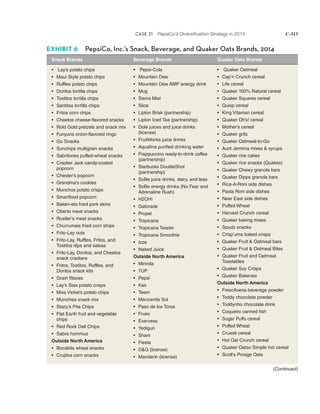

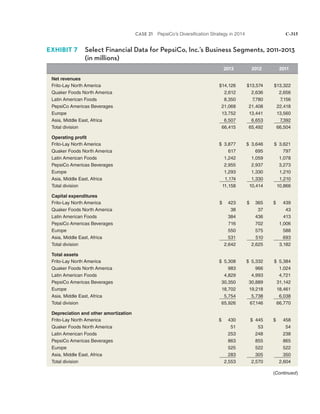
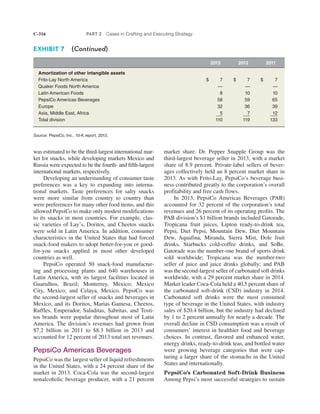

PepsiCo, the world's largest snack and beverage company, generated approximately $66.4 billion in net revenue in 2013, emphasizing capital returns to shareholders while pursuing efficiency and sustainability through its 'Performance with Purpose' plan. The company, known for acquiring major brands like Quaker Oats, has expanded its portfolio through strategic acquisitions and product innovations, contributing significantly to its revenue growth amid slowing overall growth since 2011. Under the leadership of various CEOs, including Indra Nooyi, PepsiCo diversified its offerings while maintaining a focus on health-conscious products and sustainability.


