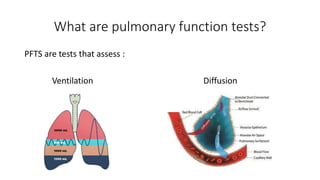
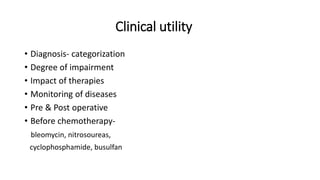
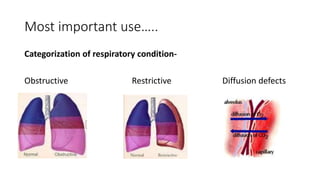
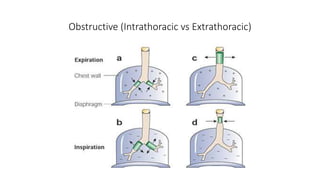
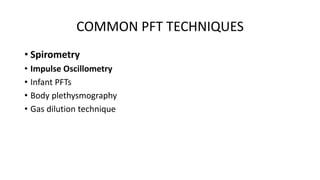
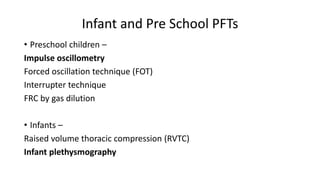
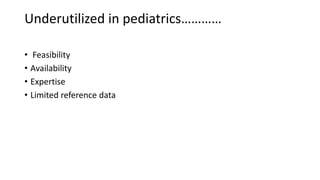
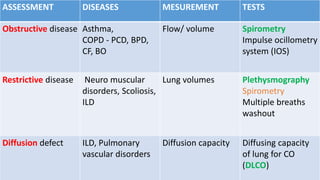
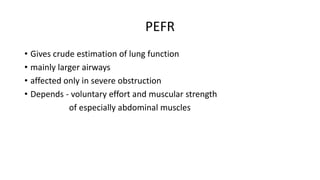
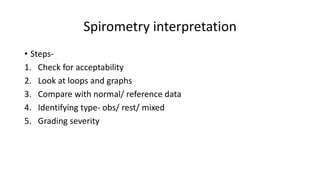
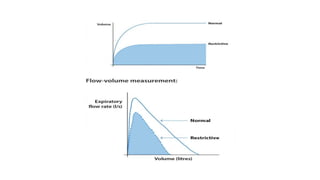
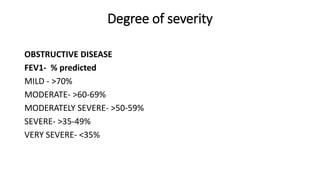
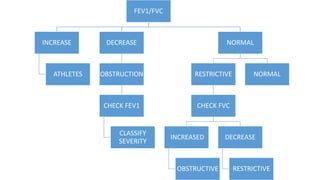
PULMONARY FUNCTION TESTS
IN INFANTS AND CHILDREN
What are pulmonary function tests?
PFTS are tests that assess :
Ventilation Diffusion
Clinical utility
• Diagnosis- categorization
• Degree of impairment
• Impact of therapies
• Monitoring of diseases
• Pre & Post operative
• Before chemotherapy-
bleomycin, nitrosoureas,
cyclophosphamide, busulfan
Most important use…..
Categorization of respiratory condition-
Obstructive Restrictive Diffusion defects
Obstructive (Intrathoracic vs Extrathoracic)
COMMON PFT TECHNIQUES
• Spirometry
• Impulse Oscillometry
• Infant PFTs
• Body plethysmography
• Gas dilution technique
Infant and Pre School PFTs
• Preschool children –
Impulse oscillometry
Forced oscillation technique (FOT)
Interrupter technique
FRC by gas dilution
• Infants –
Raised volume thoracic compression (RVTC)
Infant plethysmography
Underutilized in pediatrics…………
• Feasibility
• Availability
• Expertise
• Limited reference data
ASSESSMENT DISEASES MESUREMENT TESTS
Obstructive disease Asthma,
COPD - PCD, BPD,
CF, BO
Flow/ volume Spirometry
Impulse ocillometry
system (IOS)
Restrictive disease Neuro muscular
disorders, Scoliosis,
ILD
Lung volumes Plethysmography
Spirometry
Multiple breaths
washout
Diffusion defect ILD, Pulmonary
vascular disorders
Diffusion capacity Diffusing capacity
of lung for CO
(DLCO)
Spirometry
• “Measures the volume of air an individual inhales or exhales as a
function of time.” ( ATS1994)
• Gold std for diagnosis of obstructive airway diseases
• Objective tool
• Patient and effort dependent
Types of spirometers
Volume displacement- rolling piston method
Flow sensor based
Pneumatograph Anemometre
Turbine Ultrasonic
ULTRASONIC
• Transmitter and receiver perpendicular to air flow
• Use transit time flow measurement to determine flow and volume of air
• Higher accuracy and repeatability, portable, easy to use
Incentive Based Software
• Improves co ordination and motivation
• Different software available
• Provides visual cues so that desired flow and volume is achieved.
• Blowing of candle, blowing a bubble gum, watering by elephant trunk
Pre-requisites
Age criteria
• Done in children more than 6years of age
• Not suitable in children less than 6 years as
Effort dependent
Needs patient co-operation
Studies in preschool children (2-6) nearly 86% aged 3-6 years,75% aged
2-5 years and 55% aged 3-5 years were able to perform acceptable
spirometry in studies by Eigen et al,Aurora et al and Crenesse et al
respectively Add more details /Tabulate
Contraindications (Absolute)
ANY SICK CHILD
1. Increase in ICP/ICT- recent brain surgery/ eye surgery/ cerebral
aneurysm
2. Cardiac conditions- recent stroke, uncontrolled HTN, non
compensated CHF
3. Increased intrathoracic / intraabdominal pressure- pneumothorax ,
recent abdo or thoracic surgery
4. Hemoptysis
Contraindication (relative)
• Caffeinated drink, past 6 hours
• Heavy exercise, past 1 hour
• LRTI past 2 weeks
• Bronchodilators
SABA- 6 HOURS
Ipratropium- 12 Hours
LABA (Salmeterol/Formeterol)- 24 Hours
Ultra LABA (Vilanterol)- 36 Hours
Physiology
Lung volumes, capacities and maneuvers
1. Full
inspiration to
IRV
2. Hard and fast
expiration to
ERV
3. continue till
RV
How to perform spirometry?
Communication
PRE-TEST COUNSELLING
• Patient to be made comfortable
• Eliminate anxiety
• Demonstrate the test 2/3 days
prior
DURING THE TEST
• Constant reassuarance
• Enthusiastic Coaching
Post Test
• Appreciate effort given by
patient
• Repeat if necessary
Procedure
• Demonstrate the “3 step” manoeuvre of:
1) Taking a deep breath in = maximal inspiration
2) Blow out forcefully = blast of exhalation
3) Continue to blow till no more air can be expired = complete
exhalation
• prompted to‘‘blast,’’ not just ‘‘blow,’’ the air
• enthusiastic coaching of the subject
• minimum of 3 manoeuvres; no more than 8
Bronchodilator response testing
• 400 mics of salbutamol or 320 mics of ipratropium
• reversible airway obstruction if any 2 out of 3 improves
1. FVC : >10%
2. FEV1: >200 ml or 15% of the baseline
3. FEF25-75% : >20%
• Negative response does not exclude asthma
When to stop?
• 3 acceptable and 2 reproducible graphs
• Test maximum 8 times
• Stop if patient feels light headed, headache or fainting
Displays and measures
2
Graphs
Volume
time
graph
Flow
volume
loop
2
Volumes
FVC
FEV1
2
Flows
PEFR
FEF 25-
75%
NOT
measured
RV
FRC
TLC
FLOW VOULME CURVE
V-T curve
Measures volume of air which
flow out as a measure of time
Allows to evaluate completeness
of procedure
PEFR
• Gives crude estimation of lung function
• mainly larger airways
• affected only in severe obstruction
• Depends - voluntary effort and muscular strength
of especially abdominal muscles
FEF 25-75%
• Mean flow at middle half of forced expiratory manoeuvre
• Small airway obstruction
• ? Earliest indicator, ? Better > FEV/FVC
• Utility in OAD- limited
- Studied on 22,767 (3-94 years)
- Result widely scattered
- Doesn’t helps over and above FEV1, FVC and ratio.
Quanzer et al Eu Resp J 2014
Spirometry interpretation
• Steps-
1. Check for acceptability
2. Look at loops and graphs
3. Compare with normal/ reference data
4. Identifying type- obs/ rest/ mixed
5. Grading severity
Step 1
Acceptability Criteria
• Max of 8 attempts in a session
• Minimum 3 acceptable curves
Max. Inspiration
Good Start- Steep rise to PEF
Satisfactory Exhalation – 3 sec
Plateau- last sec of exhalation
Free of artefacts
Repeatability- FEV1 & FVC - <150ml between 2.
ATS/ESR 2019
Step 2
EARLY TERMINATION
VARIABLE EFFORT
IDENTIFICATION TEST
IMPLICATION
SOLUTION
Lack of plateau
in VT curve
Falsely reduced
fvc
Coach subject
expire fully
Dip in the FV
curve
Reduce FEV1
and FEV1/FVC
ratio
Coach to blast
hard and fast
CESSATION OF AIRFLOW-GLOTTIC CLOSURE AND
BREATH HOLDING
PARTIALLY OBSTRUCTED MOUTHPIECE
IDENTIFICATION TEST IMPLICATION SOLUTION
Abrupt horizontal
line in VT
Sharp drop to zero
in FV curve
FVC falsely
reduced
FEV1/FVC falsely
elevated
Coach the subject
to blow until told
to stop.
Reduce peak flow
and flat curve in
VF
VT shows
flattening after
initial rise
FVC reduced
FEV1 may be
reduced
Coach to place
mouthpiece
between teeth
and top of tongue
SUBMAXIMAL INHALATION
SUBMAXIMAL BLAST
IDENTIFICATION TEST IMPLICATION SOLUTION
Gap between FVC
curve in VT
Space between
ending points in
FV
Falsely reduced
FVC
Coach subject to
inspire fully
Slow rise in VT
curve
Lown peak in FV
loop
Reduced FEV1 ans
FEV1/FVC ratio
Coach to blast out
harder
EXTRA BREATH
Cough in 1st sec
IDENTIFICATION TEST IMPLICATION SOLUTION
Jagged
interruption in FV
loop
Reduced FEV1 Offer drink before
maneouver
VT curve shows
steps added
FVC falsely
elevated
Use nose
clips,tight around
mouthpiece
Step 3
What is normal?
Predicted values (Pred)
• 80% for fvc/ fev1/ratio >10 years
• 90% for fvc/ fev1/ratio <10 years
• FEF25-75% >50-60% of predicted value
Reference values
• Z scores/LLN (lower limit of normal)
• depends on age/ wt/ ht/ ethnicity
• Inbuilt in software
STEP 4
Obstructive airway disease
• Reduction of airflow during exhalation – FEV1 low
• FVC – Normal (except sev. obstruction)
• Decreased FEV1/FVC
• Bronchodilator response
Restrictive airway disease
• Airflow is reduced : decrease in lung volume (low FVC)
• Decreased FVC (<80% of predicted)
• No airway obstruction
• N or decreased FEV1 (proportionate)
• Ratio of FEV1 to FVC remains unchanged
Step 5
Degree of severity
OBSTRUCTIVE DISEASE
FEV1- % predicted
MILD - >70%
MODERATE- >60-69%
MODERATELY SEVERE- >50-59%
SEVERE- >35-49%
VERY SEVERE- <35%
RESTRICTIVE DISEASE
TLC <80%
• 70-80%- Mild
• 60—70%- Moderate
• 50-60%- Moderately severe
• <50%- Severe
Need of inspiratory loop? F- V loop in Central airway
obstruction
FEV1/FVC
INCREASE
ATHLETES
DECREASE
OBSTRUCTION
CHECK FEV1
CLASSIFY
SEVERITY
NORMAL
RESTRICTIVE
CHECK FVC
INCREASED
OBSTRUCTIVE
DECREASE
RESTRICTIVE
NORMAL
PFTs other than spirometry
Peak flowmeter
Helps in detecting impending exacerbation
Not diagnostic
Divided in 3 zones
Green zone -80-100% predicted
Yellow zone- 50-80% predicted
Red zone- <50% predicted
• Highest measurement achieved when patient is free from symptoms
• Recorded twice a day over a period of 2-3 weeks when asthma is
controlled
• If PEFR decreases by >20% of personal best, likely to be onset of
exacerbation
Plethysmography
• FRC, TLC , RV & specific airway resistance
• Principle- changes in alveolar pressure is interfered from
plethysmograph pressure
BOYLE’S LAW:
PV = CONSTANT (at constant temp.)
Thank you
Images free to download were taken from google, in case of copyright issues please contact us-
deepakk70@gmail, we will immediately remove them.

Pediatric pulmonary function tests

  • 1.
    PULMONARY FUNCTION TESTS ININFANTS AND CHILDREN
  • 2.
    What are pulmonaryfunction tests? PFTS are tests that assess : Ventilation Diffusion
  • 3.
    Clinical utility • Diagnosis-categorization • Degree of impairment • Impact of therapies • Monitoring of diseases • Pre & Post operative • Before chemotherapy- bleomycin, nitrosoureas, cyclophosphamide, busulfan
  • 4.
    Most important use….. Categorizationof respiratory condition- Obstructive Restrictive Diffusion defects
  • 5.
  • 6.
    COMMON PFT TECHNIQUES •Spirometry • Impulse Oscillometry • Infant PFTs • Body plethysmography • Gas dilution technique
  • 7.
    Infant and PreSchool PFTs • Preschool children – Impulse oscillometry Forced oscillation technique (FOT) Interrupter technique FRC by gas dilution • Infants – Raised volume thoracic compression (RVTC) Infant plethysmography
  • 8.
    Underutilized in pediatrics………… •Feasibility • Availability • Expertise • Limited reference data
  • 9.
    ASSESSMENT DISEASES MESUREMENTTESTS Obstructive disease Asthma, COPD - PCD, BPD, CF, BO Flow/ volume Spirometry Impulse ocillometry system (IOS) Restrictive disease Neuro muscular disorders, Scoliosis, ILD Lung volumes Plethysmography Spirometry Multiple breaths washout Diffusion defect ILD, Pulmonary vascular disorders Diffusion capacity Diffusing capacity of lung for CO (DLCO)
  • 10.
    Spirometry • “Measures thevolume of air an individual inhales or exhales as a function of time.” ( ATS1994) • Gold std for diagnosis of obstructive airway diseases • Objective tool • Patient and effort dependent
  • 11.
    Types of spirometers Volumedisplacement- rolling piston method
  • 12.
    Flow sensor based PneumatographAnemometre Turbine Ultrasonic
  • 13.
    ULTRASONIC • Transmitter andreceiver perpendicular to air flow • Use transit time flow measurement to determine flow and volume of air • Higher accuracy and repeatability, portable, easy to use
  • 14.
    Incentive Based Software •Improves co ordination and motivation • Different software available • Provides visual cues so that desired flow and volume is achieved. • Blowing of candle, blowing a bubble gum, watering by elephant trunk
  • 15.
  • 16.
    Age criteria • Donein children more than 6years of age • Not suitable in children less than 6 years as Effort dependent Needs patient co-operation Studies in preschool children (2-6) nearly 86% aged 3-6 years,75% aged 2-5 years and 55% aged 3-5 years were able to perform acceptable spirometry in studies by Eigen et al,Aurora et al and Crenesse et al respectively Add more details /Tabulate
  • 17.
    Contraindications (Absolute) ANY SICKCHILD 1. Increase in ICP/ICT- recent brain surgery/ eye surgery/ cerebral aneurysm 2. Cardiac conditions- recent stroke, uncontrolled HTN, non compensated CHF 3. Increased intrathoracic / intraabdominal pressure- pneumothorax , recent abdo or thoracic surgery 4. Hemoptysis
  • 18.
    Contraindication (relative) • Caffeinateddrink, past 6 hours • Heavy exercise, past 1 hour • LRTI past 2 weeks • Bronchodilators SABA- 6 HOURS Ipratropium- 12 Hours LABA (Salmeterol/Formeterol)- 24 Hours Ultra LABA (Vilanterol)- 36 Hours
  • 19.
  • 20.
    Lung volumes, capacitiesand maneuvers 1. Full inspiration to IRV 2. Hard and fast expiration to ERV 3. continue till RV
  • 21.
    How to performspirometry?
  • 22.
    Communication PRE-TEST COUNSELLING • Patientto be made comfortable • Eliminate anxiety • Demonstrate the test 2/3 days prior DURING THE TEST • Constant reassuarance • Enthusiastic Coaching Post Test • Appreciate effort given by patient • Repeat if necessary
  • 23.
    Procedure • Demonstrate the“3 step” manoeuvre of: 1) Taking a deep breath in = maximal inspiration 2) Blow out forcefully = blast of exhalation 3) Continue to blow till no more air can be expired = complete exhalation • prompted to‘‘blast,’’ not just ‘‘blow,’’ the air • enthusiastic coaching of the subject • minimum of 3 manoeuvres; no more than 8
  • 24.
    Bronchodilator response testing •400 mics of salbutamol or 320 mics of ipratropium • reversible airway obstruction if any 2 out of 3 improves 1. FVC : >10% 2. FEV1: >200 ml or 15% of the baseline 3. FEF25-75% : >20% • Negative response does not exclude asthma
  • 25.
    When to stop? •3 acceptable and 2 reproducible graphs • Test maximum 8 times • Stop if patient feels light headed, headache or fainting
  • 26.
  • 27.
  • 28.
    V-T curve Measures volumeof air which flow out as a measure of time Allows to evaluate completeness of procedure
  • 29.
    PEFR • Gives crudeestimation of lung function • mainly larger airways • affected only in severe obstruction • Depends - voluntary effort and muscular strength of especially abdominal muscles
  • 30.
    FEF 25-75% • Meanflow at middle half of forced expiratory manoeuvre • Small airway obstruction • ? Earliest indicator, ? Better > FEV/FVC • Utility in OAD- limited - Studied on 22,767 (3-94 years) - Result widely scattered - Doesn’t helps over and above FEV1, FVC and ratio. Quanzer et al Eu Resp J 2014
  • 31.
    Spirometry interpretation • Steps- 1.Check for acceptability 2. Look at loops and graphs 3. Compare with normal/ reference data 4. Identifying type- obs/ rest/ mixed 5. Grading severity
  • 32.
  • 33.
    Acceptability Criteria • Maxof 8 attempts in a session • Minimum 3 acceptable curves Max. Inspiration Good Start- Steep rise to PEF Satisfactory Exhalation – 3 sec Plateau- last sec of exhalation Free of artefacts Repeatability- FEV1 & FVC - <150ml between 2. ATS/ESR 2019
  • 34.
  • 35.
    EARLY TERMINATION VARIABLE EFFORT IDENTIFICATIONTEST IMPLICATION SOLUTION Lack of plateau in VT curve Falsely reduced fvc Coach subject expire fully Dip in the FV curve Reduce FEV1 and FEV1/FVC ratio Coach to blast hard and fast
  • 36.
    CESSATION OF AIRFLOW-GLOTTICCLOSURE AND BREATH HOLDING PARTIALLY OBSTRUCTED MOUTHPIECE IDENTIFICATION TEST IMPLICATION SOLUTION Abrupt horizontal line in VT Sharp drop to zero in FV curve FVC falsely reduced FEV1/FVC falsely elevated Coach the subject to blow until told to stop. Reduce peak flow and flat curve in VF VT shows flattening after initial rise FVC reduced FEV1 may be reduced Coach to place mouthpiece between teeth and top of tongue
  • 37.
    SUBMAXIMAL INHALATION SUBMAXIMAL BLAST IDENTIFICATIONTEST IMPLICATION SOLUTION Gap between FVC curve in VT Space between ending points in FV Falsely reduced FVC Coach subject to inspire fully Slow rise in VT curve Lown peak in FV loop Reduced FEV1 ans FEV1/FVC ratio Coach to blast out harder
  • 38.
    EXTRA BREATH Cough in1st sec IDENTIFICATION TEST IMPLICATION SOLUTION Jagged interruption in FV loop Reduced FEV1 Offer drink before maneouver VT curve shows steps added FVC falsely elevated Use nose clips,tight around mouthpiece
  • 39.
  • 40.
    What is normal? Predictedvalues (Pred) • 80% for fvc/ fev1/ratio >10 years • 90% for fvc/ fev1/ratio <10 years • FEF25-75% >50-60% of predicted value Reference values • Z scores/LLN (lower limit of normal) • depends on age/ wt/ ht/ ethnicity • Inbuilt in software
  • 41.
  • 42.
    Obstructive airway disease •Reduction of airflow during exhalation – FEV1 low • FVC – Normal (except sev. obstruction) • Decreased FEV1/FVC • Bronchodilator response
  • 44.
    Restrictive airway disease •Airflow is reduced : decrease in lung volume (low FVC) • Decreased FVC (<80% of predicted) • No airway obstruction • N or decreased FEV1 (proportionate) • Ratio of FEV1 to FVC remains unchanged
  • 46.
  • 47.
    Degree of severity OBSTRUCTIVEDISEASE FEV1- % predicted MILD - >70% MODERATE- >60-69% MODERATELY SEVERE- >50-59% SEVERE- >35-49% VERY SEVERE- <35%
  • 48.
    RESTRICTIVE DISEASE TLC <80% •70-80%- Mild • 60—70%- Moderate • 50-60%- Moderately severe • <50%- Severe
  • 49.
    Need of inspiratoryloop? F- V loop in Central airway obstruction
  • 50.
  • 51.
    PFTs other thanspirometry
  • 52.
    Peak flowmeter Helps indetecting impending exacerbation Not diagnostic Divided in 3 zones Green zone -80-100% predicted Yellow zone- 50-80% predicted Red zone- <50% predicted
  • 53.
    • Highest measurementachieved when patient is free from symptoms • Recorded twice a day over a period of 2-3 weeks when asthma is controlled • If PEFR decreases by >20% of personal best, likely to be onset of exacerbation
  • 56.
    Plethysmography • FRC, TLC, RV & specific airway resistance • Principle- changes in alveolar pressure is interfered from plethysmograph pressure BOYLE’S LAW: PV = CONSTANT (at constant temp.)
  • 58.
    Thank you Images freeto download were taken from google, in case of copyright issues please contact us- deepakk70@gmail, we will immediately remove them.