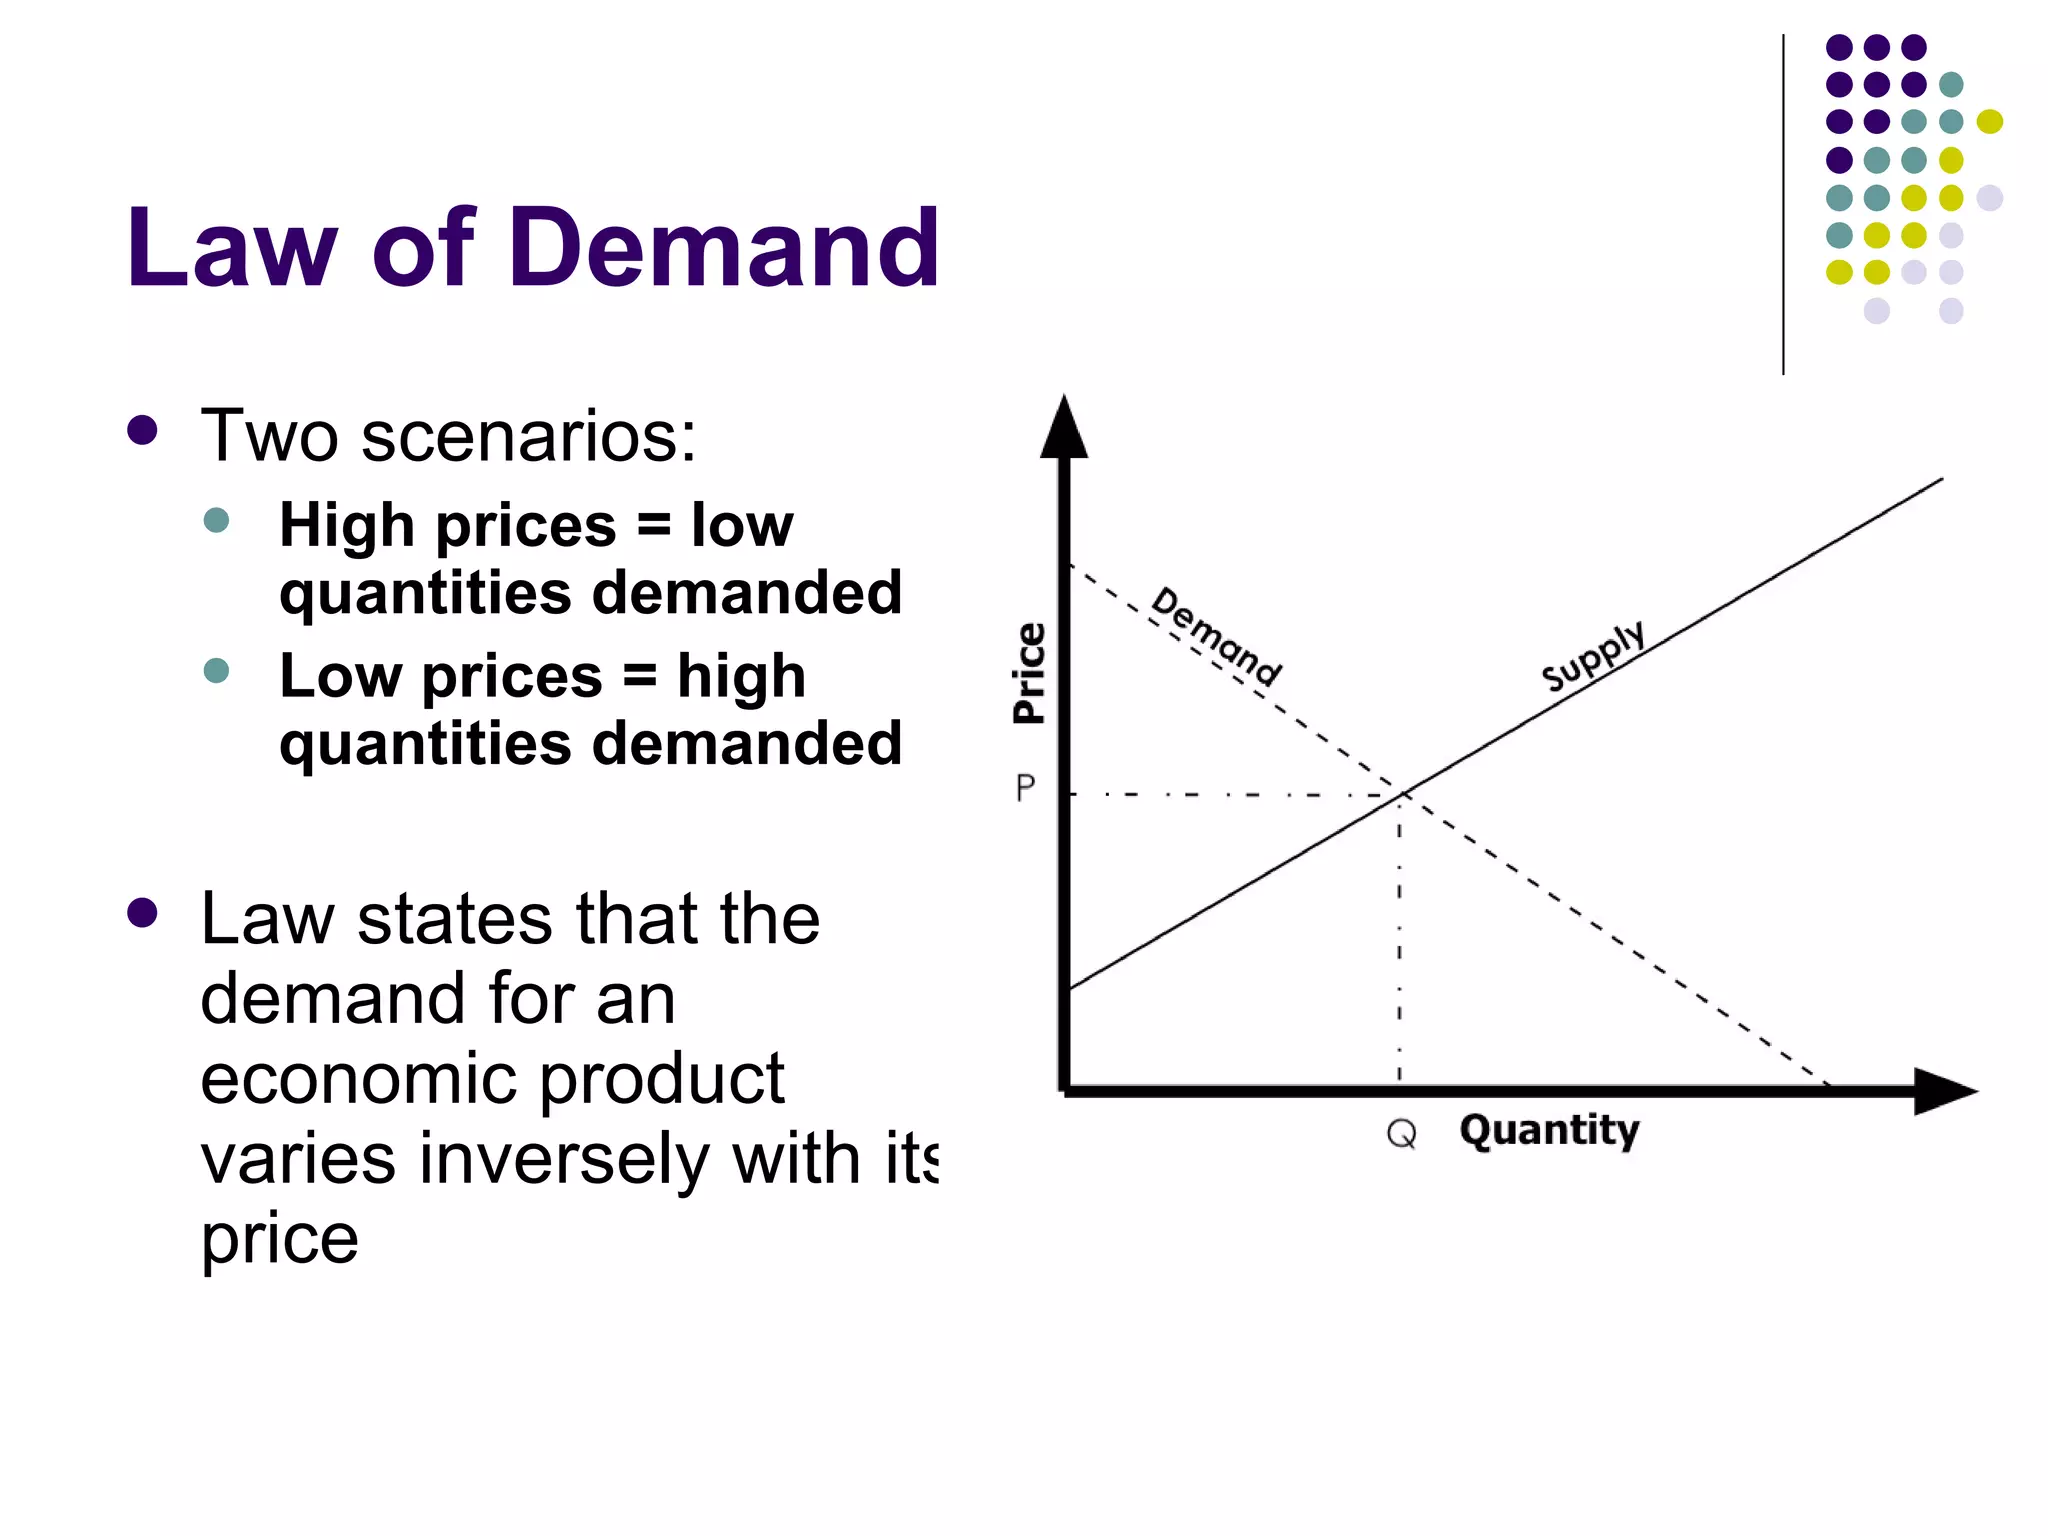
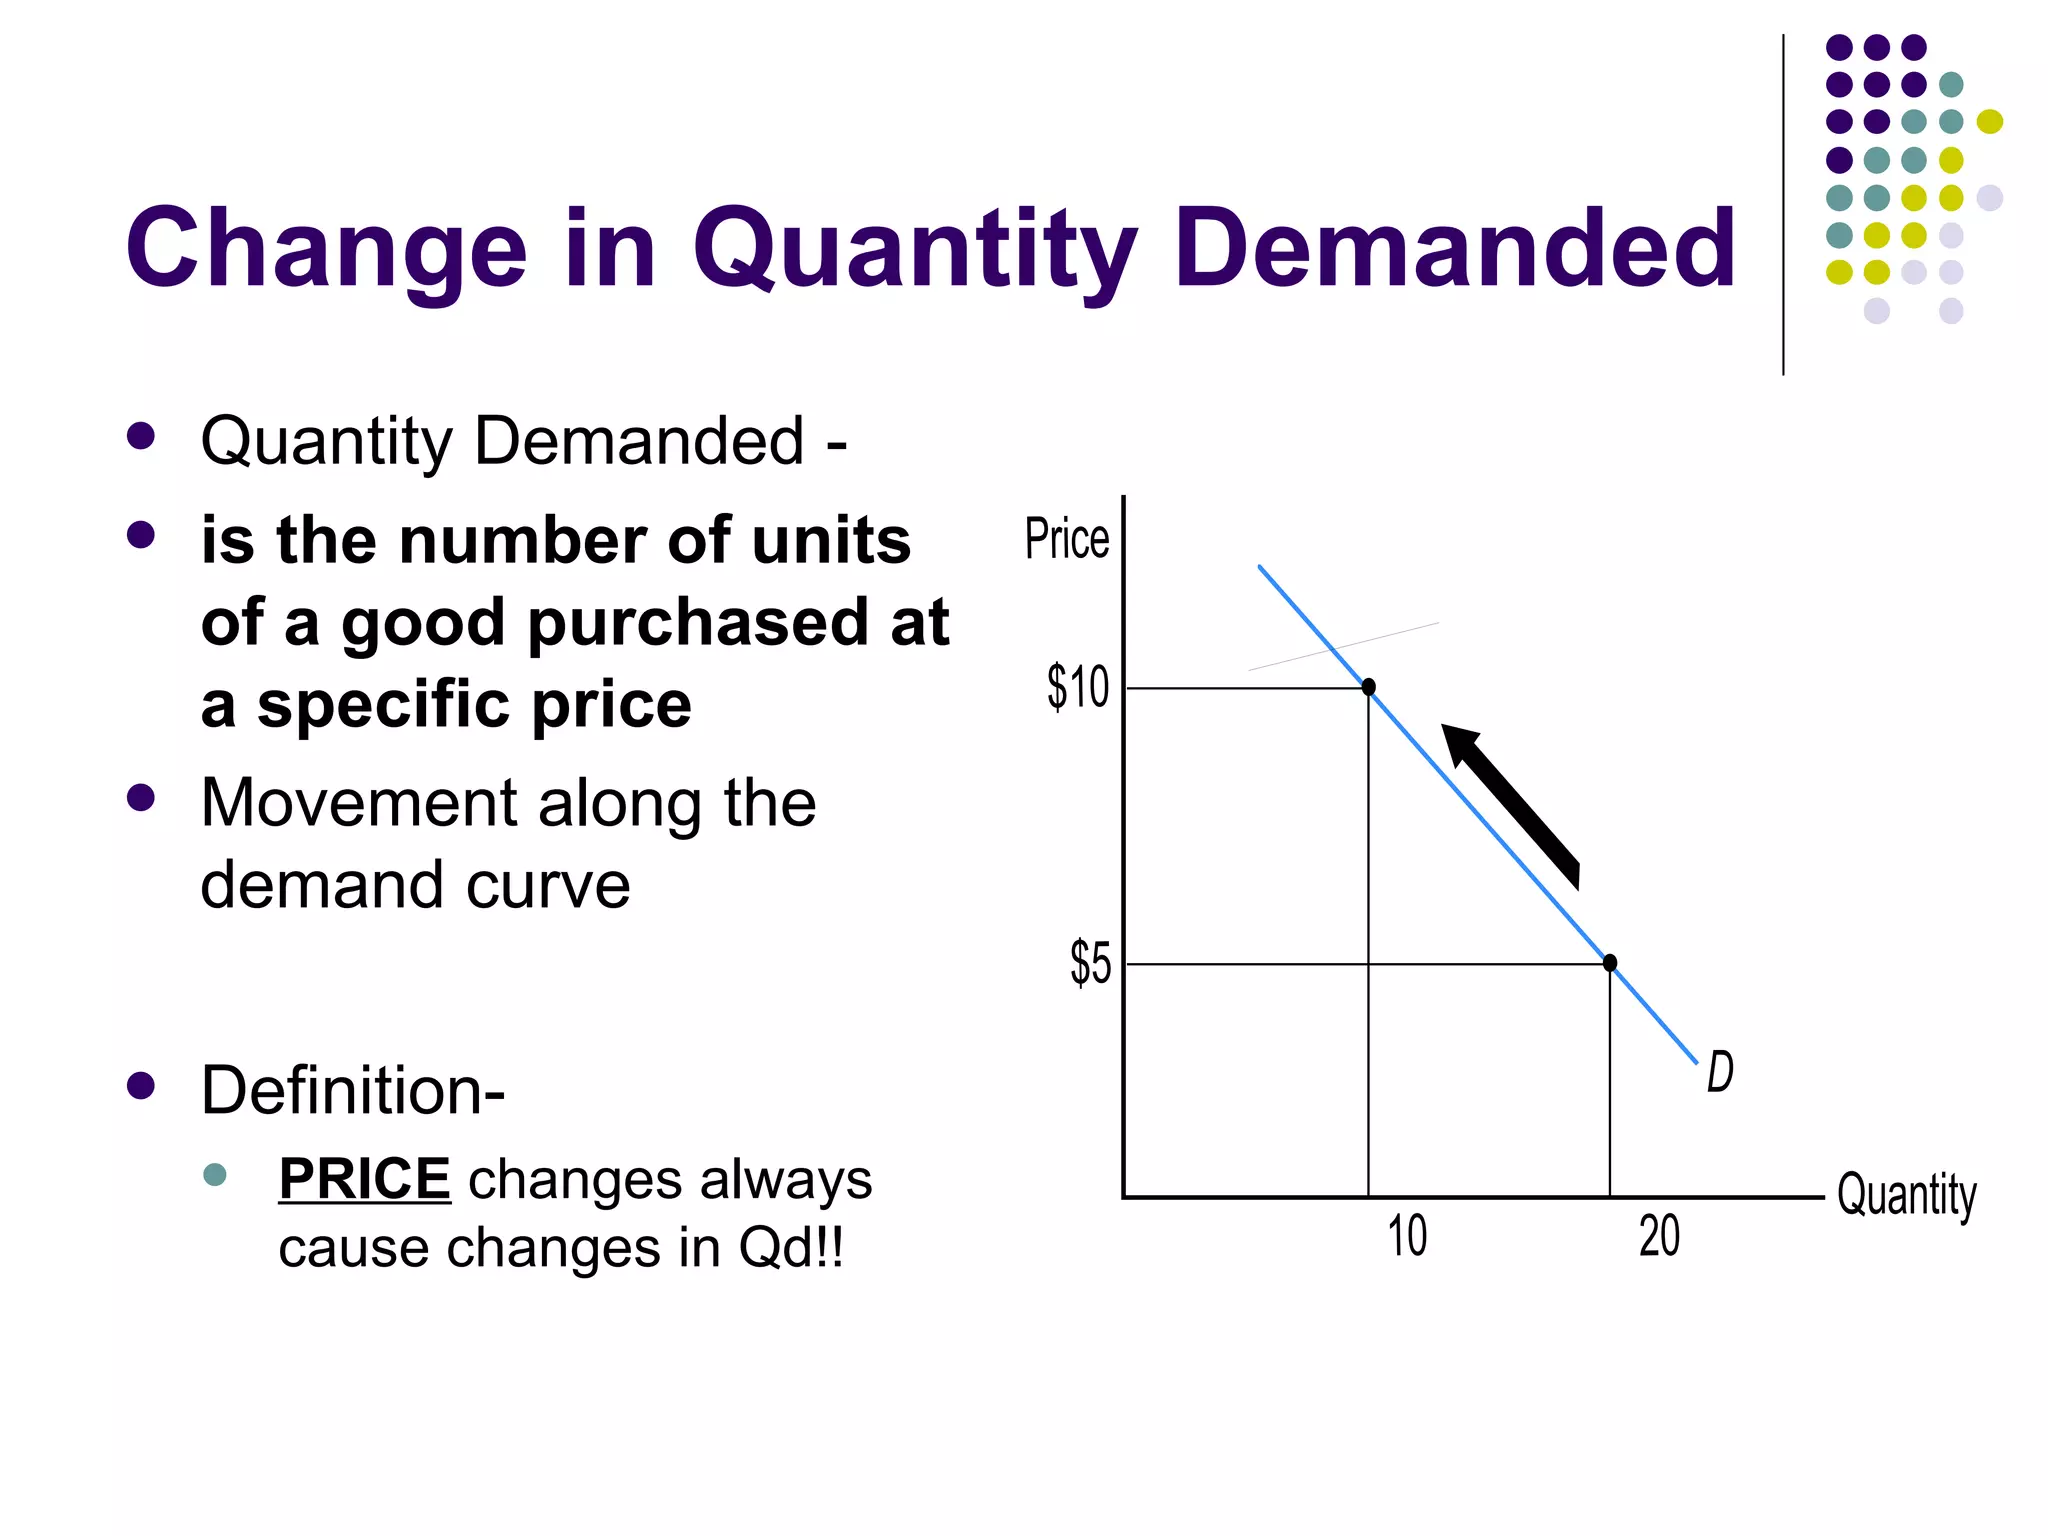
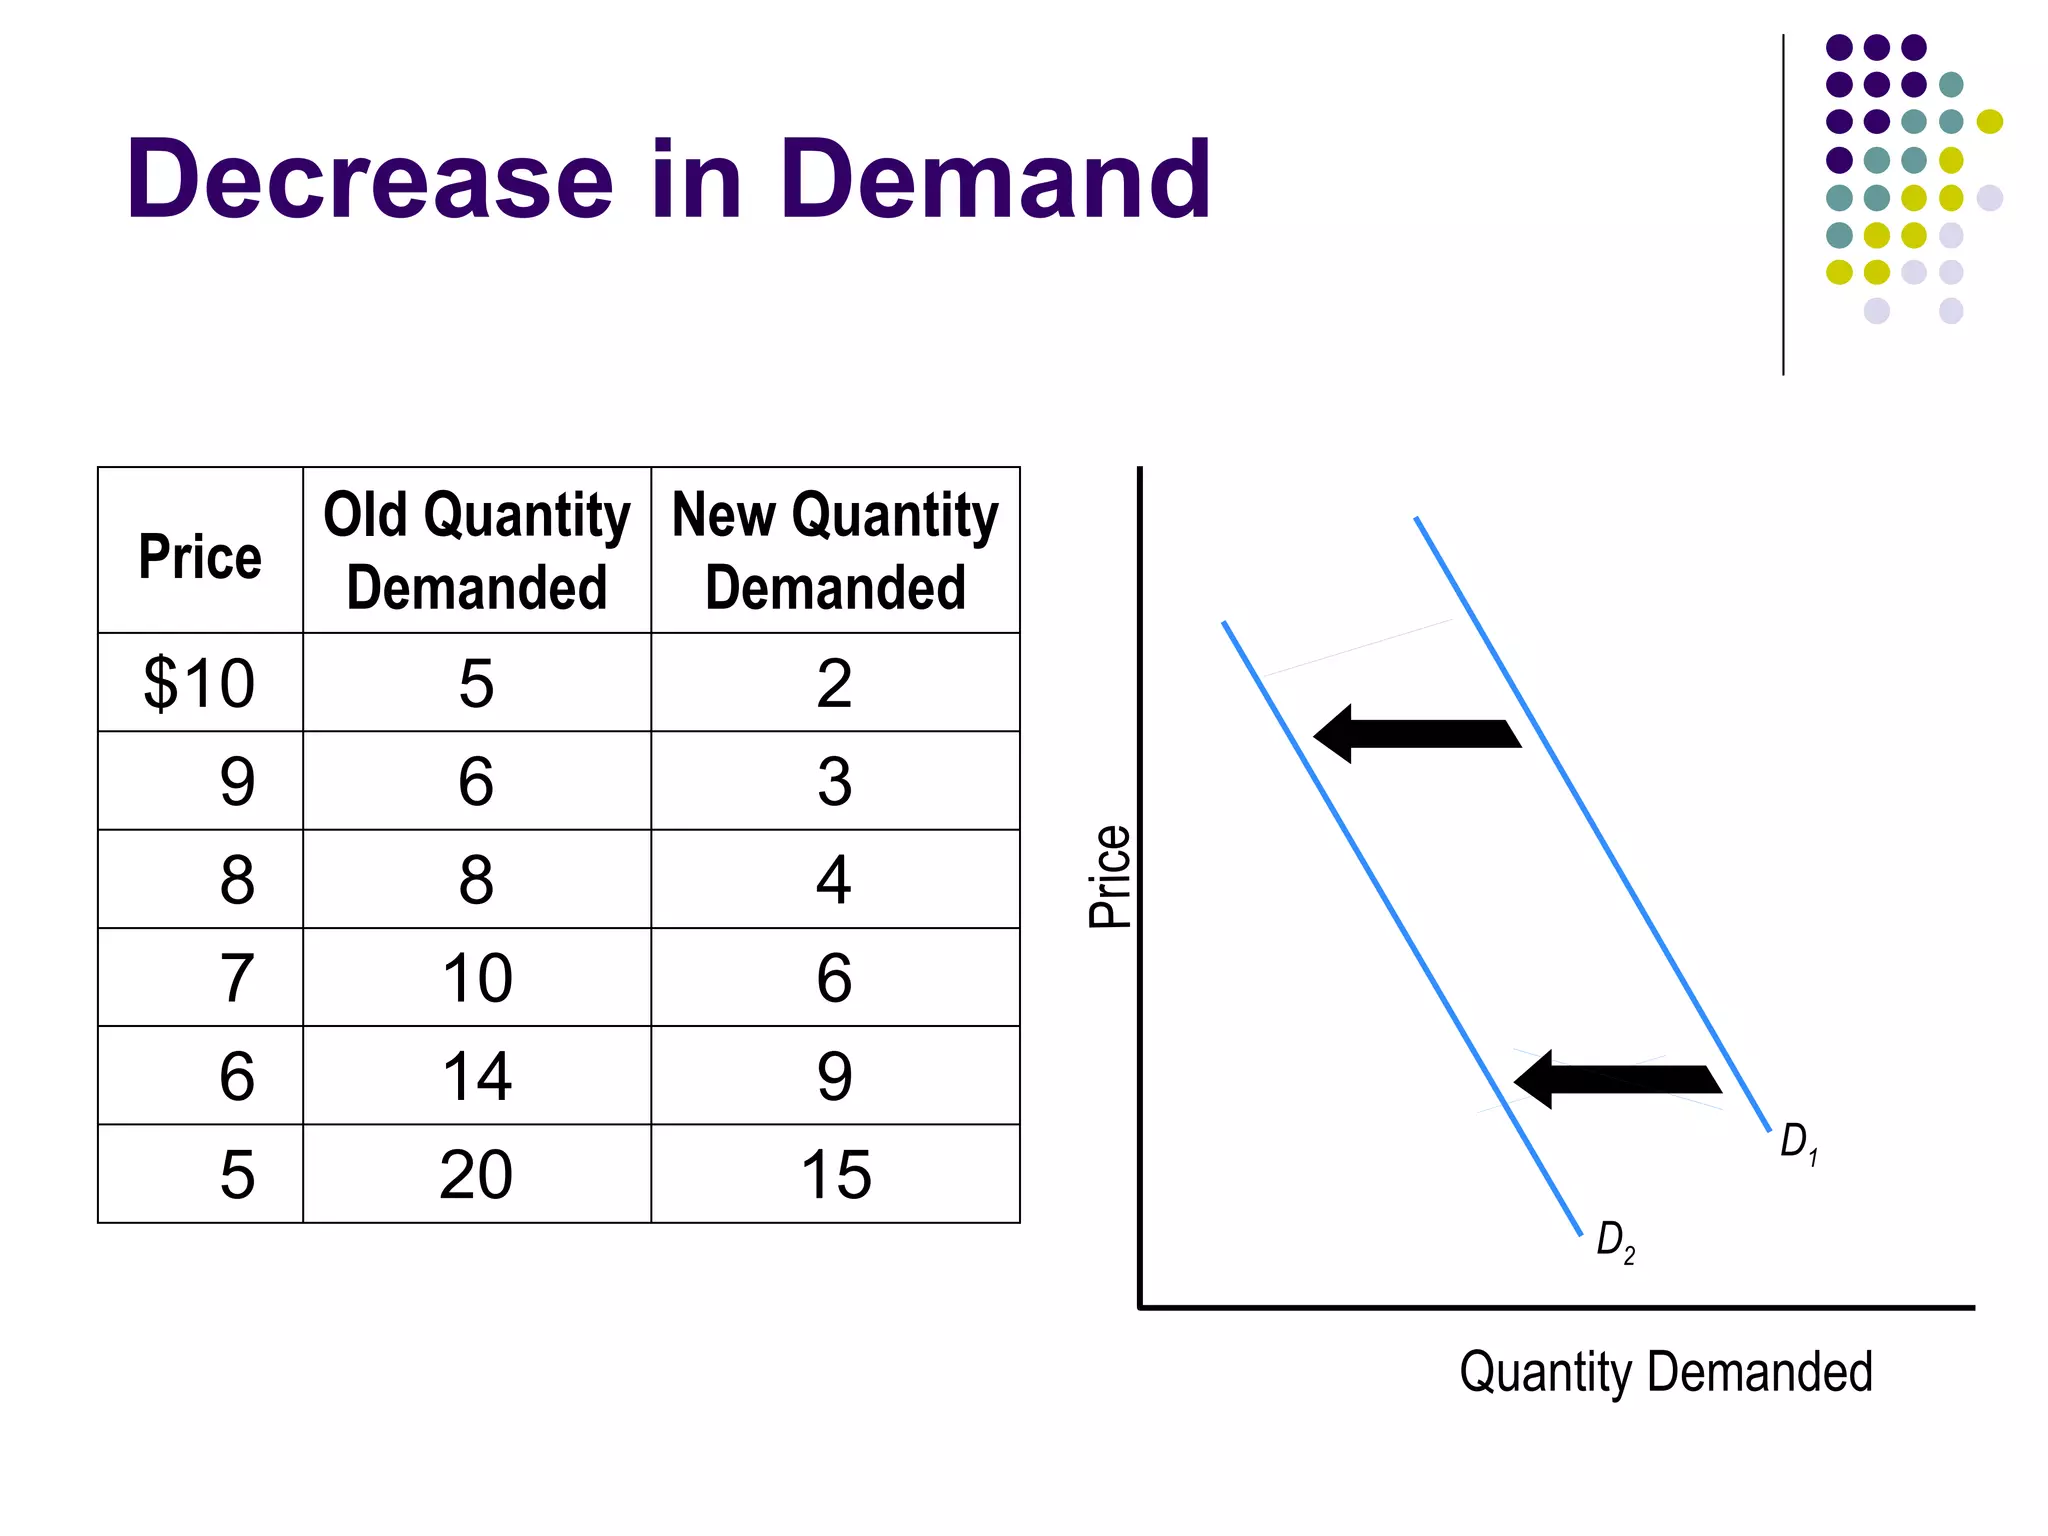
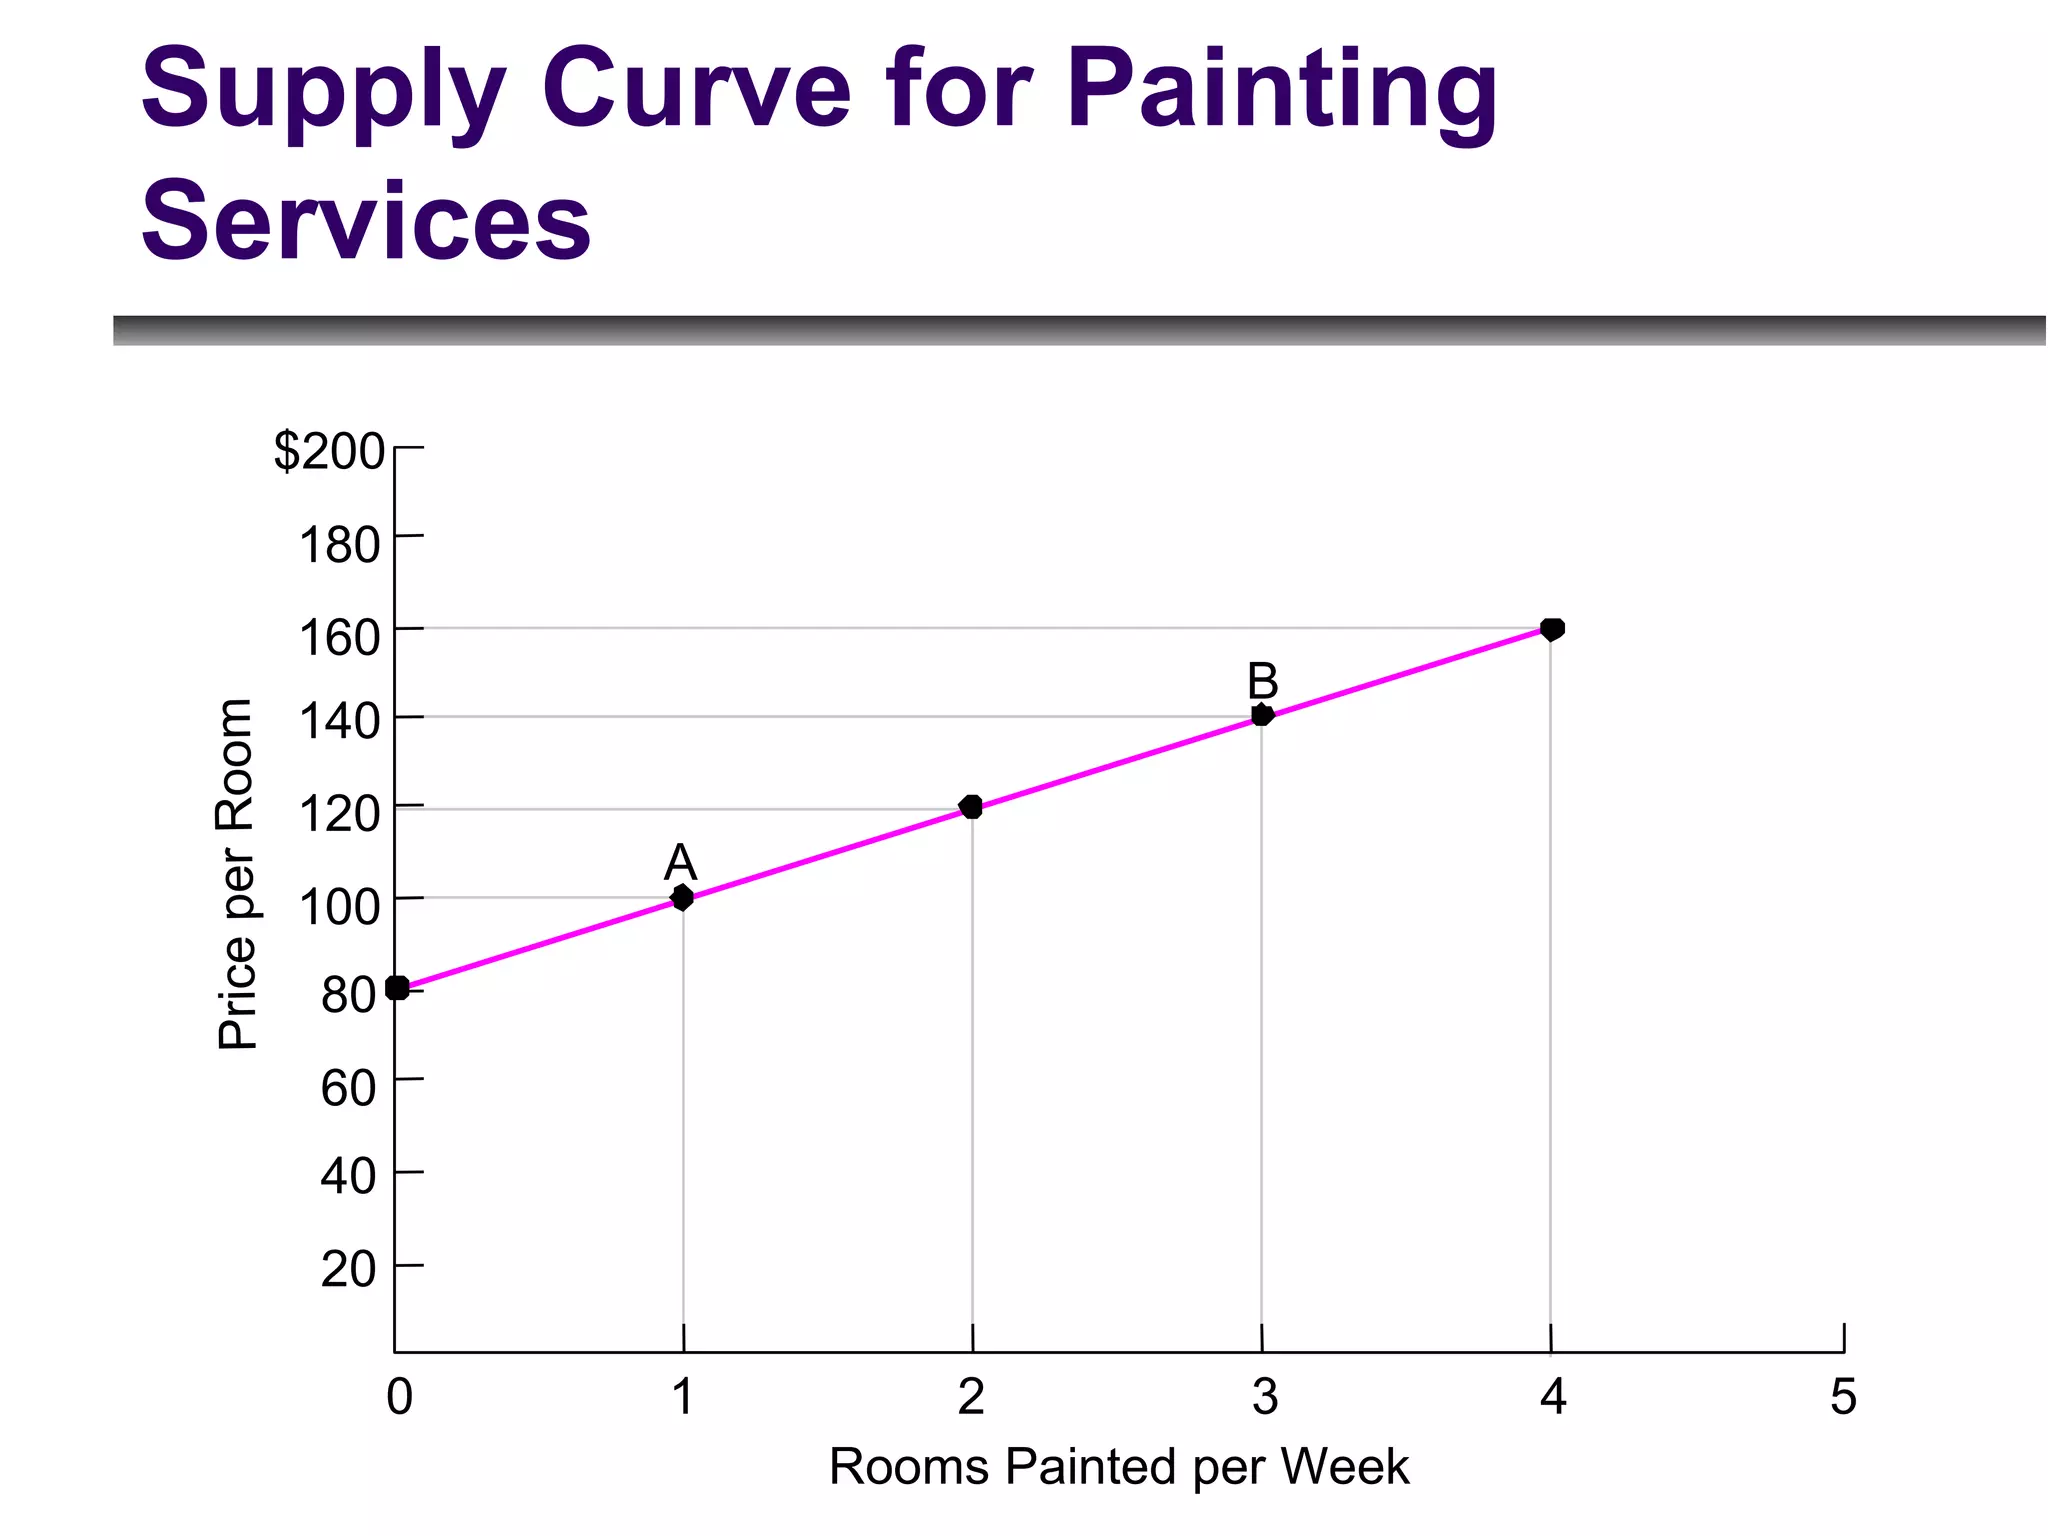
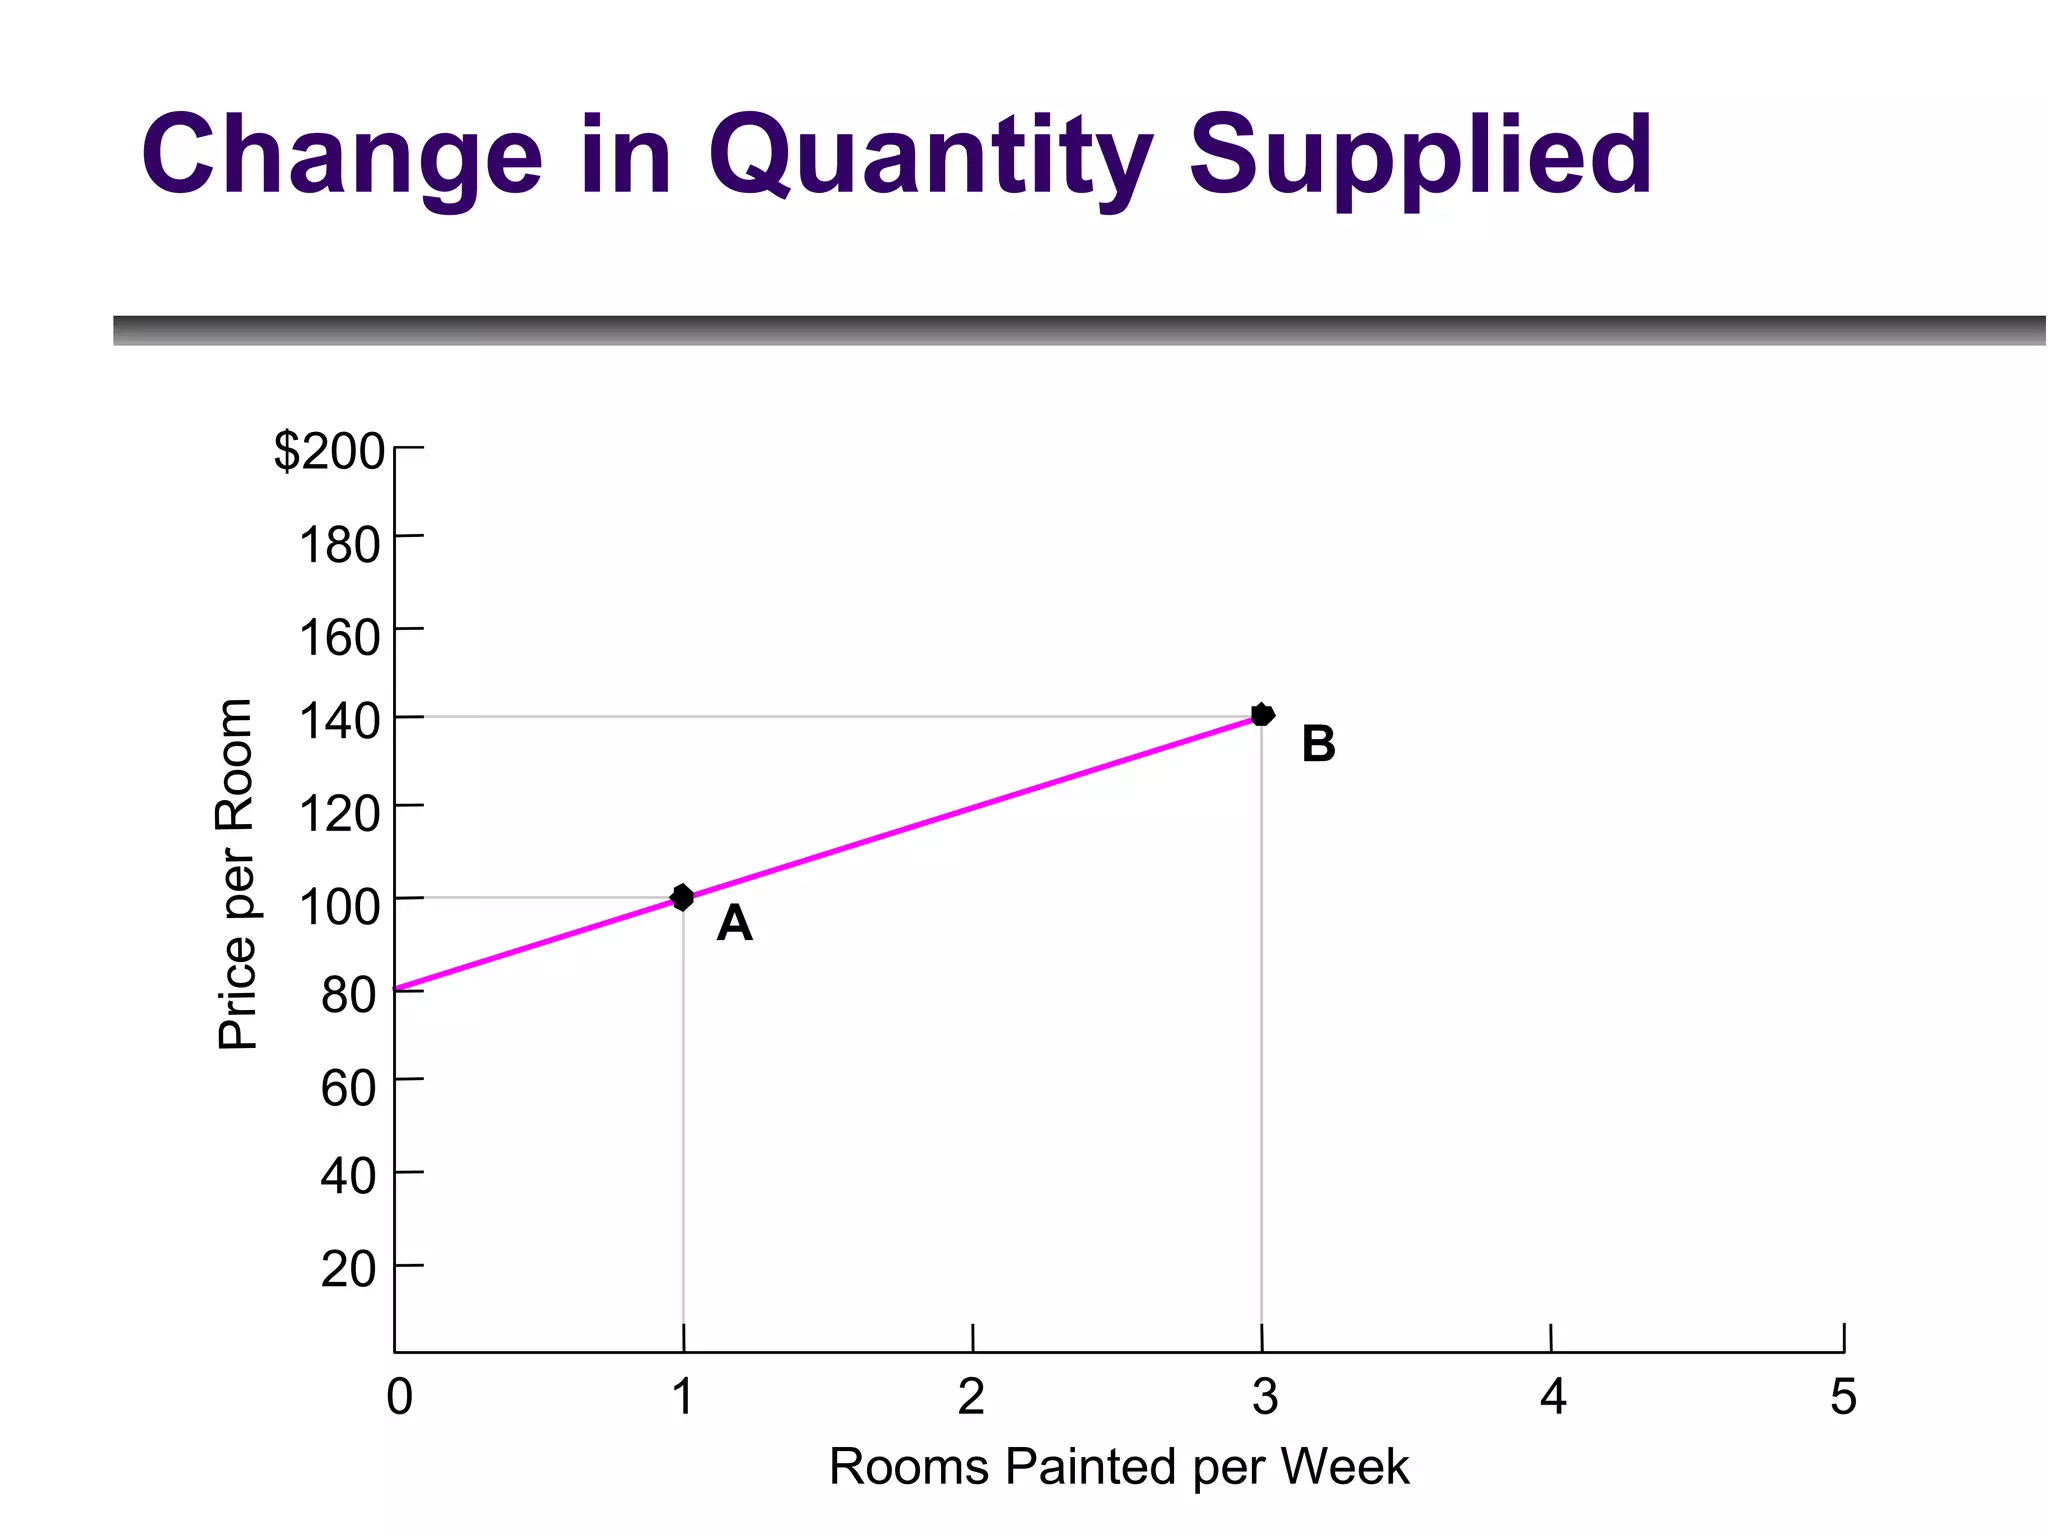
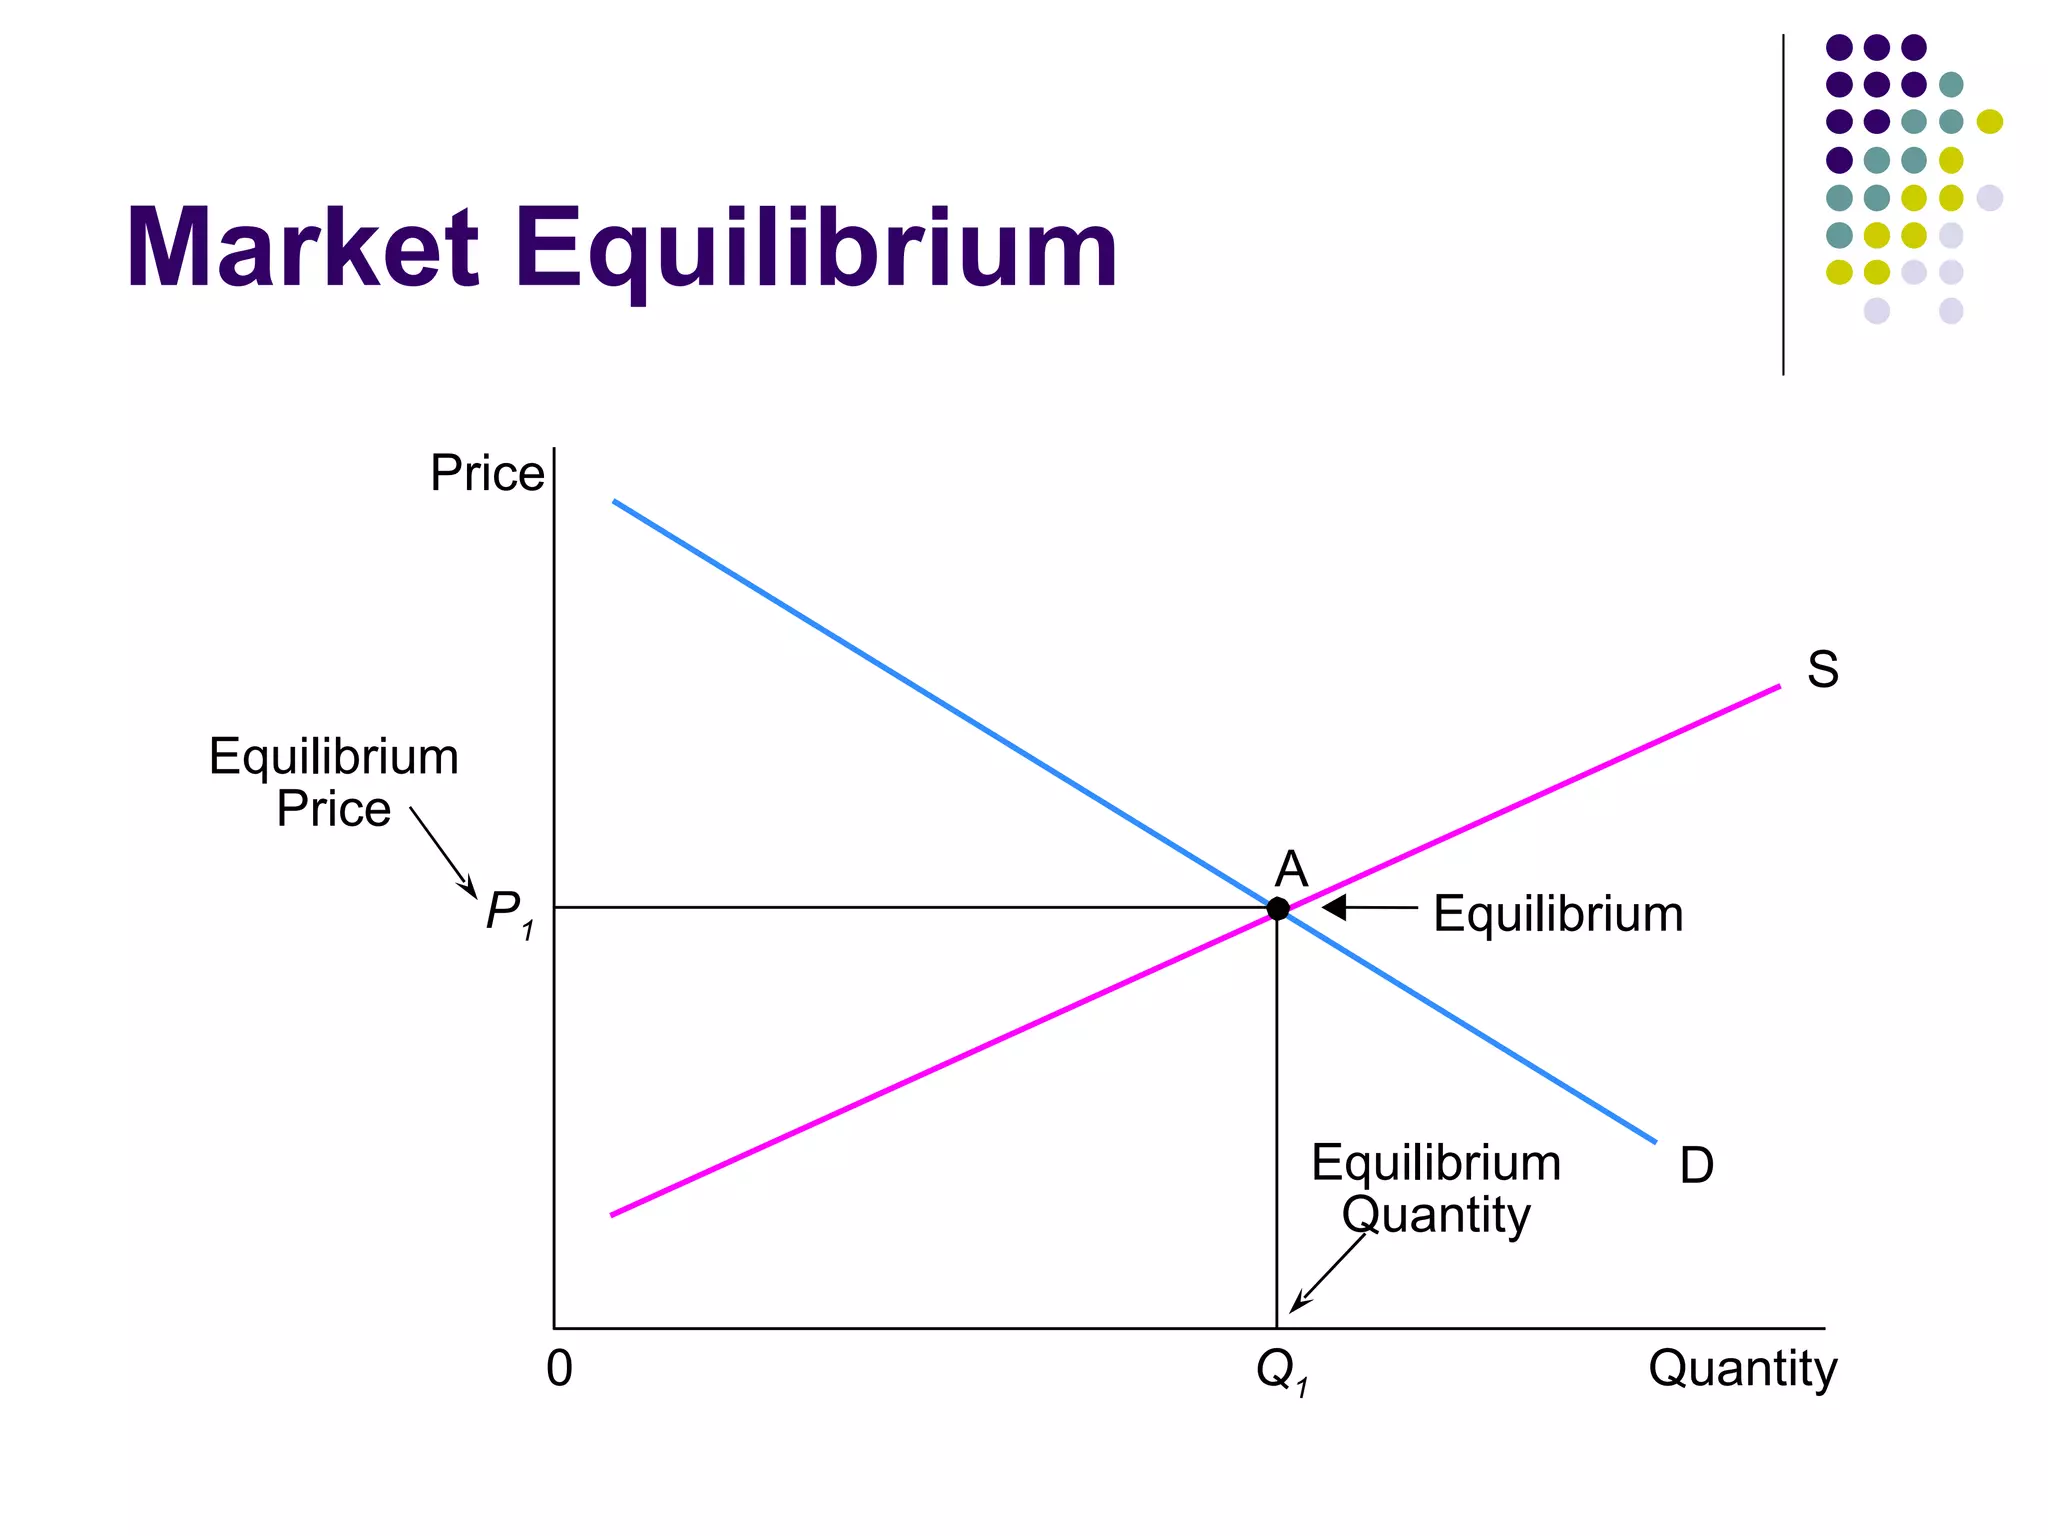
Supply & Demand
Markets What is a market? It is any place where people come together to buy and sell goods or services market has two sides 1.  Buying side = demand 2.  Selling side = supply TODAY we focus on DEMAND!
What is demand? Demand is the  desire, ability, & willingness to buy a product Economists want to see the demand for a good as a whole so they use demand schedules & demand curves Demand schedule:  listing that shows the quantity demanded at all prices in a market Demand Curve:  tells the quantity that consumers will demand at each price
Law of Demand Two scenarios: High prices = low quantities demanded Low prices = high quantities demanded Law states that the demand for an economic product varies inversely with its price
Example Demand Schedule
Demand Curve for Movie Tickets $10 8 0 Number of Movie Tickets per Month Price of Movie Tickets 1 1 2 3 4 5 6 7 8 9 2 3 4 5 6 7 A B
Changes to Demand Change in Quantity Demanded –  movement along the demand curve Change in Demand –  movement of the entire curve!
Change in Quantity Demanded Quantity Demanded - is the number of units of a good purchased at a specific price Movement along the demand curve Definition- PRICE   changes always cause changes in Qd!!
Change in Quantity Demanded
Change in Demand Change in demand results in the entire demand curve  shifting left (decrease in demand)  or  right (increase in demand) New curve is produced! Change in demand caused by a change in conditions  other than the price of a good
Demand Shifters Consumer Income as income rises consumers can buy more at each & every price # of Consumers More consumers = more demand Consumer Expectations News reports or expected price changes  Consumer Tastes/Preferences Advertising, celebrity endorsements, trends can cause these shifts Prices of Related Products Substitutes –  products that can be used in place of other products Increase in price of one increases demand for other Example – Butter & margarine Complements -  related goods used together Use of one increases the use of the other Example – film & camera
Increase in Demand Quantity Demanded Price D 1 D 2
Decrease in Demand Quantity Demanded Price D 2 D 1
Elasticity of Demand Elasticity of Demand – a measure of consumers’ sensitivity to a change in price Consumers care about changes in price Demand is: Elastic   when a small change in price = large change in quantity demanded Inelastic   when change in price causes only small change in quantity demanded
Determinants of Elasticity 1. Urgency of Need Sometimes consumer’s need is urgent & cannot be put off Examples: insulin, gasoline, & tobacco (all inelastic) 2. Availability of Adequate Substitutes Consumers will switch back & forth to get best price If product has more substitutes = elastic demand 3.  Amount of Income Required to Purchase When products are high priced = elastic demand Example: buying a car When products are lower priced = inelastic demand Example: buying salt
Diminishing Marginal Utility Marginal utility The extra usefulness or satisfaction a person gets from acquiring one more unit of a product Diminishing Marginal Utility Principle states that the more units of a certain economic product a person acquires, the less eager  that person will be to buy more WHAT? =  the more you consume, the less satisfaction you get out of it; therefore, you are less willing to purchase more!
What is supply? Supply is the  amount of a product that would be offered for sale at all possible prices in a market Each supplier needs to make a choice on how much to offer for sale at any given price (need to offset cost of production) Supply Schedule –  tells the quantities offered at each & every price Supply Curve –  graph that shows the relationship between the price and quantity supplied
Law of Supply Law states that the quantity supplied (or offered for sale) varies directly with its price This means: If prices are high = suppliers offer greater quantities for sale If prices are low = suppliers offer smaller quantities for sale
Supply Schedule for Painting Services
Supply Curve for Painting Services $200 5 0 Rooms Painted per Week Price per Room 1 20 40 60 80 100 120 140 160 180 A B 2 3 4
Changes in Supply Change in Quantity Supplied –  movement along the supply curve Change in Supply –  movement of the entire curve!
Change in Quantity Supplied Quantity Supplied  is the amount that producers bring to market at any one price Change in Qs = change in amount offered for sale in response to a change in price PRICE  changes always cause changes in Qs
Change in Quantity Supplied  $200 5 0 Rooms Painted per Week Price per Room 1 20 40 60 80 100 120 140 160 180 2 3 4 A B
Change in Supply Shift to the right = increase in supply  Shift to the left = decrease in supply Change in supply = producers offer different amounts of products for sale at all possible prices in the market Reasons for change in supply Cost of Inputs, productivity, technology, # of sellers, taxes / subsidies, expectations, & government regulations
Increase in Supply Quantity Supplied Price S 1 S 2
Decrease in Supply Quantity Supplied Price S 1 S 1
Changes in Supply Cost of Inputs Change in cost of inputs could cause a change in supply Productivity Can increase if workers are more motivated or are trained to work more efficiently Technology New technology usually shifts curve to the right Number of Sellers When more suppliers enter the market = supply increases  or vice-versa Taxes & Subsidies If taxes are put on cost of inputs then cost of production increases = supply decreases  or vice-versa
Changes in Supply continued… Expectations Anticipation of future events can affect supply curve Two scenarios Producers think prices will go up = withhold some of supply (decreases supply) Producers think prices will go down = sell fast (increases supply) Government Regulations Increased regulations restrict supply Relaxed regulations increase supply
Supply Shifters Cost of Inputs Change in cost of inputs could cause a change in supply Productivity Can increase if workers are more motivated or are trained to work more efficiently Number of Producers/Sellers When more suppliers enter the market = supply increases  or vice-versa Technology New technology usually shifts curve to the right Natural Disaster/Crises Hurricanes, floods, wildfires decrease supply Wars and revolutions can have similar effects
Supply shifters continued… Government Regulations/Policy Increased regulations restrict supply Relaxed regulations increase supply Tax on the manufacture or sale of a good = decrease supply Subsidy (cash payment to producers) = increase supply Expectations Anticipation of future events can affect supply curve Two scenarios 1. Producers think prices will go up = withhold some of supply (decreases supply) 2. Producers think prices will go down = sell fast (increases supply)
Elasticity of Supply Supply elasticity tells the ways in which changes in the quantity supplied are affected by change in price Small increase in price leads to larger increase in output  =  elastic Small increase in price leads to little change in quantity supplied  =  inelastic Examples of elastic & inelastic Candy Kites Oil
Buyers & Sellers Interact Interaction Buyers always want low prices Sellers always want low prices = They need to compromise The compromise is the price of a good in the market
Buyers / Sellers Interaction Interaction produces 3 scenarios 1.  Surplus – sellers provide more products than buyers are willing to purchase 2.  Shortage – sellers do not offer enough to satisfy buyers 3. Equilibrium – stable prices and where sellers provide exactly enough to satisfy buyers
Market Equilibrium Equilibrium – point at which quantity supplied = quantity demanded IN OTHER WORDS:  Qd = Qs Price in equilibrium is the  equilibrium price  and the quantity in equilibrium is the  equilibrium quantity
Market Equilibrium Price equilibrium can be found where the  supply curve intersects the demand curve
Market Equilibrium  Equilibrium Quantity Price S D A Equilibrium Q 1 0 P 1 Quantity Equilibrium Price
What about disequilibrium? When quantity supplied does not equal quantity demanded at a given price we have disequilibrium Examples:  shortage & surplus
Shortage Shortage – is a situation in which the quantity demanded is greater than the quantity supplied at a given price IN OTHER WORDS:  Qd > Qs Shortage can also be called “Excess Demand” When price is below the equilibrium price, there is a shortage and the  price tends to rise  towards equilibrium
Excess Demand  Quantity Price S D A Equilibrium 0 Quantity Demanded at the Price  P 0   P 1 Equilibrium Price P 0 Quantity Supplied at the Price  P 0 Excess Demand (shortage) Price below Equilibrium Price Q s 0 Q d 0
Surplus Surplus– is a situation in which the quantity supplied is greater than the quantity demanded at a given price IN OTHER WORDS:  Qd < Qs Surplus can also be called “Excess Supply” When price is above the equilibrium price, there is a surplus and the  price tends to fall  towards equilibrium
Excess Supply  Quantity Price S D 0 P 2 Price above Equilibrium Price P 1 Quantity Demanded at the Price P 2 Excess Supply (surplus) Equilibrium Price Q s 2 Quantity Supplied at the Price P 2 Q d 2 Equilibrium
What makes equilibrium prices change? INCREASE IN DEMAND = increase in equilibrium price & quantity DECREASE IN DEMAND = decrease in equilibrium price & quantity
An Increase in Demand Quantity Price B( New Market Equilibrium ) Q 2 0 P 2 P 1 Q 1 A S 1 D 2 D 1
What happens to the equilibrium when supply increases OR decreases INCREASE IN SUPPLY = decrease in equilibrium price & increase in equilibrium quantity DECREASE IN SUPPLY = increase in equilibrium price & decrease in equilibrium quantity
An Increase in Supply Quantity Price A Q 1 0 P 1 P 2 Q 2 B  (New Market Equilibrium)  D 1 S 1 S 2
Back to Equilibrium At equilibrium, there is no shortage or surplus Price remains stable until demand or supply increases

Pe supply & demand student

  • 1.
  • 2.
    Markets What isa market? It is any place where people come together to buy and sell goods or services market has two sides 1. Buying side = demand 2. Selling side = supply TODAY we focus on DEMAND!
  • 3.
    What is demand?Demand is the desire, ability, & willingness to buy a product Economists want to see the demand for a good as a whole so they use demand schedules & demand curves Demand schedule: listing that shows the quantity demanded at all prices in a market Demand Curve: tells the quantity that consumers will demand at each price
  • 4.
    Law of DemandTwo scenarios: High prices = low quantities demanded Low prices = high quantities demanded Law states that the demand for an economic product varies inversely with its price
  • 5.
  • 6.
    Demand Curve forMovie Tickets $10 8 0 Number of Movie Tickets per Month Price of Movie Tickets 1 1 2 3 4 5 6 7 8 9 2 3 4 5 6 7 A B
  • 7.
    Changes to DemandChange in Quantity Demanded – movement along the demand curve Change in Demand – movement of the entire curve!
  • 8.
    Change in QuantityDemanded Quantity Demanded - is the number of units of a good purchased at a specific price Movement along the demand curve Definition- PRICE changes always cause changes in Qd!!
  • 9.
  • 10.
    Change in DemandChange in demand results in the entire demand curve shifting left (decrease in demand) or right (increase in demand) New curve is produced! Change in demand caused by a change in conditions other than the price of a good
  • 11.
    Demand Shifters ConsumerIncome as income rises consumers can buy more at each & every price # of Consumers More consumers = more demand Consumer Expectations News reports or expected price changes Consumer Tastes/Preferences Advertising, celebrity endorsements, trends can cause these shifts Prices of Related Products Substitutes – products that can be used in place of other products Increase in price of one increases demand for other Example – Butter & margarine Complements - related goods used together Use of one increases the use of the other Example – film & camera
  • 12.
    Increase in DemandQuantity Demanded Price D 1 D 2
  • 13.
    Decrease in DemandQuantity Demanded Price D 2 D 1
  • 14.
    Elasticity of DemandElasticity of Demand – a measure of consumers’ sensitivity to a change in price Consumers care about changes in price Demand is: Elastic when a small change in price = large change in quantity demanded Inelastic when change in price causes only small change in quantity demanded
  • 15.
    Determinants of Elasticity1. Urgency of Need Sometimes consumer’s need is urgent & cannot be put off Examples: insulin, gasoline, & tobacco (all inelastic) 2. Availability of Adequate Substitutes Consumers will switch back & forth to get best price If product has more substitutes = elastic demand 3. Amount of Income Required to Purchase When products are high priced = elastic demand Example: buying a car When products are lower priced = inelastic demand Example: buying salt
  • 16.
    Diminishing Marginal UtilityMarginal utility The extra usefulness or satisfaction a person gets from acquiring one more unit of a product Diminishing Marginal Utility Principle states that the more units of a certain economic product a person acquires, the less eager that person will be to buy more WHAT? = the more you consume, the less satisfaction you get out of it; therefore, you are less willing to purchase more!
  • 17.
    What is supply?Supply is the amount of a product that would be offered for sale at all possible prices in a market Each supplier needs to make a choice on how much to offer for sale at any given price (need to offset cost of production) Supply Schedule – tells the quantities offered at each & every price Supply Curve – graph that shows the relationship between the price and quantity supplied
  • 18.
    Law of SupplyLaw states that the quantity supplied (or offered for sale) varies directly with its price This means: If prices are high = suppliers offer greater quantities for sale If prices are low = suppliers offer smaller quantities for sale
  • 19.
    Supply Schedule forPainting Services
  • 20.
    Supply Curve forPainting Services $200 5 0 Rooms Painted per Week Price per Room 1 20 40 60 80 100 120 140 160 180 A B 2 3 4
  • 21.
    Changes in SupplyChange in Quantity Supplied – movement along the supply curve Change in Supply – movement of the entire curve!
  • 22.
    Change in QuantitySupplied Quantity Supplied is the amount that producers bring to market at any one price Change in Qs = change in amount offered for sale in response to a change in price PRICE changes always cause changes in Qs
  • 23.
    Change in QuantitySupplied $200 5 0 Rooms Painted per Week Price per Room 1 20 40 60 80 100 120 140 160 180 2 3 4 A B
  • 24.
    Change in SupplyShift to the right = increase in supply Shift to the left = decrease in supply Change in supply = producers offer different amounts of products for sale at all possible prices in the market Reasons for change in supply Cost of Inputs, productivity, technology, # of sellers, taxes / subsidies, expectations, & government regulations
  • 25.
    Increase in SupplyQuantity Supplied Price S 1 S 2
  • 26.
    Decrease in SupplyQuantity Supplied Price S 1 S 1
  • 27.
    Changes in SupplyCost of Inputs Change in cost of inputs could cause a change in supply Productivity Can increase if workers are more motivated or are trained to work more efficiently Technology New technology usually shifts curve to the right Number of Sellers When more suppliers enter the market = supply increases or vice-versa Taxes & Subsidies If taxes are put on cost of inputs then cost of production increases = supply decreases or vice-versa
  • 28.
    Changes in Supplycontinued… Expectations Anticipation of future events can affect supply curve Two scenarios Producers think prices will go up = withhold some of supply (decreases supply) Producers think prices will go down = sell fast (increases supply) Government Regulations Increased regulations restrict supply Relaxed regulations increase supply
  • 29.
    Supply Shifters Costof Inputs Change in cost of inputs could cause a change in supply Productivity Can increase if workers are more motivated or are trained to work more efficiently Number of Producers/Sellers When more suppliers enter the market = supply increases or vice-versa Technology New technology usually shifts curve to the right Natural Disaster/Crises Hurricanes, floods, wildfires decrease supply Wars and revolutions can have similar effects
  • 30.
    Supply shifters continued…Government Regulations/Policy Increased regulations restrict supply Relaxed regulations increase supply Tax on the manufacture or sale of a good = decrease supply Subsidy (cash payment to producers) = increase supply Expectations Anticipation of future events can affect supply curve Two scenarios 1. Producers think prices will go up = withhold some of supply (decreases supply) 2. Producers think prices will go down = sell fast (increases supply)
  • 31.
    Elasticity of SupplySupply elasticity tells the ways in which changes in the quantity supplied are affected by change in price Small increase in price leads to larger increase in output = elastic Small increase in price leads to little change in quantity supplied = inelastic Examples of elastic & inelastic Candy Kites Oil
  • 32.
    Buyers & SellersInteract Interaction Buyers always want low prices Sellers always want low prices = They need to compromise The compromise is the price of a good in the market
  • 33.
    Buyers / SellersInteraction Interaction produces 3 scenarios 1. Surplus – sellers provide more products than buyers are willing to purchase 2. Shortage – sellers do not offer enough to satisfy buyers 3. Equilibrium – stable prices and where sellers provide exactly enough to satisfy buyers
  • 34.
    Market Equilibrium Equilibrium– point at which quantity supplied = quantity demanded IN OTHER WORDS: Qd = Qs Price in equilibrium is the equilibrium price and the quantity in equilibrium is the equilibrium quantity
  • 35.
    Market Equilibrium Priceequilibrium can be found where the supply curve intersects the demand curve
  • 36.
    Market Equilibrium Equilibrium Quantity Price S D A Equilibrium Q 1 0 P 1 Quantity Equilibrium Price
  • 37.
    What about disequilibrium?When quantity supplied does not equal quantity demanded at a given price we have disequilibrium Examples: shortage & surplus
  • 38.
    Shortage Shortage –is a situation in which the quantity demanded is greater than the quantity supplied at a given price IN OTHER WORDS: Qd > Qs Shortage can also be called “Excess Demand” When price is below the equilibrium price, there is a shortage and the price tends to rise towards equilibrium
  • 39.
    Excess Demand Quantity Price S D A Equilibrium 0 Quantity Demanded at the Price P 0 P 1 Equilibrium Price P 0 Quantity Supplied at the Price P 0 Excess Demand (shortage) Price below Equilibrium Price Q s 0 Q d 0
  • 40.
    Surplus Surplus– isa situation in which the quantity supplied is greater than the quantity demanded at a given price IN OTHER WORDS: Qd < Qs Surplus can also be called “Excess Supply” When price is above the equilibrium price, there is a surplus and the price tends to fall towards equilibrium
  • 41.
    Excess Supply Quantity Price S D 0 P 2 Price above Equilibrium Price P 1 Quantity Demanded at the Price P 2 Excess Supply (surplus) Equilibrium Price Q s 2 Quantity Supplied at the Price P 2 Q d 2 Equilibrium
  • 42.
    What makes equilibriumprices change? INCREASE IN DEMAND = increase in equilibrium price & quantity DECREASE IN DEMAND = decrease in equilibrium price & quantity
  • 43.
    An Increase inDemand Quantity Price B( New Market Equilibrium ) Q 2 0 P 2 P 1 Q 1 A S 1 D 2 D 1
  • 44.
    What happens tothe equilibrium when supply increases OR decreases INCREASE IN SUPPLY = decrease in equilibrium price & increase in equilibrium quantity DECREASE IN SUPPLY = increase in equilibrium price & decrease in equilibrium quantity
  • 45.
    An Increase inSupply Quantity Price A Q 1 0 P 1 P 2 Q 2 B (New Market Equilibrium) D 1 S 1 S 2
  • 46.
    Back to EquilibriumAt equilibrium, there is no shortage or surplus Price remains stable until demand or supply increases

Editor's Notes

  • #4 Example: Suppose you want to start a TV repair service -set up shop in neighborhood with many TVs &amp; no repair shops -want to set up business in area where demand is greatest willingness means person’s want or desire to purchase &amp; ability is having enough money to pay for the good (need both for demand!) example: Jack doesn’t have $34,000 to buy a specific car, has the willingness but not the money so there is NO demand
  • #9 Show math related equation P UP then Qd DOWN or P DOWN then Qd UP
  • #11 Example: suppose on Mon. buyers bought 100 units of a good at $3 a unit, then on Tues. they bought 150 units of the same good at $3 = the demand increased this is different if the price changed &amp; then they bought more (increase in Qd)
  • #12 Prices of Related goods – substitutes (apples &amp; oranges, chicken &amp; beef) complements (cars &amp; gas) Preferences: people are beginning to favor small gas-efficient cars so D shifts right while people are favoring other laptops other than Dell recently so their D curve shifts left Complements-Tennis rackets &amp; tennis balls (demand moves in the opposite direction of the price) # of buyers - the more buyers the higher the D, the fewer the buyers the lower the D (higher birthrate, immigration, migration, death rate, or migration)
  • #15 Elastic ex. – T-Bone steaks are elastic b/c $6 a pound compared to $3.50 a pound is going to cause a huge change in QtD (designer clothing / luxury items) Inelastic – higher or lower price on salt will not change Qtd greatly (ex. Toothpaste) Elastic - when quantity demanded is greater than percentage change in price Inelastic-when quantity demanded is less than percentage than price Unit elastic- when Qd changes by the same % as price
  • #16 1. Tobacco is inelastic b/c addictive &amp; insulin needed for diabetic no matter what
  • #17 DMU – as people’s wants for a particular product become more fully satisfied, they become less willing to spend their limited incomes to buy more of that product How does this relate to laws of demand? -more utility you receive from a unit of good, the higher price you are willing to pay for it, however as time moves on individuals obtain less utility from additional units so they only will buy more if really low prices
  • #18 Supply example: supply of TVs is the number of sets manufacturers are likely to produce at $700, $500, $300, or any other price Supply: economists think about people’s ability &amp; willingness to offer products for sale over a wide range of prices Supplier-offer economic product for sale
  • #23 Ex. 1 If P falls, the producer may offer less for sale or leave market Ex. 2 If P rises, producer may offer more units for sale to take advantage
  • #28 Cost of inputs – in T-shirt, supply may have increased because of a decline in the cost of such inputs as cotton or ink = if price of inputs goes down, producer can produce more T-shirts at each and every price Prod. – more T-shirts can be produced in a production period = supply increases, if workers are unhappy/unmotivated, untrained supply decreases Technology- introduce new machine, chemical/industrial process can lower cost of production, so when costs are down producers are willing to produce more at each &amp; every price in the market (supply down if technology breaks down) Subsidies – government payments to individuals, businesses, or other groups to encourage or protect a certain type of economic activity have opposite effect &amp; supply increases (ex. Farmers historically receive subsidies to offset costs of production)
  • #29 Government Regulations ex. Government mandates safety features to automobiles like emission controls, stronger bumpers, &amp; air bags which increases production cost of car
  • #30 Cost of inputs – in T-shirt, supply may have increased because of a decline in the cost of such inputs as cotton or ink = if price of inputs goes down, producer can produce more T-shirts at each and every price Prod. – more T-shirts can be produced in a production period = supply increases, if workers are unhappy/unmotivated, untrained supply decreases Technology- introduce new machine, chemical/industrial process can lower cost of production, so when costs are down producers are willing to produce more at each &amp; every price in the market (supply down if technology breaks down) Subsidies – government payments to individuals, businesses, or other groups to encourage or protect a certain type of economic activity have opposite effect &amp; supply increases (ex. Farmers historically receive subsidies to offset costs of production)
  • #31 Government Regulations ex. Government mandates safety features to automobiles like emission controls, stronger bumpers, &amp; air bags which increases production cost of car Natural Disaster/Crisis – somolian pirates slowing African shipping
  • #32 Elastic – kites &amp; candy because not much needed to increase production (therefore if prices rise they can increase output quickly) Inelastic – oil (need lots of machinery, capital, labor to increase production so it is inelastic)
  • #34 Qs – Qd is formula for finding shortage &amp; surplus (if negative then shortage, if positive then surplus, if 0 then equilibrium)
  • #39 Shortage in real world – have a playoff high school football game that stadium seats 2,000 people but 2,500 people want to come to game (shortage) Price rises b/c buyers will offer to buy products at higher prices so they get the products, higher pices will also motivate sellers to produce more output
  • #41 Surplus in real world – high school football playoff has stadium for 2,000 seats but only 500 people attend (surplus of seats) Price falls because suppliers cannot sell all of their products &amp; want to get rid of inventories (storing extra goods is costly) &amp; produce less output