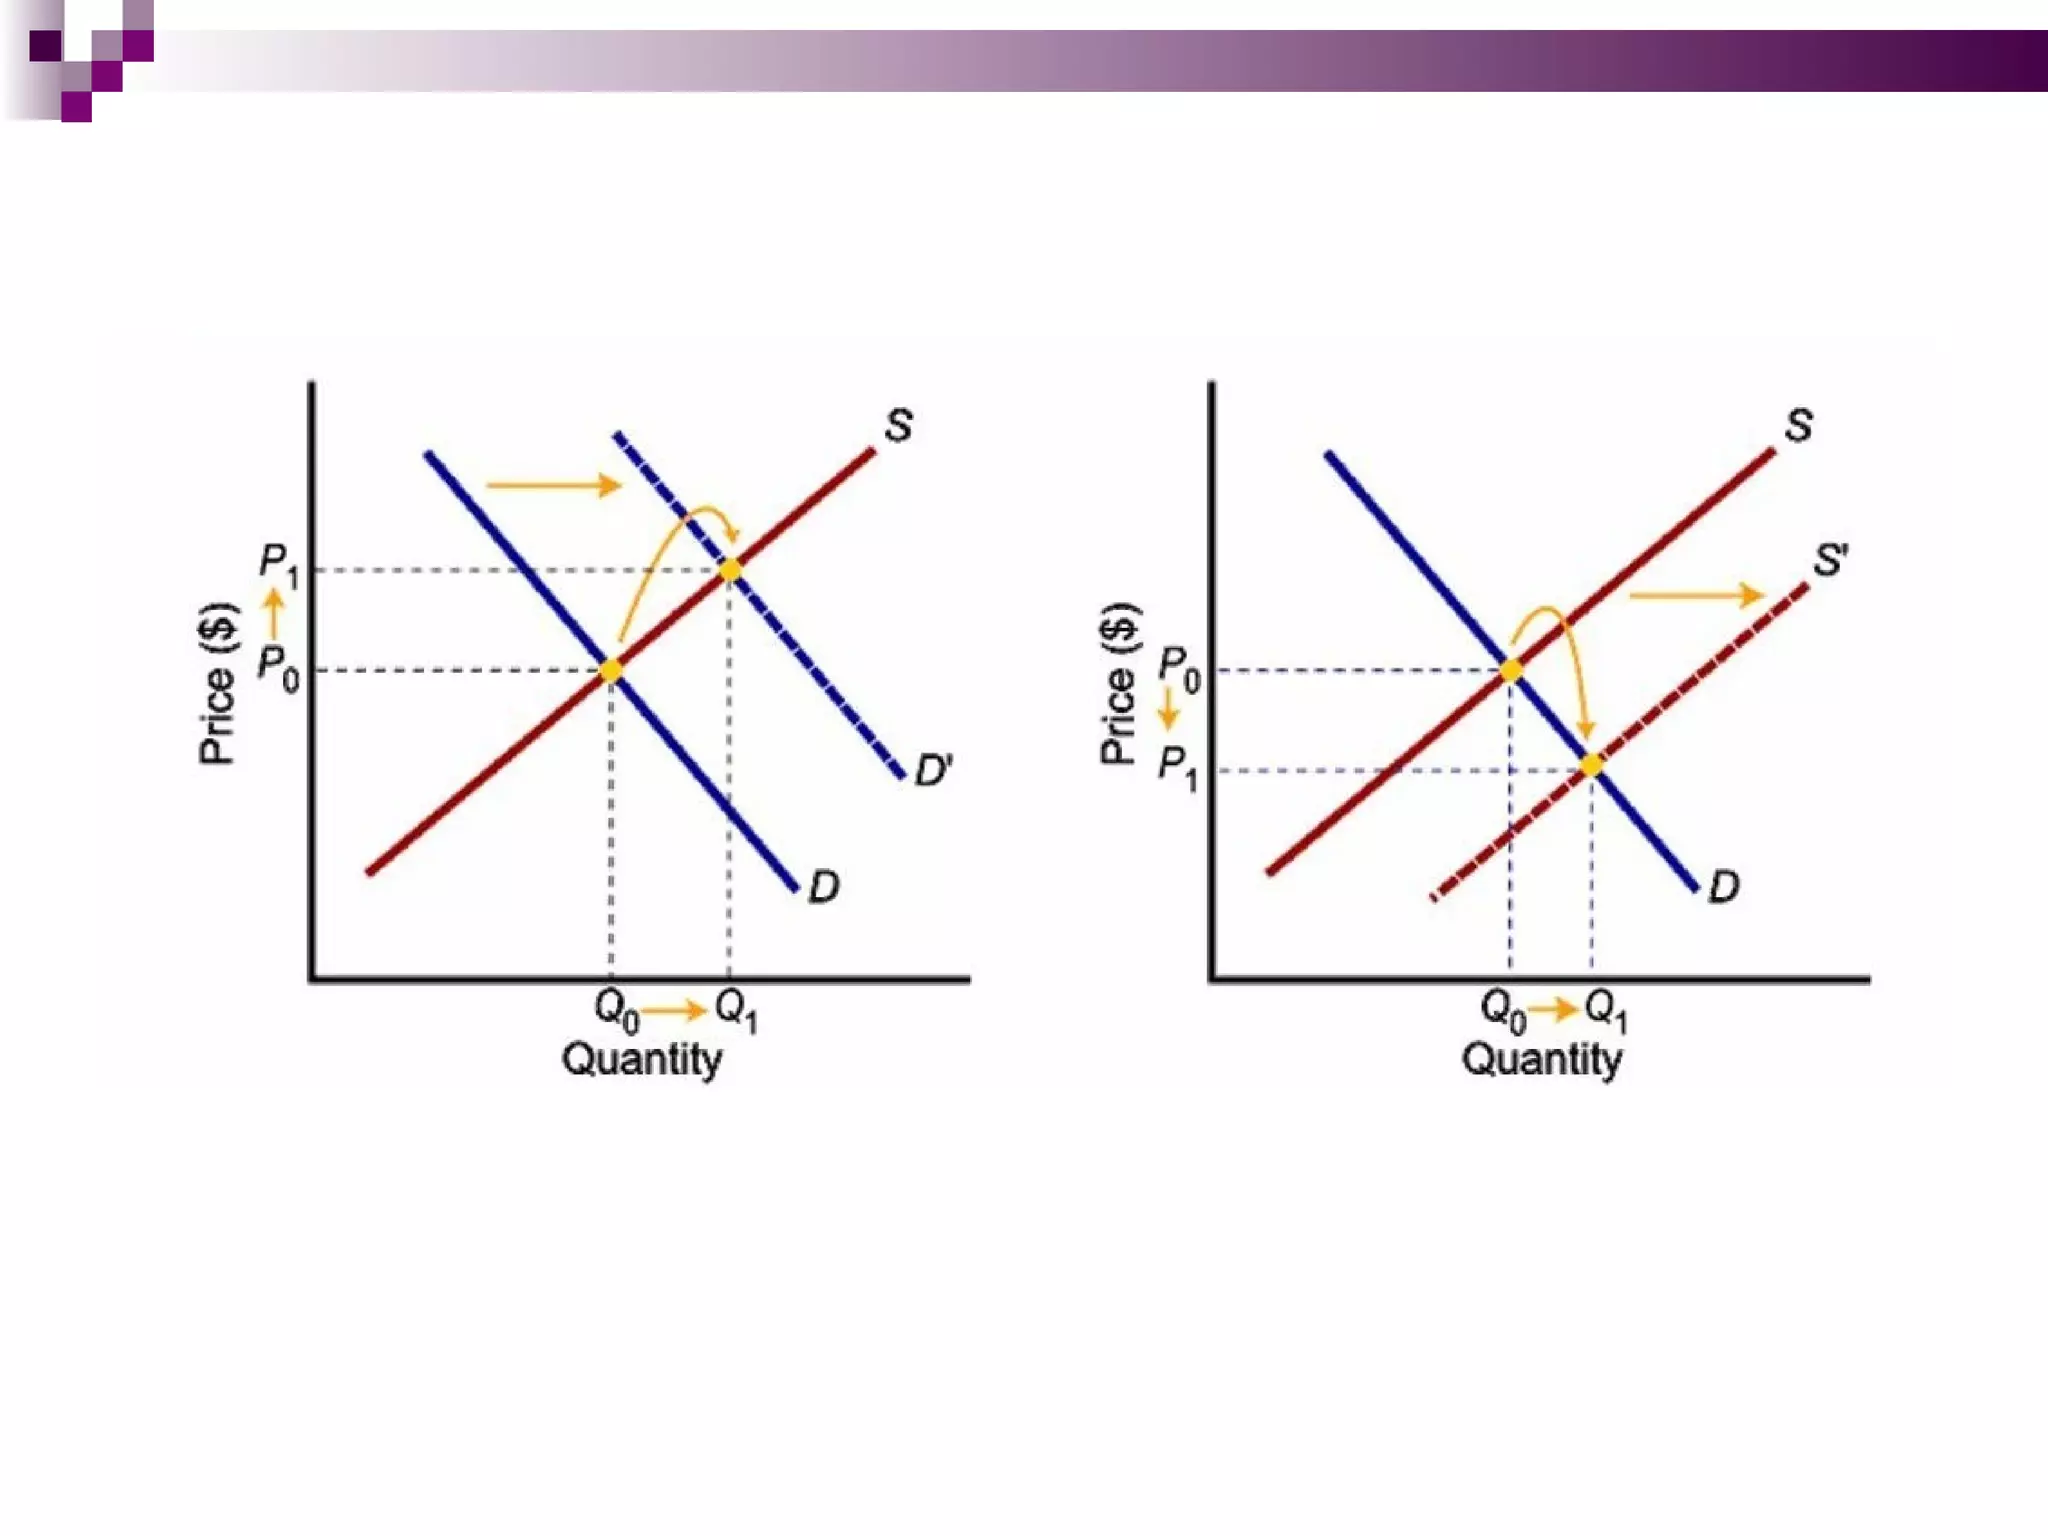
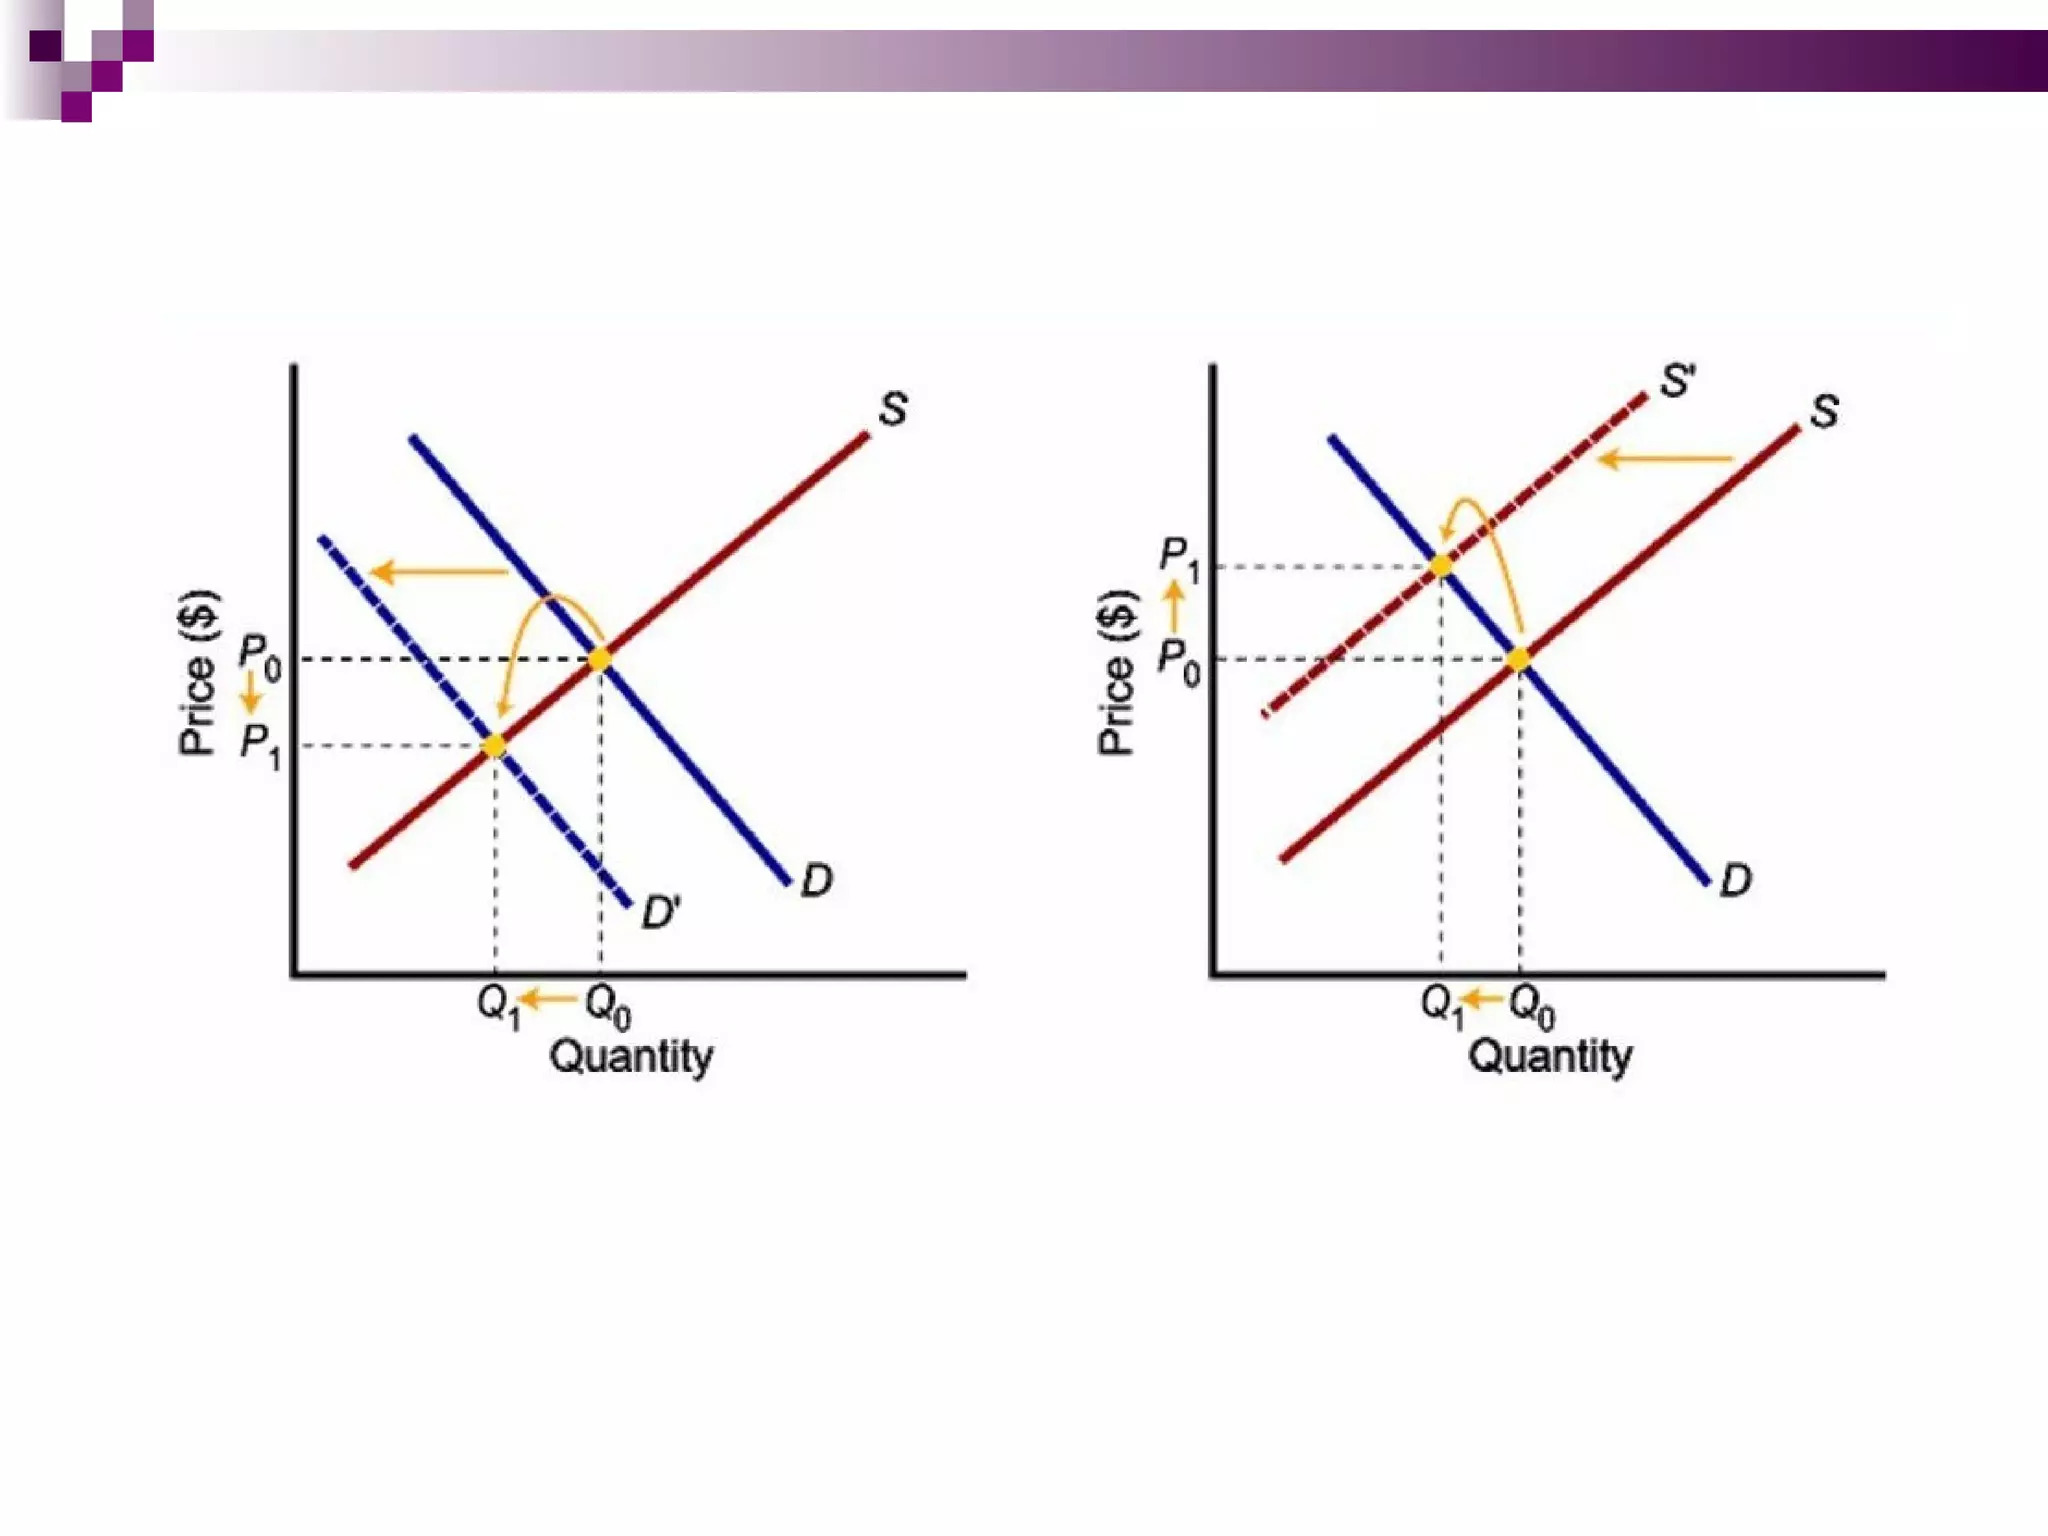
The document discusses the theory of demand and supply. It defines key concepts like demand, supply, equilibrium, and determinants. It explains the laws of demand and supply - that quantity demanded increases when price decreases and quantity supplied increases when price increases. The document also discusses how shifts in demand or supply curves impact equilibrium price and quantity in the market.


![Determinants of Demand
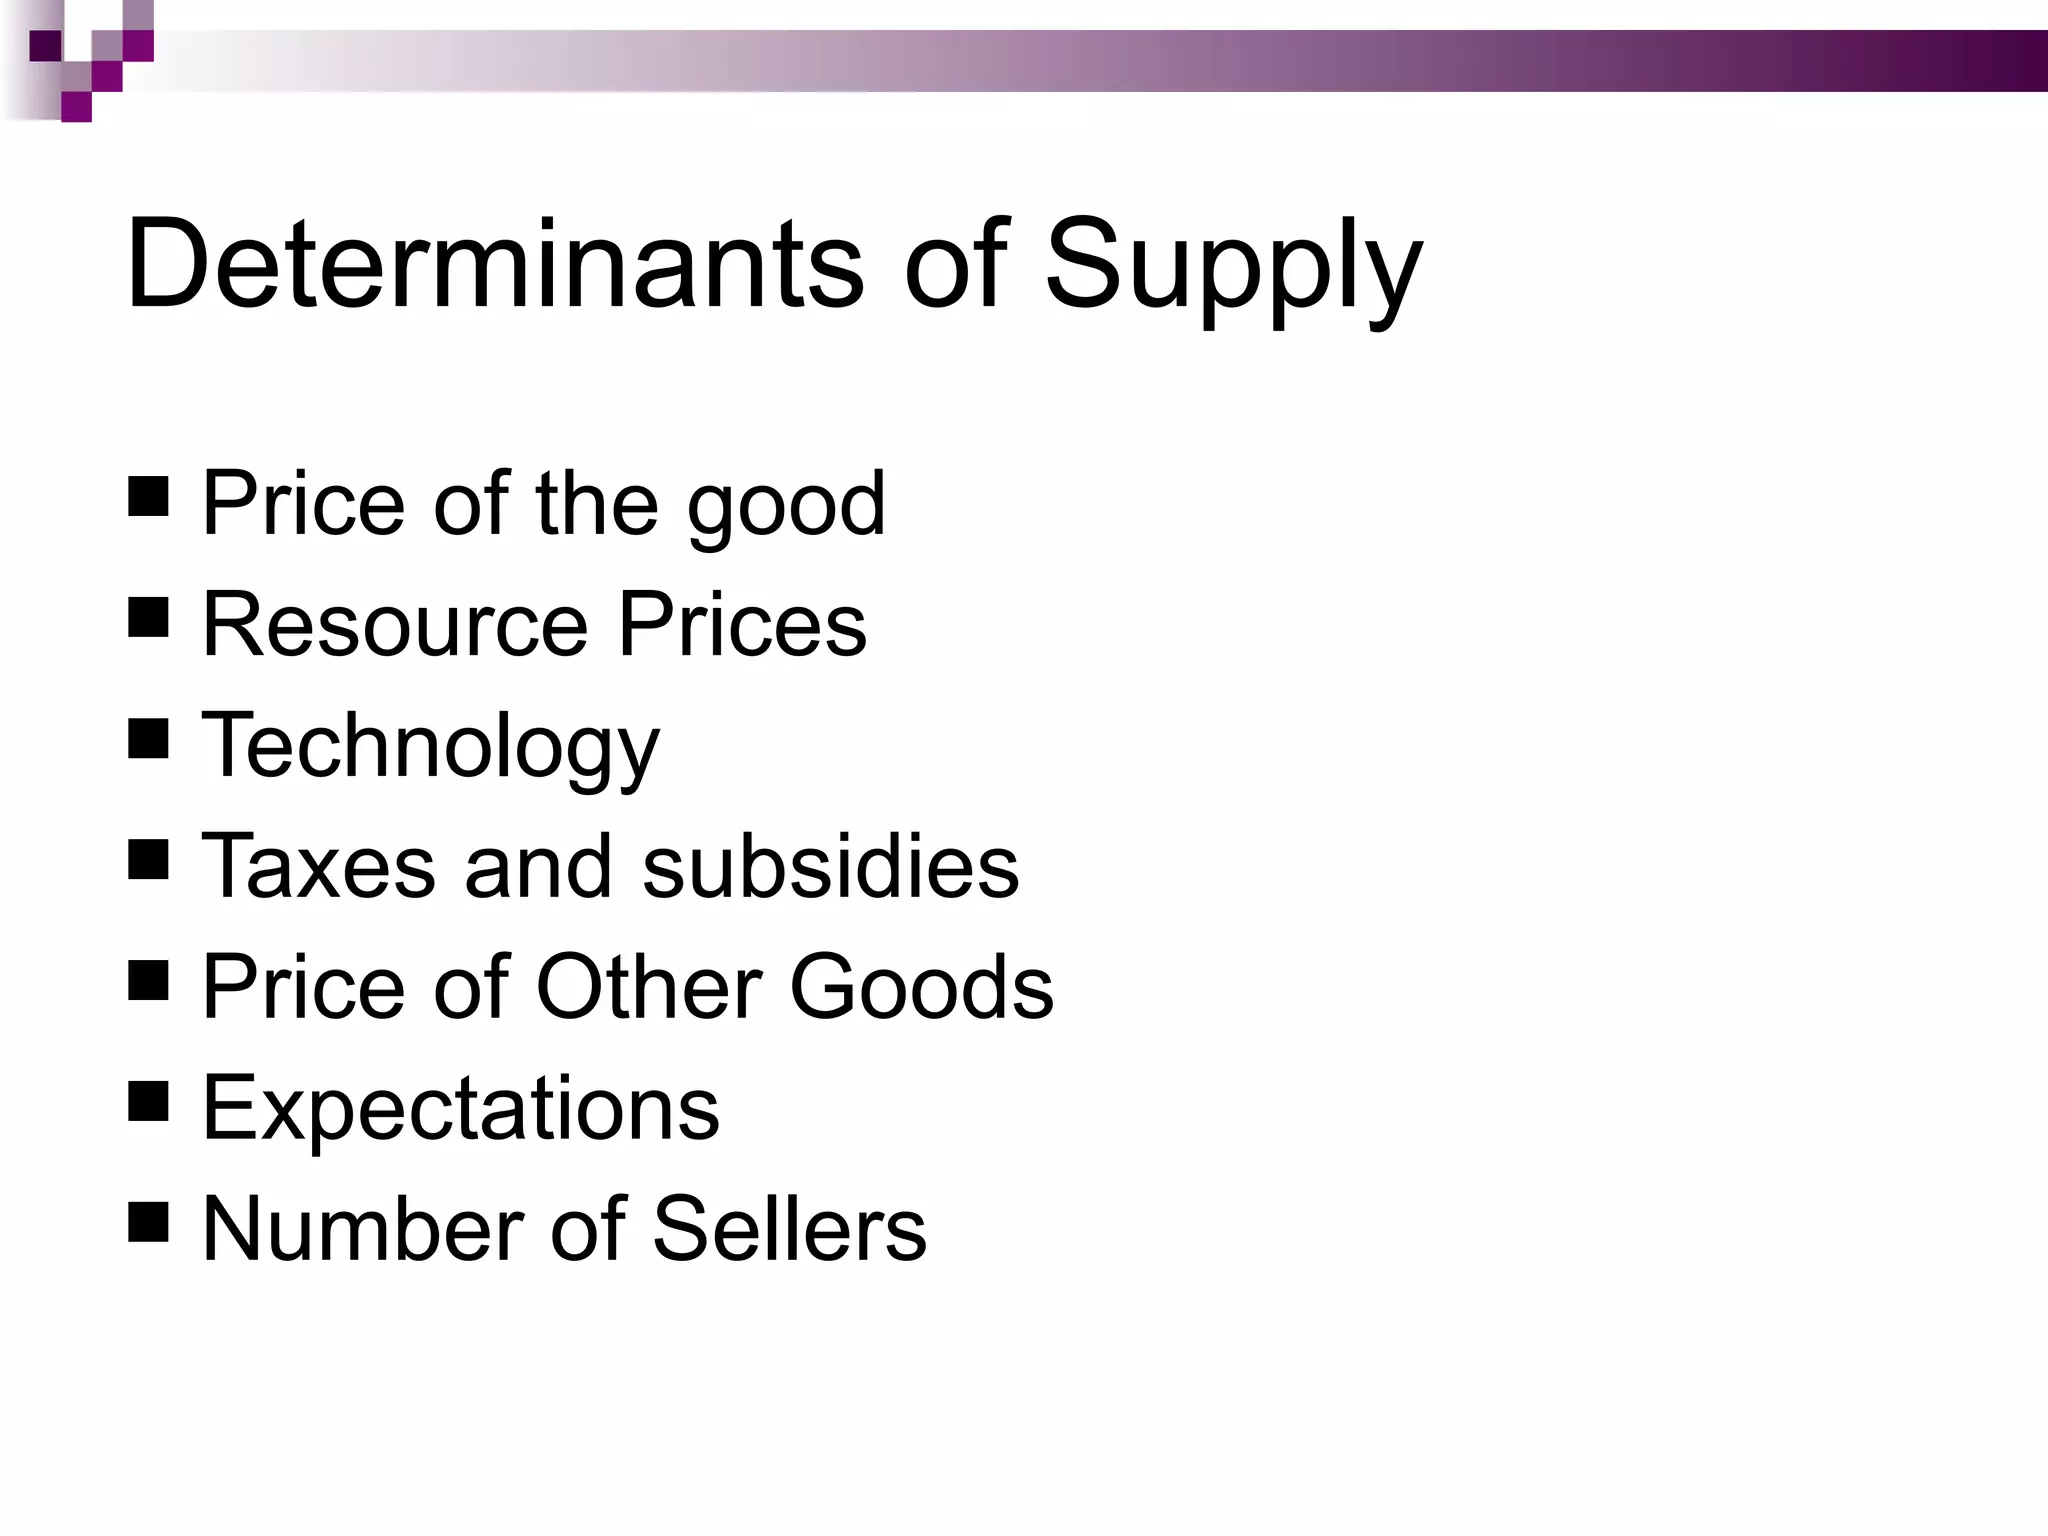
Price of the good
Price of related goods [substitutes and
complements]
The size of household income
Taste and fashion
Expectation
The distribution of income among households
Number of Buyers](https://image.slidesharecdn.com/thetheoryofdemandandsupply-120524041817-phpapp02/75/The-theory-of-demand-and-supply-11-2048.jpg)


![Conclusion
The importance of the concept of demand of
supply is evident from the following quote:
“ Teach a parrot the terms “Demand and Supply”
and you’ve got an Economist.”
-Thomas Carlyle
[Scottish Historian & Essayist
of the Victorian Era]](https://image.slidesharecdn.com/thetheoryofdemandandsupply-120524041817-phpapp02/75/The-theory-of-demand-and-supply-43-2048.jpg)