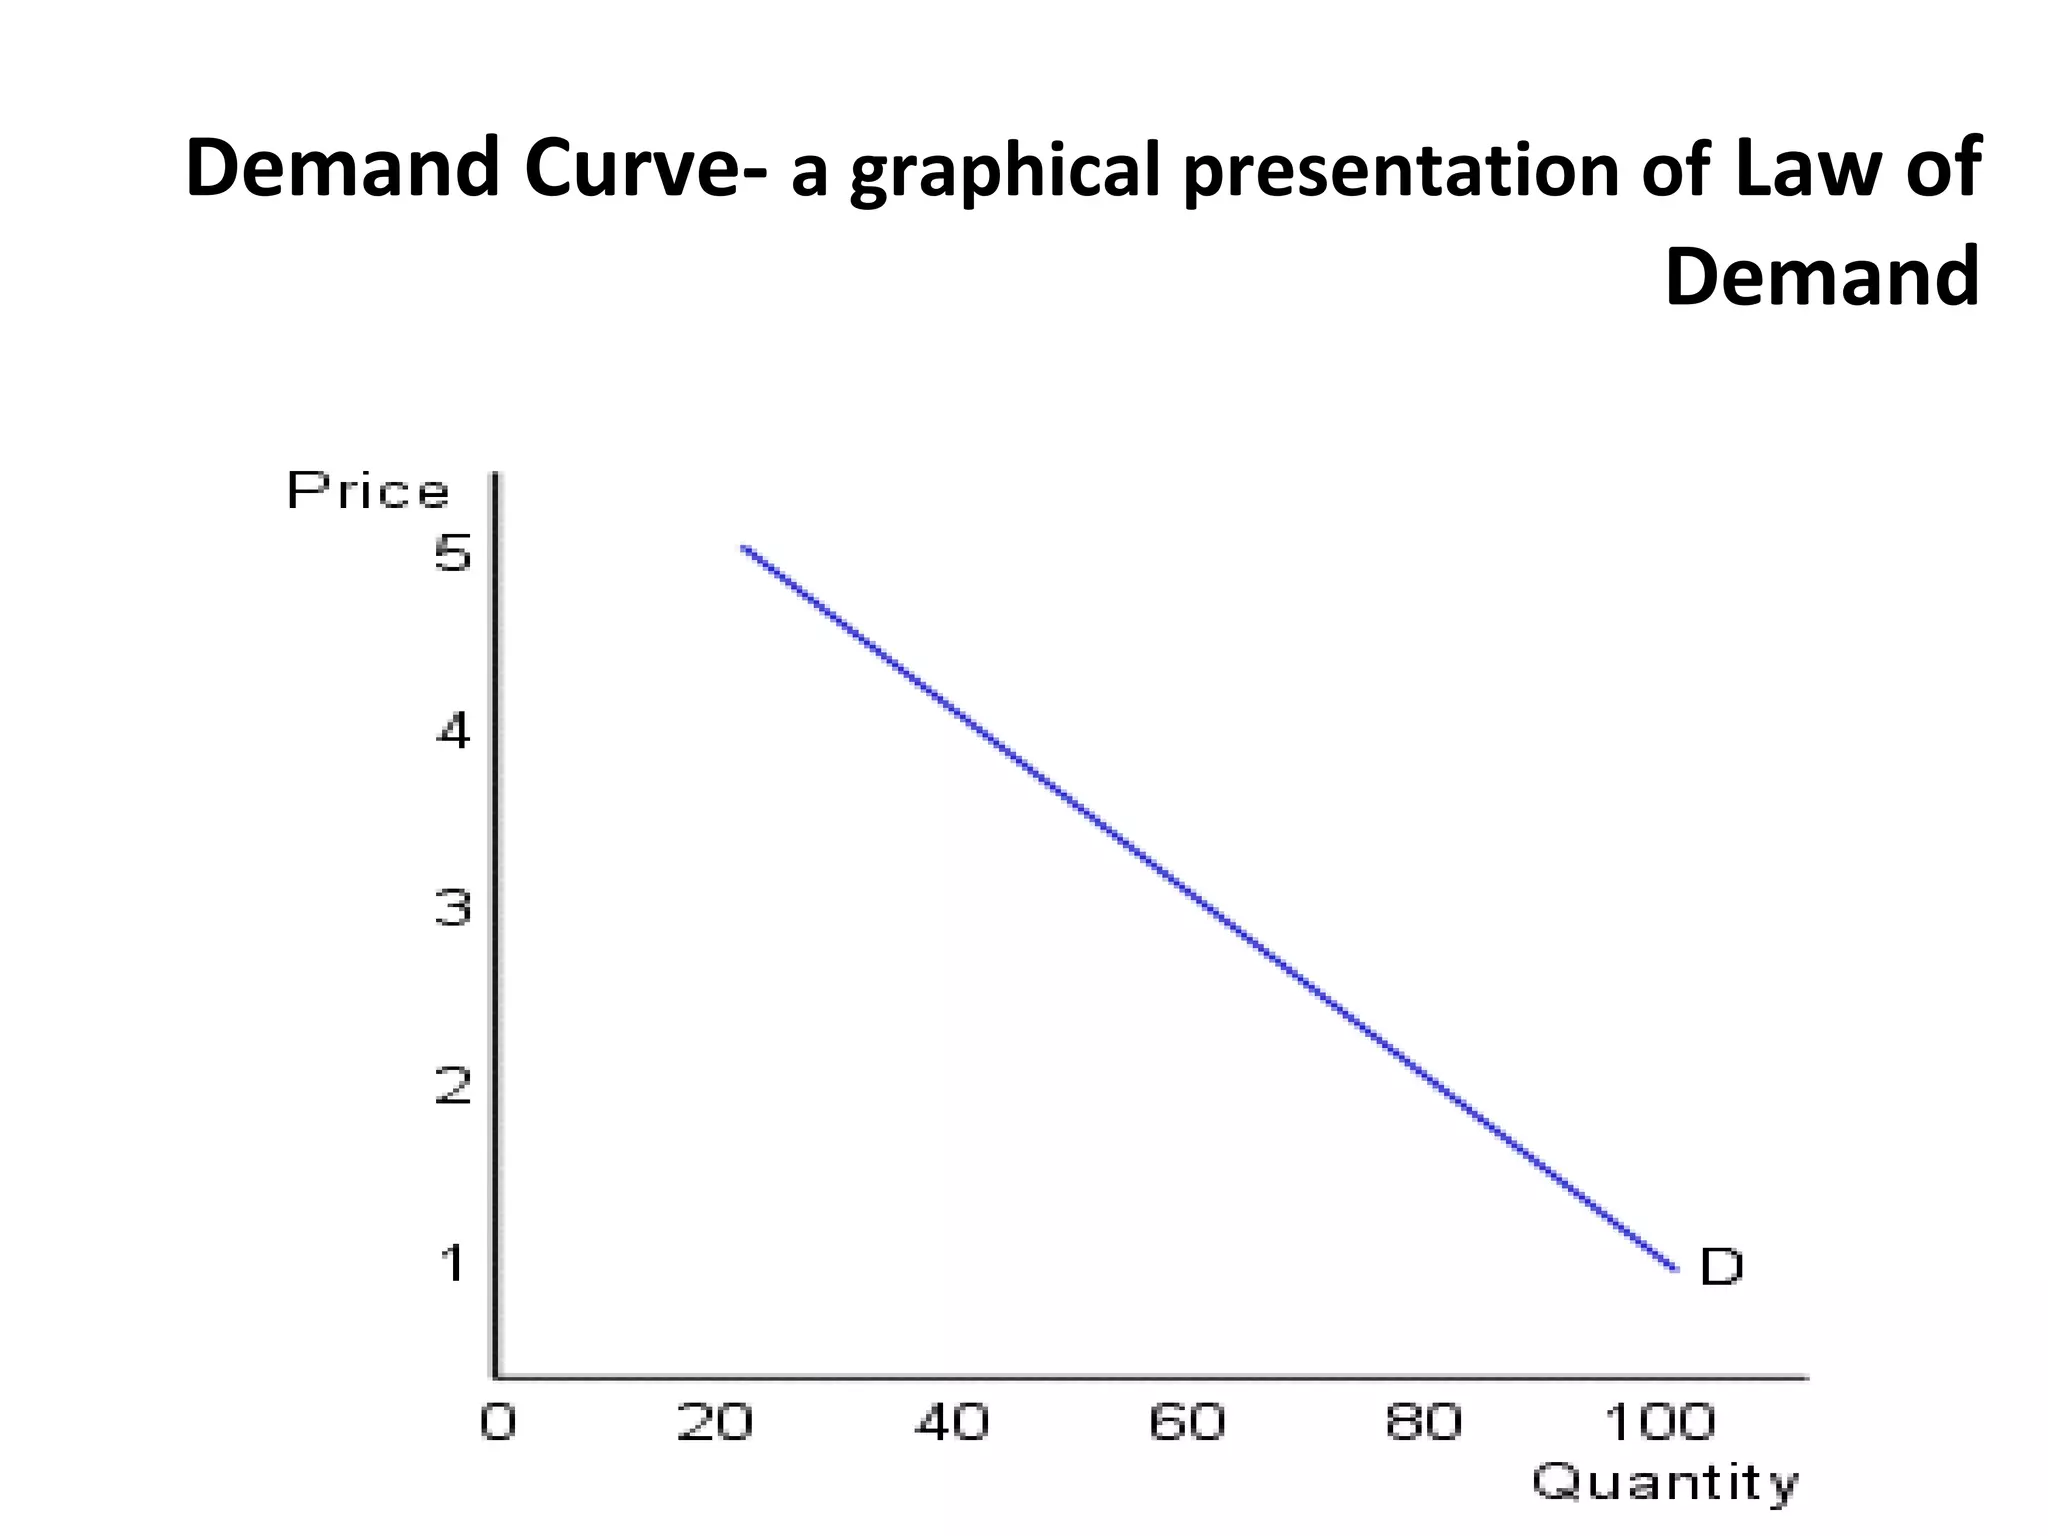
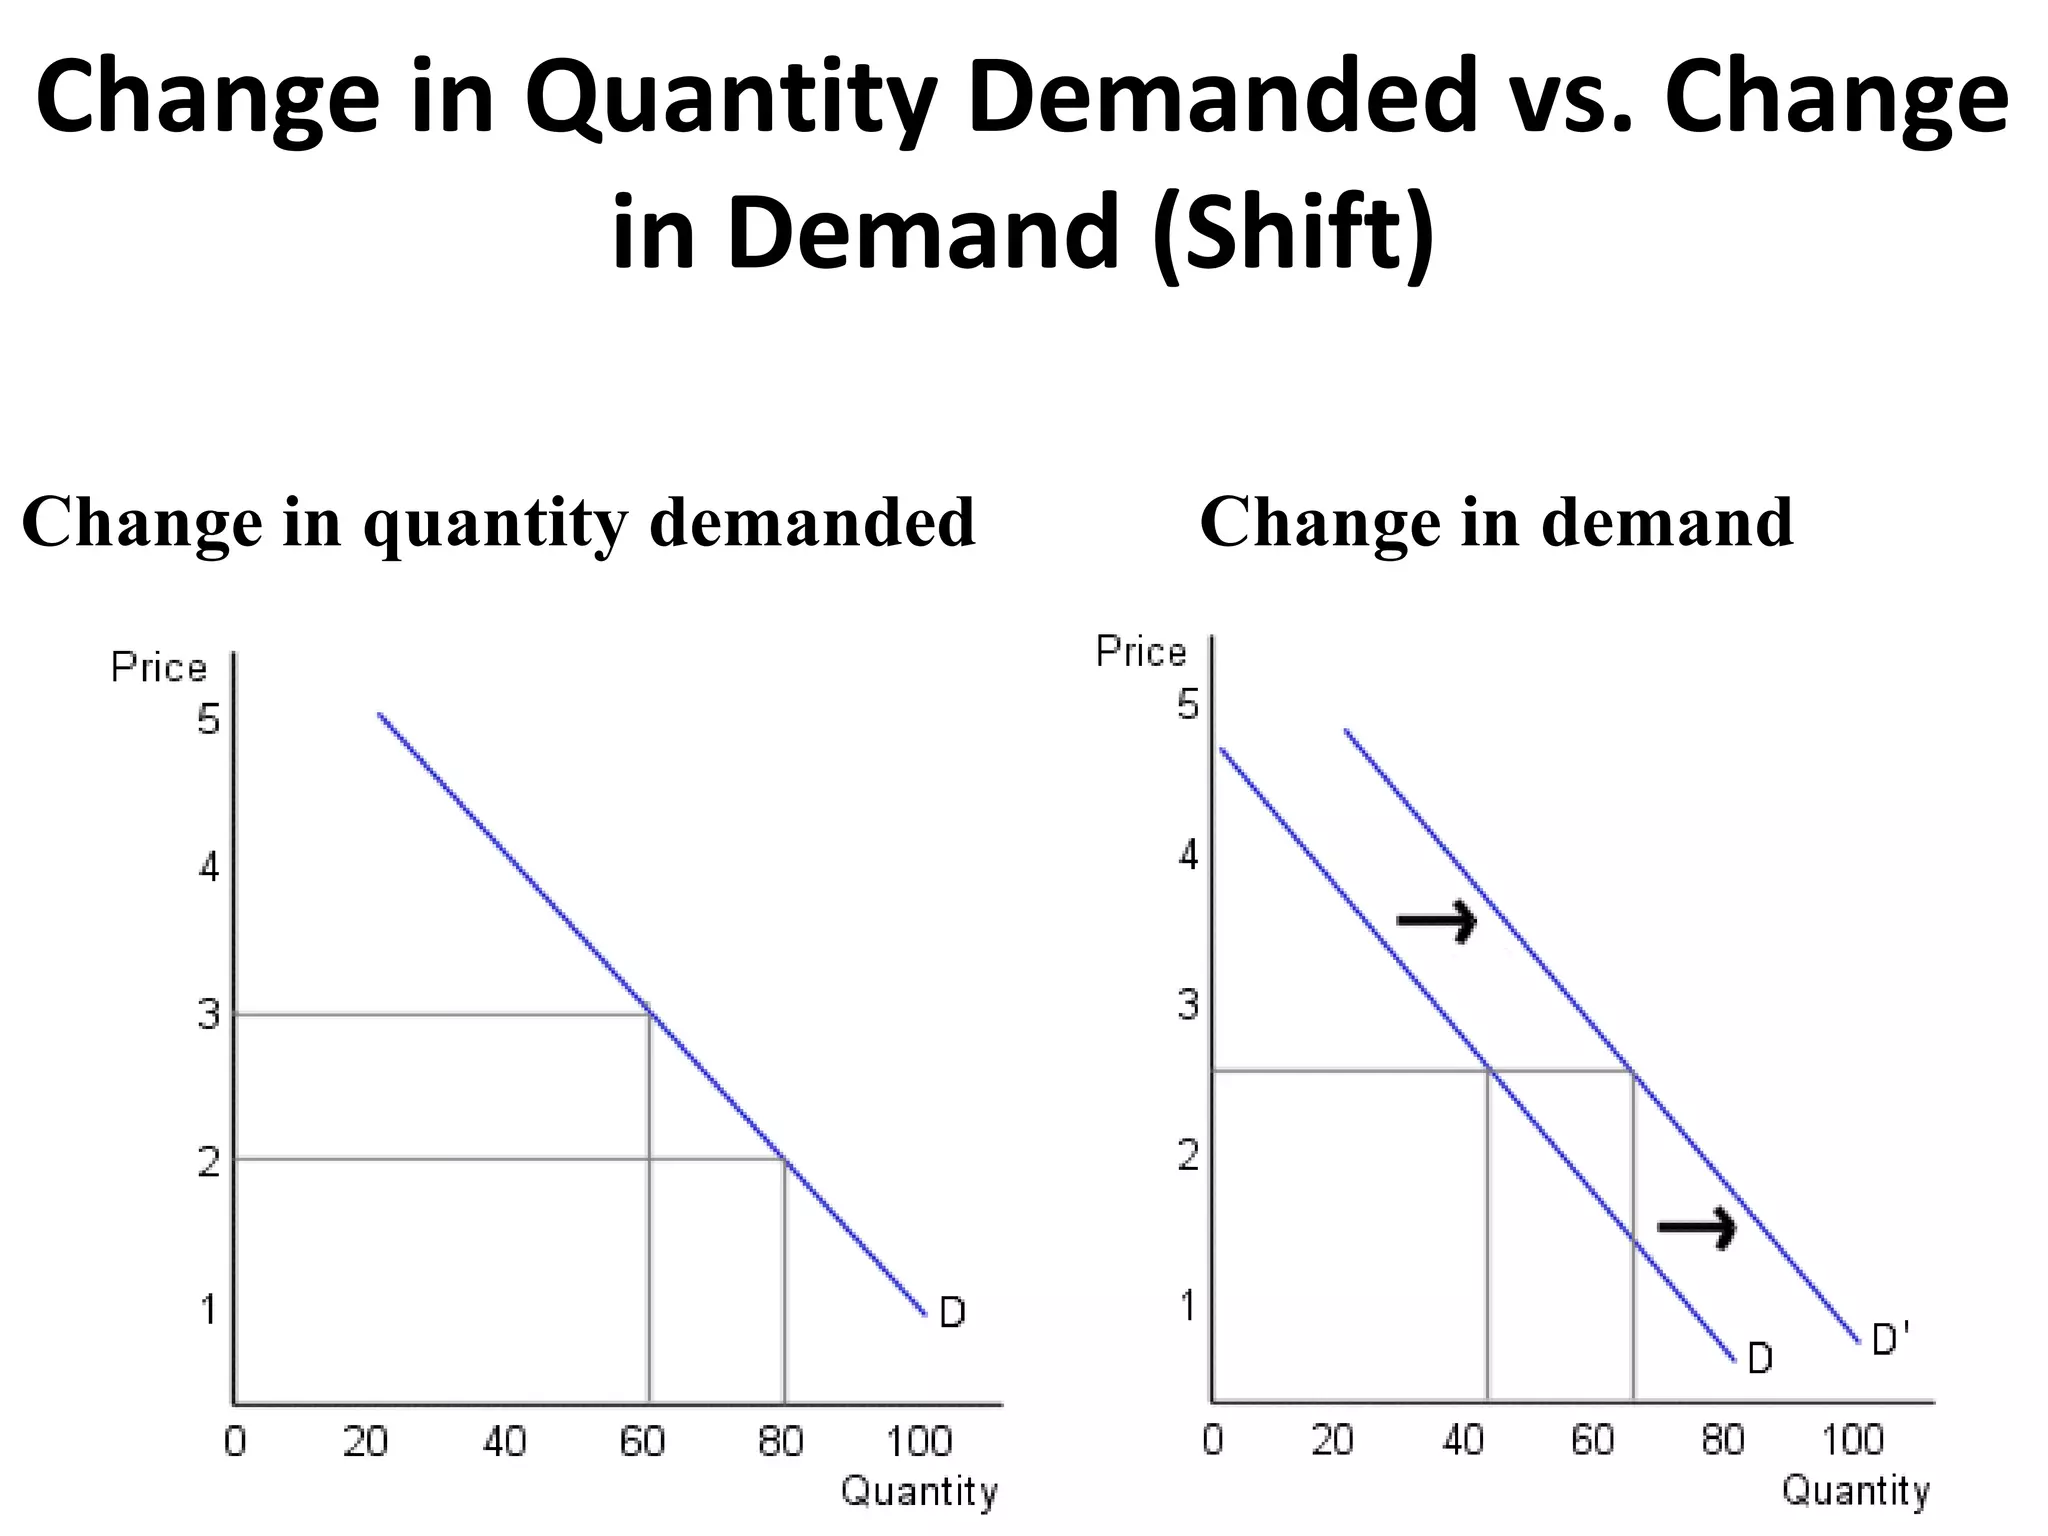
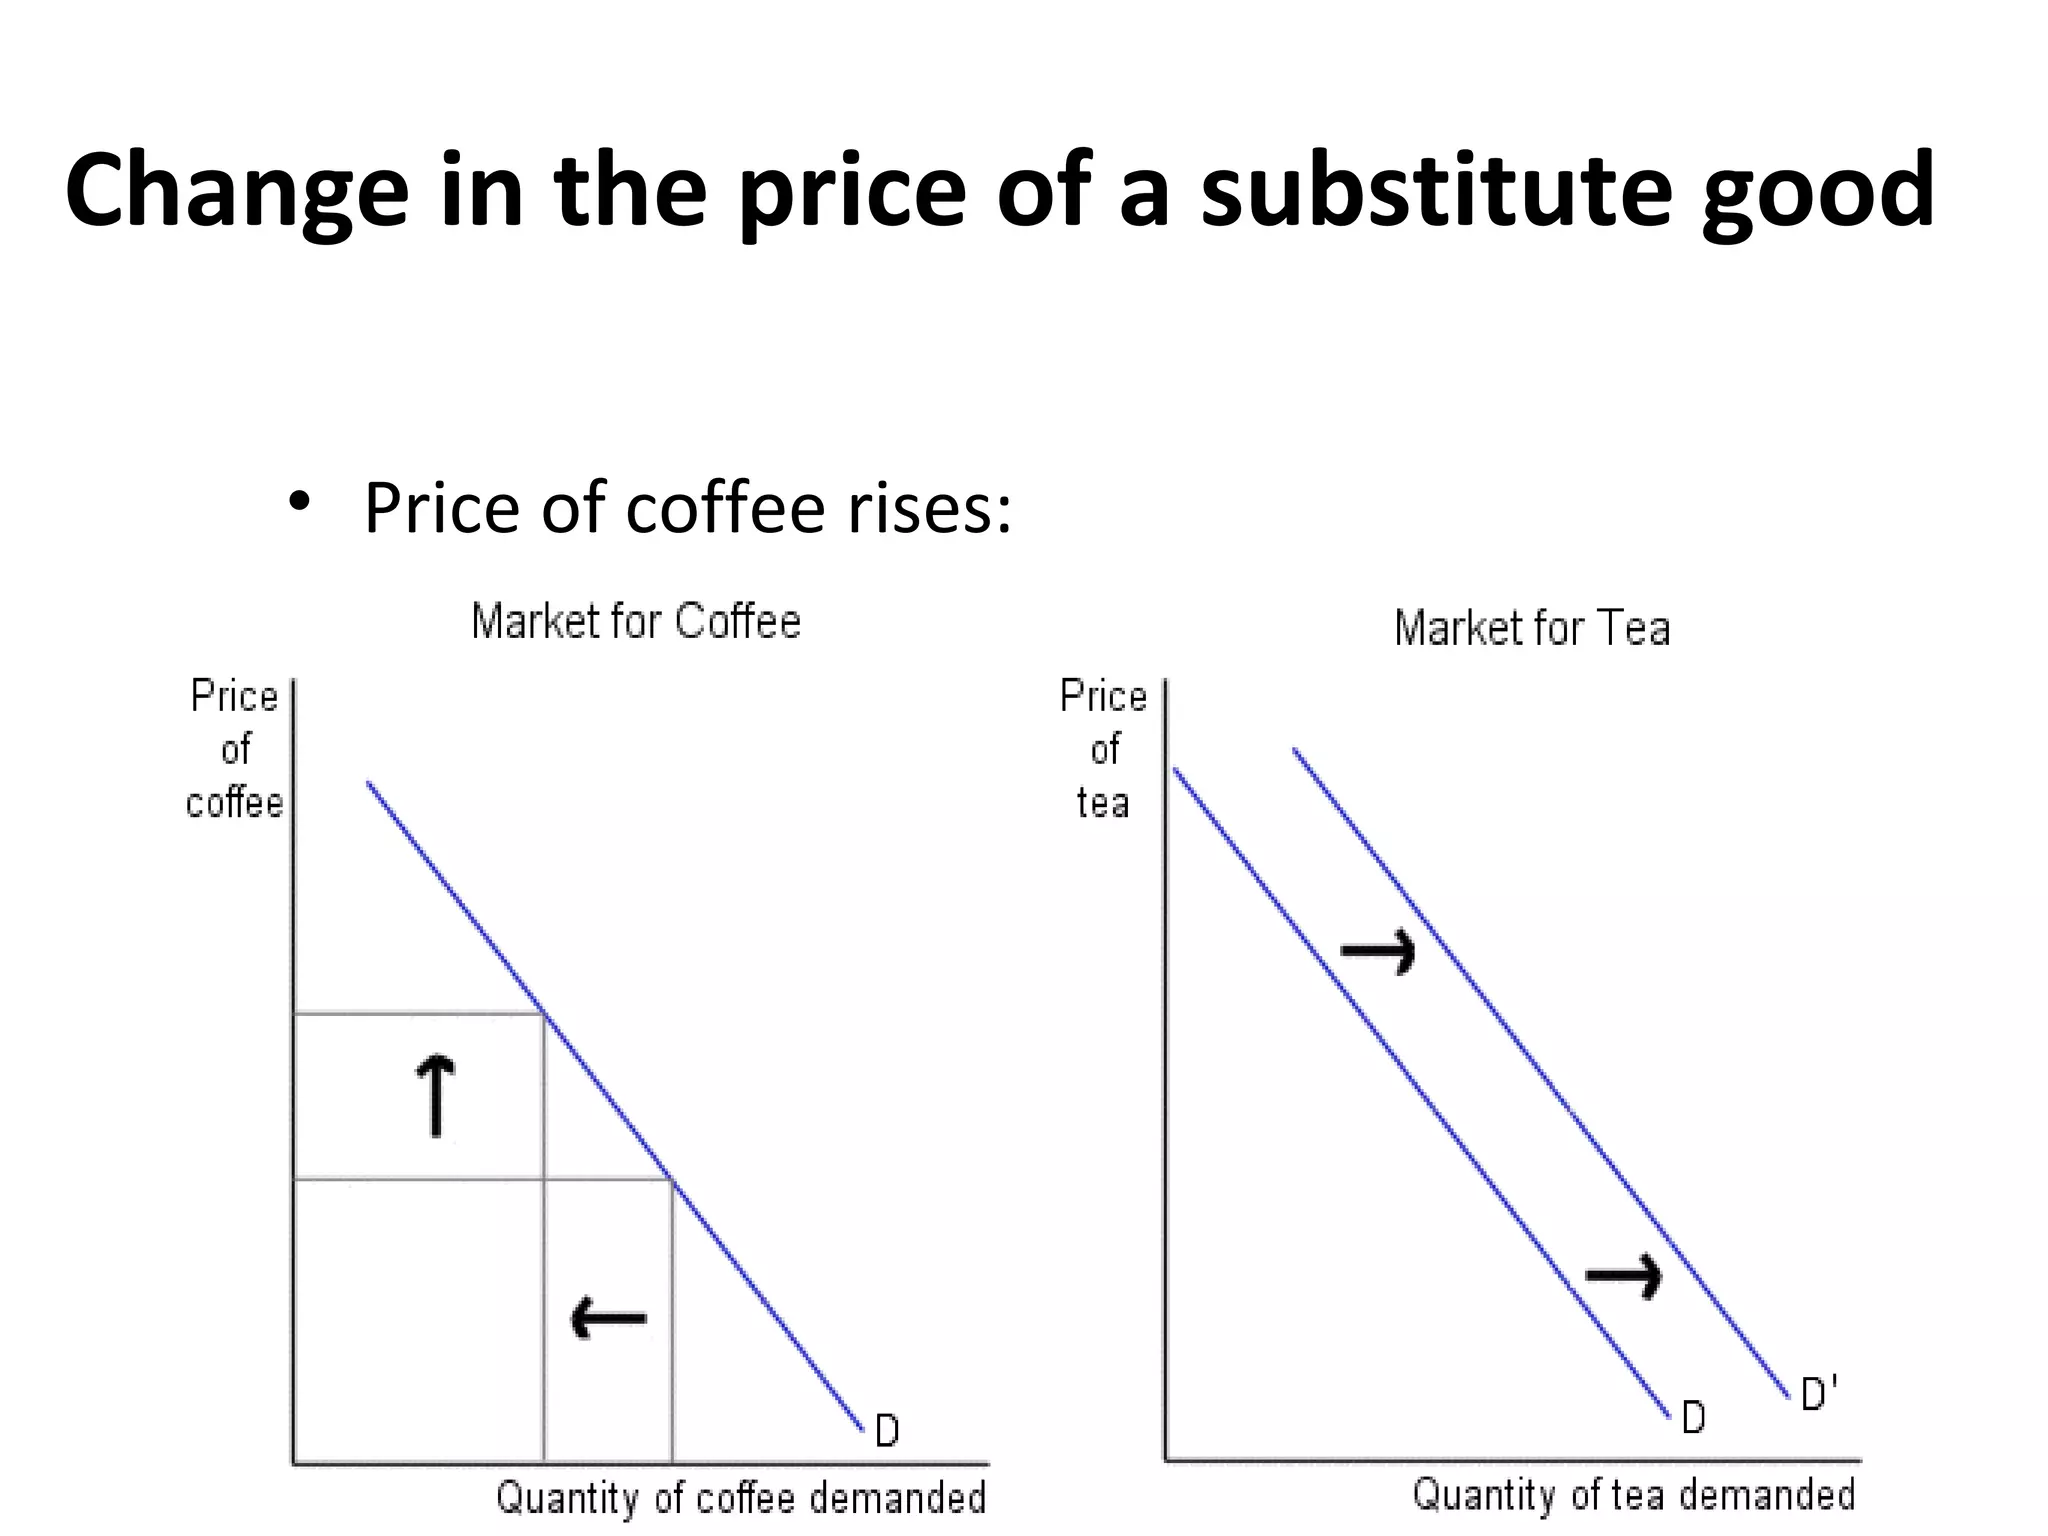
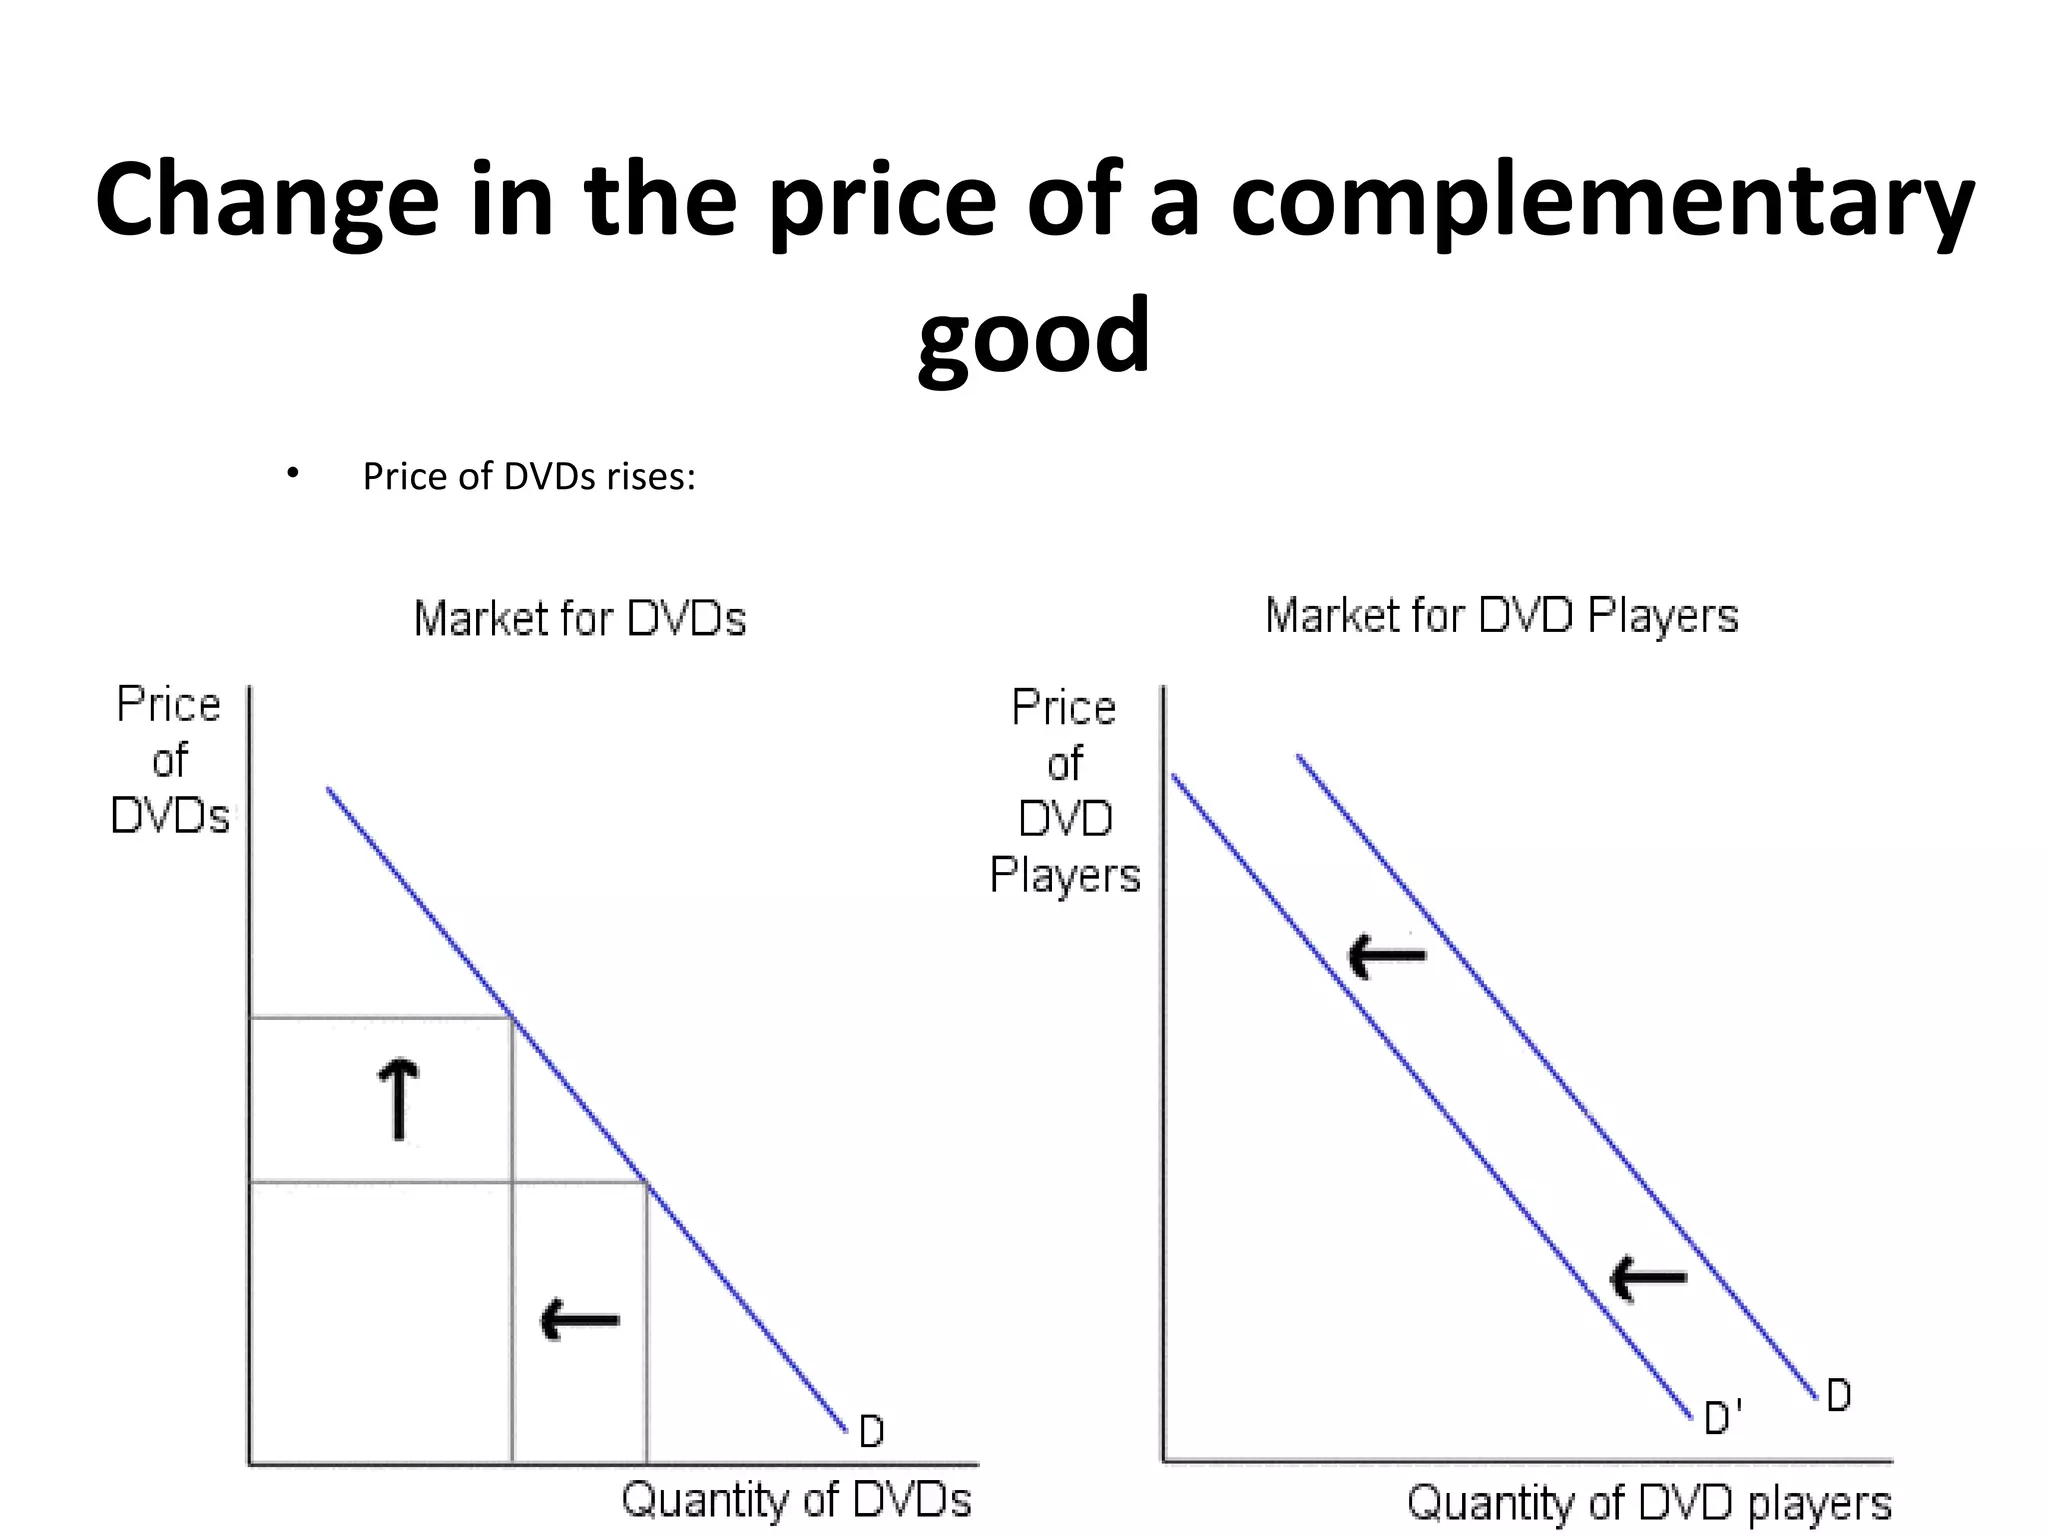
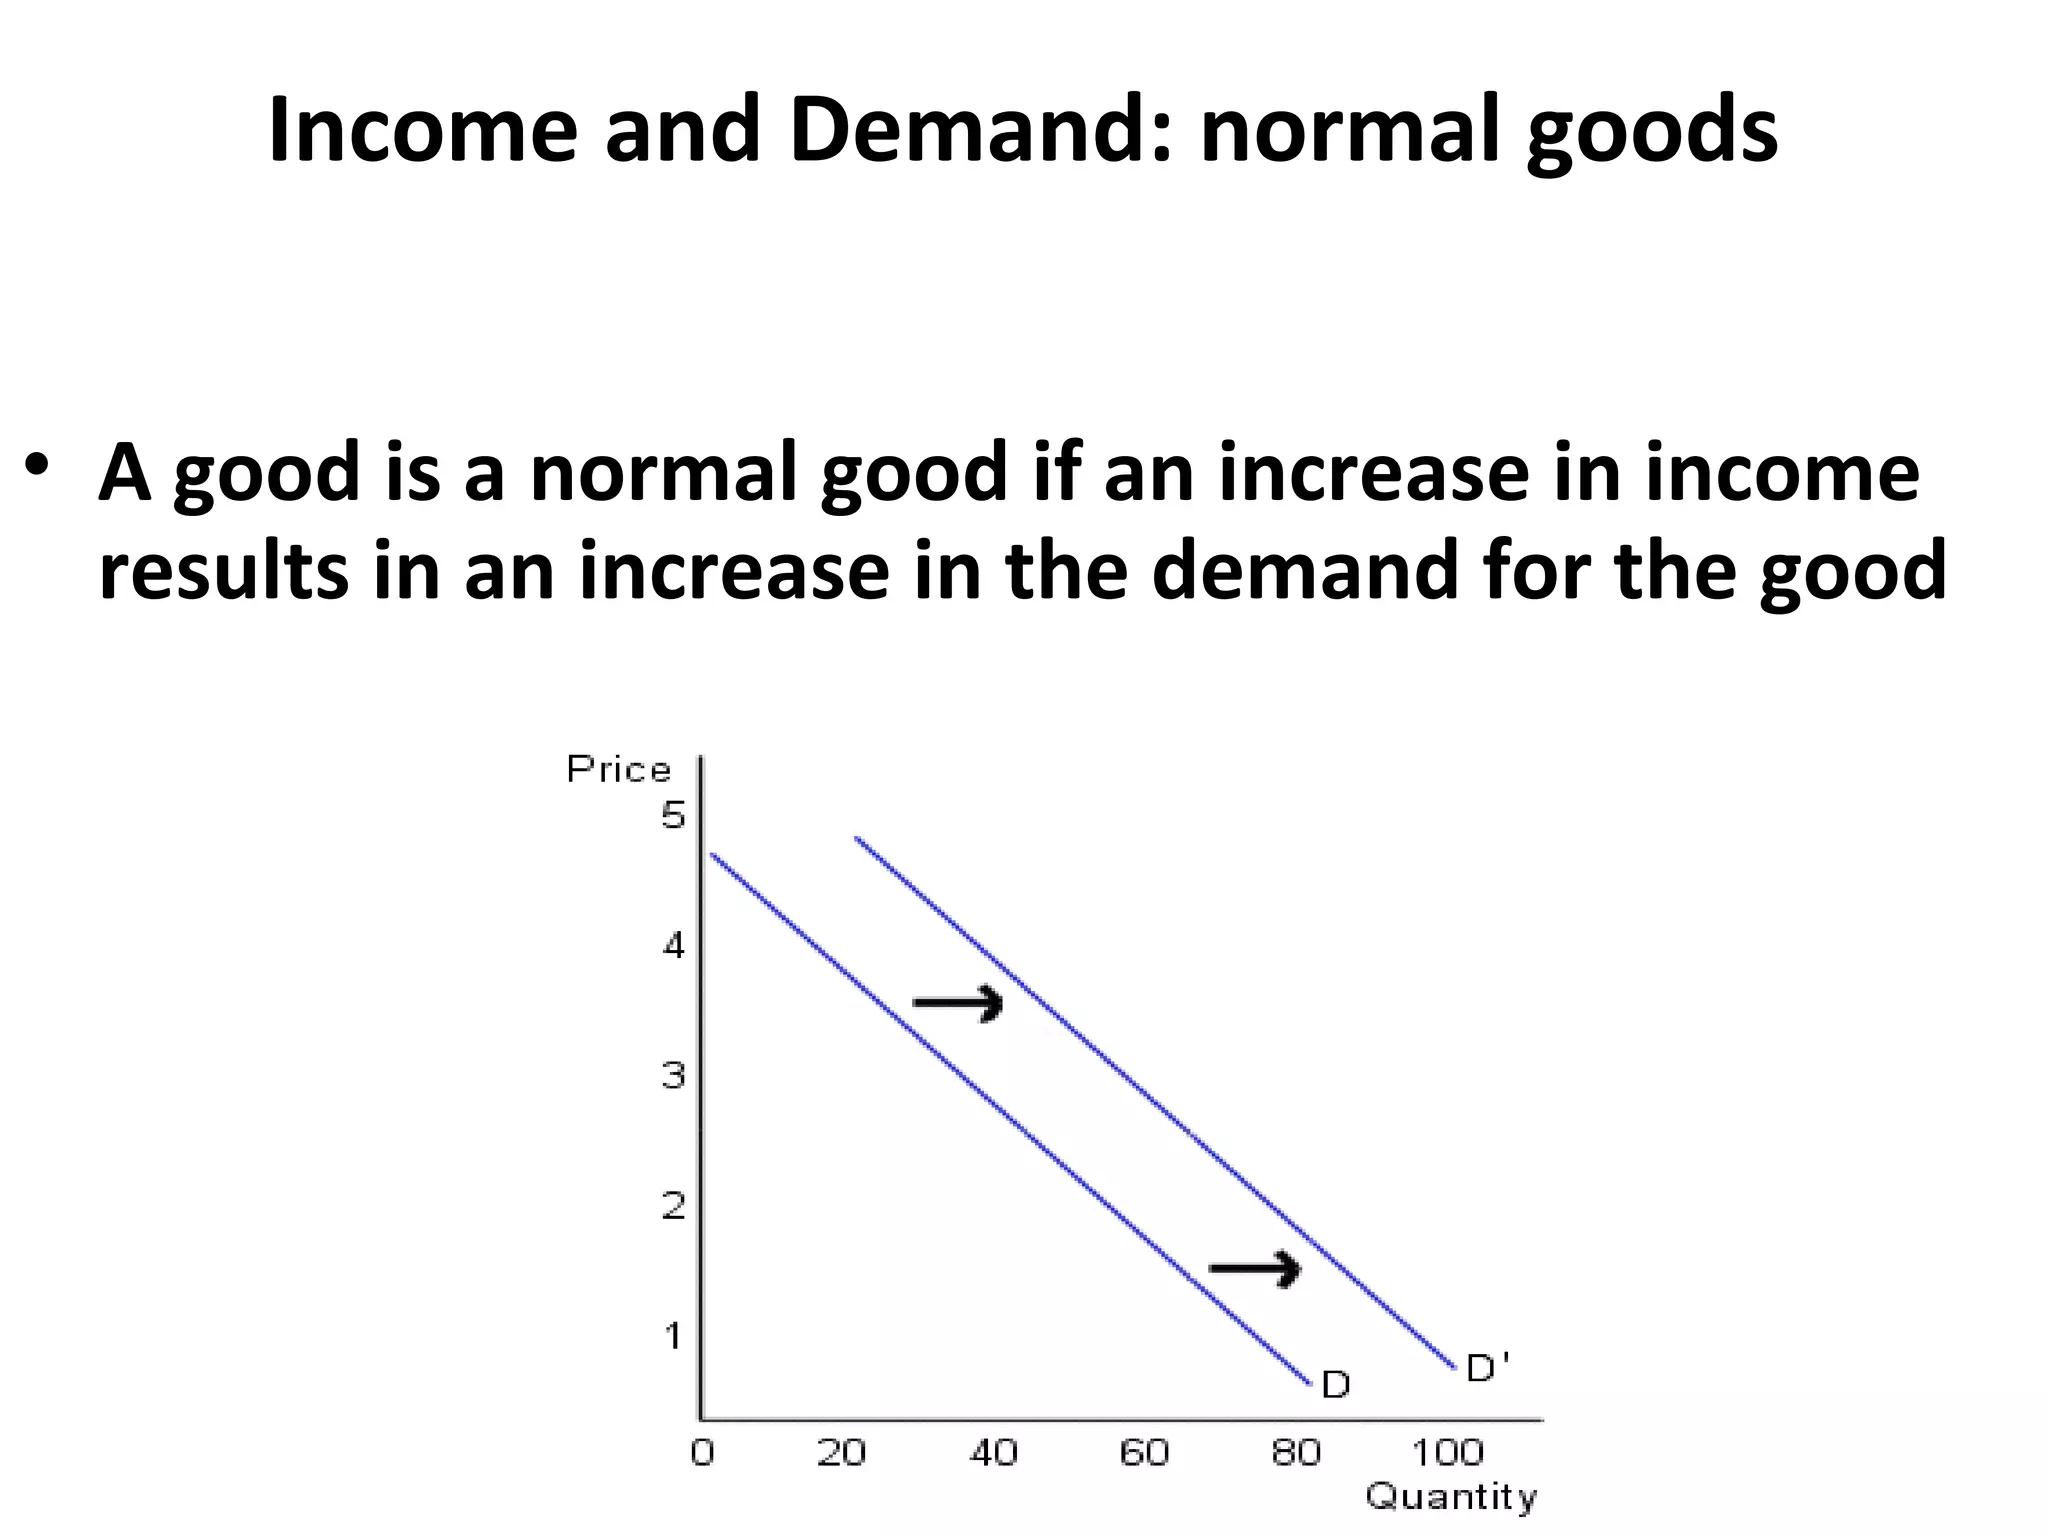
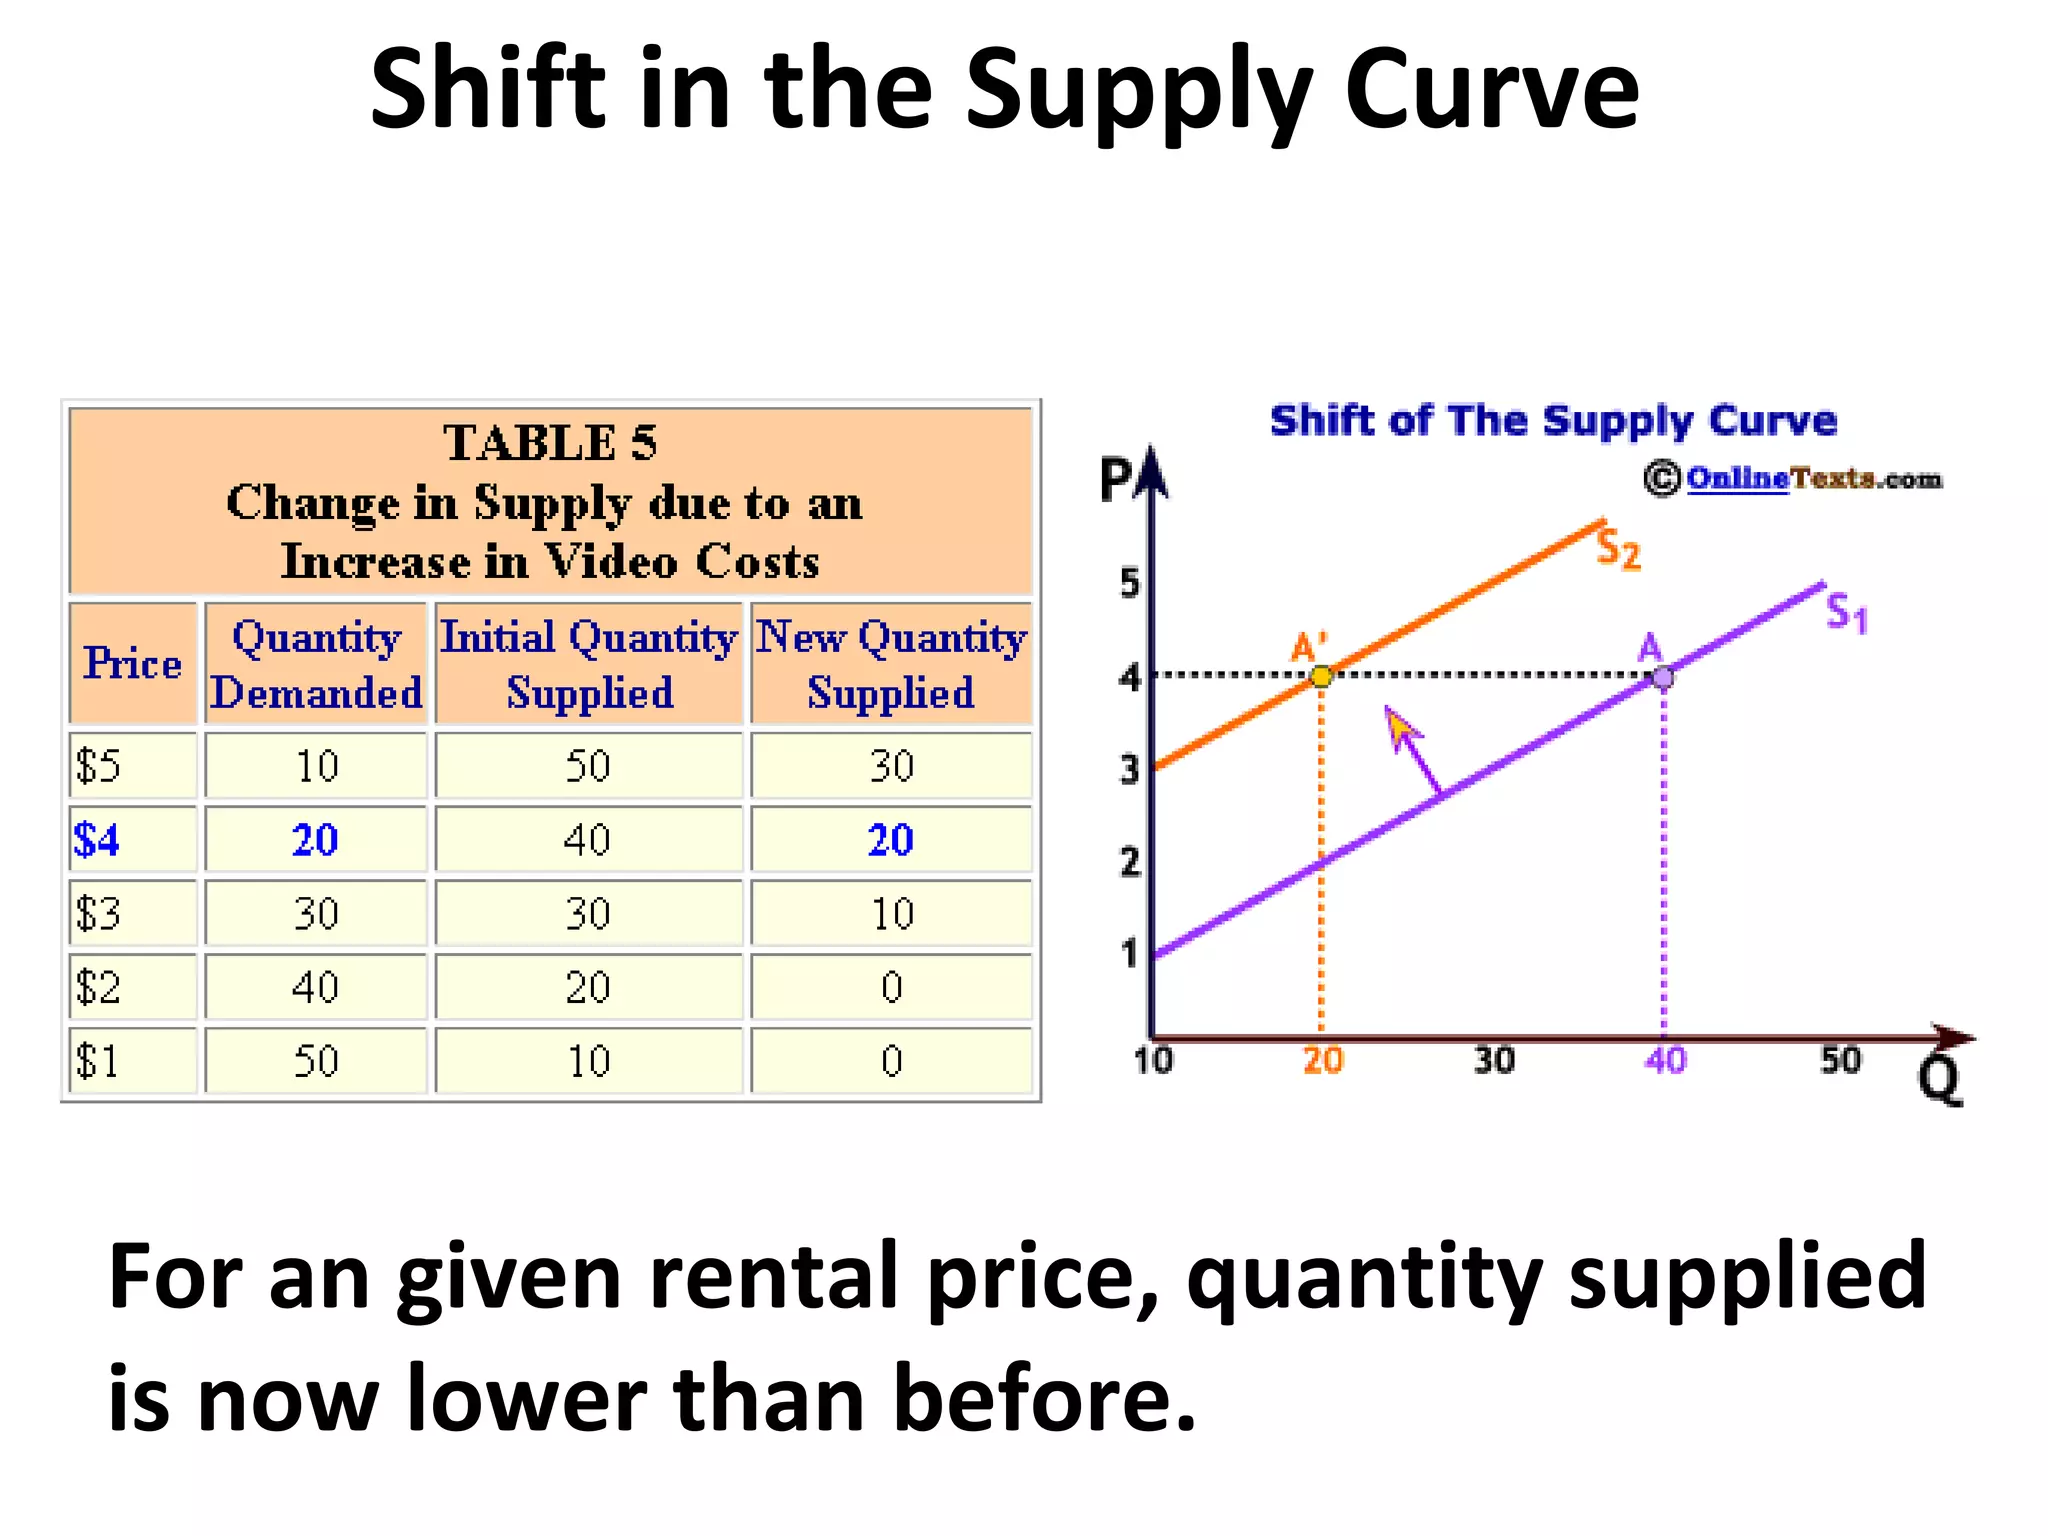
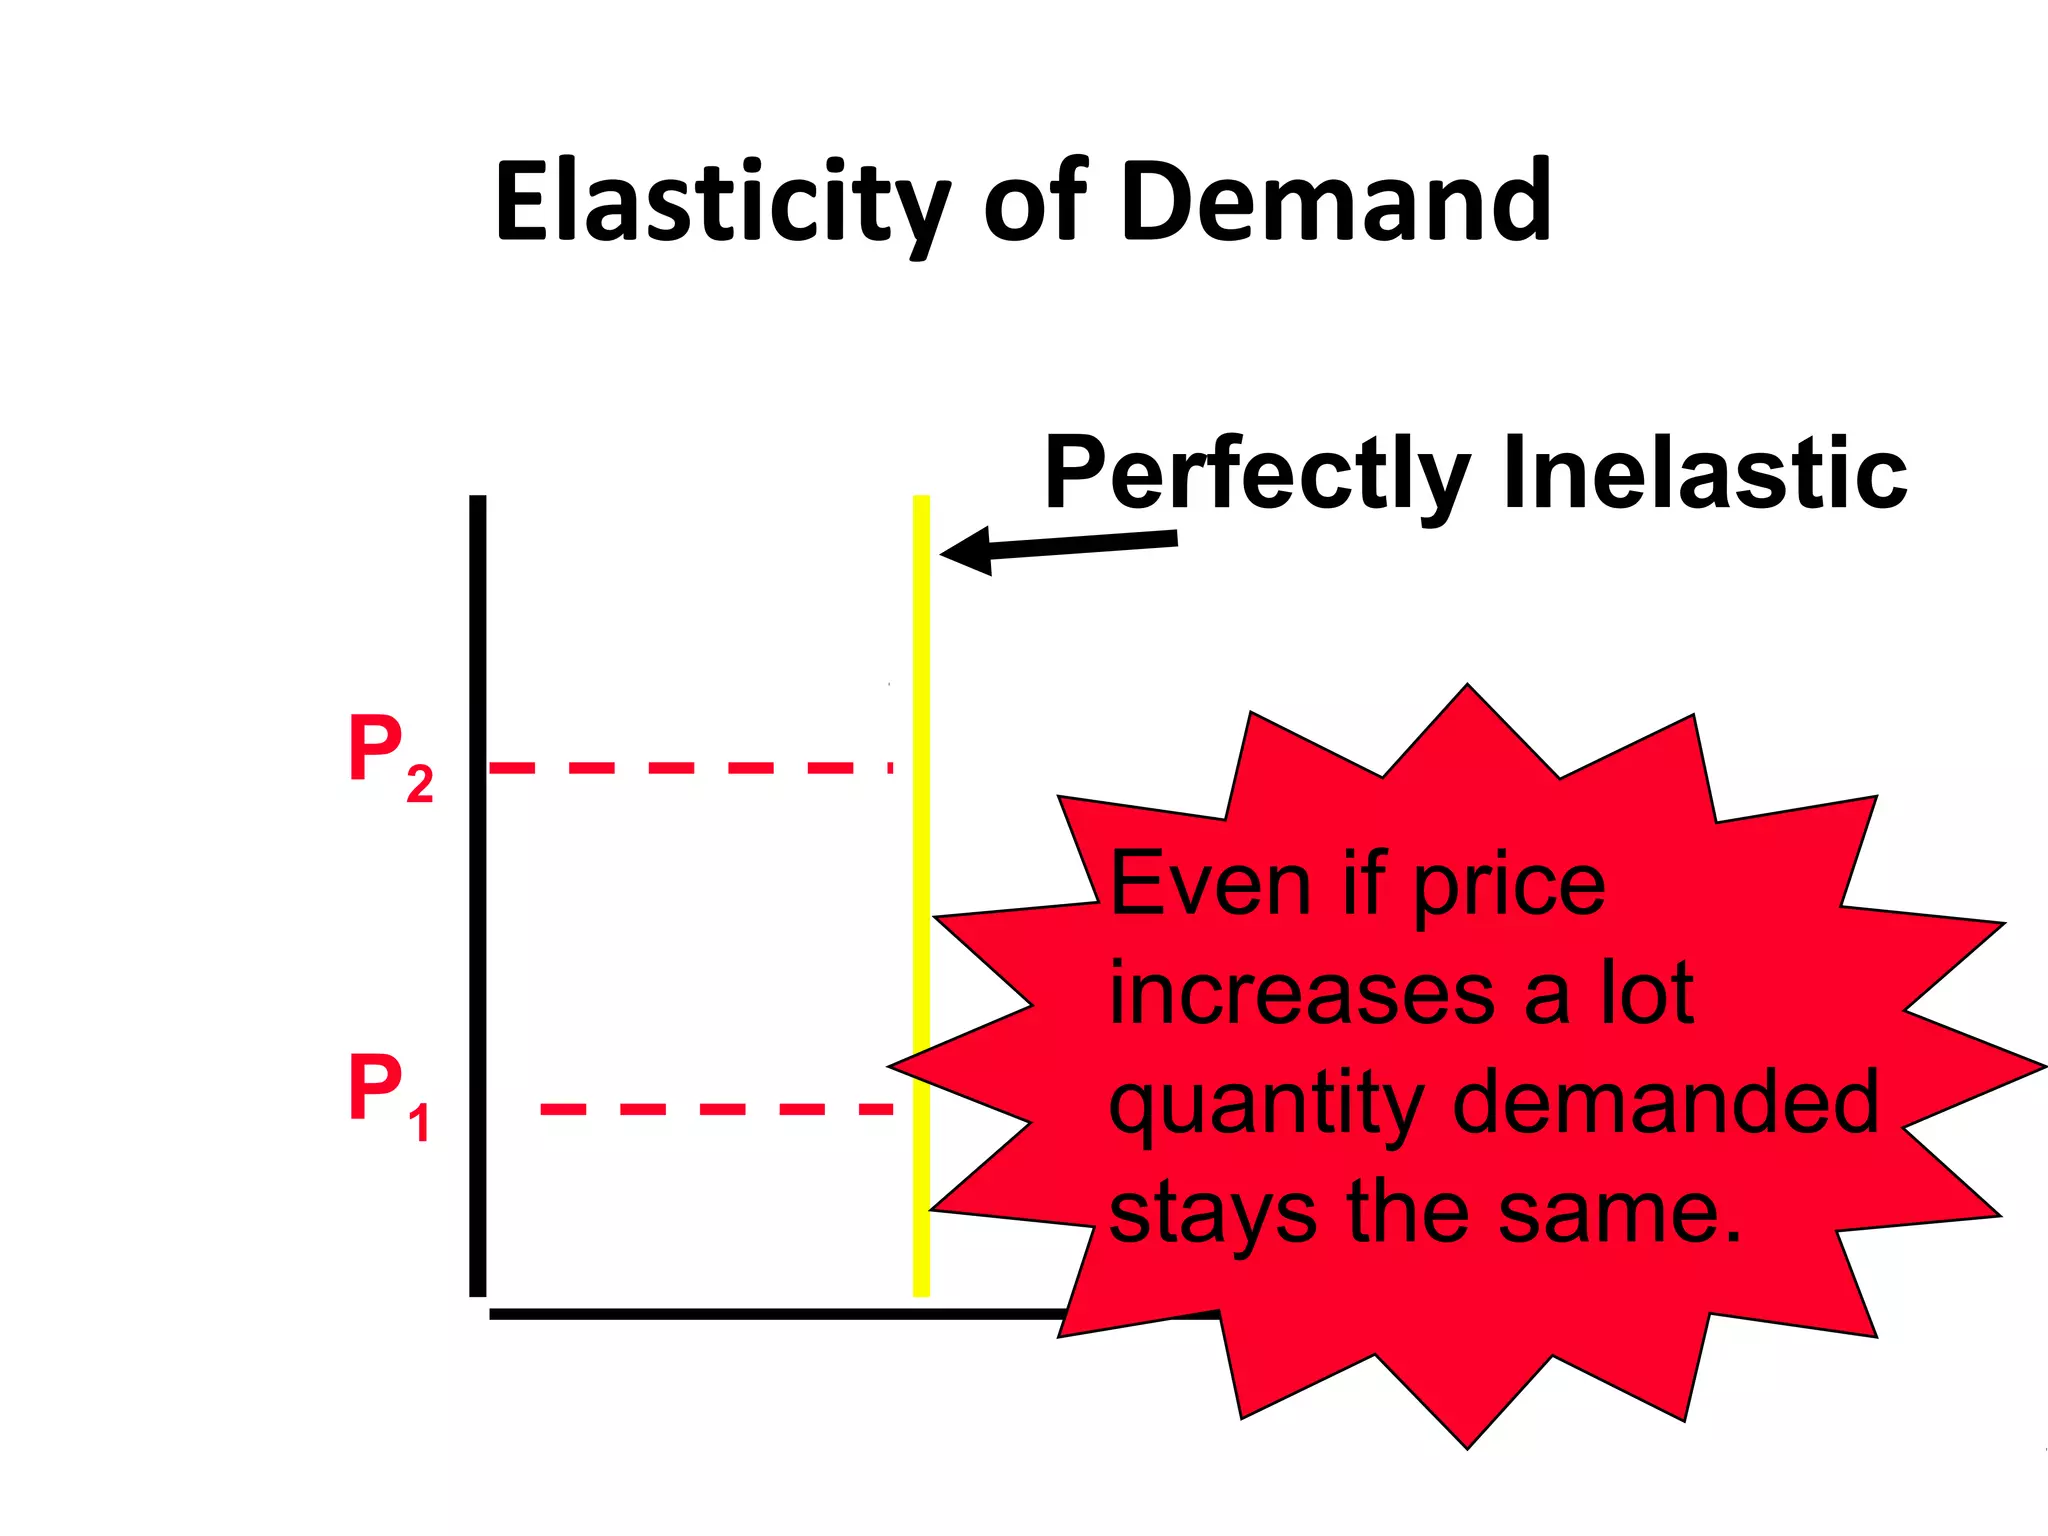
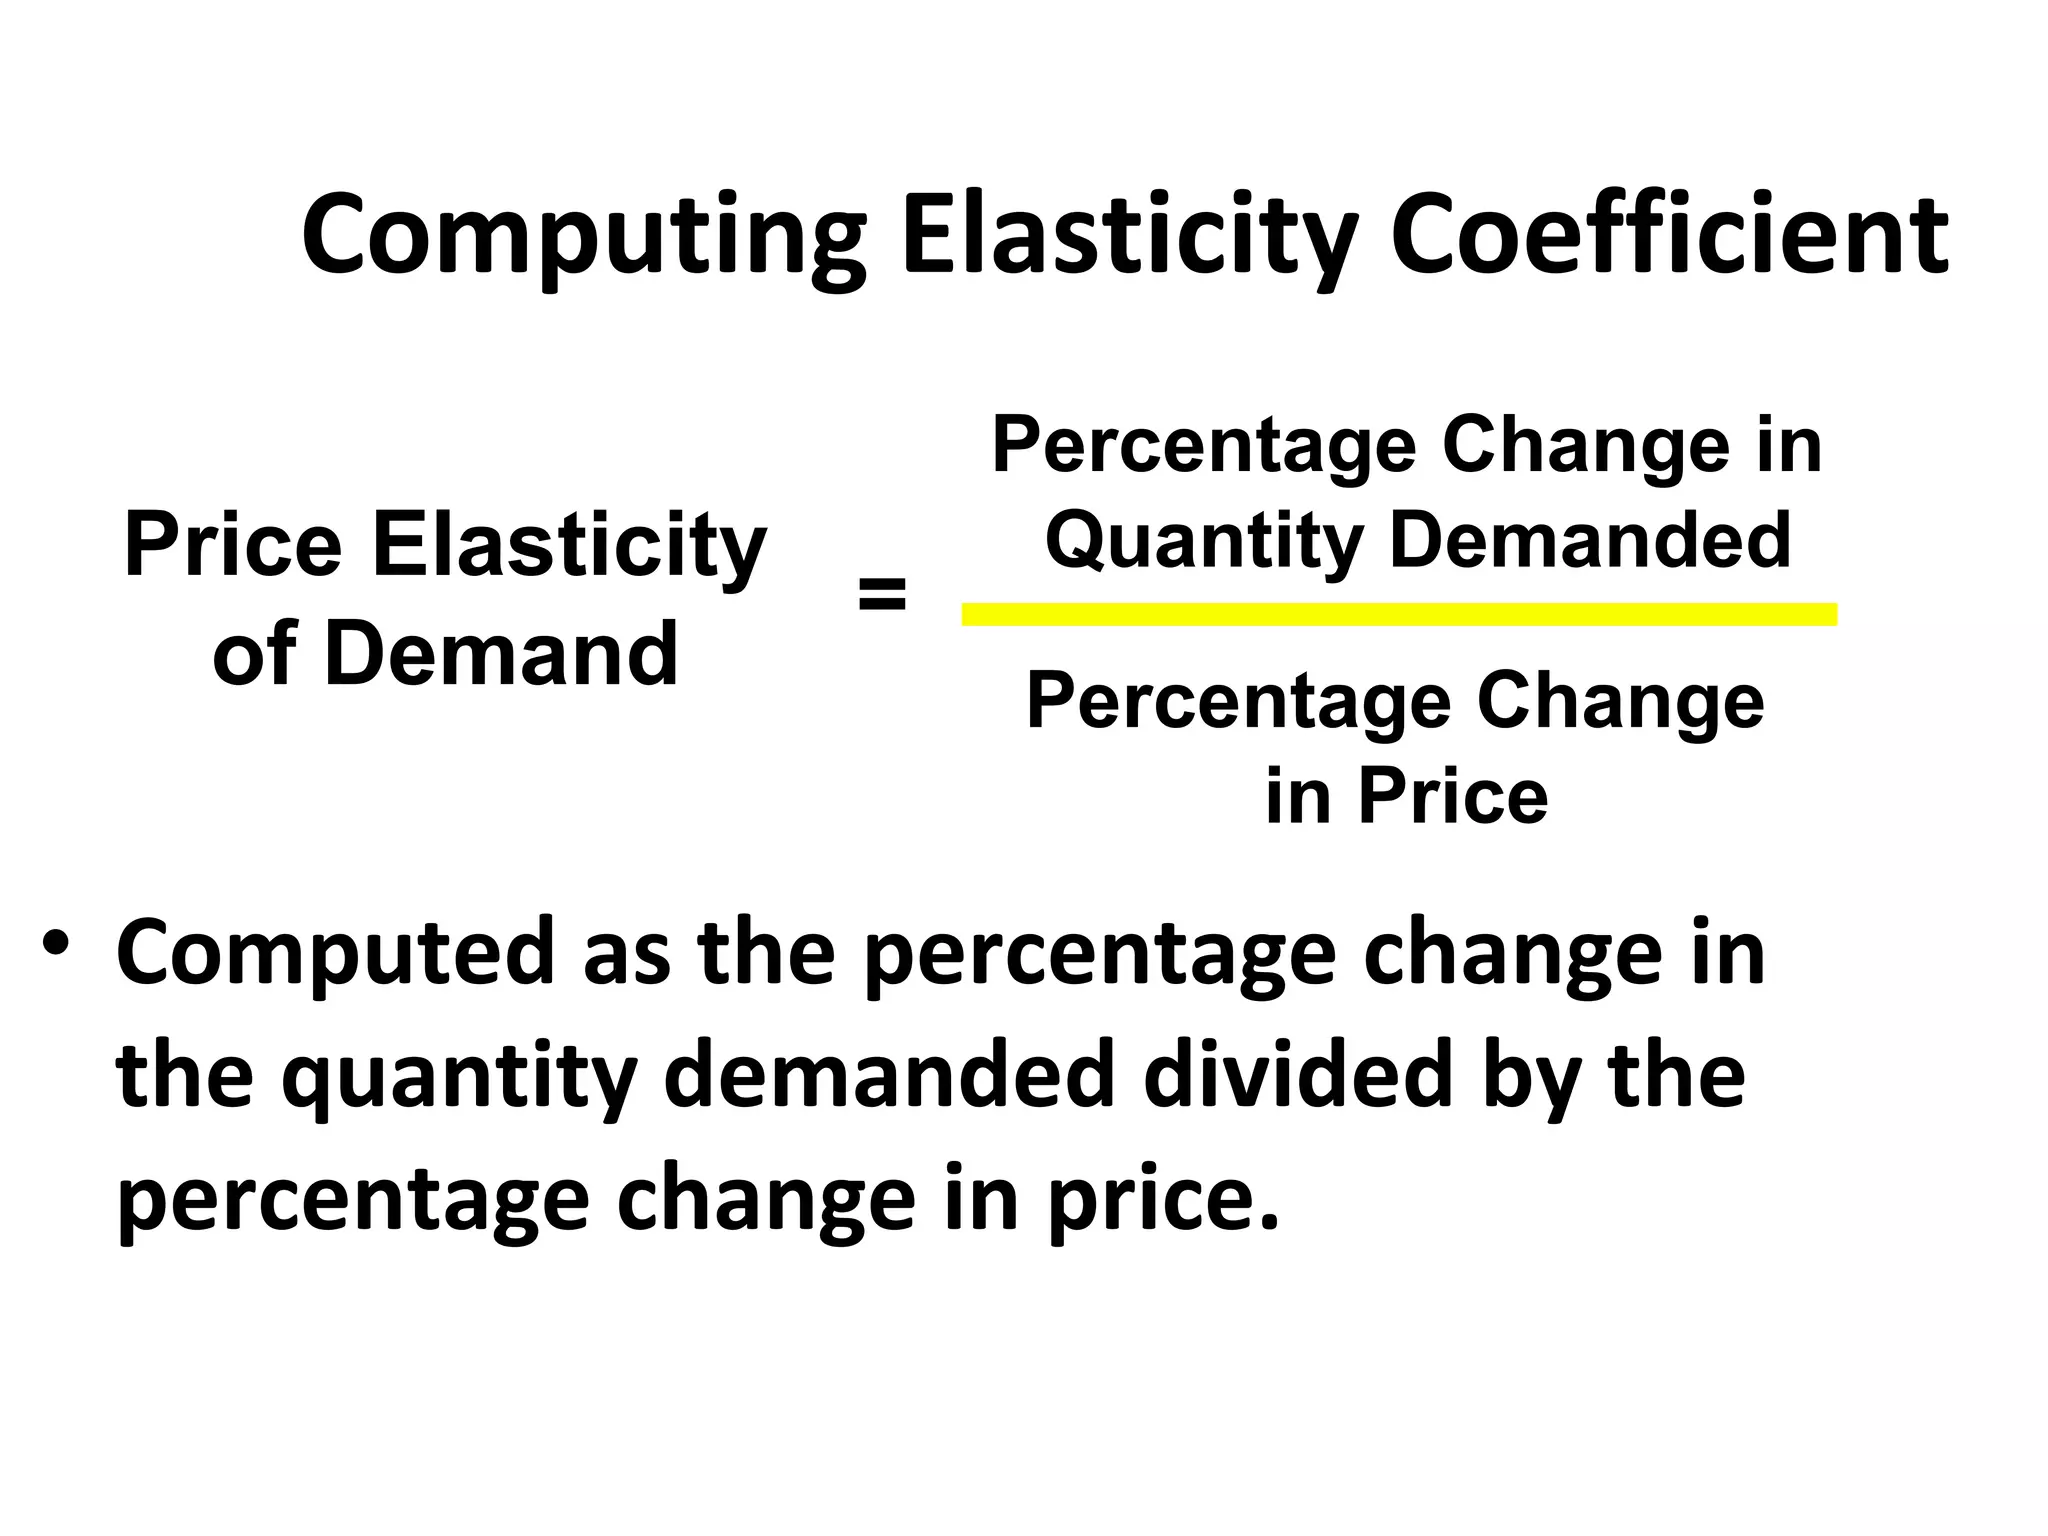
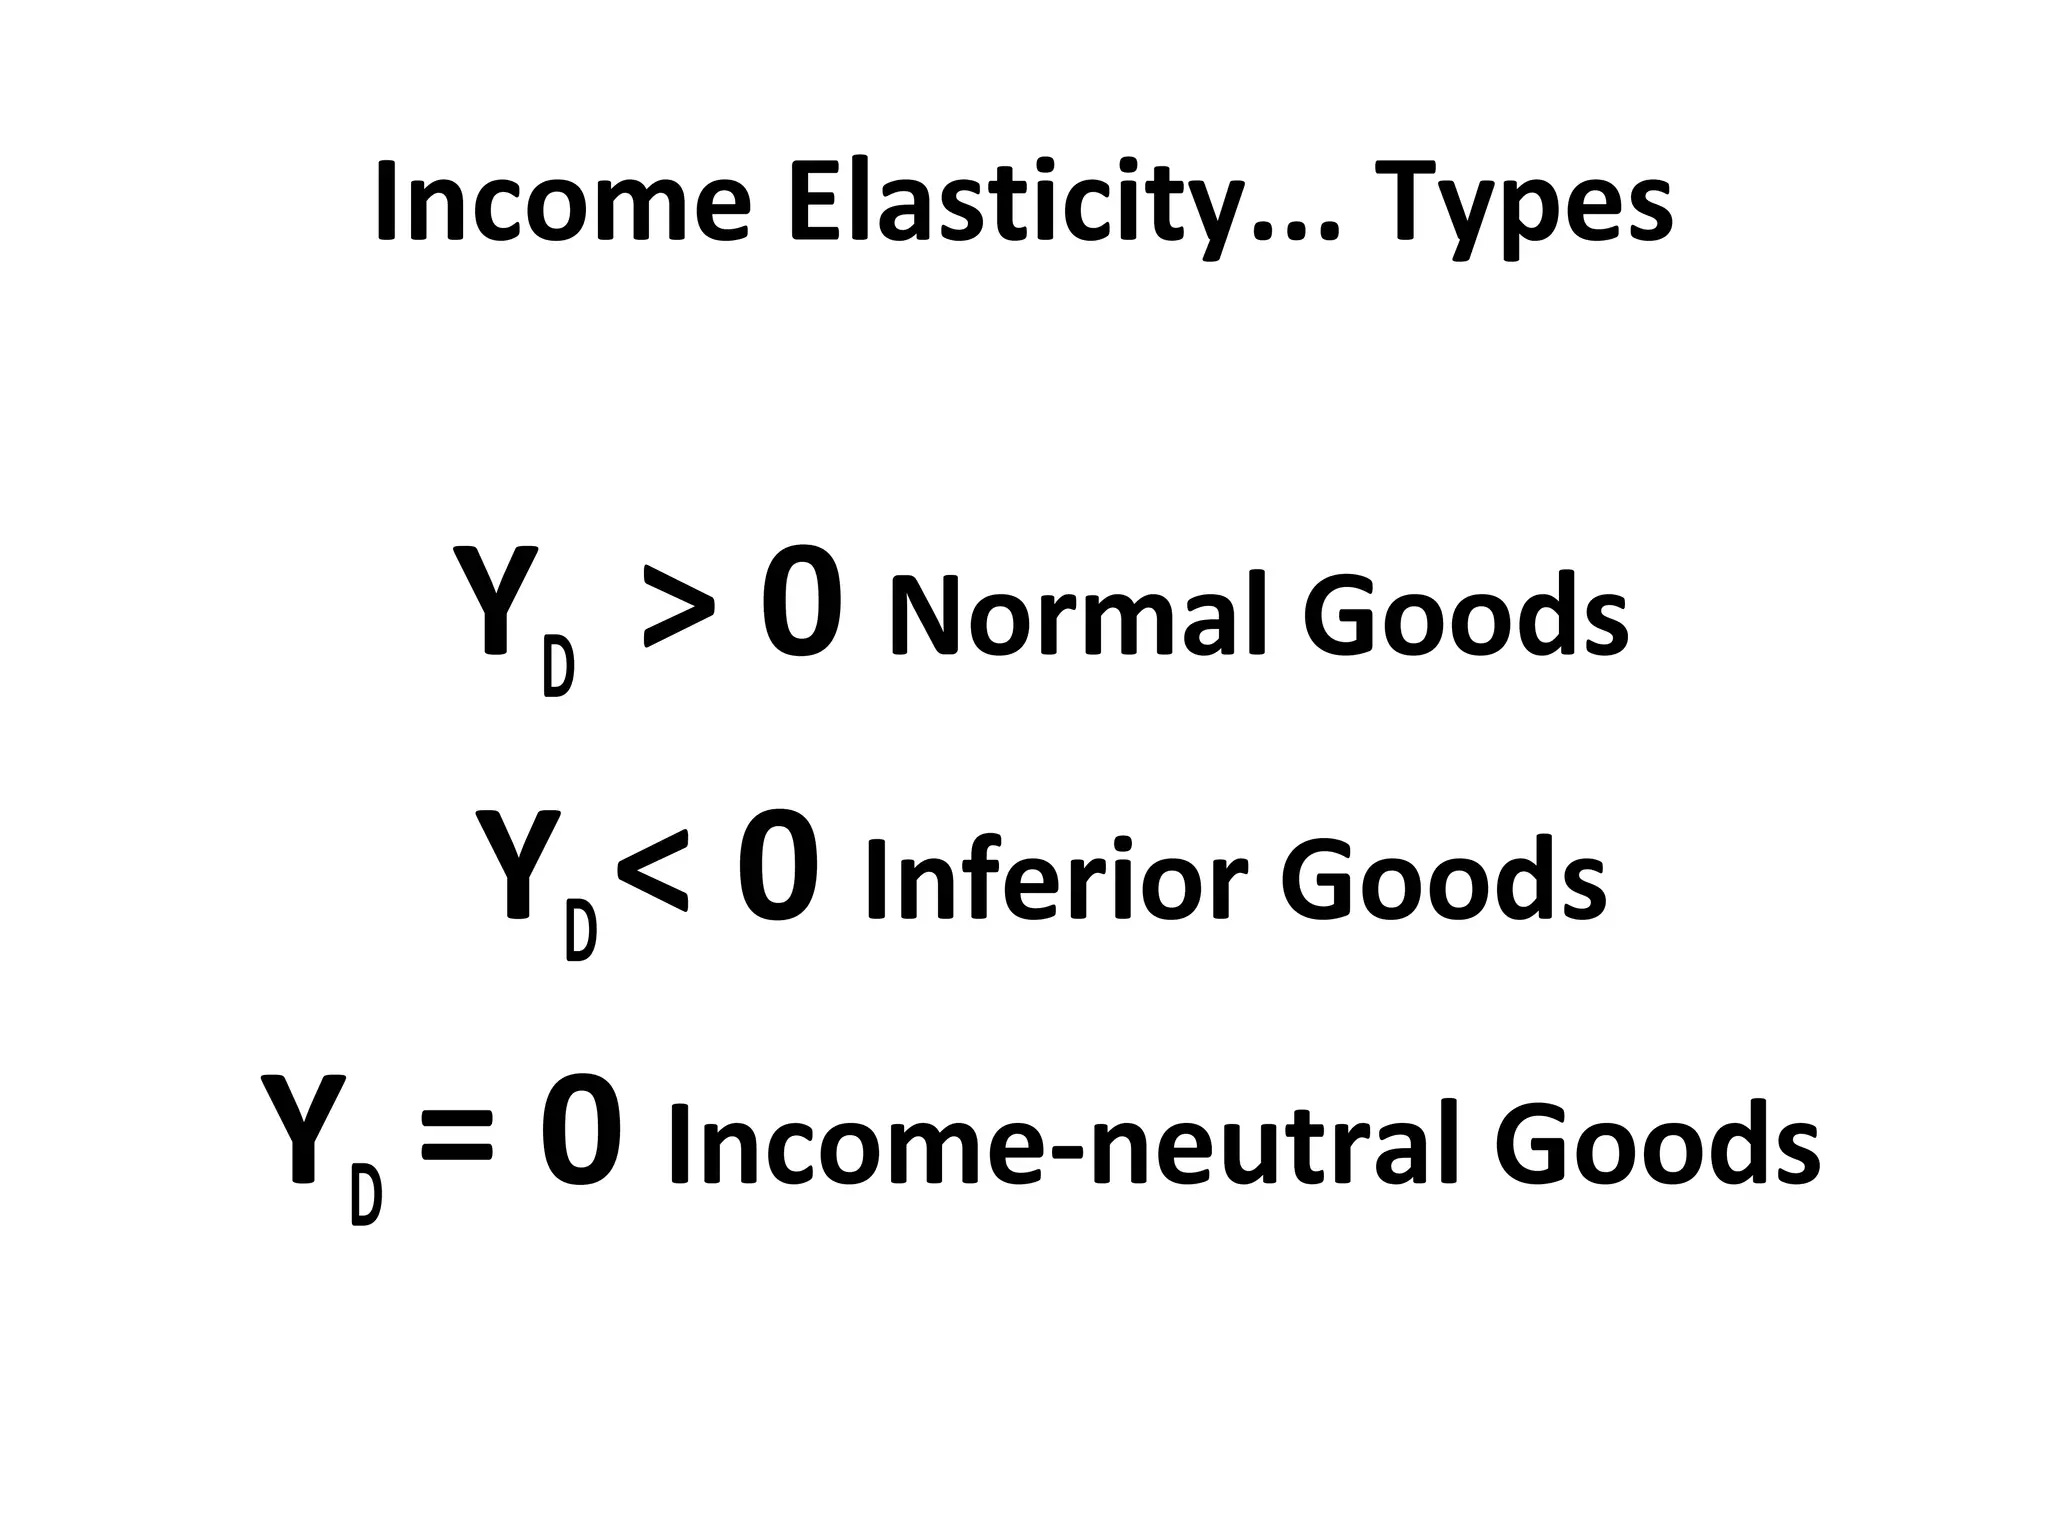
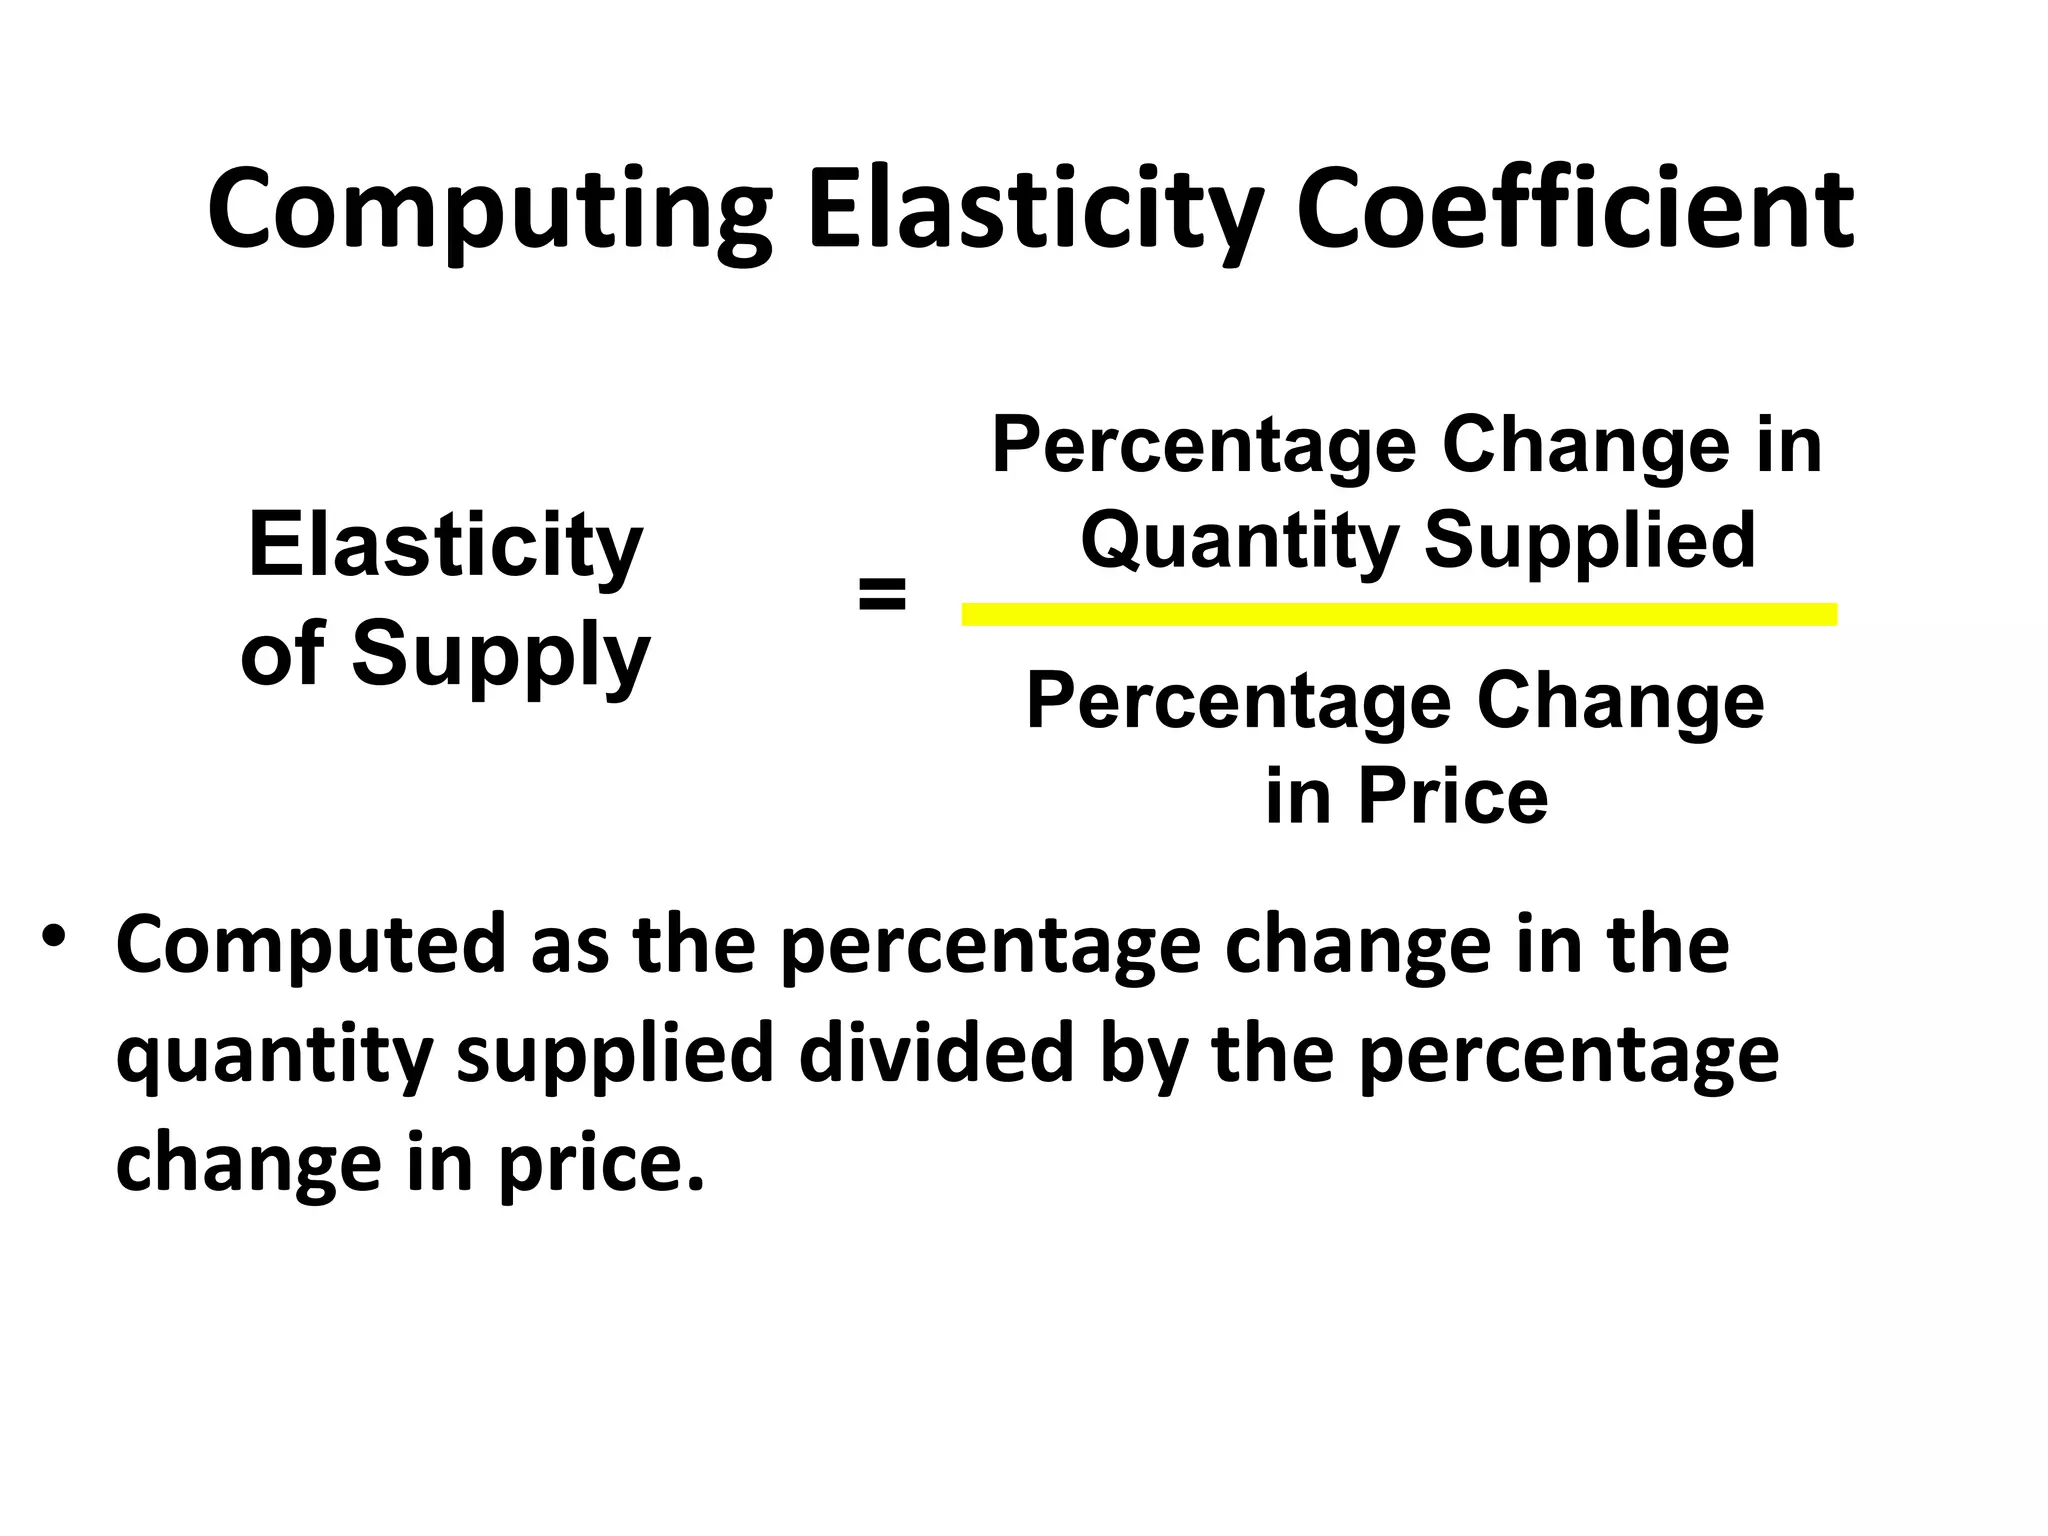
Demand, Supply
  & Elasticity

Mahmood-ur-Rahman
  Lecturer, BIBM
Outline
• Market
•  Market Demand
•  Market Supply
• Market Equilibrium
• Price Adjustment Process
• Shifts in Market Demand (increase,
  decrease)
• Shifts in Market Supply (increase, decrease)
• Interaction of Market Forces
Markets
• In a market economy, the price of a good is
  determined through the interaction between
  demand and supply side forces
• Market is some institutional framework in
  which price of a product as well as the quantity
  which is going to be transacted are determined
  through the interaction between demand and
  supply , coming up from the buyers and the
  sellers of the product
Markets
• Constituents of a market-
product
consumers/buyers-creating the demand side
  force in the market
suppliers/sellers/manufacturers-generating
  the supply side force in the market
Demand
• The desire to purchase a product (either a
  commodity or service) at a given market
  price to satisfy a need/want, backed up by
  purchasing capacity as well as the willingness
  to spend for that specific purpose
Demand
• Constituents of demand-
desire
financial capability
willingness to spend for that purpose
Law of Demand
• an inverse relationship exists between the price of
  a good and the quantity demanded in a given time
  period, ceteris paribus
• the higher the price the lower the quantity
  demanded & vice versa
• Reasons:
   – substitution effect
   – income effect
Demand Schedule-a tabular presentation of
              Law of Demand
Demand Curve- a graphical presentation of Law of
                                        Demand
Determinants of Demand
• price of the product
• tastes and preferences
• prices of related goods and services (complements
  & substitutes)
• income
• wealth
• number of consumers/population
• expectations of future prices and income
• currency depreciation/appreciation
• special influences
Change in Quantity Demanded vs. Change
           in Demand (Shift)

Change in quantity demanded   Change in demand
Shift Factors
Prices of Related Goods

• substitute goods – an increase in the price of
  one results in an increase in the demand for
  the other.
• complementary goods – an increase in the
  price of one results in a decrease in the
  demand for the other.
Change in the price of a substitute good

    • Price of coffee rises:
Change in the price of a complementary
                 good
   •   Price of DVDs rises:
Income and Demand: normal goods


• A good is a normal good if an increase in income
  results in an increase in the demand for the good
Income and Demand: inferior goods
• A good is an inferior good if an increase in
  income results in a reduction in the demand
  for the good
Market Demand Curve
• Market demand is the horizontal summation
  of individual consumer demand curves
Supply
• The desire to supply/sell a product
  (either a commodity or service) at a
  given market price
• The is something different than Stock
• Constituents of supply-
Desire to sell
stock at disposal
willingness to sell at ongoing market
  price
Law of Supply
• A positive relationship exists between the
  price of a good and the quantity supplied in a
  given time period, ceteris paribus.
         Reasons for Law of Supply
• The law of supply is the result of the law of
  increasing cost.
• As the quantity of a good produced rises, the
  marginal opportunity cost rises.
Reasons for Law of Supply
• Sellers will only produce and sell an
  additional unit of a good if the price rises
  above the marginal opportunity cost of
  producing the additional unit.
• To produce more, the producers require
  hiring more factors of production at higher
  prices (usually), which raises cost of
  production if the factor supply is fixed
• So, the suppliers will only supply at higher
  prices (usually)
The Law of Supply
• The law of supply holds that other things
  equal, as the price of a good rises, its
  quantity supplied will rise, and vice
  versa.
• Reasons
  –they seek higher profits
  –they must cover higher marginal costs
    of production
Supply Schedule
Supply Curve


The supply curve has a positive slope, consistent
with the law of supply.
Determinants of Supply
• price of the product
•  price of resources
• technology and productivity
• expectations of producers
• number of producers/suppliers
• prices of related goods and services
  (complements, substitutes)
• goverment policy (tax, subsidy)
• special influences
Change/Shift in Supply vs. Change in
         Quantity Supplied

Change in supply   Change in quantity supplied
Price of Resources
• As the price of a resource rises, profitability
  declines, leading to a reduction in the quantity
  supplied at any price.
Technological Improvements
• Technological improvements (and any changes that
  raise the productivity of labor) lower production
  costs and increase profitability.
Expectations and Supply
• An increase in the expected future price of a
  good or service results in a reduction in
  current supply.
           Prices of Other Goods
• Firms produce and sell more than one
  commodity.
• Firms respond to the relative profitability of
  the different items that they sell
Prices of Other Goods
• The supply decision for a particular
  good is affected not only by the good’s
  own price but also by the prices of
  other goods and services the firm may
  produce
International Effects
• firms import raw materials (and often the
  final product) from foreign countries, the
  cost of these imports varies with the
  exchange rate.
• appreciation/depreciation of currency
  affects the supply
Market Supply Curve
• Market supply is the horizontal summation of
  individual producer supply curves
Equilibrium
• In economics, an equilibrium is a
  situation in which:
   –there is no inherent tendency to
    change,
   –quantity demanded equals quantity
    supplied, and
   –the market just clears
Equilibrium, Surplus & Deficits


Equilibrium occurs at a price of $3 and a quantity
of 30 units
Shortages and Surpluses
• a shortage occurs when quantity
  demanded exceeds quantity supplied
  –a shortage implies the market price is
    too low
• a surplus occurs when quantity supplied
  exceeds quantity demanded
  –a surplus implies the market price is
    too high
Price Ceilings & Floors
• a price ceiling is a legal maximum that can be
  charged for a good
   – results in a shortage of a product
   – common examples include sugarcane
     price, apartment rentals in public sector
• a price floor is a legal minimum that can be
  charged for a good
   – results in a surplus of a product
   – common examples include soybeans, milk,
     minimum wage
Price Ceiling


a price ceiling is set at tk. 2 resulting in a shortage
of 20 units
Price Floor


a price floor is set at tk. 4 resulting in a surplus of
20 units
Shift in the Demand Curve
• A change in any variable other than price that
  influences quantity demanded produces a shift in
  the demand curve or a change in demand
• Factors that shift the demand curve include:
   – Change in consumer incomes
   – Population change
   – Consumer preferences
   – Prices of related goods:
      • Substitutes: goods consumed in place of one
        another
      • Complements: goods consumed jointly
Shift in the Demand Curve


This demand curve has shifted to the right.
Quantity demanded is now higher at any given
price.
Equilibrium After a Demand Shift


The shift in the demand curve moves the
market equilibrium from point A to point B,
resulting in a higher price and higher quantity.
Shift in the Supply Curve
• A change in any variable other than price
  that influences quantity supplied produces a
  shift in the supply curve or a change in
  supply.
• Factors that shift the supply curve include:
  – Change in input costs
  – Increase in technology
  – Change in size of the industry
  © OnlineTexts.com   p. 42
Shift in the Supply Curve


For an given rental price, quantity supplied
is now lower than before.
Equilibrium After a Supply Shift


The shift in the supply curve moves the market
equilibrium from point A to point B, resulting in
a higher price and lower quantity.
Elasticity

• The percentage (%) change in dependent
 variable (demand, supply) due to one percent
 (1%) change in independent variable (price,
 income).
Price Elasticity of Demand
    Demand
P                    The percentage change in
                        the quantity demanded
        A                        given. . .
                      . . . a one percent change
             B         in the price.


                 Q
Ranges of Elasticity

• Perfectly Inelastic Consumers are “completely
  unresponsive” to price changes.

• Perfectly Elastic Consumers are “extremely
  responsive” to price changes.

• Unit Elastic Response is “equal to” change in price.
Elasticity of Demand

               Perfectly Inelastic

P2
                Even if price
                increases a lot
P1              quantity demanded
                stays the same.
Elasticity of Demand

               A small increase
               in price will cause
               demand to drop off
P1             completely.


     Perfectly Elastic
Computing Elasticity Coefficient
                      Percentage Change in
 Price Elasticity      Quantity Demanded
                  =
   of Demand          Percentage Change
                           in Price
• Computed as the percentage change in
  the quantity demanded divided by the
  percentage change in price.
Computing Elasticity Coefficient
        Demand for
         Ice Cream                E   D
                                          =

2.20
                               (8 - 10) / 10
2.00                      ($2.20 - $2.00) / $2.00


            8        10
Elasticity and Total Revenue


     E > 1 then
       D


  P Q       and   TR
Elasticity and Total Revenue


     E < 1 then
       D


  P Q        and   TR
Income Elasticity of Demand

•     The percentage change in the quantity
    demanded given a one percent change in
                   income.
Computing Income Elasticity

                      Percentage Change in
Income Elasticity           Demand
                  =
   of Demand           Percentage Change
                            in Income

• Computed as the percentage change in demand
  divided by the percentage change in Income.
Income Elasticity... Types


   YD > 0 Normal Goods
   YD < 0 Inferior Goods
YD = 0 Income-neutral Goods
Cross-Price Elasticity of Demand
• Cross-price elasticity of demand measures
  percentage change in quantity demanded of
  one good caused by a 1% change in price of
  another good
• While all other influences on demand remain
  unchanged
• While the sign of the cross-price elasticity
  helps us distinguish substitutes (positive) and
  complements (negative) among related goods
                                             57
Cross-Price Elasticity of Demand
 Its size tells us how closely the two goods are
  related
 A large absolute value for EXZ suggests that the
  two goods are close substitutes or
  complements
 While a small value suggests a weaker
  relationship


                                               58
Price Elasticity of Supply
                             Price
• The percentage change
    in quantity supplied                 B
  resulting from a one (1)
  percent change in price.           A


                                         Quantity
Determinants of
            Elasticity of Supply
• Flexibility or ability of sellers to change the
  amount of the good they produce.
   – land vs manufactured goods
   – more elastic in the long run
Computing Elasticity Coefficient
                         Percentage Change in
     Elasticity            Quantity Supplied
                     =
     of Supply           Percentage Change
                              in Price
• Computed as the percentage change in the
  quantity supplied divided by the percentage
  change in price.

00

  • 1.
    Demand, Supply & Elasticity Mahmood-ur-Rahman Lecturer, BIBM
  • 2.
    Outline • Market • Market Demand • Market Supply • Market Equilibrium • Price Adjustment Process • Shifts in Market Demand (increase, decrease) • Shifts in Market Supply (increase, decrease) • Interaction of Market Forces
  • 3.
    Markets • In amarket economy, the price of a good is determined through the interaction between demand and supply side forces • Market is some institutional framework in which price of a product as well as the quantity which is going to be transacted are determined through the interaction between demand and supply , coming up from the buyers and the sellers of the product
  • 4.
    Markets • Constituents ofa market- product consumers/buyers-creating the demand side force in the market suppliers/sellers/manufacturers-generating the supply side force in the market
  • 5.
    Demand • The desireto purchase a product (either a commodity or service) at a given market price to satisfy a need/want, backed up by purchasing capacity as well as the willingness to spend for that specific purpose
  • 6.
    Demand • Constituents ofdemand- desire financial capability willingness to spend for that purpose
  • 7.
    Law of Demand •an inverse relationship exists between the price of a good and the quantity demanded in a given time period, ceteris paribus • the higher the price the lower the quantity demanded & vice versa • Reasons: – substitution effect – income effect
  • 8.
    Demand Schedule-a tabularpresentation of Law of Demand
  • 9.
    Demand Curve- agraphical presentation of Law of Demand
  • 10.
    Determinants of Demand •price of the product • tastes and preferences • prices of related goods and services (complements & substitutes) • income • wealth • number of consumers/population • expectations of future prices and income • currency depreciation/appreciation • special influences
  • 11.
    Change in QuantityDemanded vs. Change in Demand (Shift) Change in quantity demanded Change in demand
  • 12.
  • 13.
    Prices of RelatedGoods • substitute goods – an increase in the price of one results in an increase in the demand for the other. • complementary goods – an increase in the price of one results in a decrease in the demand for the other.
  • 14.
    Change in theprice of a substitute good • Price of coffee rises:
  • 15.
    Change in theprice of a complementary good • Price of DVDs rises:
  • 16.
    Income and Demand:normal goods • A good is a normal good if an increase in income results in an increase in the demand for the good
  • 17.
    Income and Demand:inferior goods • A good is an inferior good if an increase in income results in a reduction in the demand for the good
  • 18.
    Market Demand Curve •Market demand is the horizontal summation of individual consumer demand curves
  • 19.
    Supply • The desireto supply/sell a product (either a commodity or service) at a given market price • The is something different than Stock • Constituents of supply- Desire to sell stock at disposal willingness to sell at ongoing market price
  • 20.
    Law of Supply •A positive relationship exists between the price of a good and the quantity supplied in a given time period, ceteris paribus. Reasons for Law of Supply • The law of supply is the result of the law of increasing cost. • As the quantity of a good produced rises, the marginal opportunity cost rises.
  • 21.
    Reasons for Lawof Supply • Sellers will only produce and sell an additional unit of a good if the price rises above the marginal opportunity cost of producing the additional unit. • To produce more, the producers require hiring more factors of production at higher prices (usually), which raises cost of production if the factor supply is fixed • So, the suppliers will only supply at higher prices (usually)
  • 22.
    The Law ofSupply • The law of supply holds that other things equal, as the price of a good rises, its quantity supplied will rise, and vice versa. • Reasons –they seek higher profits –they must cover higher marginal costs of production
  • 23.
  • 24.
    Supply Curve The supplycurve has a positive slope, consistent with the law of supply.
  • 25.
    Determinants of Supply •price of the product • price of resources • technology and productivity • expectations of producers • number of producers/suppliers • prices of related goods and services (complements, substitutes) • goverment policy (tax, subsidy) • special influences
  • 26.
    Change/Shift in Supplyvs. Change in Quantity Supplied Change in supply Change in quantity supplied
  • 27.
    Price of Resources •As the price of a resource rises, profitability declines, leading to a reduction in the quantity supplied at any price.
  • 28.
    Technological Improvements • Technologicalimprovements (and any changes that raise the productivity of labor) lower production costs and increase profitability.
  • 29.
    Expectations and Supply •An increase in the expected future price of a good or service results in a reduction in current supply. Prices of Other Goods • Firms produce and sell more than one commodity. • Firms respond to the relative profitability of the different items that they sell
  • 30.
    Prices of OtherGoods • The supply decision for a particular good is affected not only by the good’s own price but also by the prices of other goods and services the firm may produce
  • 31.
    International Effects • firmsimport raw materials (and often the final product) from foreign countries, the cost of these imports varies with the exchange rate. • appreciation/depreciation of currency affects the supply
  • 32.
    Market Supply Curve •Market supply is the horizontal summation of individual producer supply curves
  • 33.
    Equilibrium • In economics,an equilibrium is a situation in which: –there is no inherent tendency to change, –quantity demanded equals quantity supplied, and –the market just clears
  • 34.
    Equilibrium, Surplus &Deficits Equilibrium occurs at a price of $3 and a quantity of 30 units
  • 35.
    Shortages and Surpluses •a shortage occurs when quantity demanded exceeds quantity supplied –a shortage implies the market price is too low • a surplus occurs when quantity supplied exceeds quantity demanded –a surplus implies the market price is too high
  • 36.
    Price Ceilings &Floors • a price ceiling is a legal maximum that can be charged for a good – results in a shortage of a product – common examples include sugarcane price, apartment rentals in public sector • a price floor is a legal minimum that can be charged for a good – results in a surplus of a product – common examples include soybeans, milk, minimum wage
  • 37.
    Price Ceiling a priceceiling is set at tk. 2 resulting in a shortage of 20 units
  • 38.
    Price Floor a pricefloor is set at tk. 4 resulting in a surplus of 20 units
  • 39.
    Shift in theDemand Curve • A change in any variable other than price that influences quantity demanded produces a shift in the demand curve or a change in demand • Factors that shift the demand curve include: – Change in consumer incomes – Population change – Consumer preferences – Prices of related goods: • Substitutes: goods consumed in place of one another • Complements: goods consumed jointly
  • 40.
    Shift in theDemand Curve This demand curve has shifted to the right. Quantity demanded is now higher at any given price.
  • 41.
    Equilibrium After aDemand Shift The shift in the demand curve moves the market equilibrium from point A to point B, resulting in a higher price and higher quantity.
  • 42.
    Shift in theSupply Curve • A change in any variable other than price that influences quantity supplied produces a shift in the supply curve or a change in supply. • Factors that shift the supply curve include: – Change in input costs – Increase in technology – Change in size of the industry © OnlineTexts.com p. 42
  • 43.
    Shift in theSupply Curve For an given rental price, quantity supplied is now lower than before.
  • 44.
    Equilibrium After aSupply Shift The shift in the supply curve moves the market equilibrium from point A to point B, resulting in a higher price and lower quantity.
  • 45.
    Elasticity • The percentage(%) change in dependent variable (demand, supply) due to one percent (1%) change in independent variable (price, income).
  • 46.
    Price Elasticity ofDemand Demand P The percentage change in the quantity demanded A given. . . . . . a one percent change B in the price. Q
  • 47.
    Ranges of Elasticity •Perfectly Inelastic Consumers are “completely unresponsive” to price changes. • Perfectly Elastic Consumers are “extremely responsive” to price changes. • Unit Elastic Response is “equal to” change in price.
  • 48.
    Elasticity of Demand Perfectly Inelastic P2 Even if price increases a lot P1 quantity demanded stays the same.
  • 49.
    Elasticity of Demand A small increase in price will cause demand to drop off P1 completely. Perfectly Elastic
  • 50.
    Computing Elasticity Coefficient Percentage Change in Price Elasticity Quantity Demanded = of Demand Percentage Change in Price • Computed as the percentage change in the quantity demanded divided by the percentage change in price.
  • 51.
    Computing Elasticity Coefficient Demand for Ice Cream E D = 2.20 (8 - 10) / 10 2.00 ($2.20 - $2.00) / $2.00 8 10
  • 52.
    Elasticity and TotalRevenue E > 1 then D P Q and TR
  • 53.
    Elasticity and TotalRevenue E < 1 then D P Q and TR
  • 54.
    Income Elasticity ofDemand • The percentage change in the quantity demanded given a one percent change in income.
  • 55.
    Computing Income Elasticity Percentage Change in Income Elasticity Demand = of Demand Percentage Change in Income • Computed as the percentage change in demand divided by the percentage change in Income.
  • 56.
    Income Elasticity... Types YD > 0 Normal Goods YD < 0 Inferior Goods YD = 0 Income-neutral Goods
  • 57.
    Cross-Price Elasticity ofDemand • Cross-price elasticity of demand measures percentage change in quantity demanded of one good caused by a 1% change in price of another good • While all other influences on demand remain unchanged • While the sign of the cross-price elasticity helps us distinguish substitutes (positive) and complements (negative) among related goods 57
  • 58.
    Cross-Price Elasticity ofDemand  Its size tells us how closely the two goods are related  A large absolute value for EXZ suggests that the two goods are close substitutes or complements  While a small value suggests a weaker relationship 58
  • 59.
    Price Elasticity ofSupply Price • The percentage change in quantity supplied B resulting from a one (1) percent change in price. A Quantity
  • 60.
    Determinants of Elasticity of Supply • Flexibility or ability of sellers to change the amount of the good they produce. – land vs manufactured goods – more elastic in the long run
  • 61.
    Computing Elasticity Coefficient Percentage Change in Elasticity Quantity Supplied = of Supply Percentage Change in Price • Computed as the percentage change in the quantity supplied divided by the percentage change in price.

Editor's Notes