3
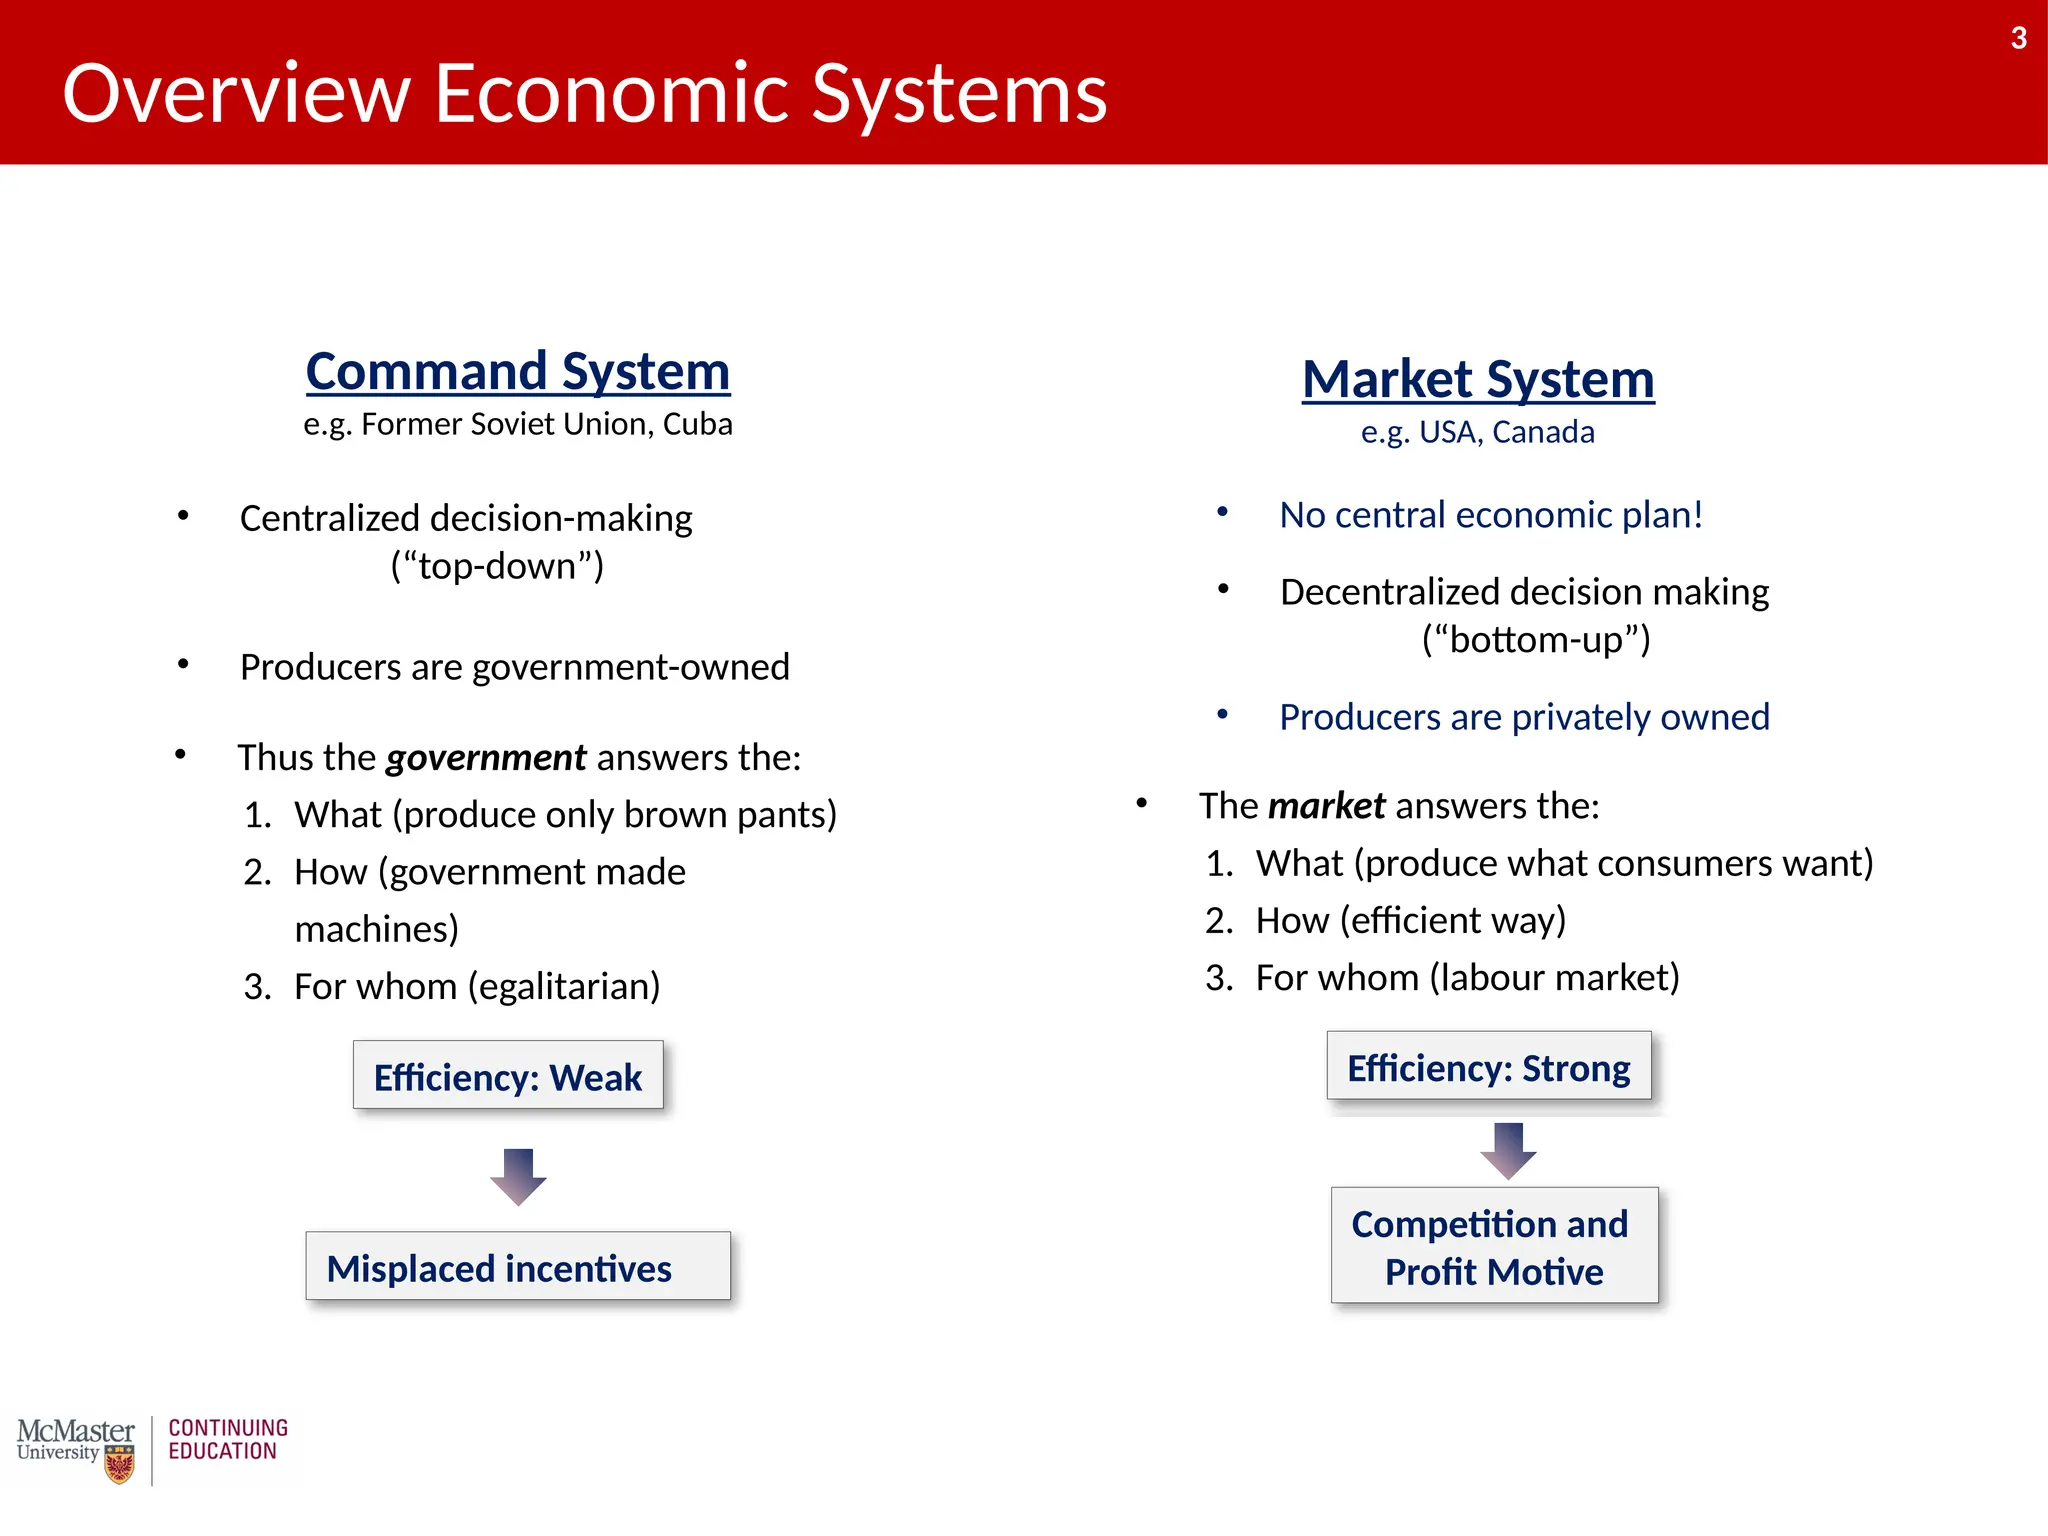
Overview Economic Systems
Competitionand
Profit Motive
Market System
e.g. USA, Canada
• Producers are privately owned
• No central economic plan!
• Decentralized decision making
(“bottom-up”)
• The market answers the:
1. What (produce what consumers want)
2. How (efficient way)
3. For whom (labour market)
Efficiency: Strong
Command System
e.g. Former Soviet Union, Cuba
• Thus the government answers the:
1. What (produce only brown pants)
2. How (government made
machines)
3. For whom (egalitarian)
• Producers are government-owned
• Centralized decision-making
(“top-down”)
Efficiency: Weak
Misplaced incentives
3
4.
4
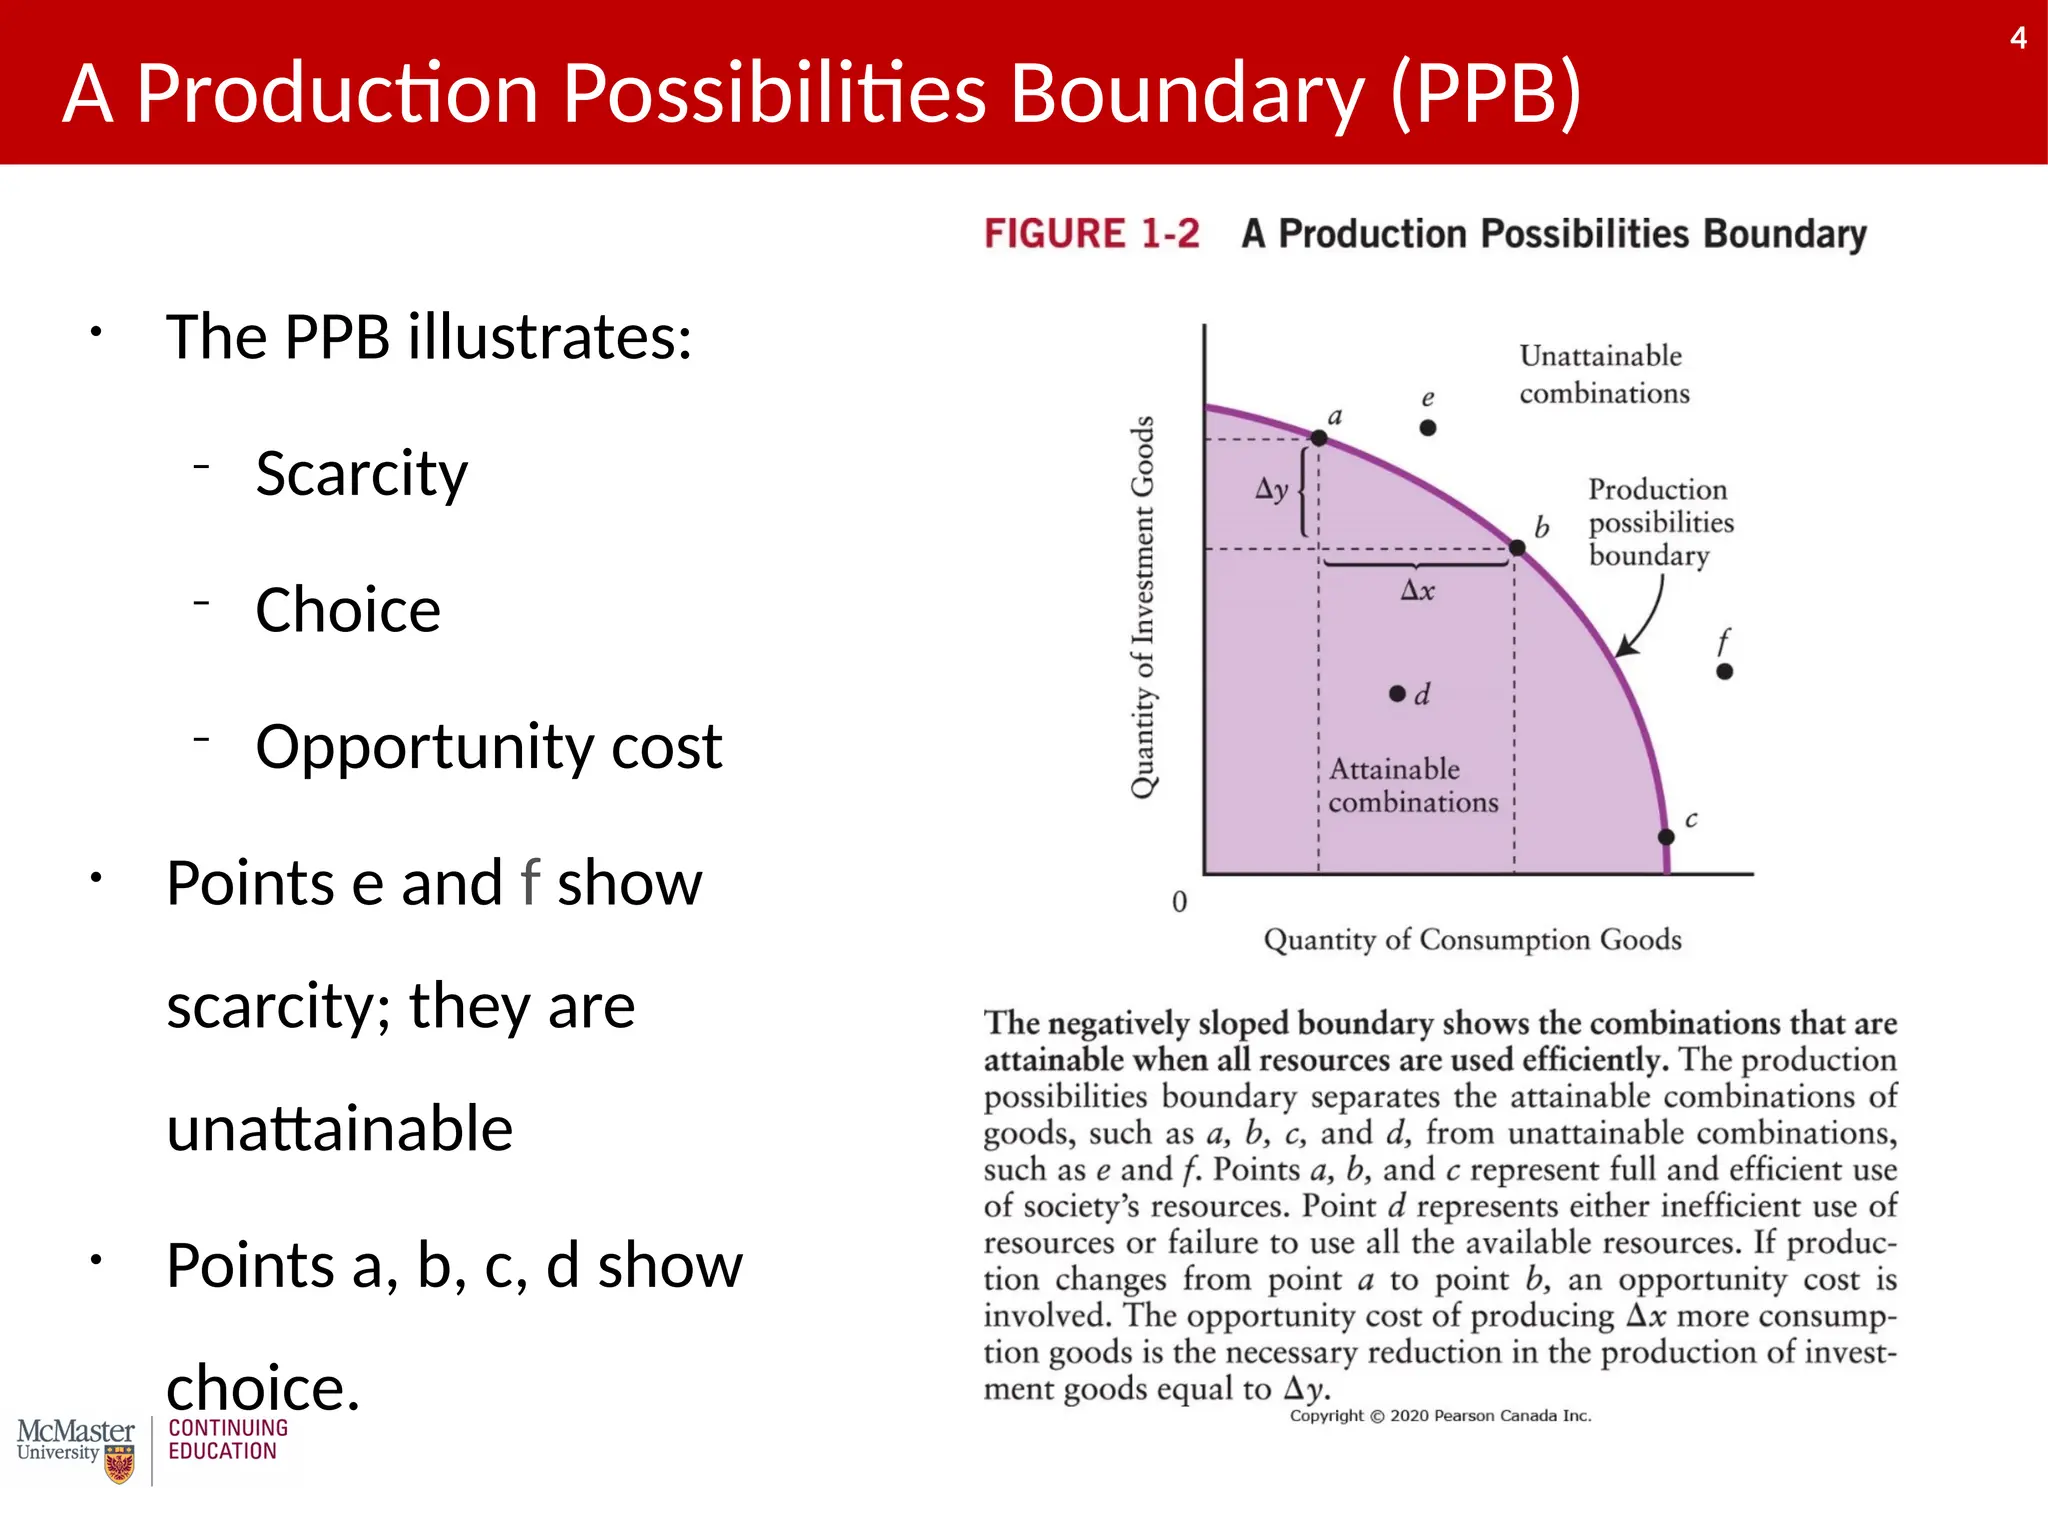
• The PPBillustrates:
– Scarcity
– Choice
– Opportunity cost
• Points e and f show
scarcity; they are
unattainable
• Points a, b, c, d show
choice.
A Production Possibilities Boundary (PPB)
4
5.
5
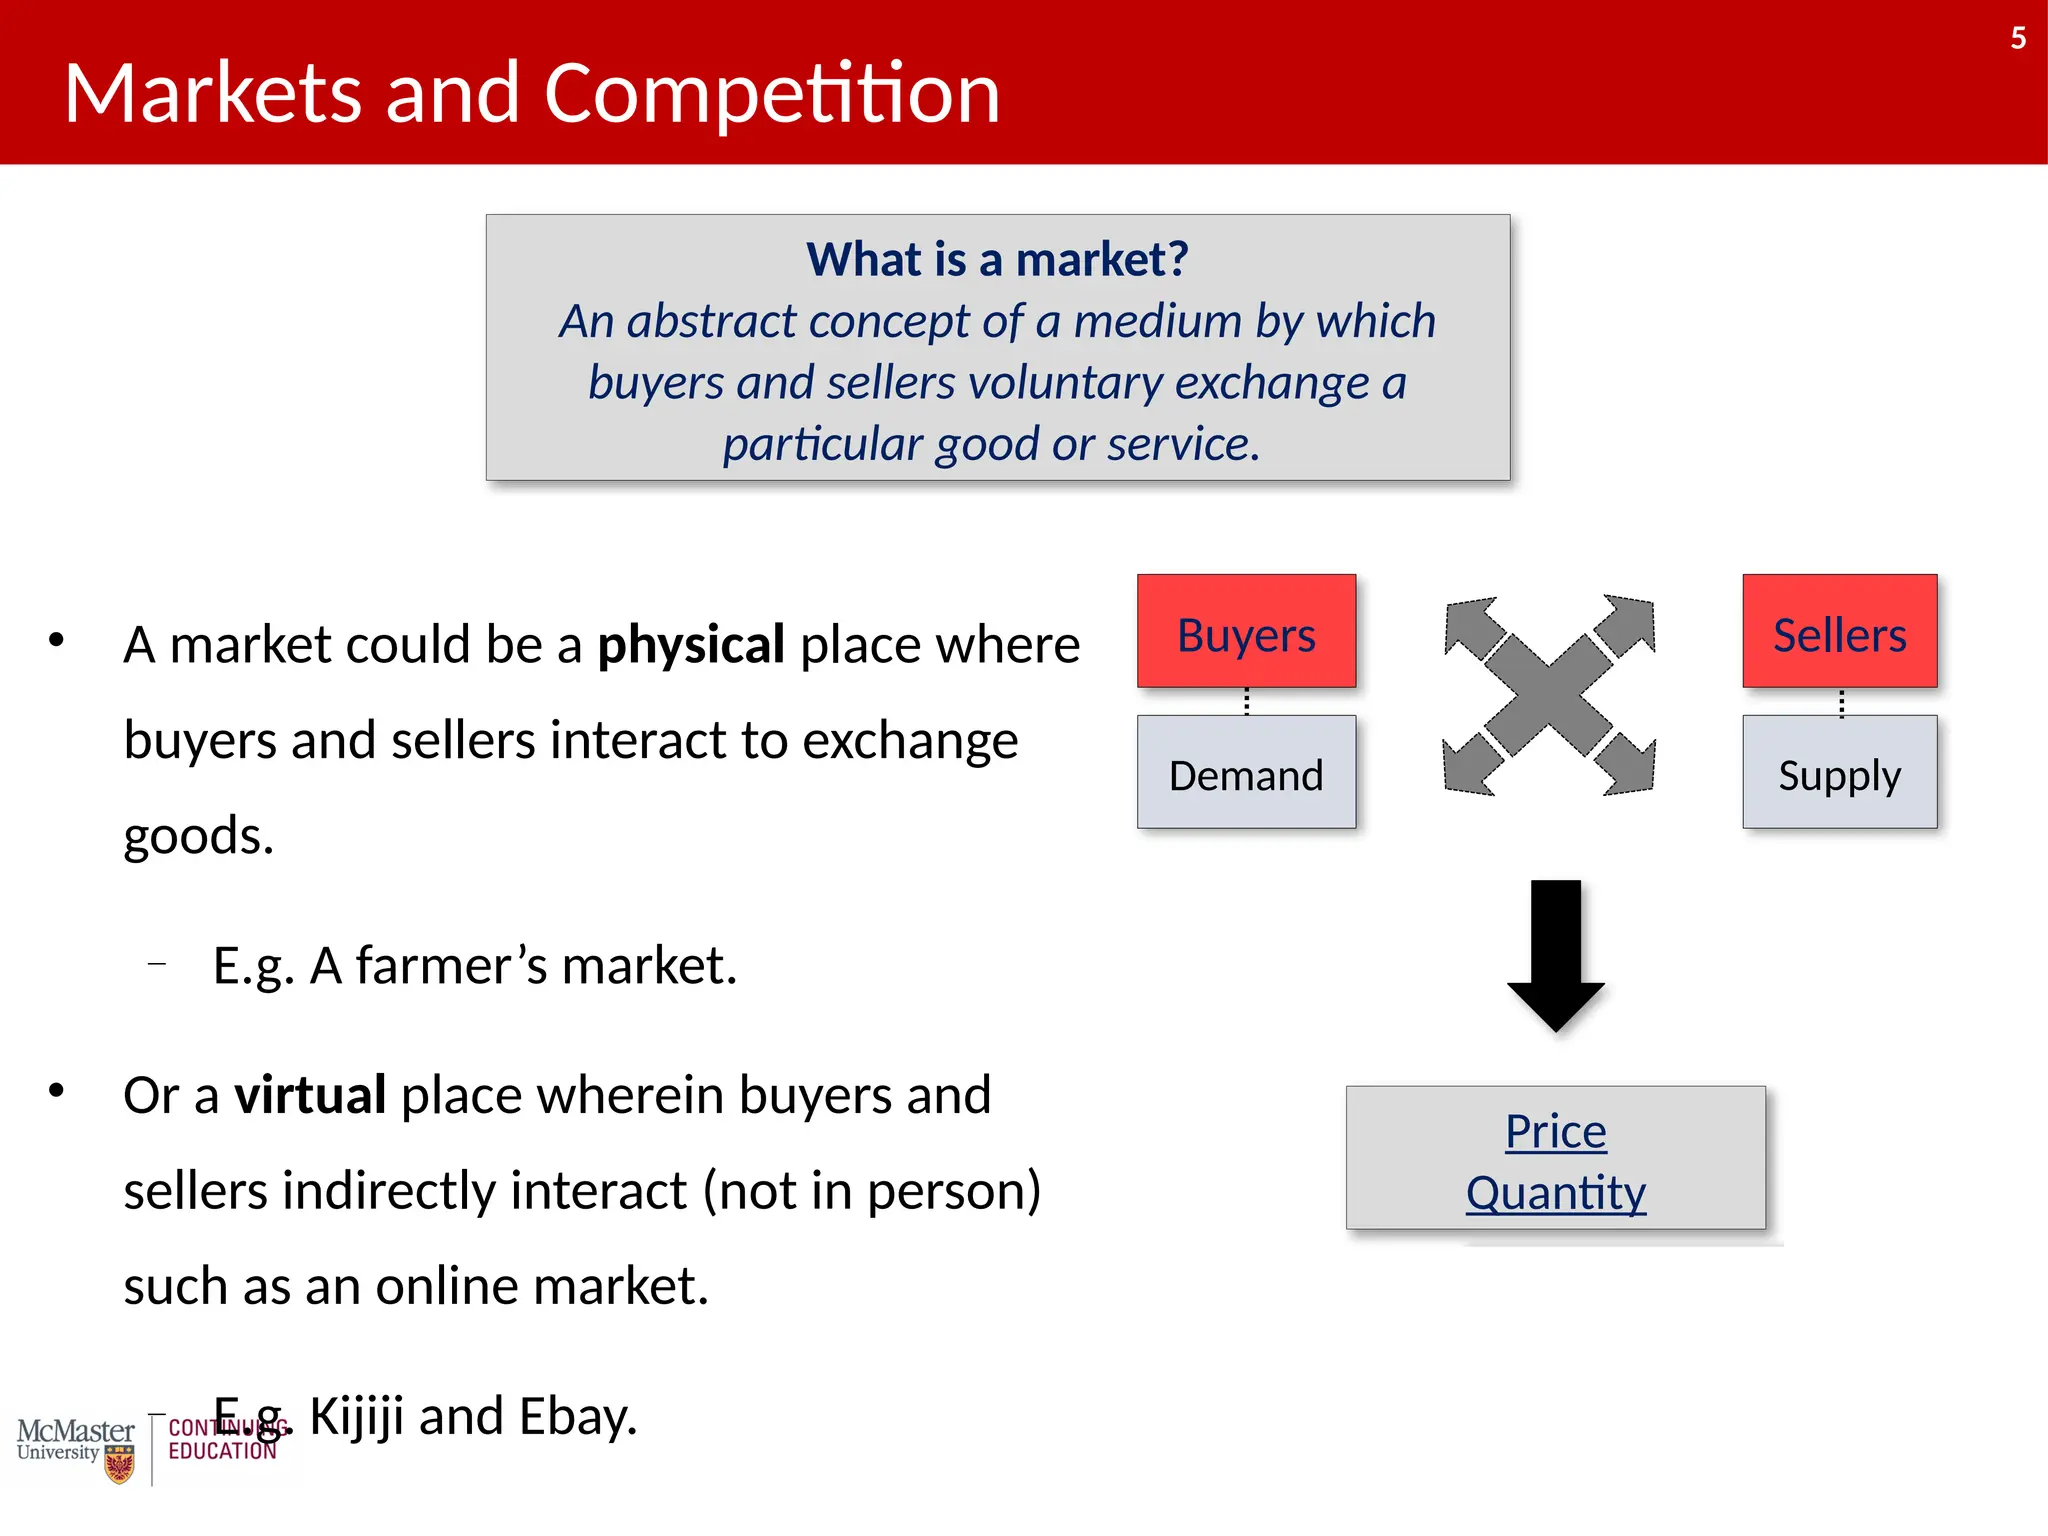
• A marketcould be a physical place where
buyers and sellers interact to exchange
goods.
– E.g. A farmer’s market.
• Or a virtual place wherein buyers and
sellers indirectly interact (not in person)
such as an online market.
– E.g. Kijiji and Ebay.
Markets and Competition
What is a market?
An abstract concept of a medium by which
buyers and sellers voluntary exchange a
particular good or service.
Buyers Sellers
Price
Quantity
Demand Supply
5
6.
6
• The demandcurve shows the
relationship between quantity
demanded and price.
• Price is the most important
determinant: “Ceteris paribus” – all else
remains the same.
Demand Schedule
Demand Curve
6
3 7
5
2
1
Price
Quantity
$19
$18
$17
4
Demand
What is Quantity Demanded?
The quantities that consumers are willing and able
to buy over a period of time at various prices
The Demand Curve
6
7.
7
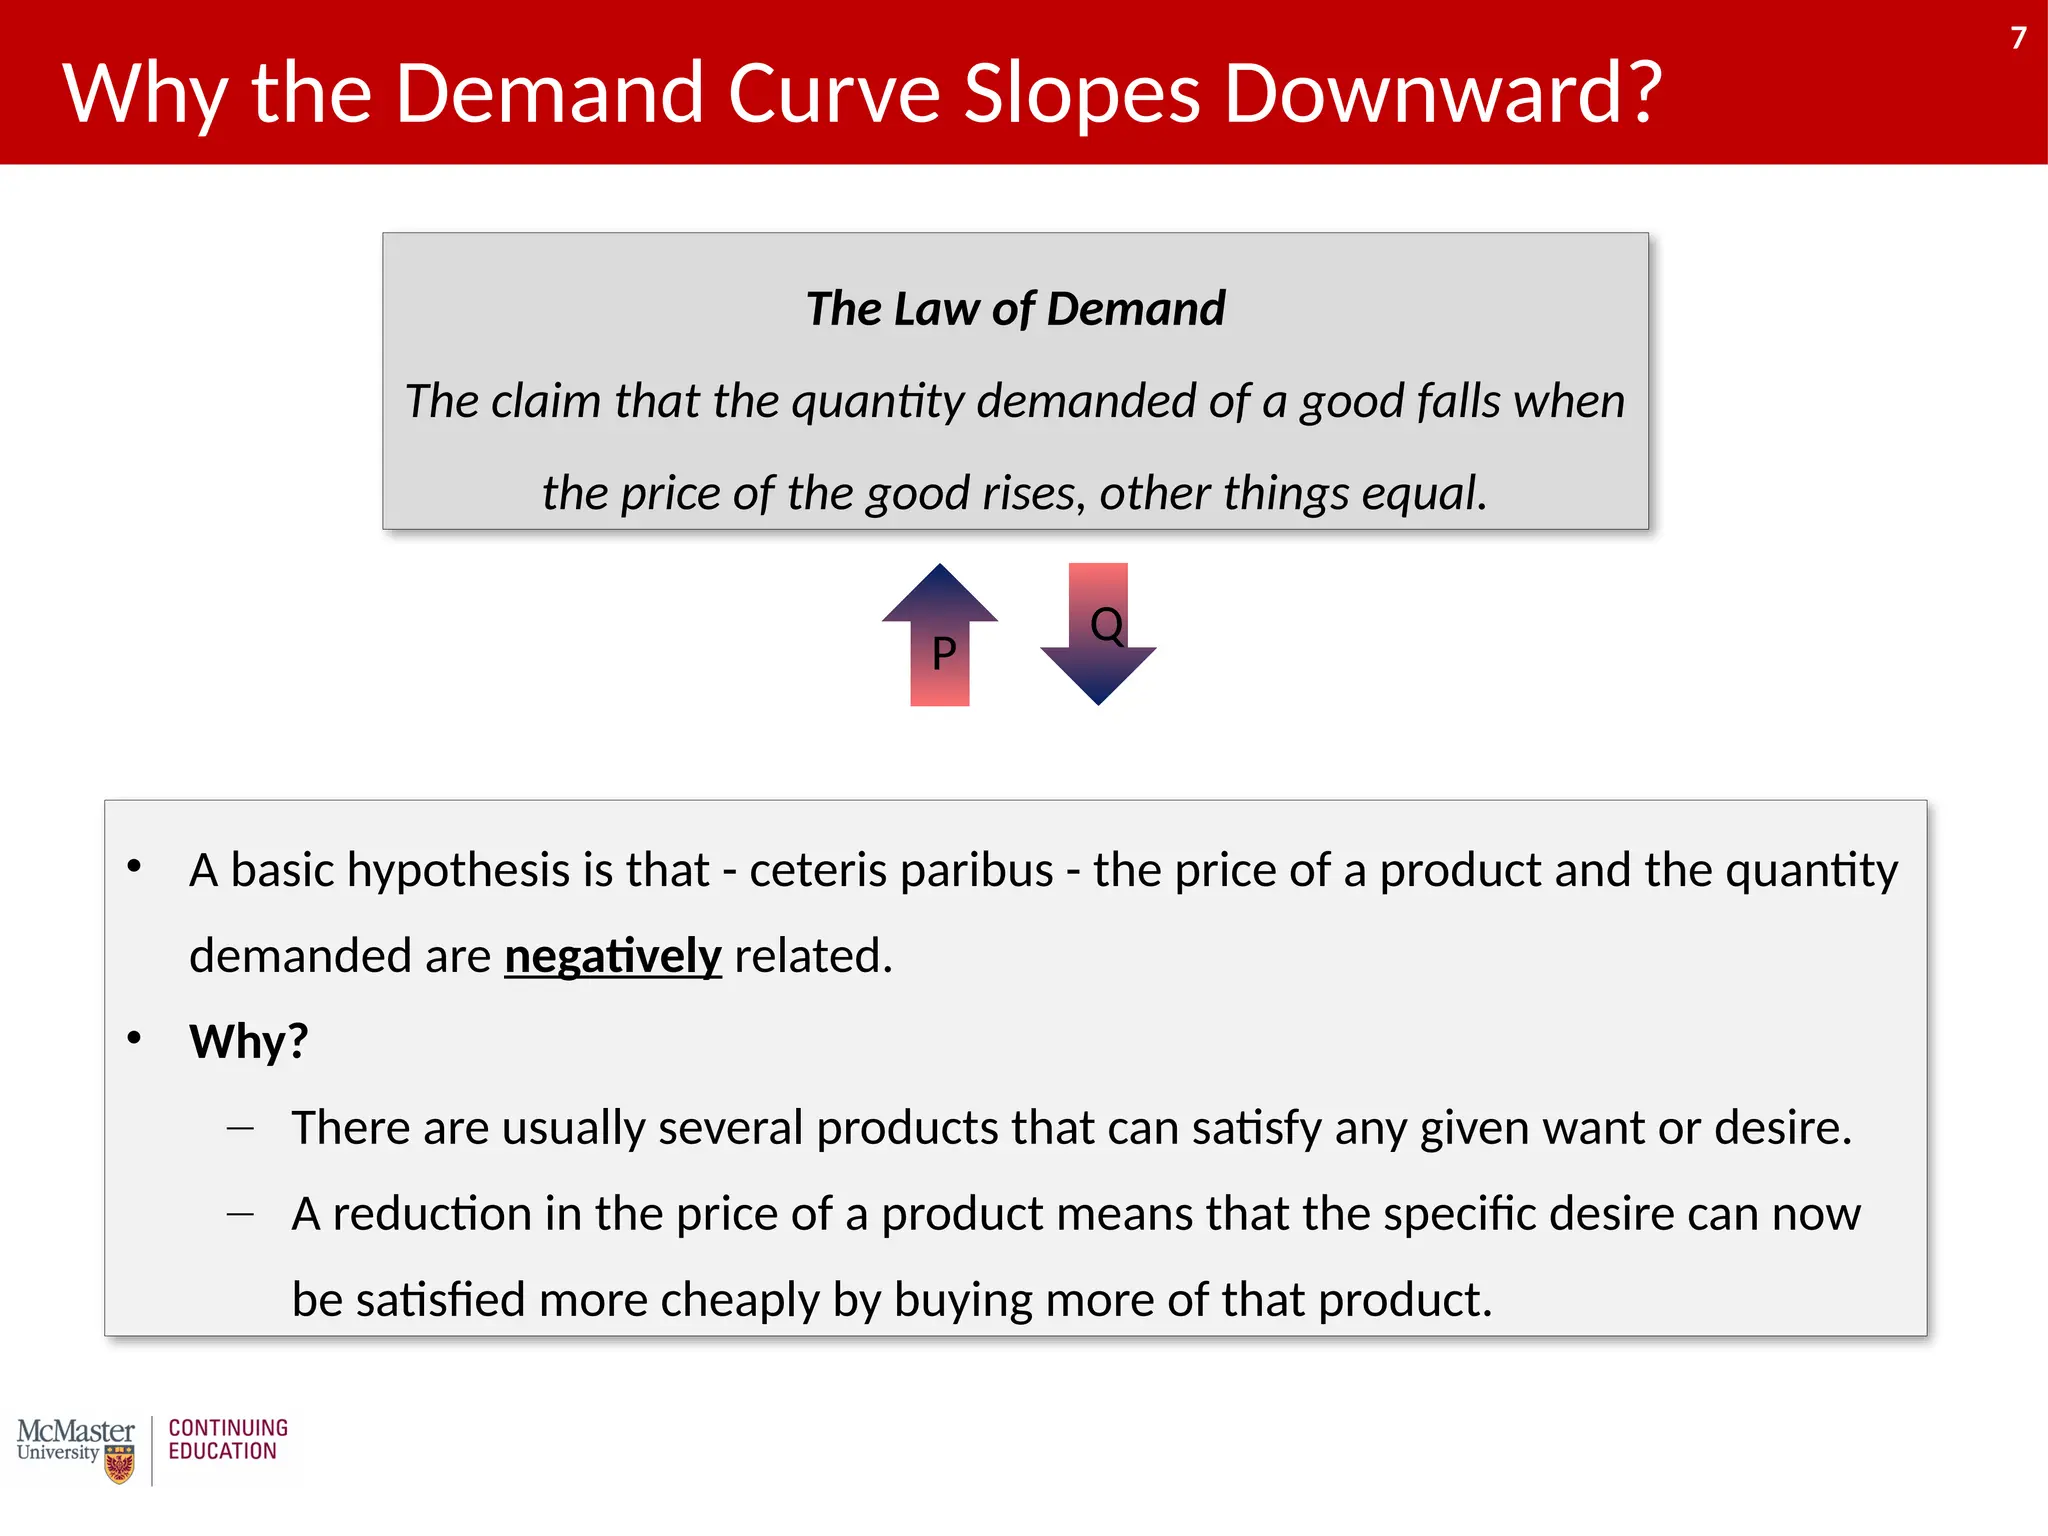
Why the DemandCurve Slopes Downward?
• A basic hypothesis is that - ceteris paribus - the price of a product and the quantity
demanded are negatively related.
• Why?
– There are usually several products that can satisfy any given want or desire.
– A reduction in the price of a product means that the specific desire can now
be satisfied more cheaply by buying more of that product.
The Law of Demand
The claim that the quantity demanded of a good falls when
the price of the good rises, other things equal.
P
Q
7
9
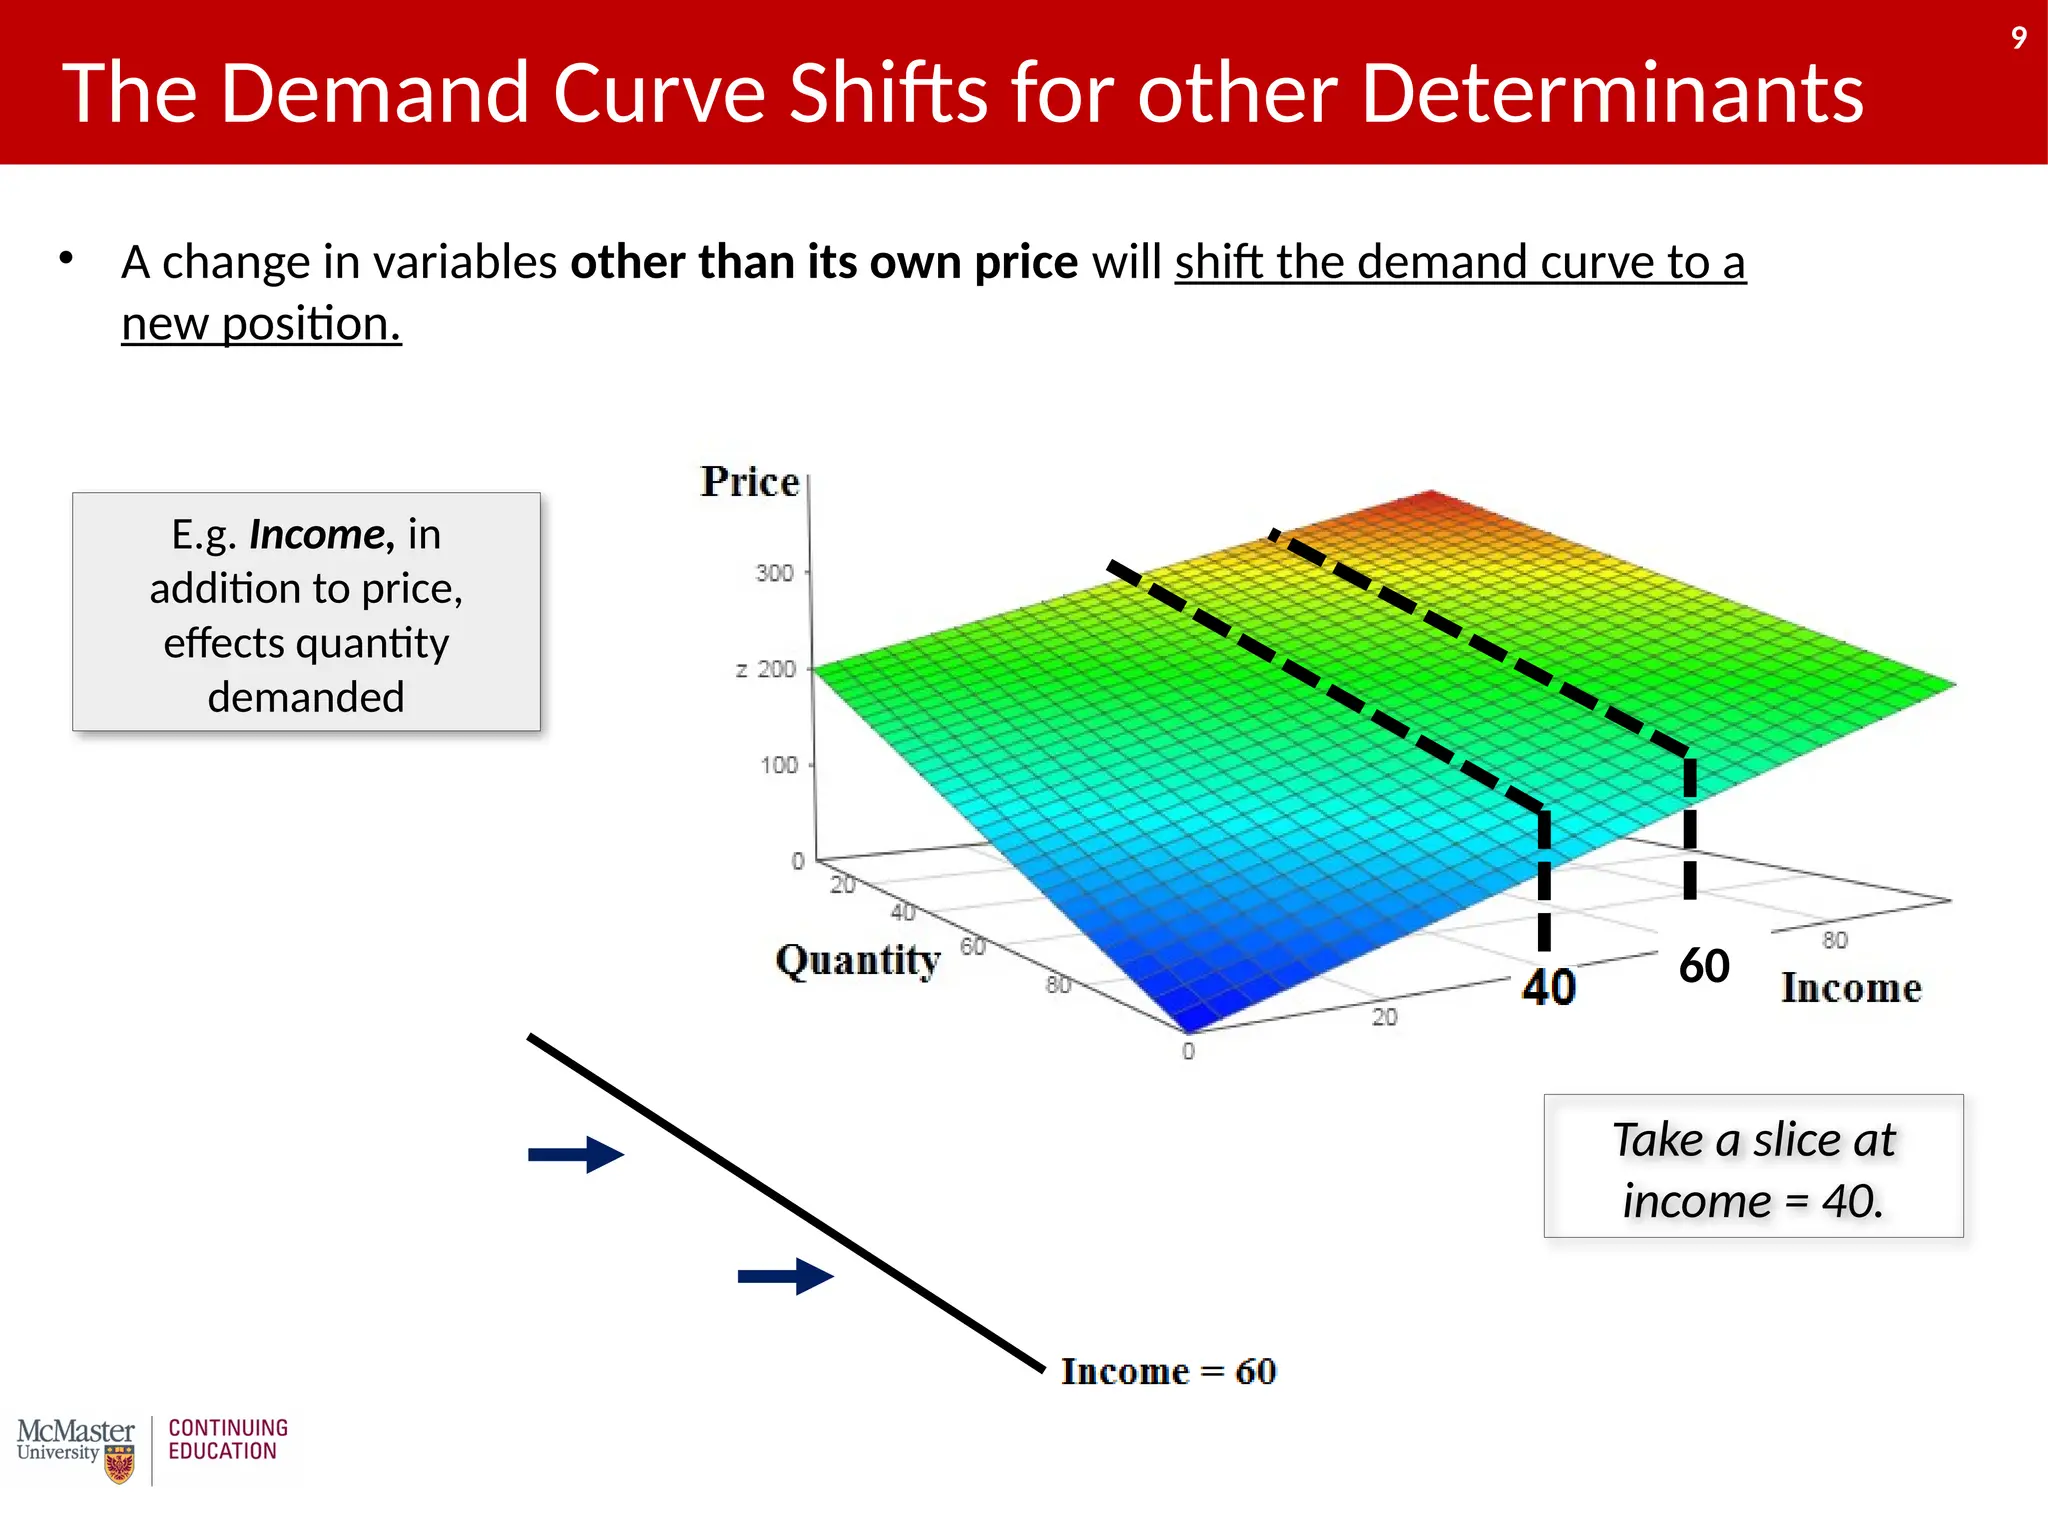
The Demand CurveShifts for other Determinants
E.g. Income, in
addition to price,
effects quantity
demanded
Take a slice at
income = 40.
60
• A change in variables other than its own price will shift the demand curve to a
new position.
9
10.
10
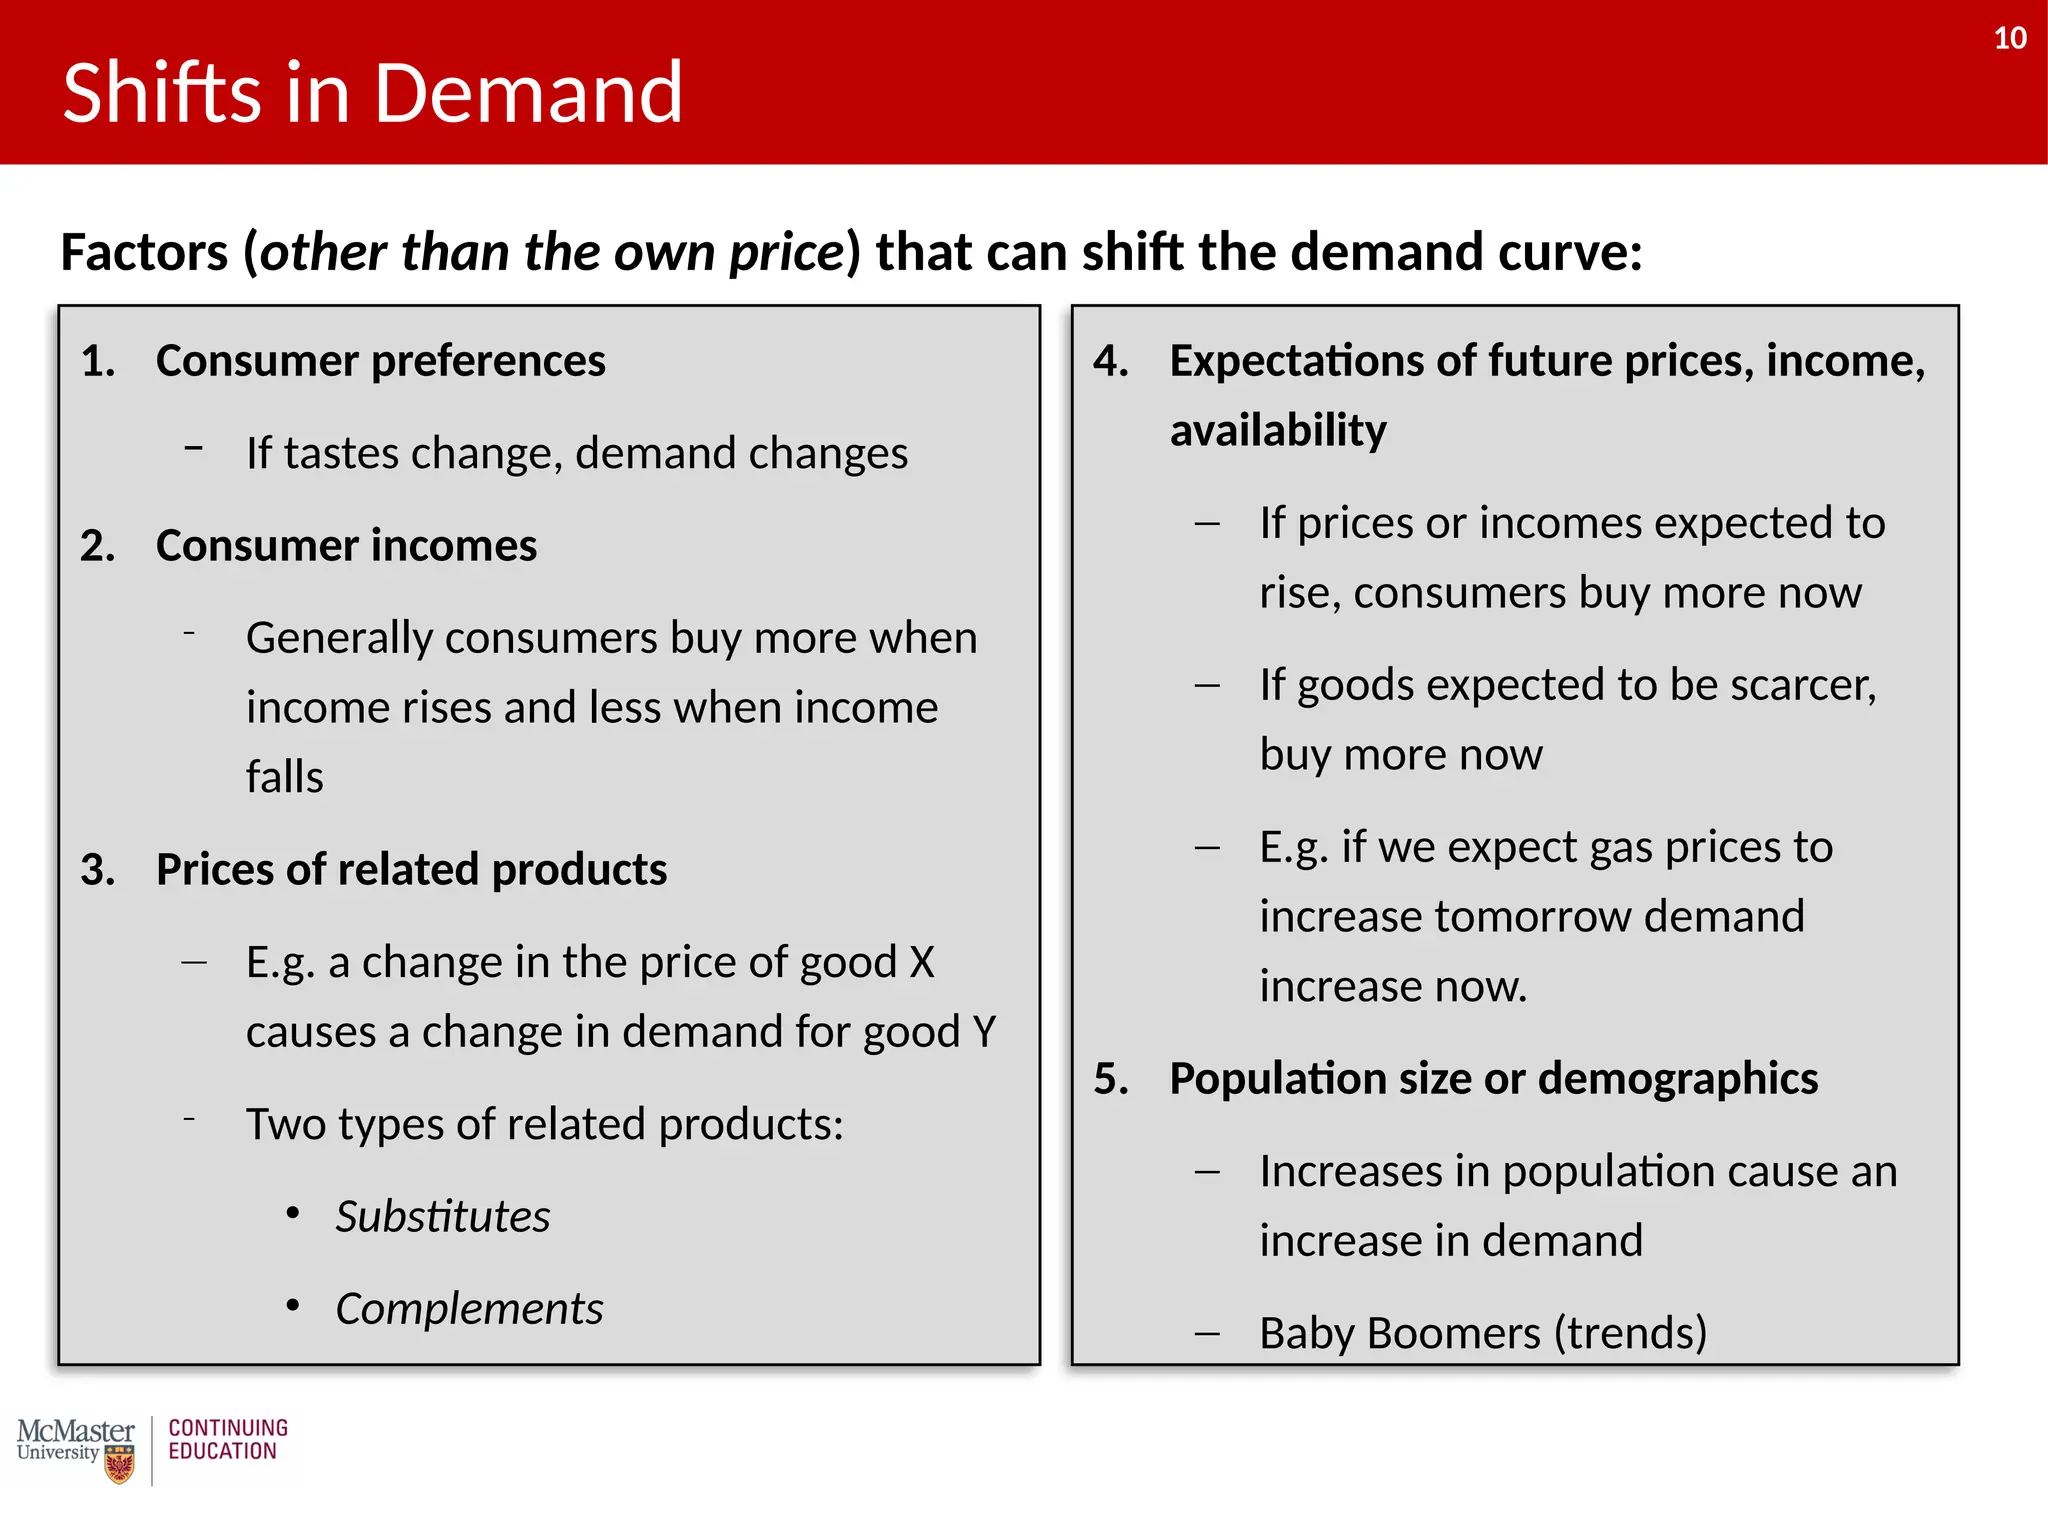
1. Consumer preferences
–If tastes change, demand changes
2. Consumer incomes
– Generally consumers buy more when
income rises and less when income
falls
3. Prices of related products
– E.g. a change in the price of good X
causes a change in demand for good Y
– Two types of related products:
• Substitutes
• Complements
Shifts in Demand
4. Expectations of future prices, income,
availability
‒ If prices or incomes expected to
rise, consumers buy more now
‒ If goods expected to be scarcer,
buy more now
‒ E.g. if we expect gas prices to
increase tomorrow demand
increase now.
5. Population size or demographics
‒ Increases in population cause an
increase in demand
‒ Baby Boomers (trends)
Factors (other than the own price) that can shift the demand curve:
10
11.
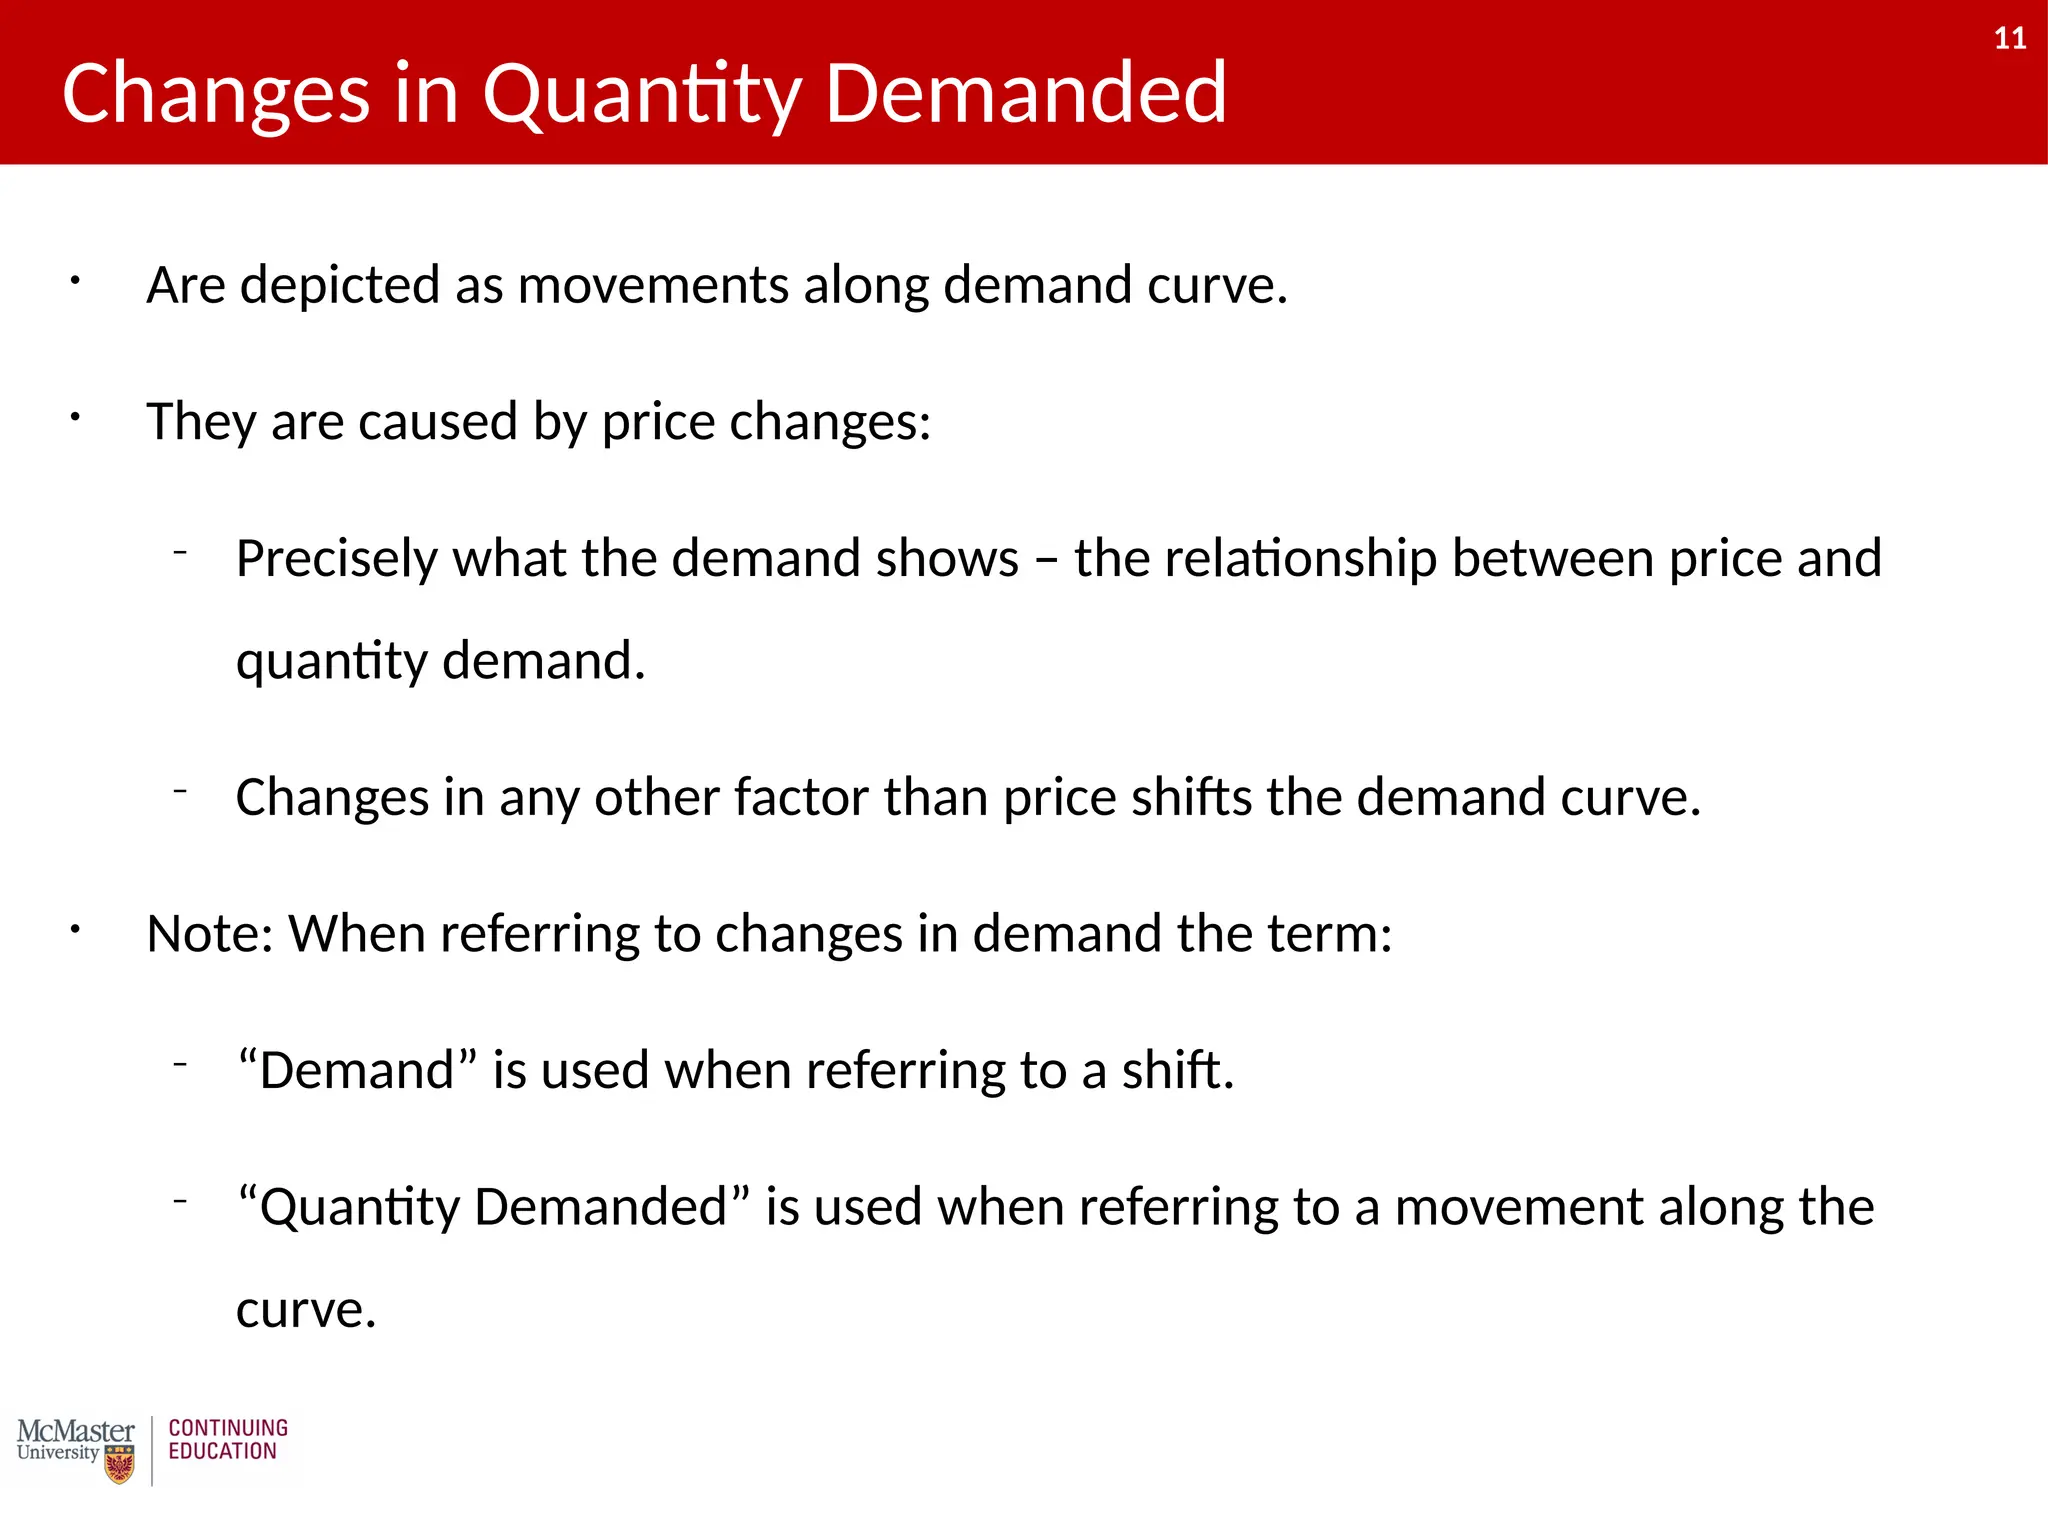
11
• Are depictedas movements along demand curve.
• They are caused by price changes:
– Precisely what the demand shows – the relationship between price and
quantity demand.
– Changes in any other factor than price shifts the demand curve.
• Note: When referring to changes in demand the term:
– “Demand” is used when referring to a shift.
– “Quantity Demanded” is used when referring to a movement along the
curve.
Changes in Quantity Demanded
11
12.
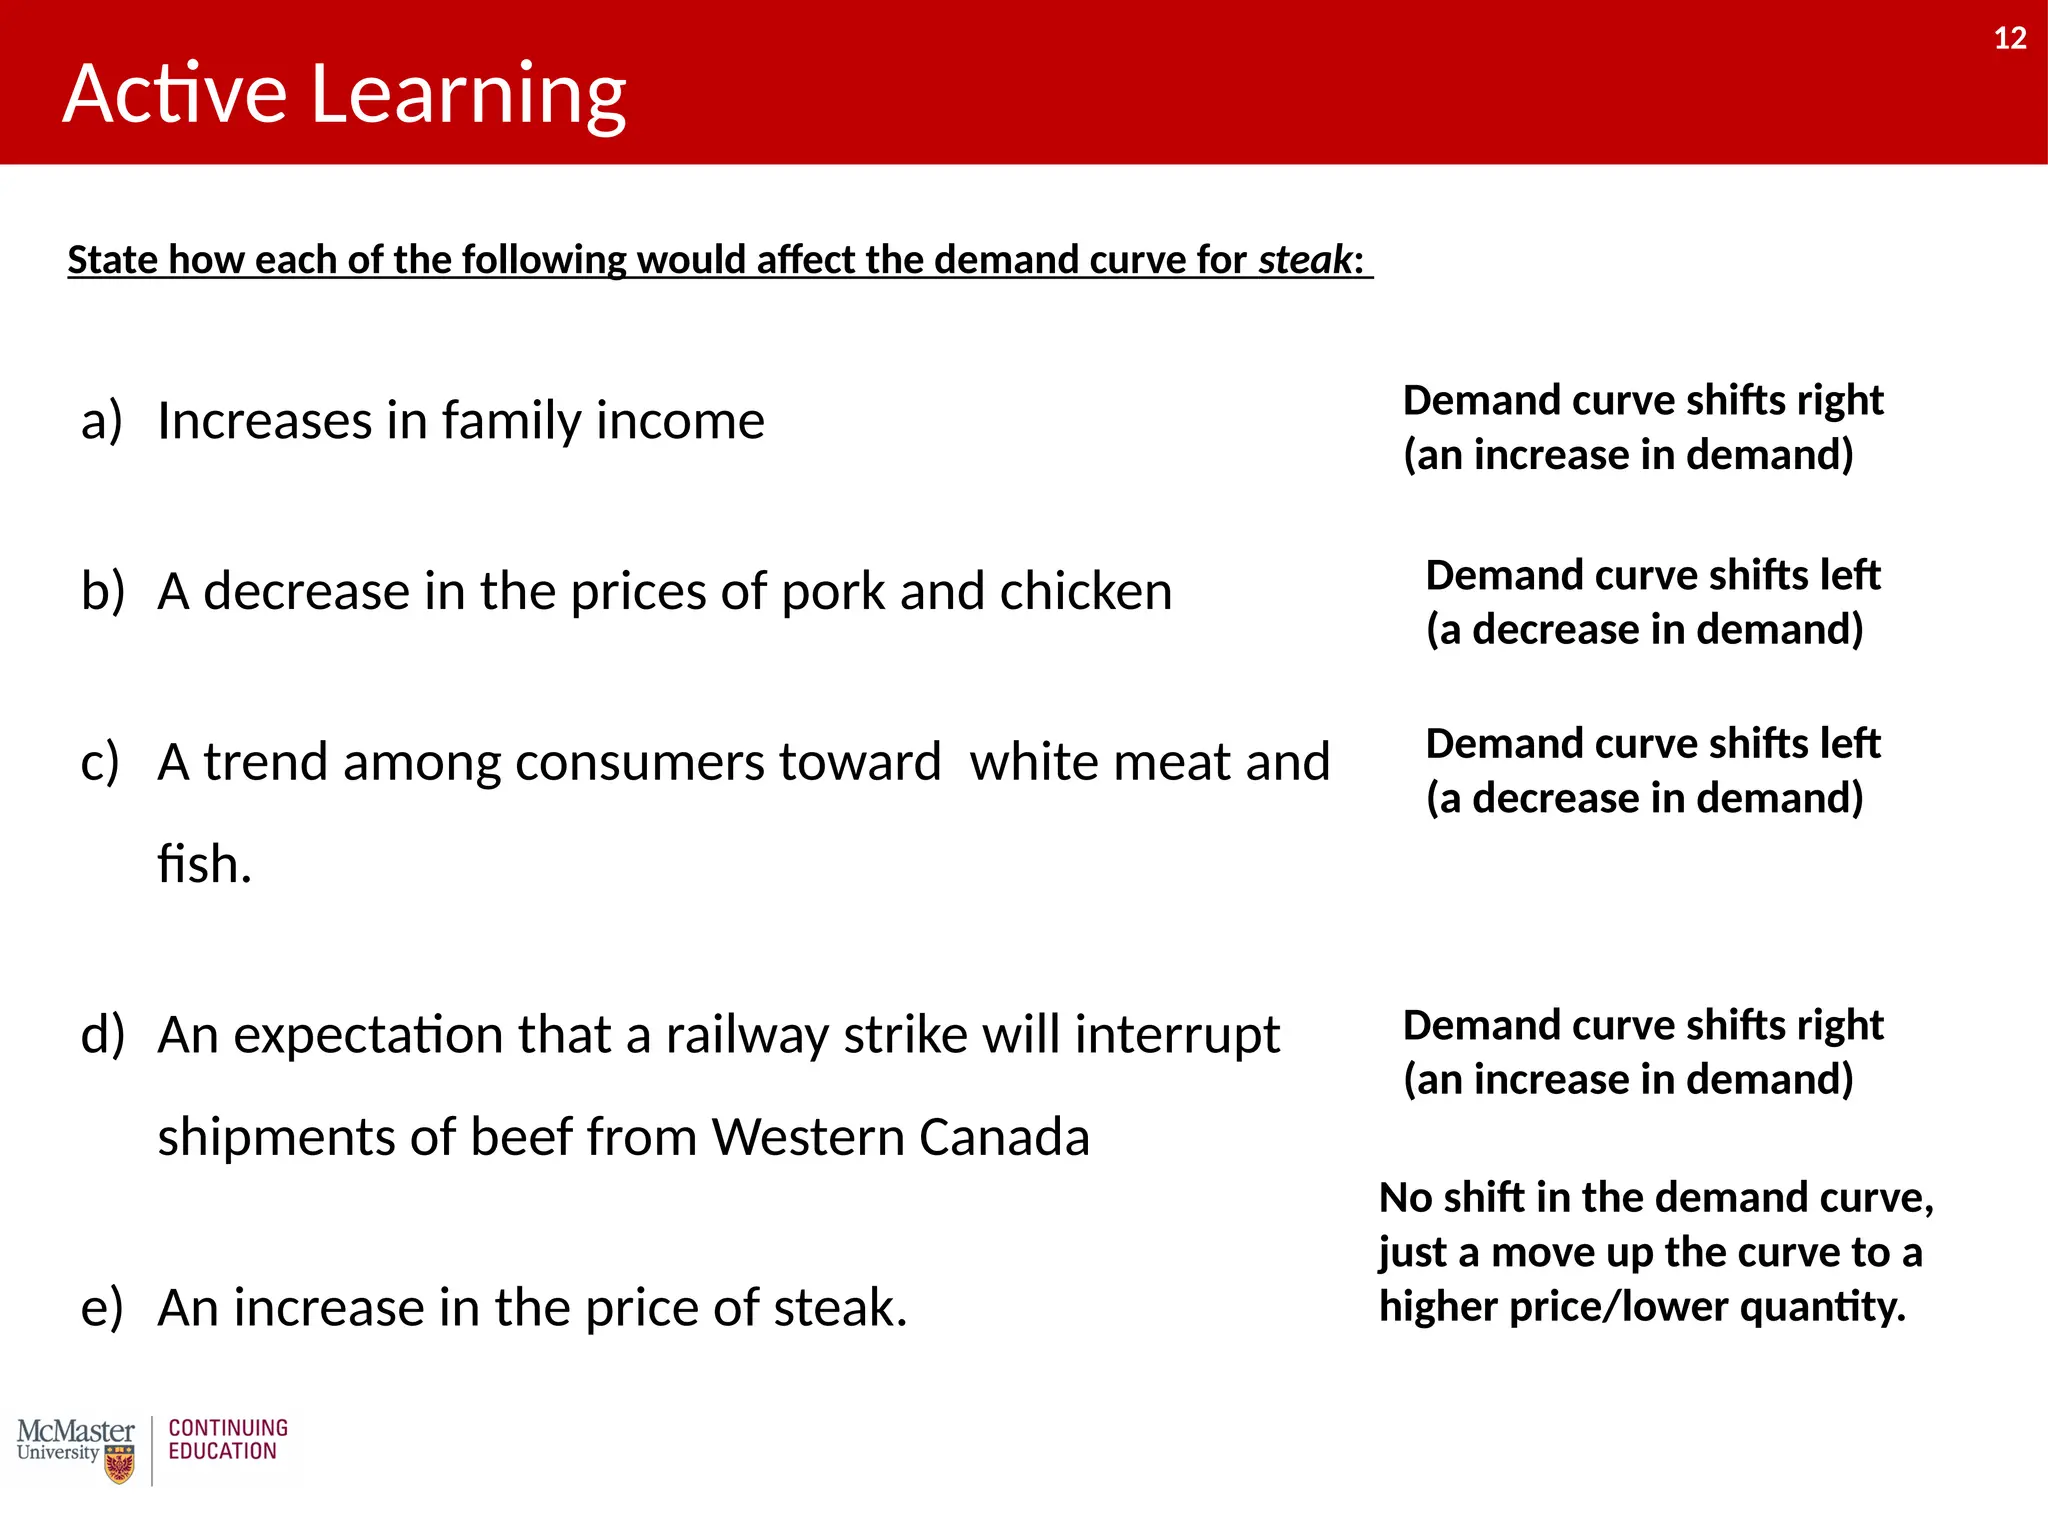
12
State how eachof the following would affect the demand curve for steak:
Demand curve shifts right
(an increase in demand)
Demand curve shifts left
(a decrease in demand)
Demand curve shifts left
(a decrease in demand)
No shift in the demand curve,
just a move up the curve to a
higher price/lower quantity.
Demand curve shifts right
(an increase in demand)
a) Increases in family income
b) A decrease in the prices of pork and chicken
c) A trend among consumers toward white meat and
fish.
d) An expectation that a railway strike will interrupt
shipments of beef from Western Canada
e) An increase in the price of steak.
Active Learning
12
13.
13
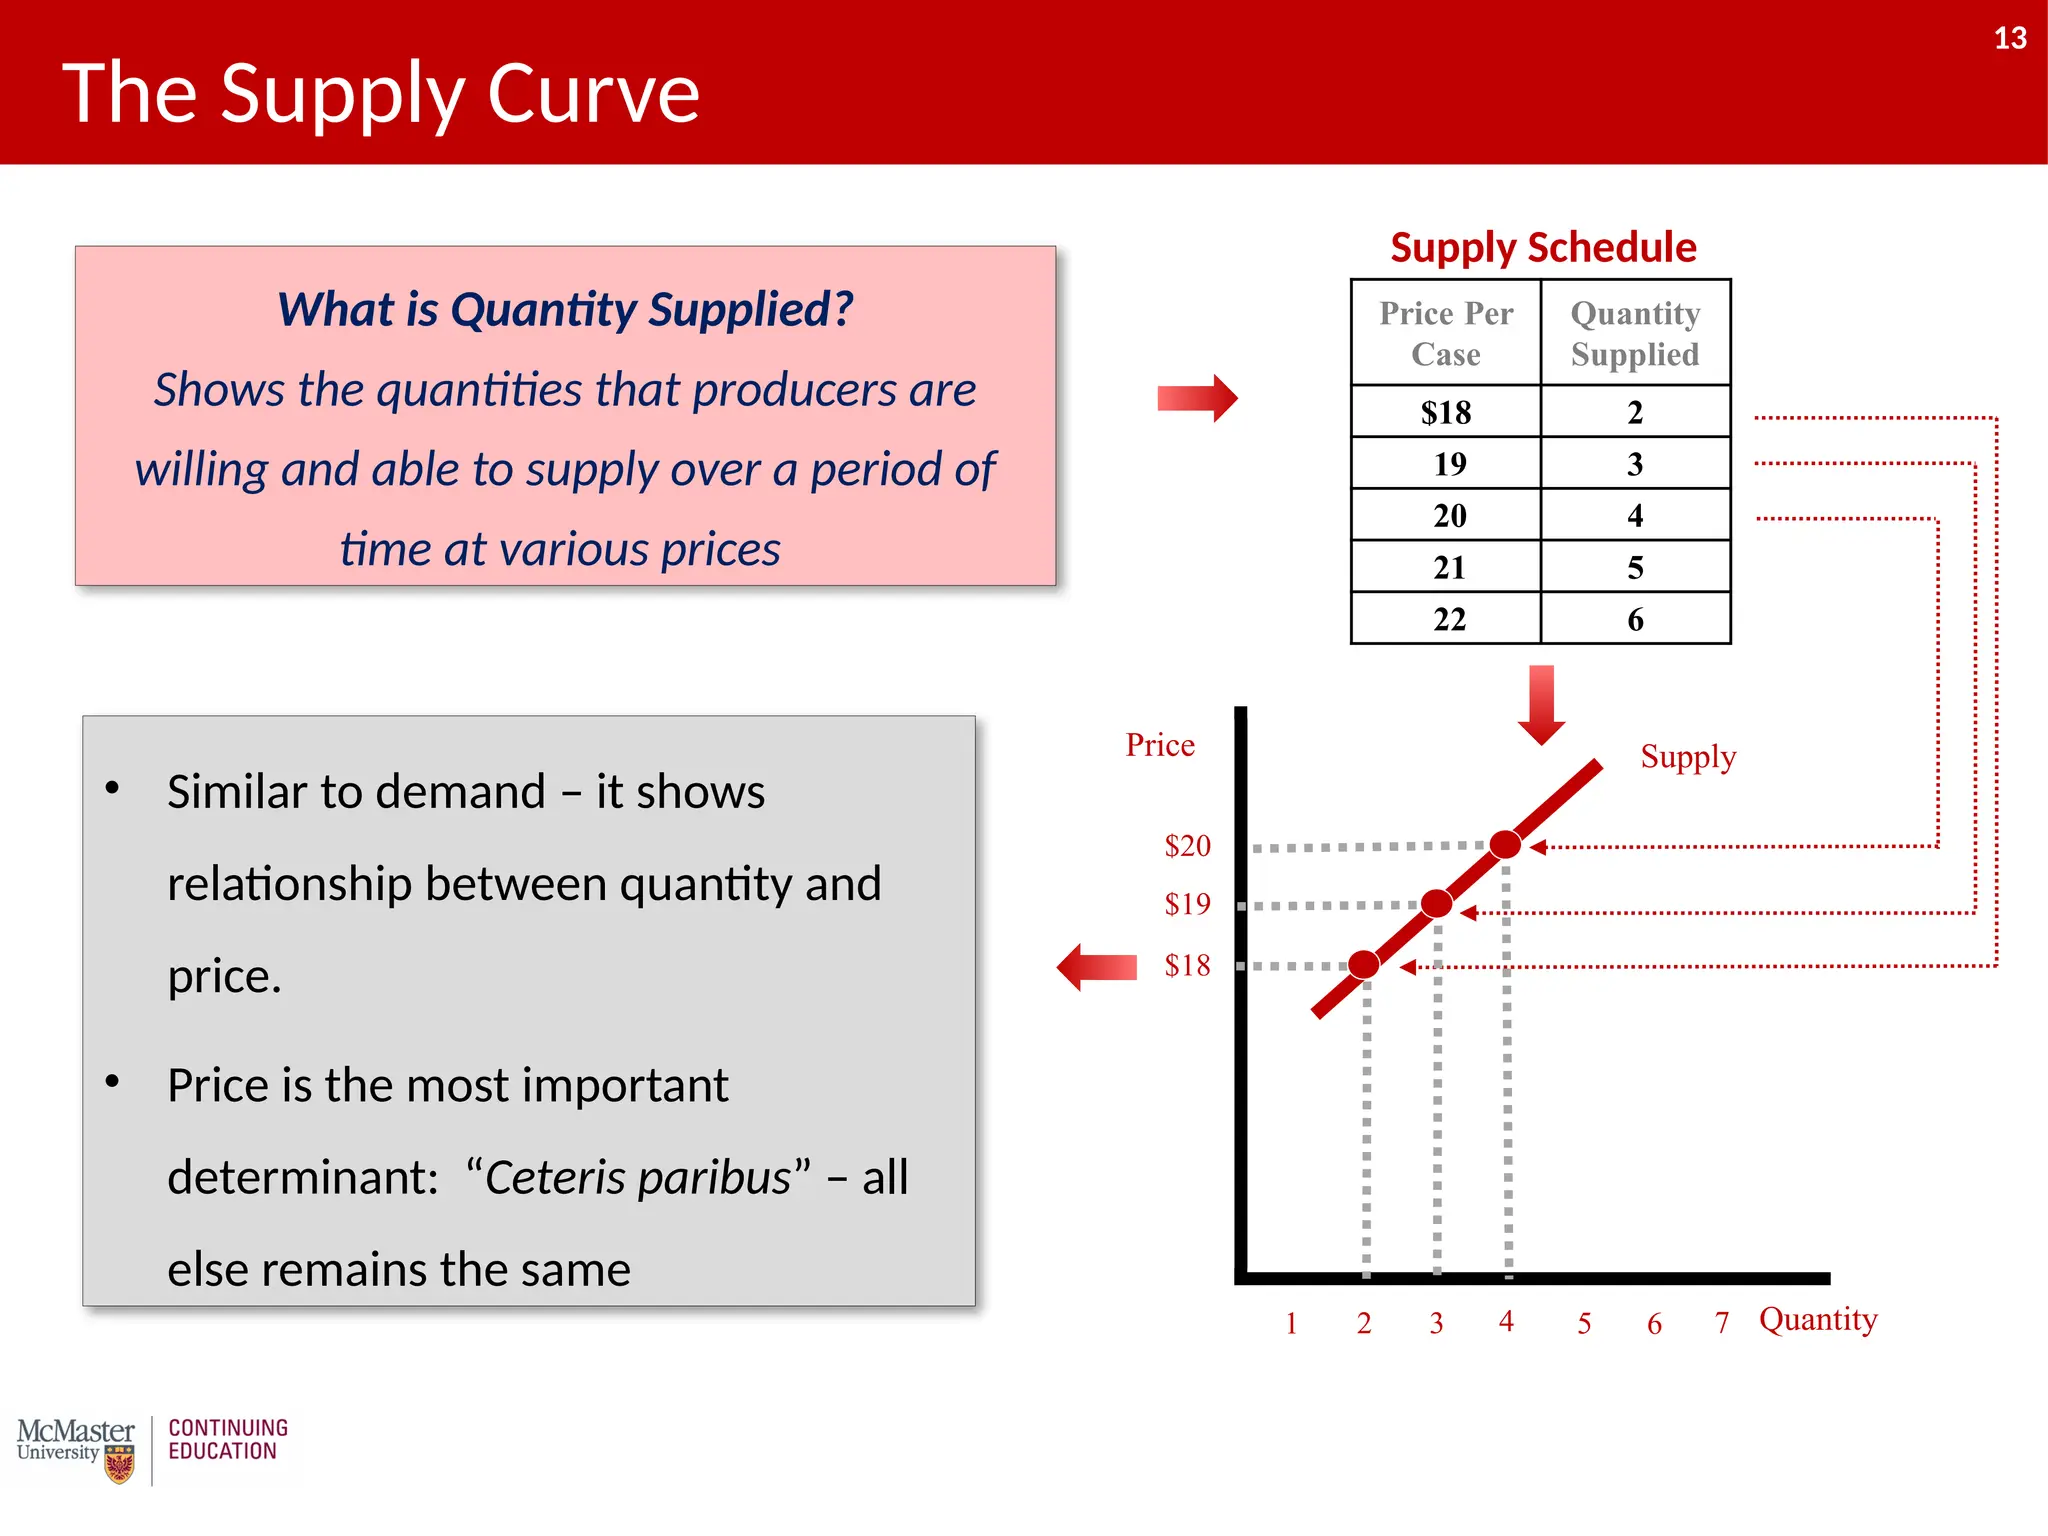
The Supply Curve
•Similar to demand – it shows
relationship between quantity and
price.
• Price is the most important
determinant: “Ceteris paribus” – all
else remains the same
Supply Schedule
Price Per
Case
Quantity
Supplied
$18 2
19 3
20 4
21 5
22 6
Price
Quantity
$20
6
3 7
$19
$18
4 5
2
1
Supply
What is Quantity Supplied?
Shows the quantities that producers are
willing and able to supply over a period of
time at various prices
13
14.
14
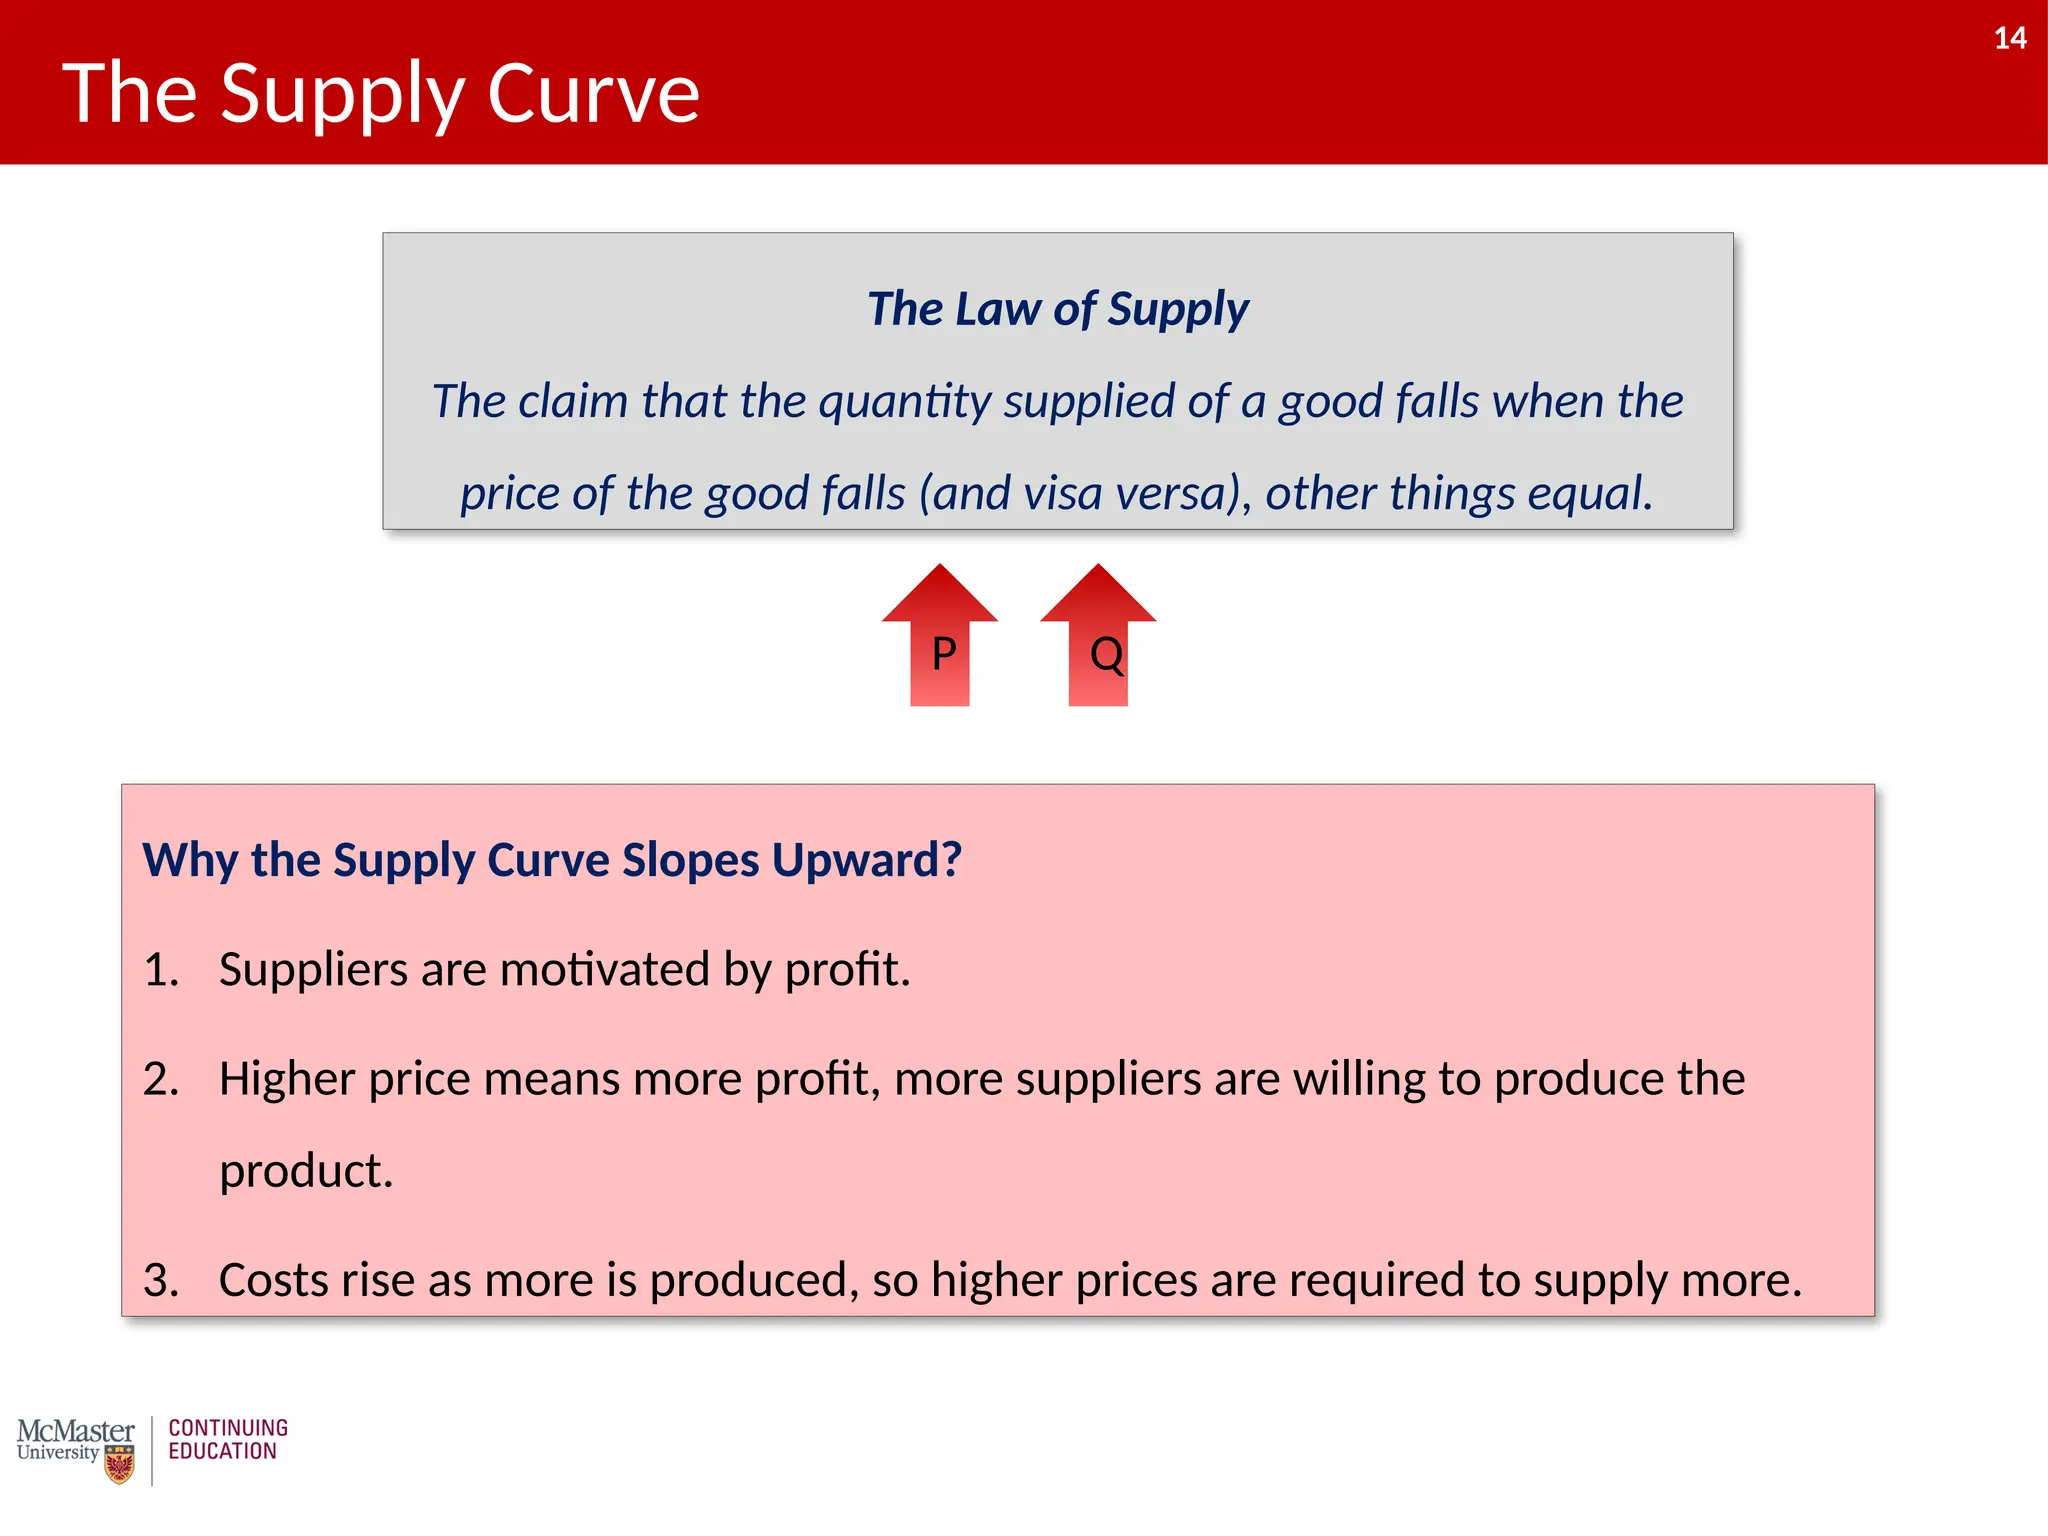
The Supply Curve
Whythe Supply Curve Slopes Upward?
1. Suppliers are motivated by profit.
2. Higher price means more profit, more suppliers are willing to produce the
product.
3. Costs rise as more is produced, so higher prices are required to supply more.
The Law of Supply
The claim that the quantity supplied of a good falls when the
price of the good falls (and visa versa), other things equal.
P Q
14
15.
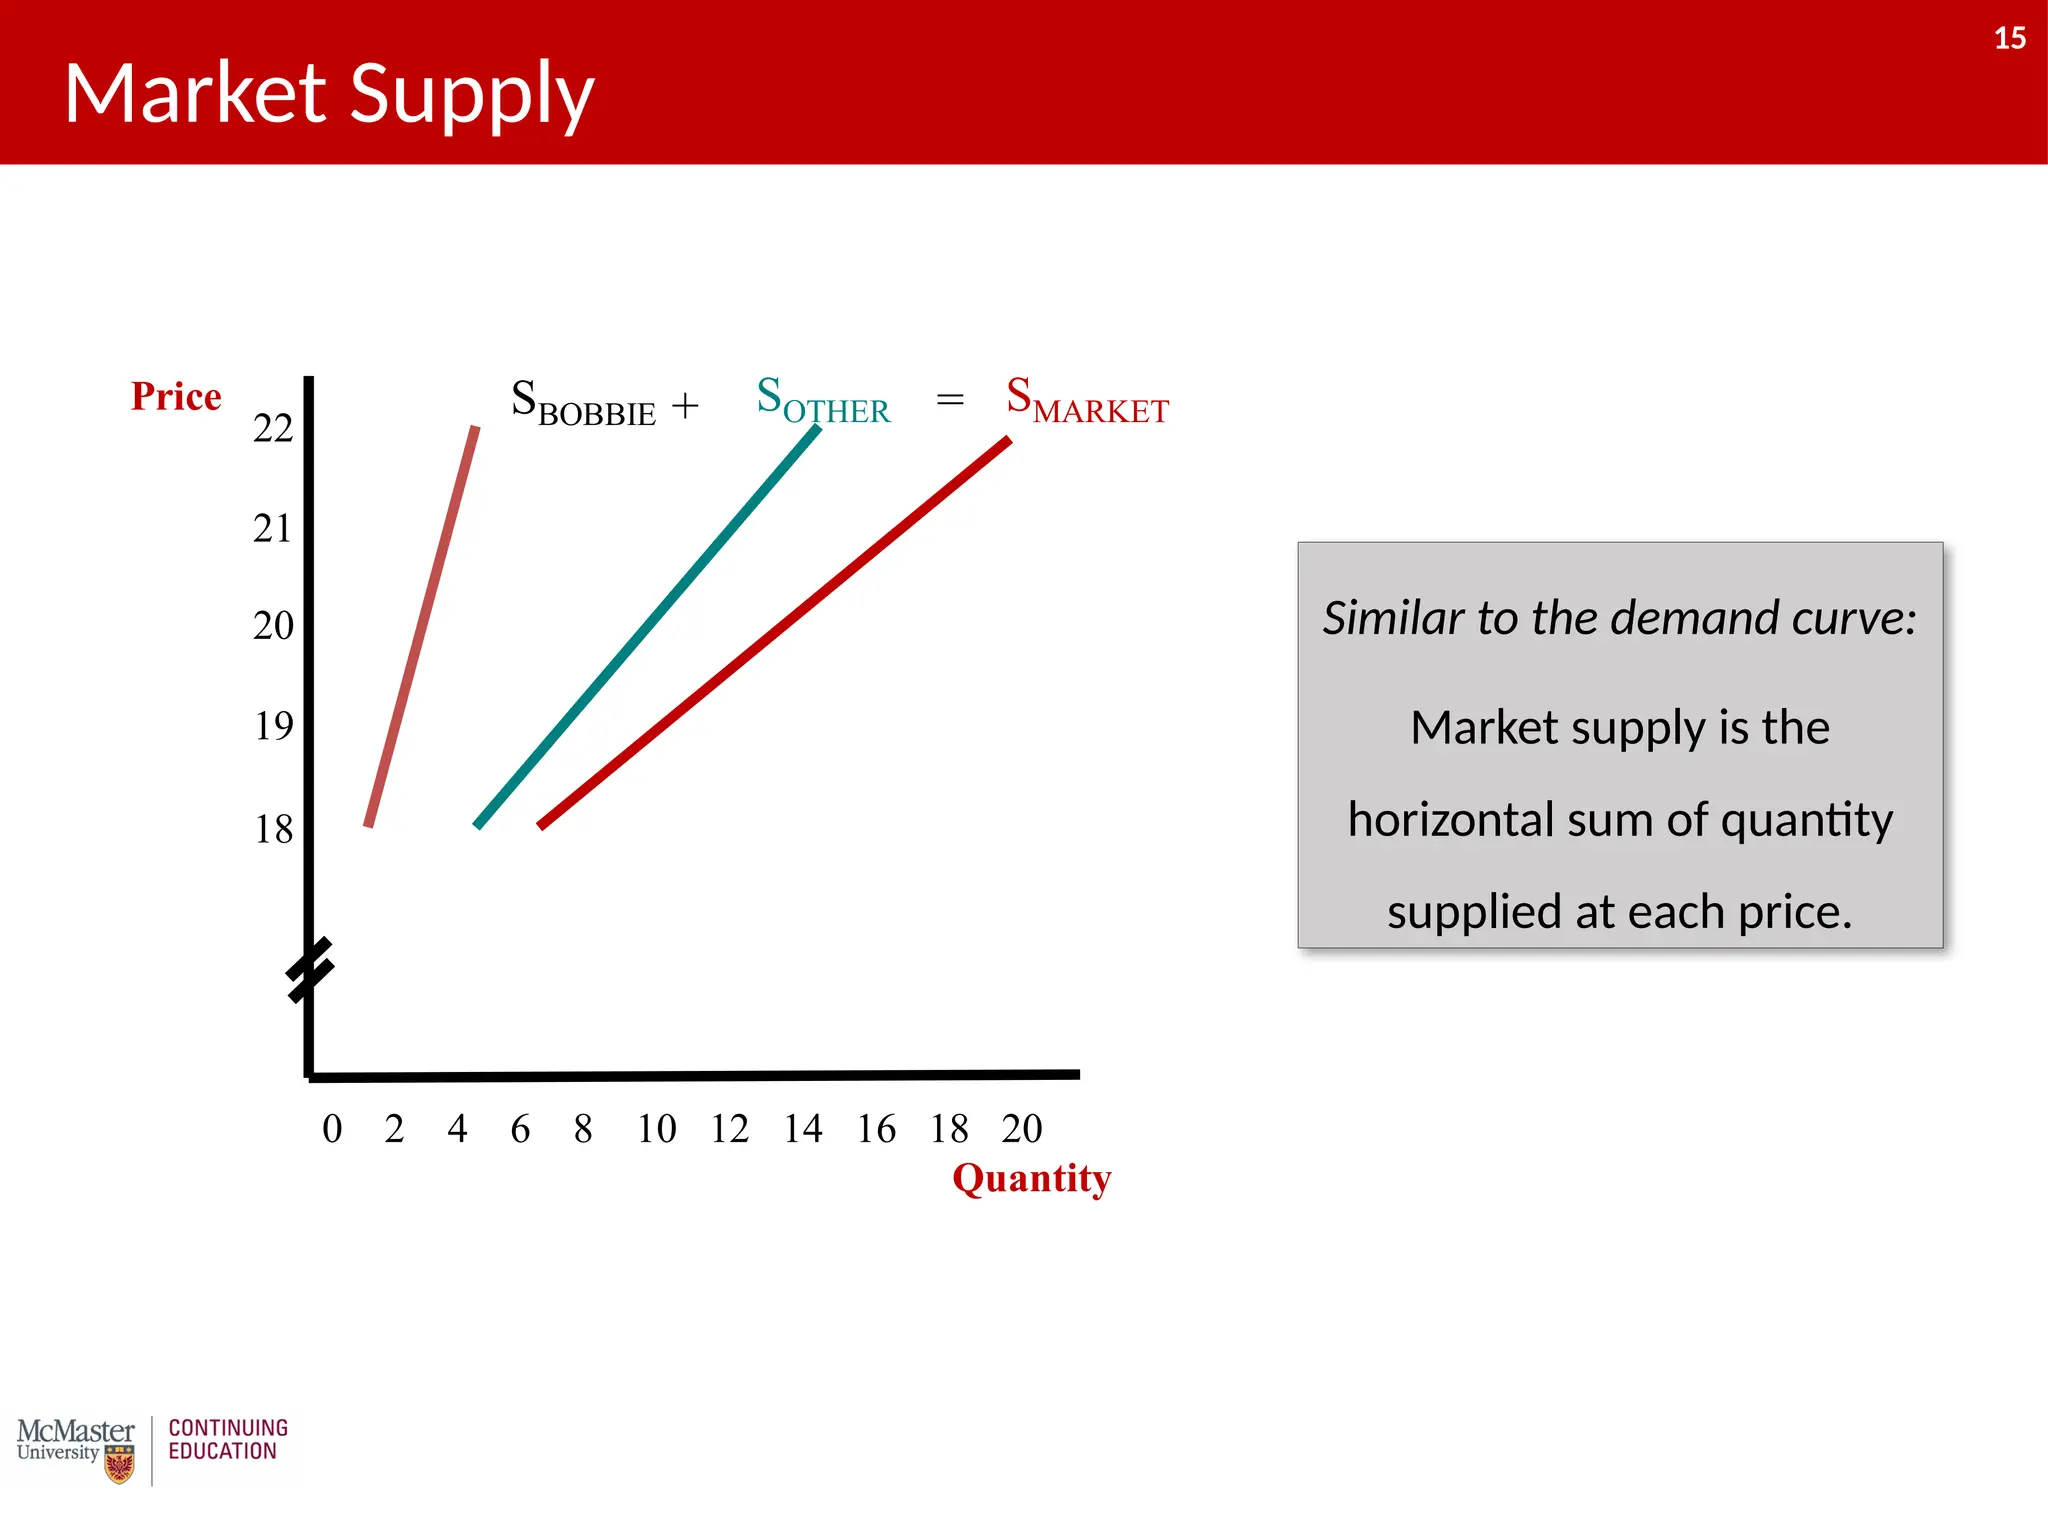
15
Market Supply
Price
Quantity
0 24 6 8 10 12 14 16 18 20
SBOBBIE
18
19
20
22
21
SOTHER
+ SMARKET
=
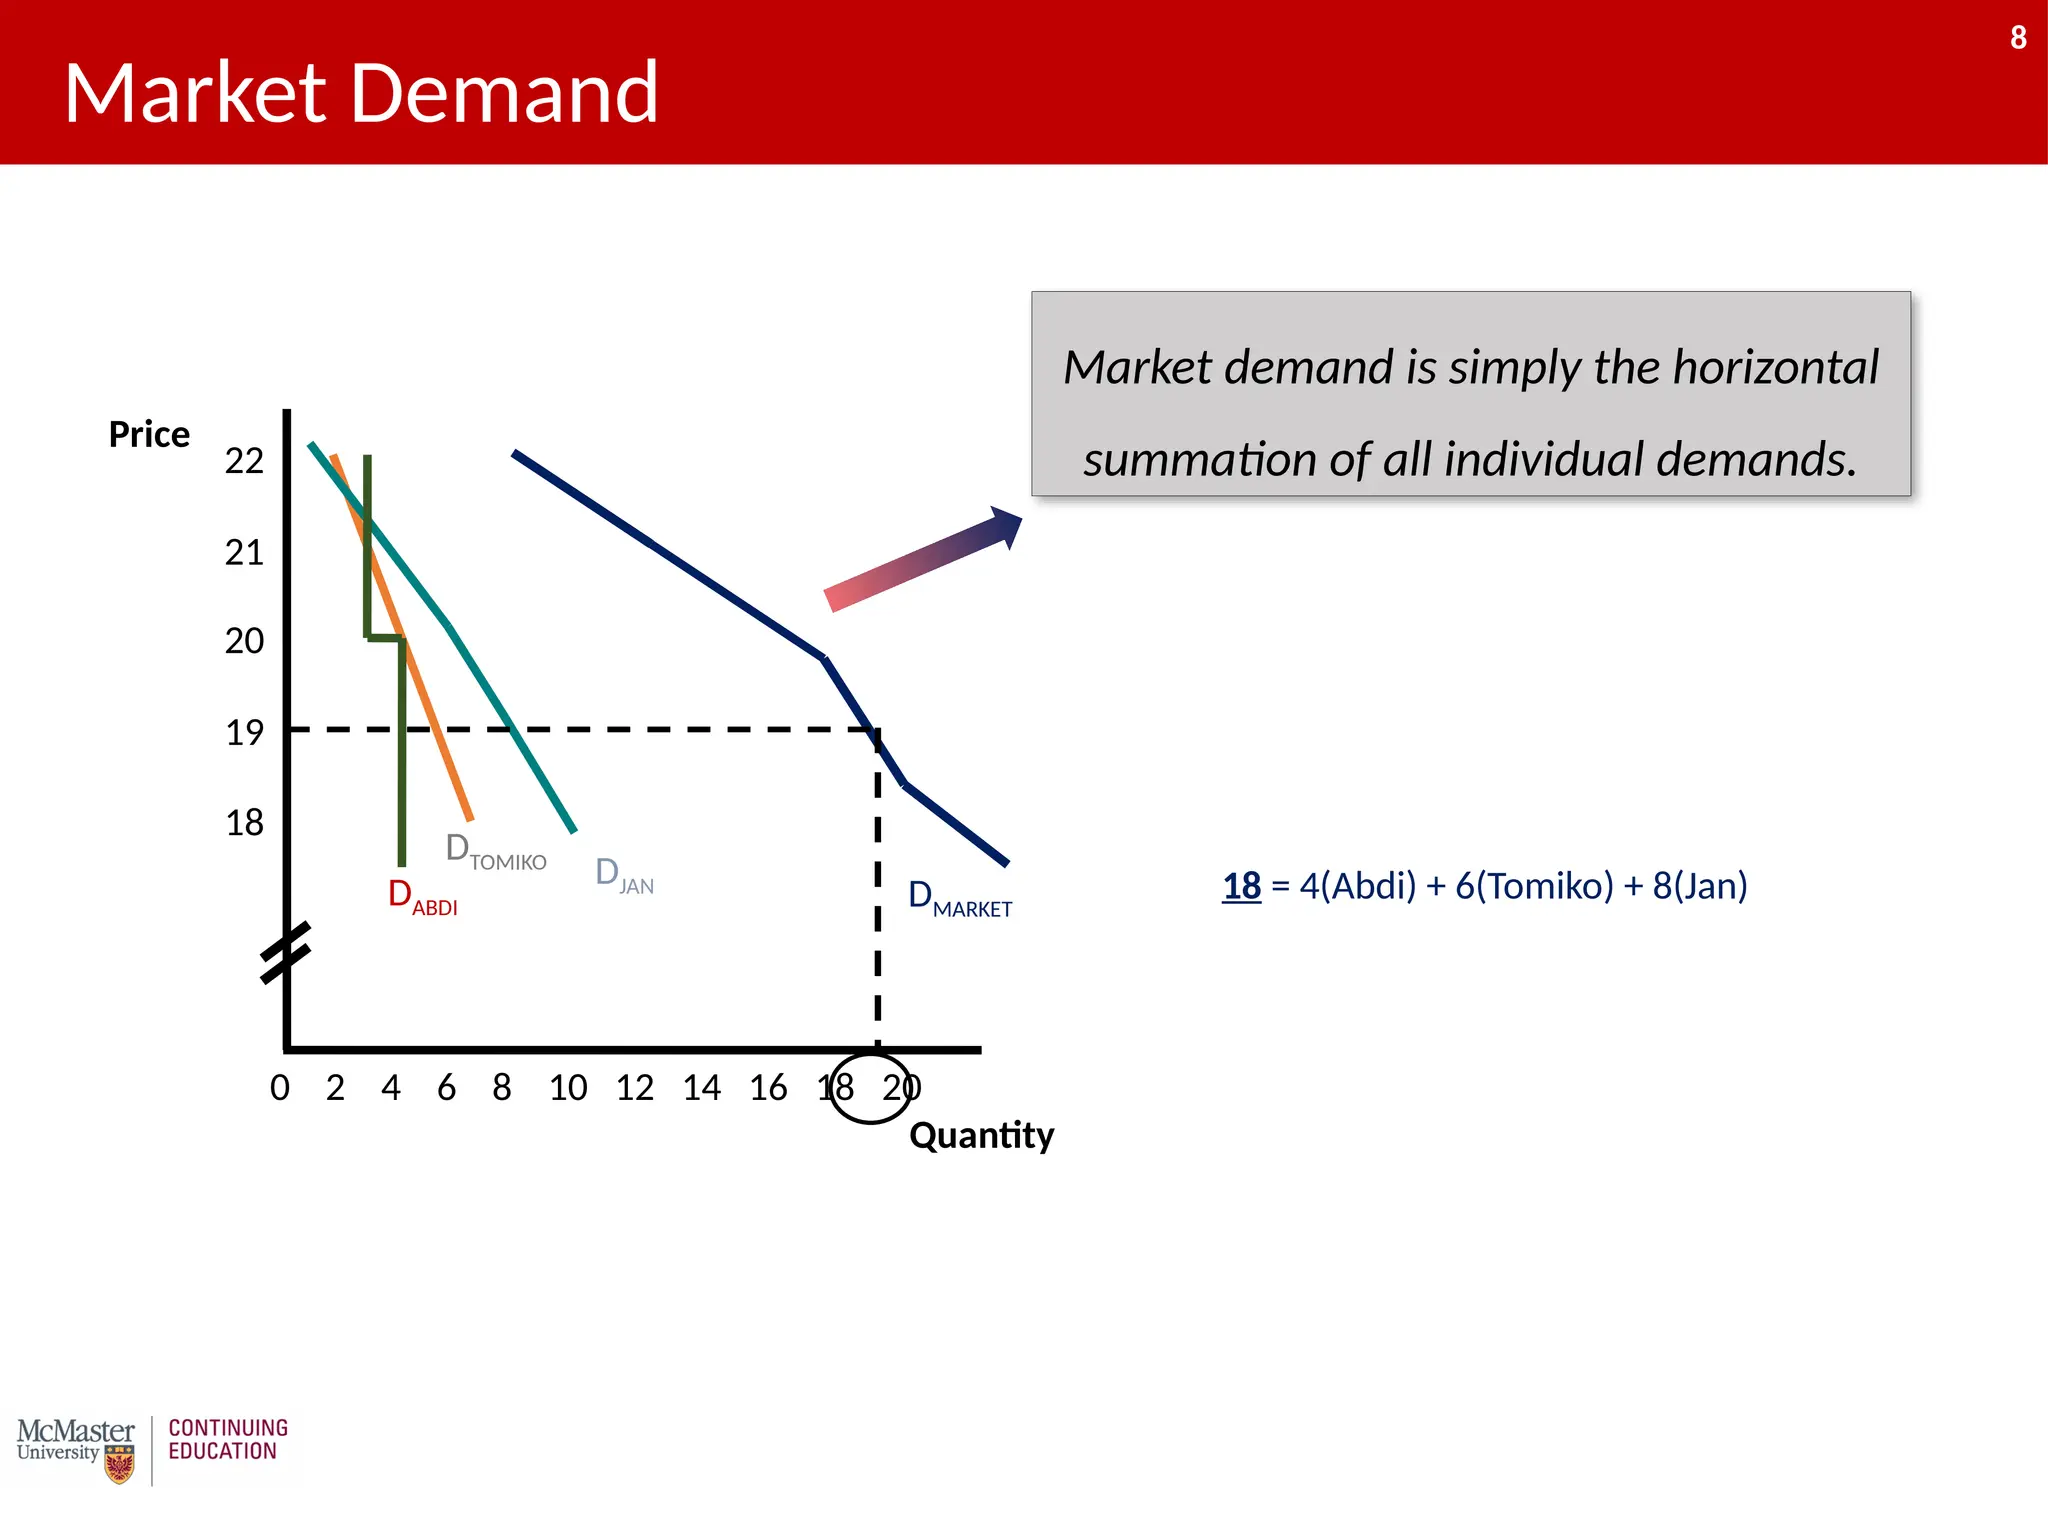
Similar to the demand curve:
Market supply is the
horizontal sum of quantity
supplied at each price.
15
16.
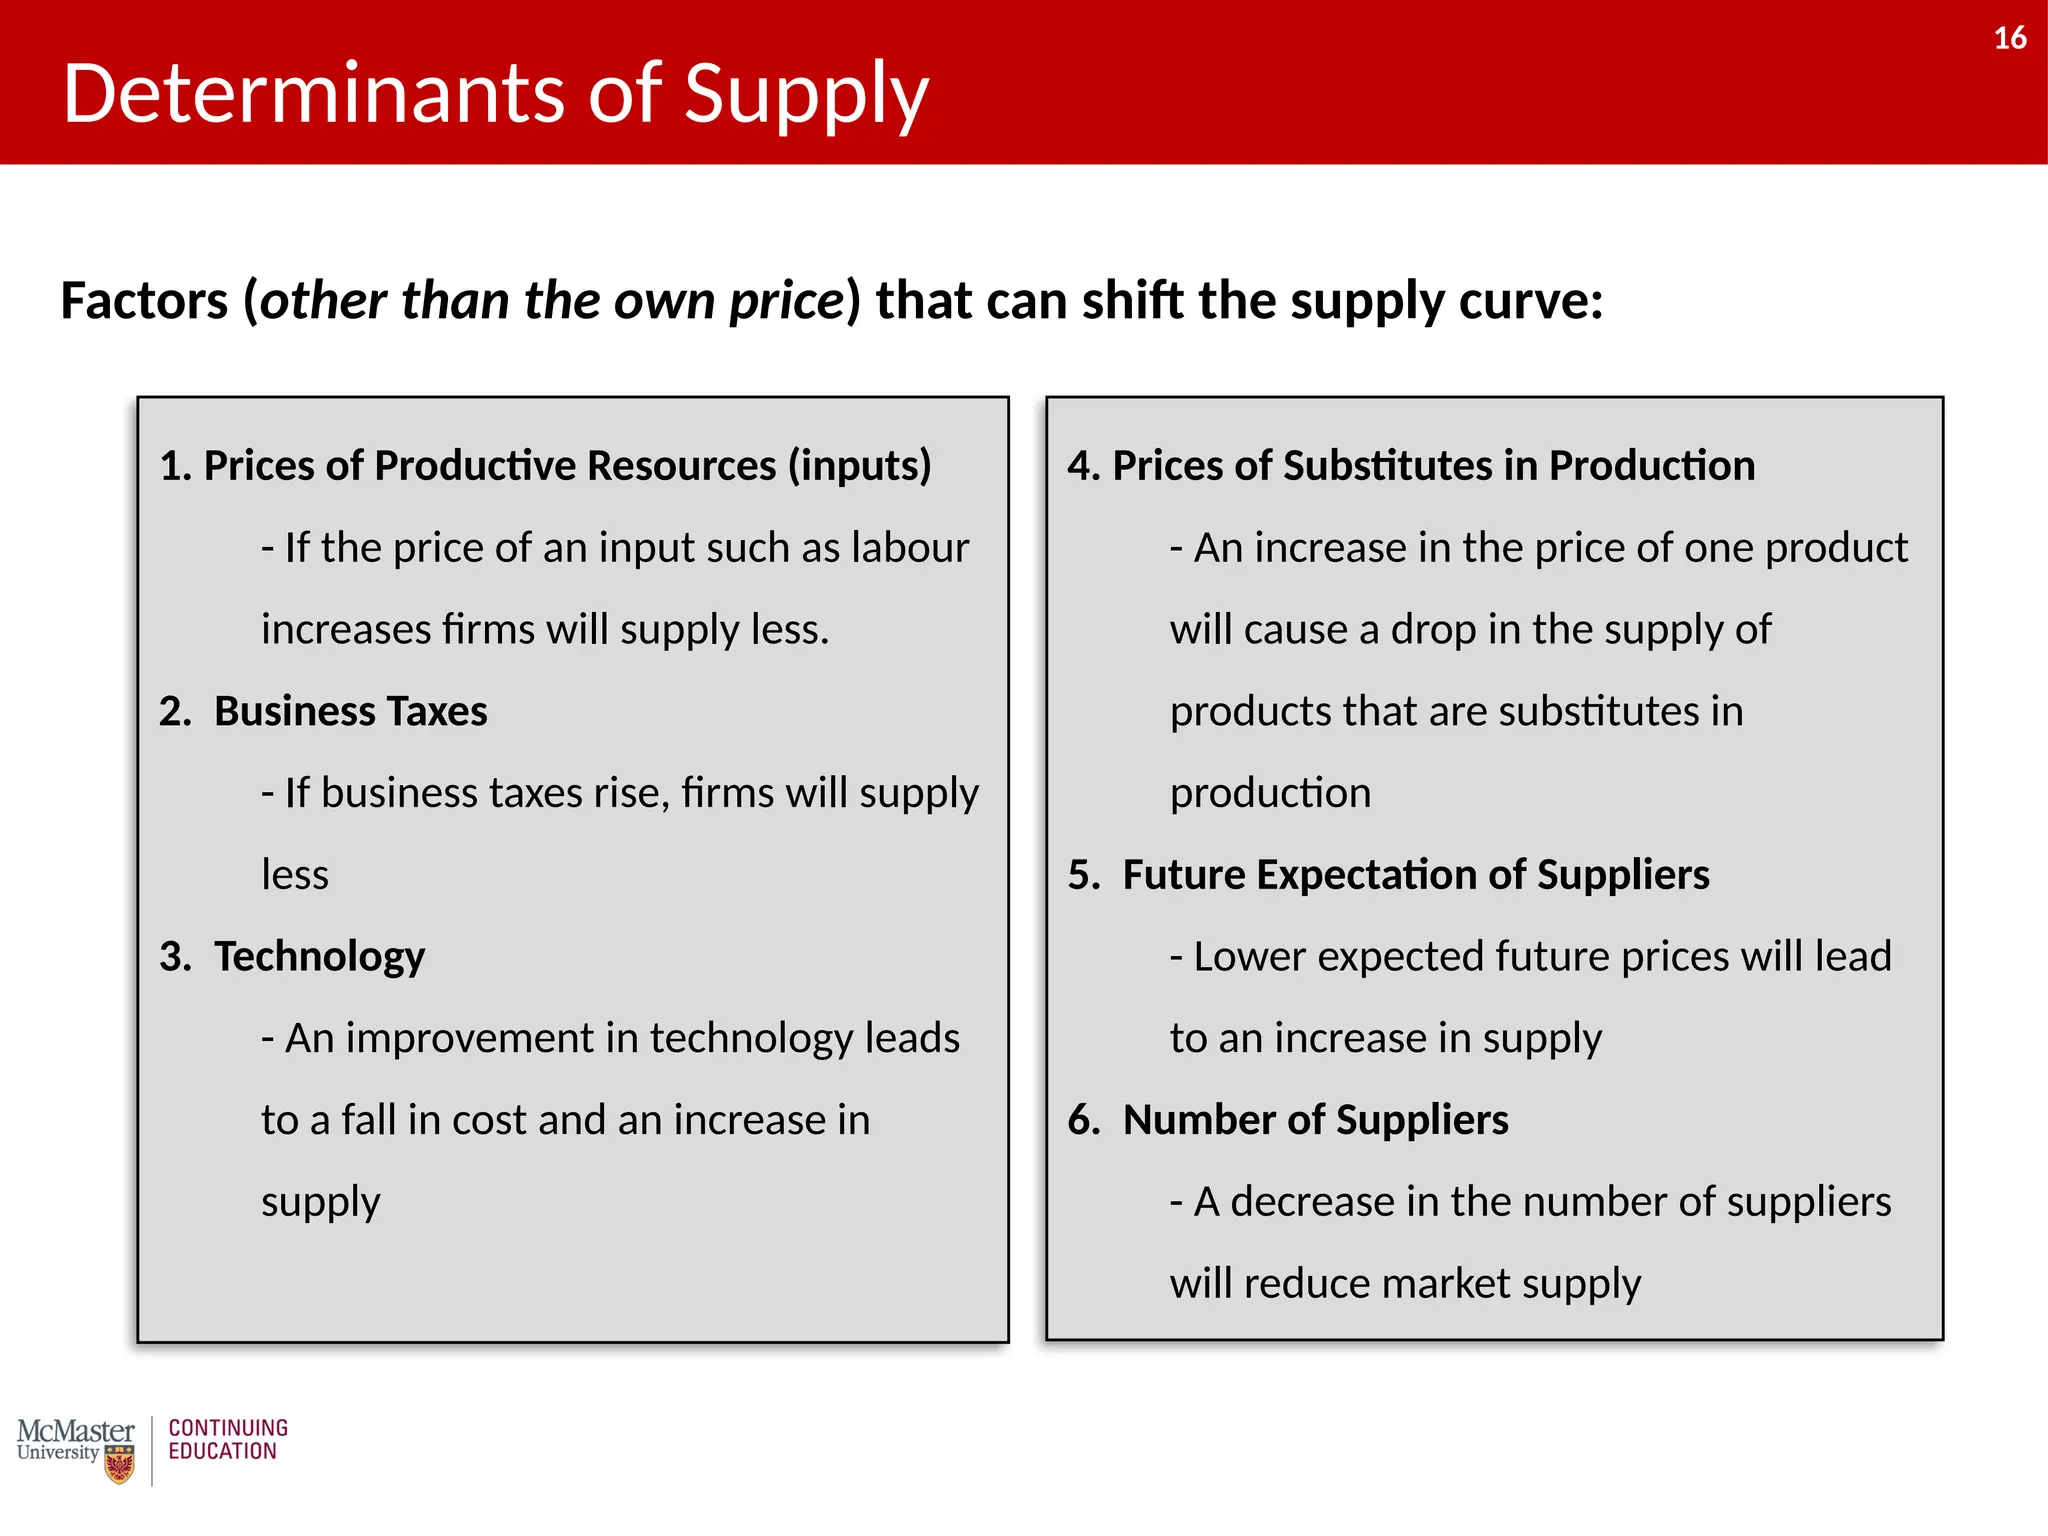
16
1. Prices ofProductive Resources (inputs)
- If the price of an input such as labour
increases firms will supply less.
2. Business Taxes
- If business taxes rise, firms will supply
less
3. Technology
- An improvement in technology leads
to a fall in cost and an increase in
supply
Determinants of Supply
Factors (other than the own price) that can shift the supply curve:
4. Prices of Substitutes in Production
- An increase in the price of one product
will cause a drop in the supply of
products that are substitutes in
production
5. Future Expectation of Suppliers
- Lower expected future prices will lead
to an increase in supply
6. Number of Suppliers
- A decrease in the number of suppliers
will reduce market supply
16
17.
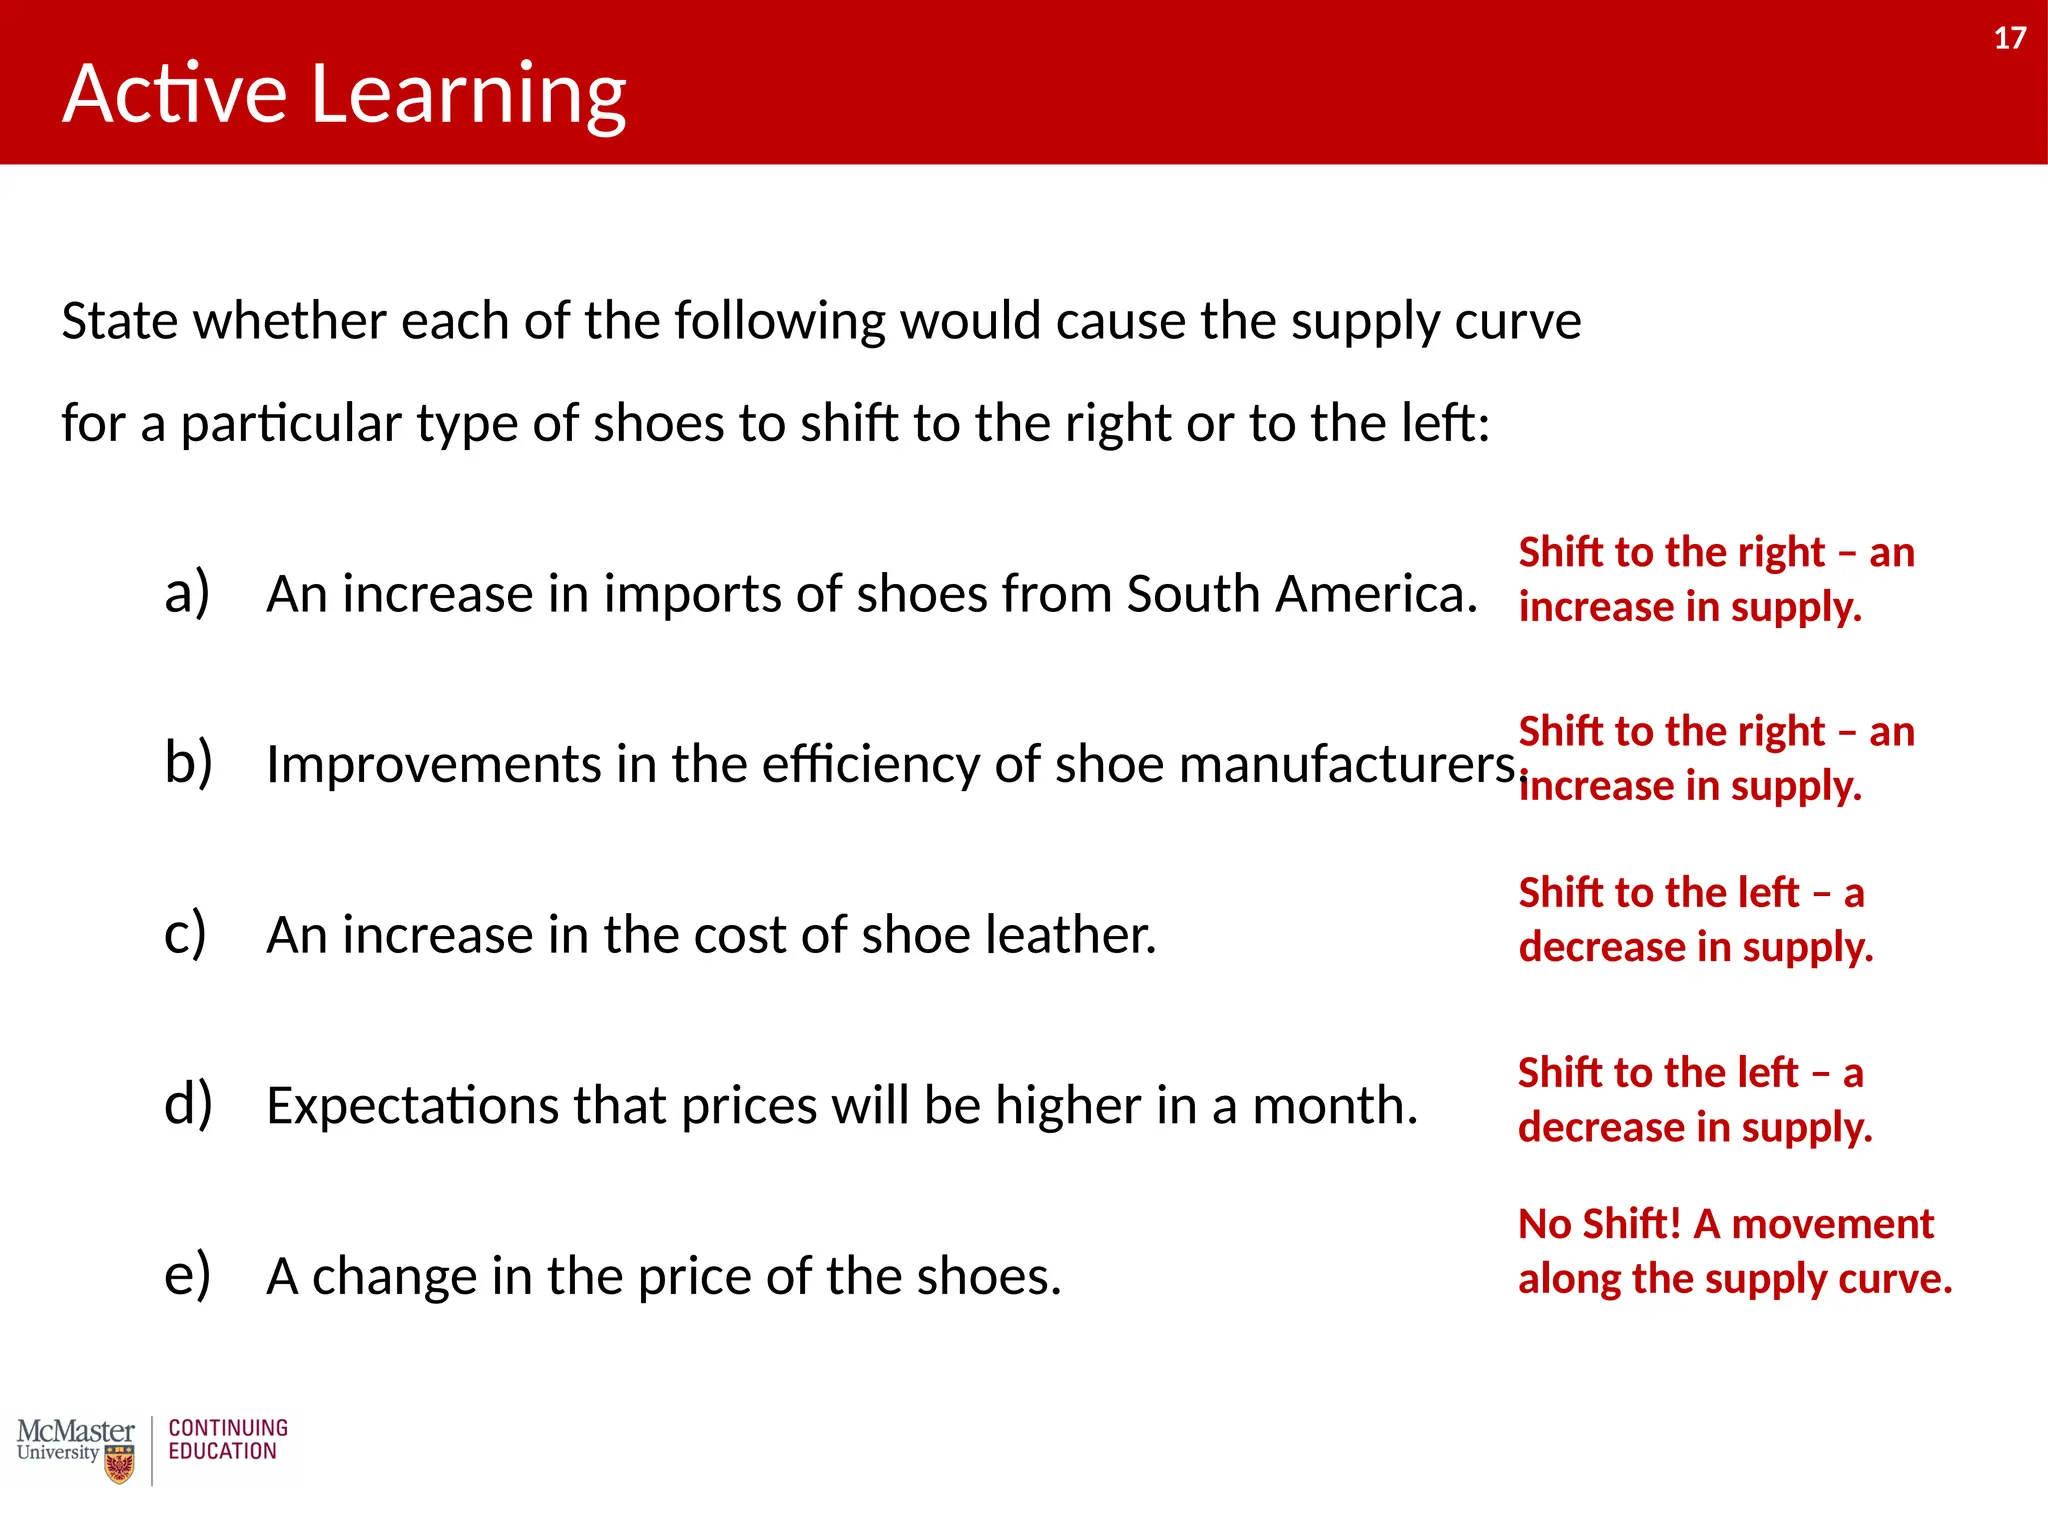
17
Shift to theleft – a
decrease in supply.
Shift to the right – an
increase in supply.
Shift to the right – an
increase in supply.
No Shift! A movement
along the supply curve.
State whether each of the following would cause the supply curve
for a particular type of shoes to shift to the right or to the left:
a) An increase in imports of shoes from South America.
b) Improvements in the efficiency of shoe manufacturers.
c) An increase in the cost of shoe leather.
d) Expectations that prices will be higher in a month.
e) A change in the price of the shoes.
Active Learning
Shift to the left – a
decrease in supply.
17
18.
18
• Up tonow we have analyzed supply and demand separately.
• We now combine them to form a model of a market:
a) The operation of a market depends on the interaction between buyers
and sellers.
b) Buyers and sellers, together, determine the price and quantity of a
good or service sold in the market.
Supply And Demand Together
18
19.
19
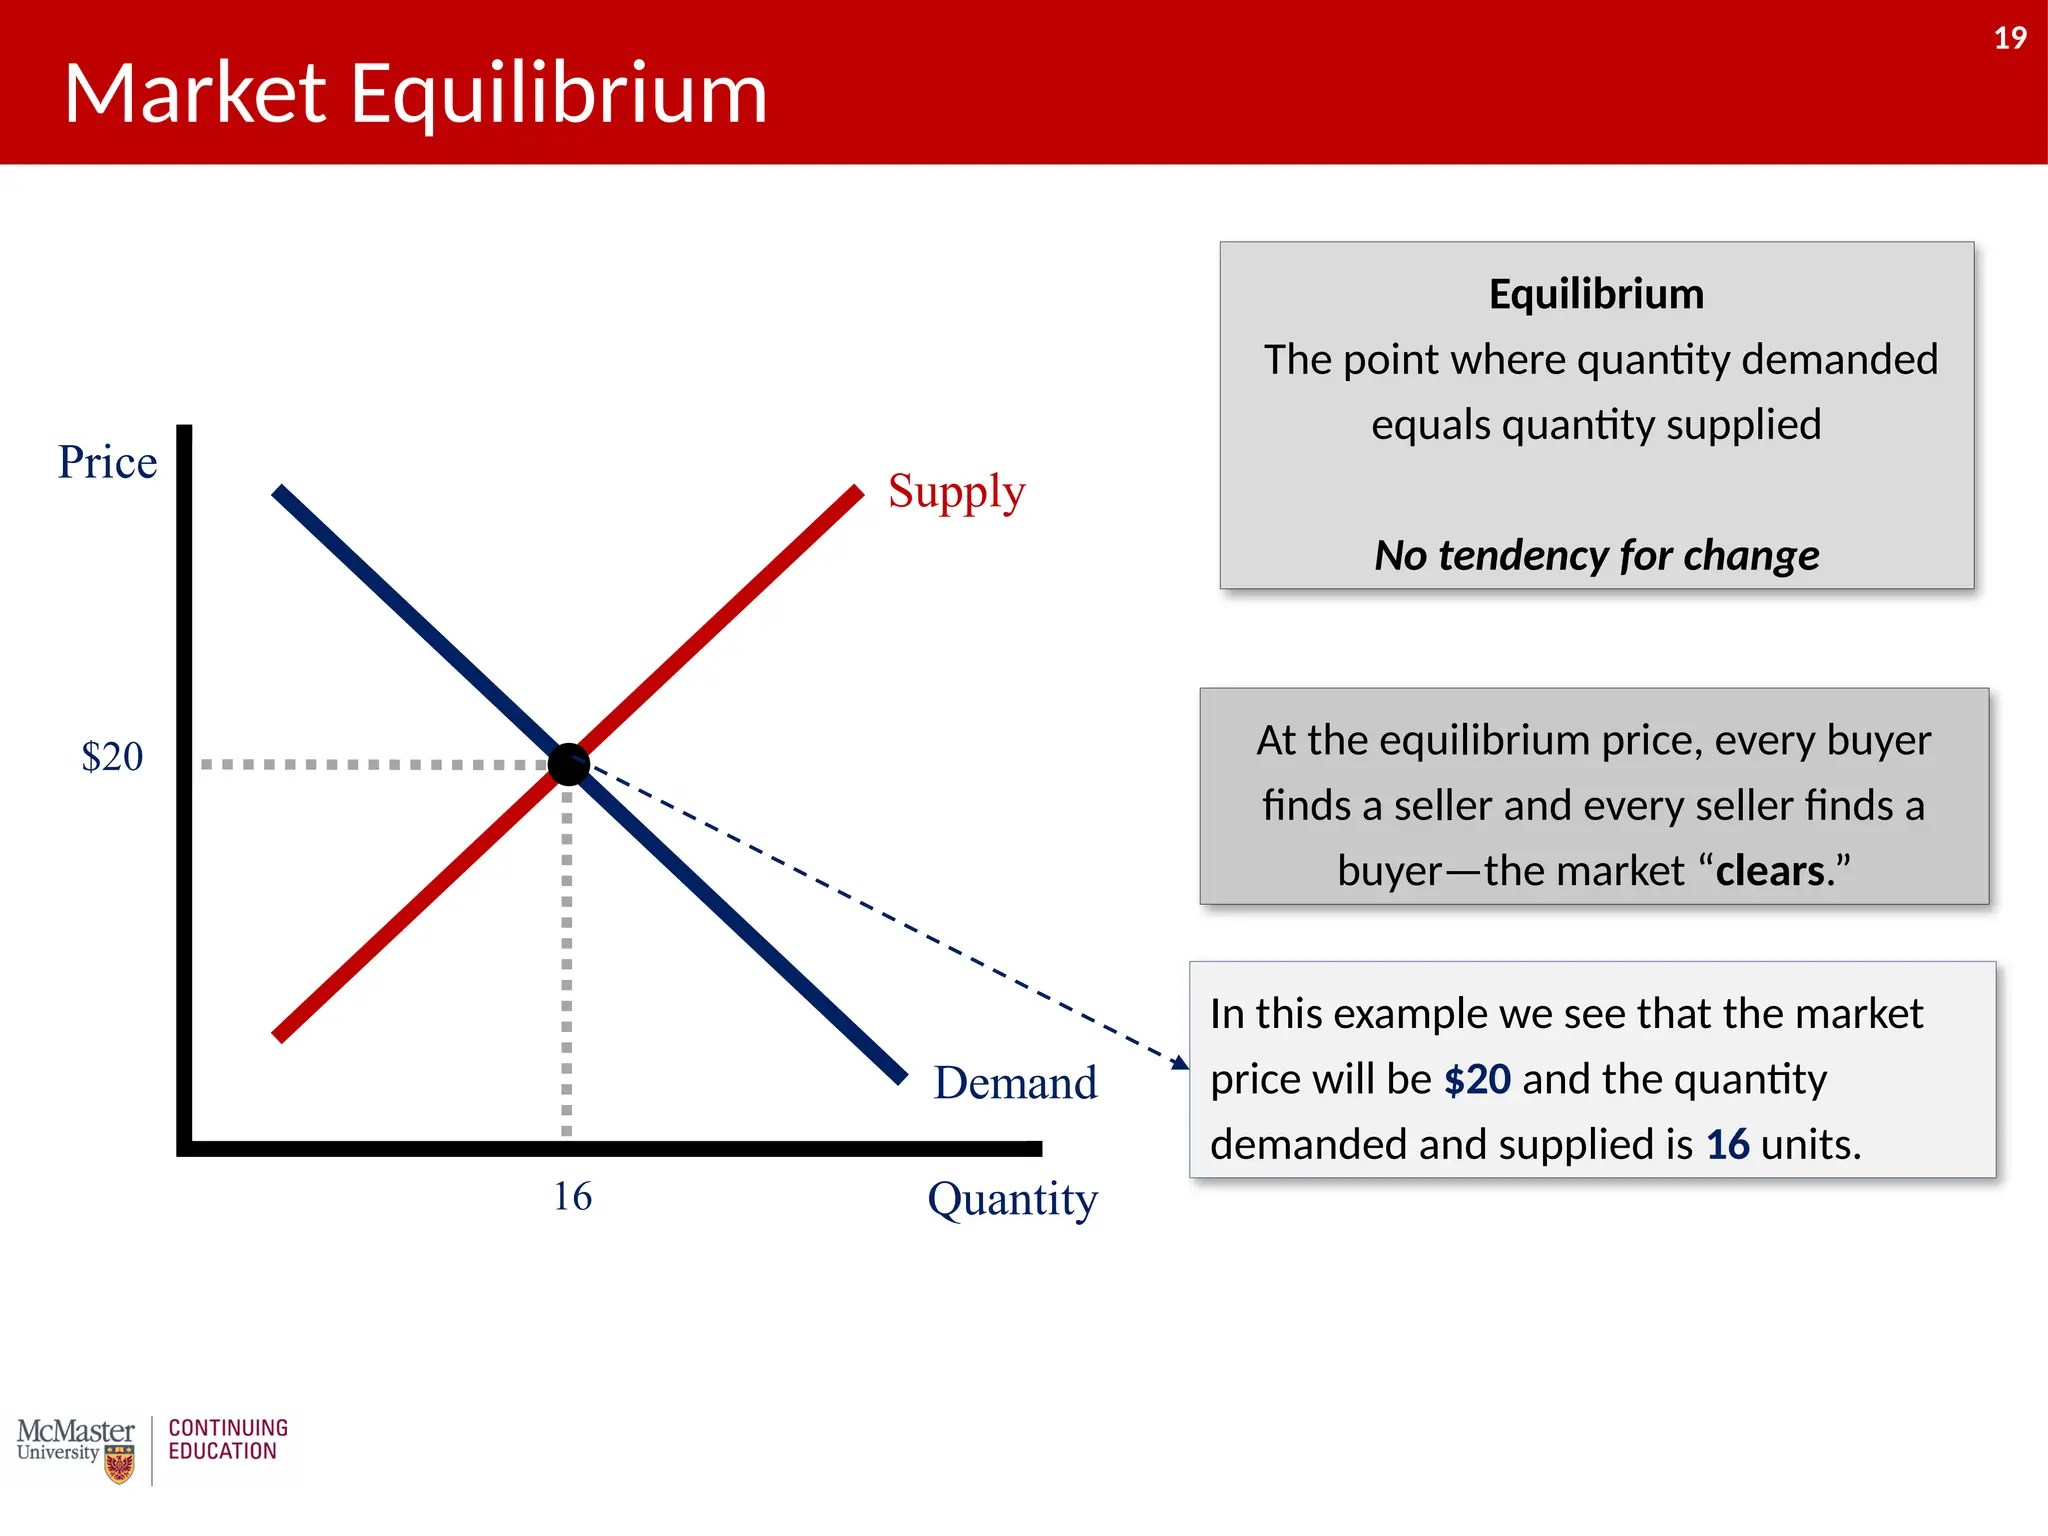
Market Equilibrium
Demand
Supply
Price
Quantity
$20
16
Equilibrium
The pointwhere quantity demanded
equals quantity supplied
No tendency for change
In this example we see that the market
price will be $20 and the quantity
demanded and supplied is 16 units.
At the equilibrium price, every buyer
finds a seller and every seller finds a
buyer—the market “clears.”
19
20.
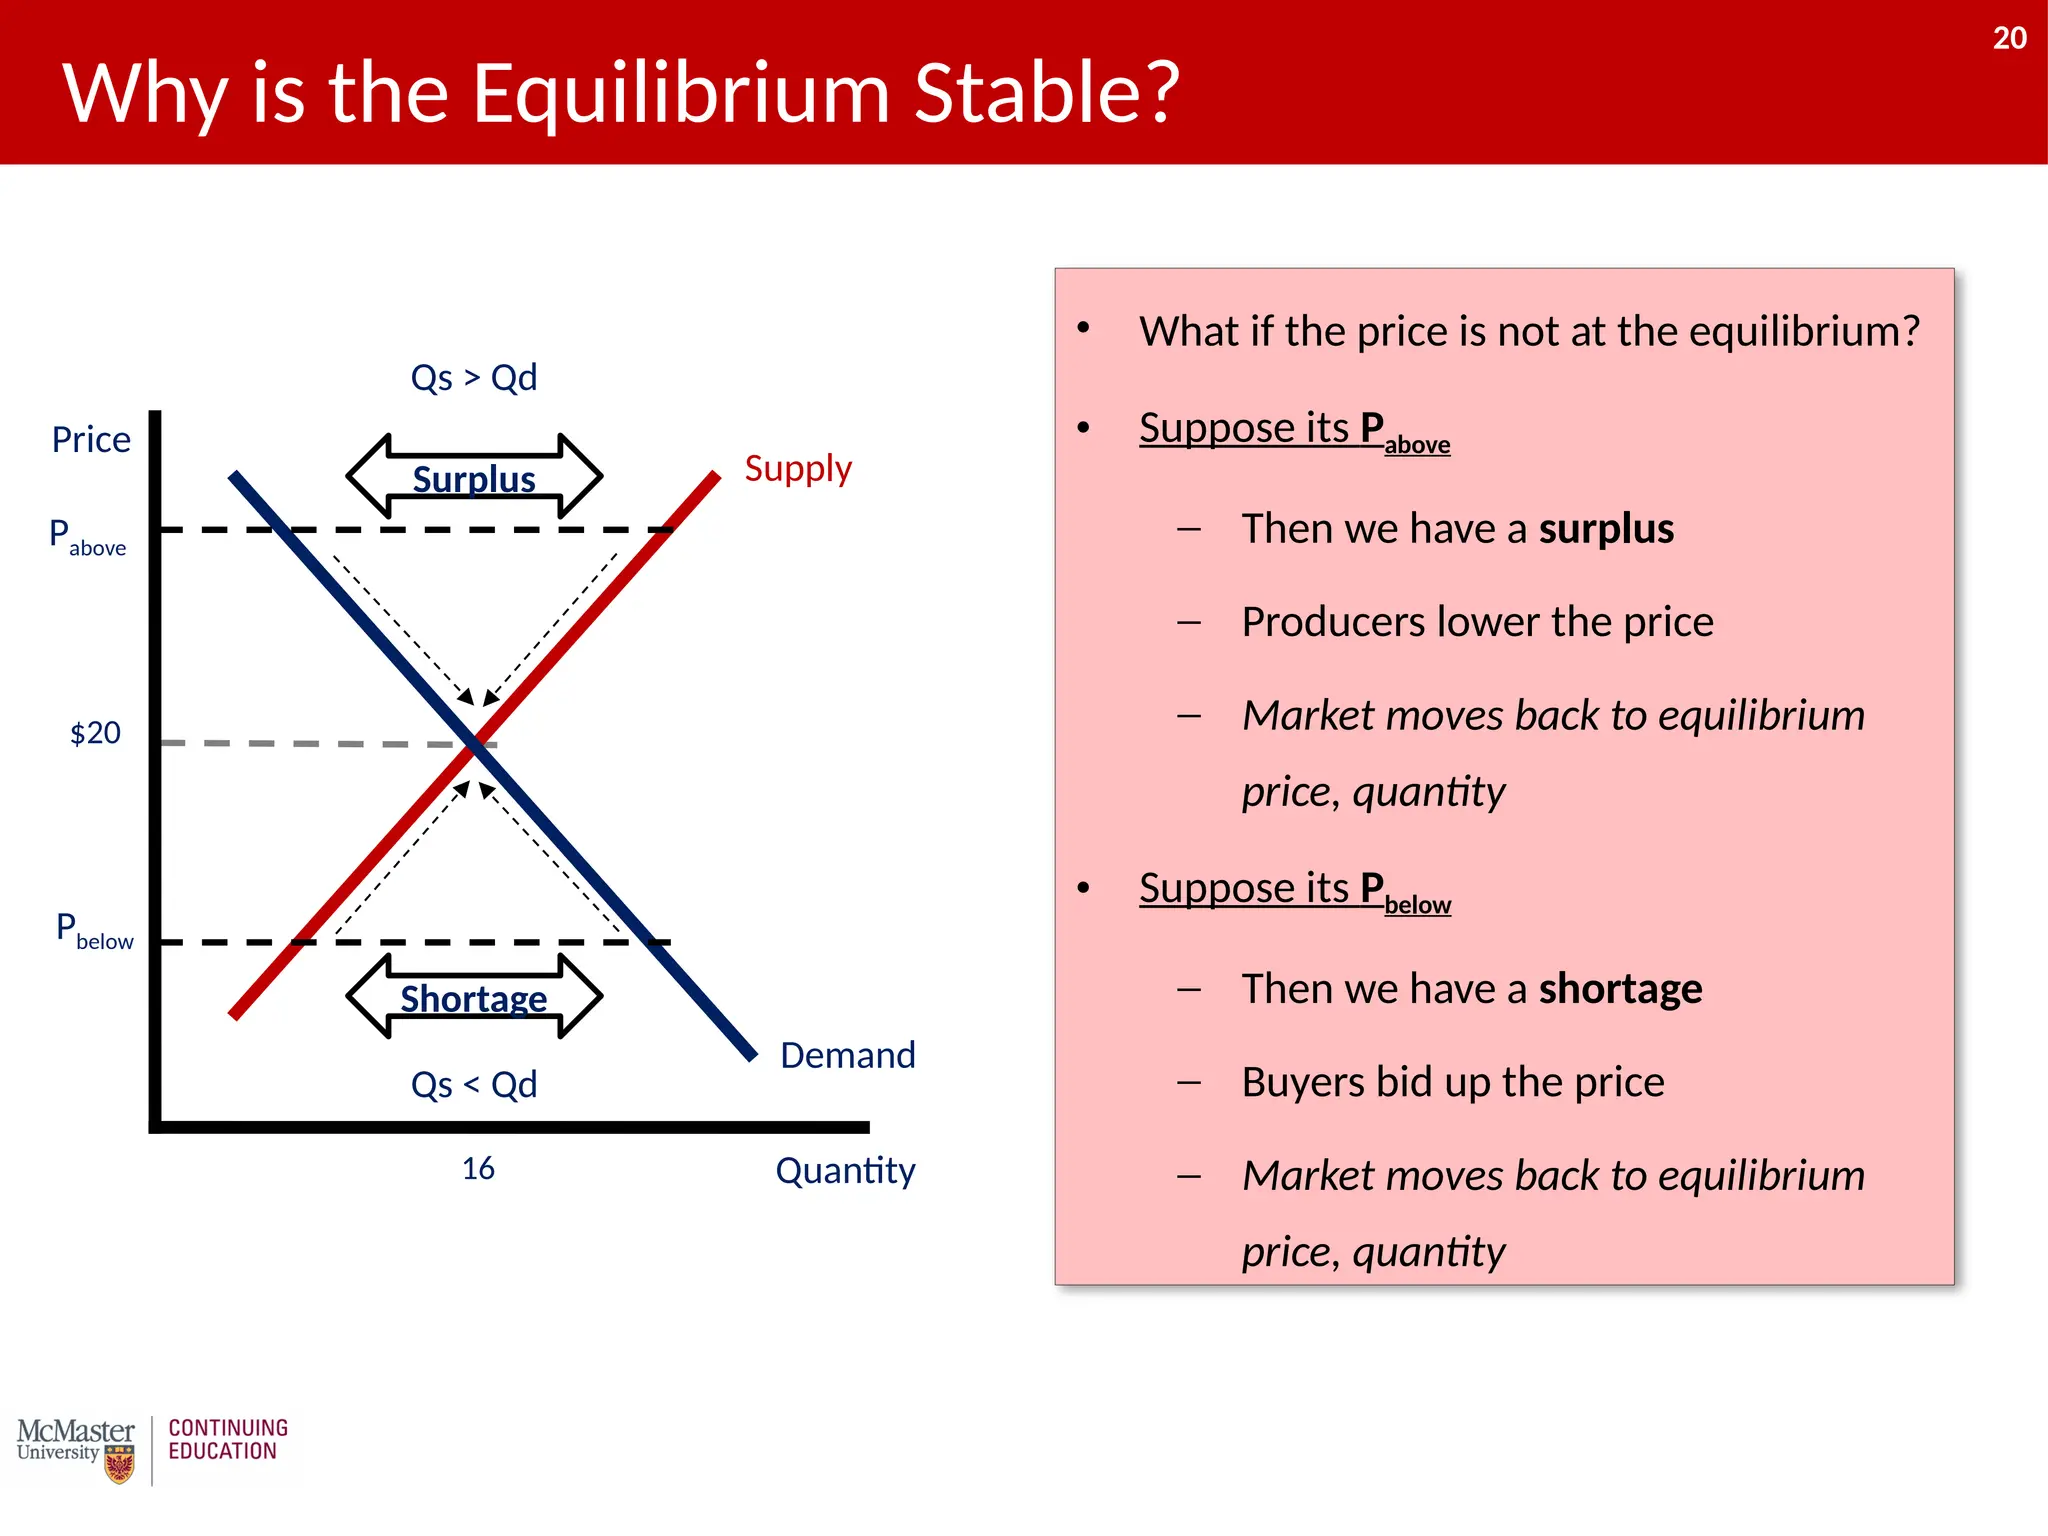
20
Why is theEquilibrium Stable?
• What if the price is not at the equilibrium?
• Suppose its Pabove
‒ Then we have a surplus
‒ Producers lower the price
‒ Market moves back to equilibrium
price, quantity
• Suppose its Pbelow
‒ Then we have a shortage
‒ Buyers bid up the price
‒ Market moves back to equilibrium
price, quantity
Demand
Supply
Price
Quantity
$20
16
Pabove
Pbelow
Surplus
Qs > Qd
Shortage
Qs < Qd
20
21.
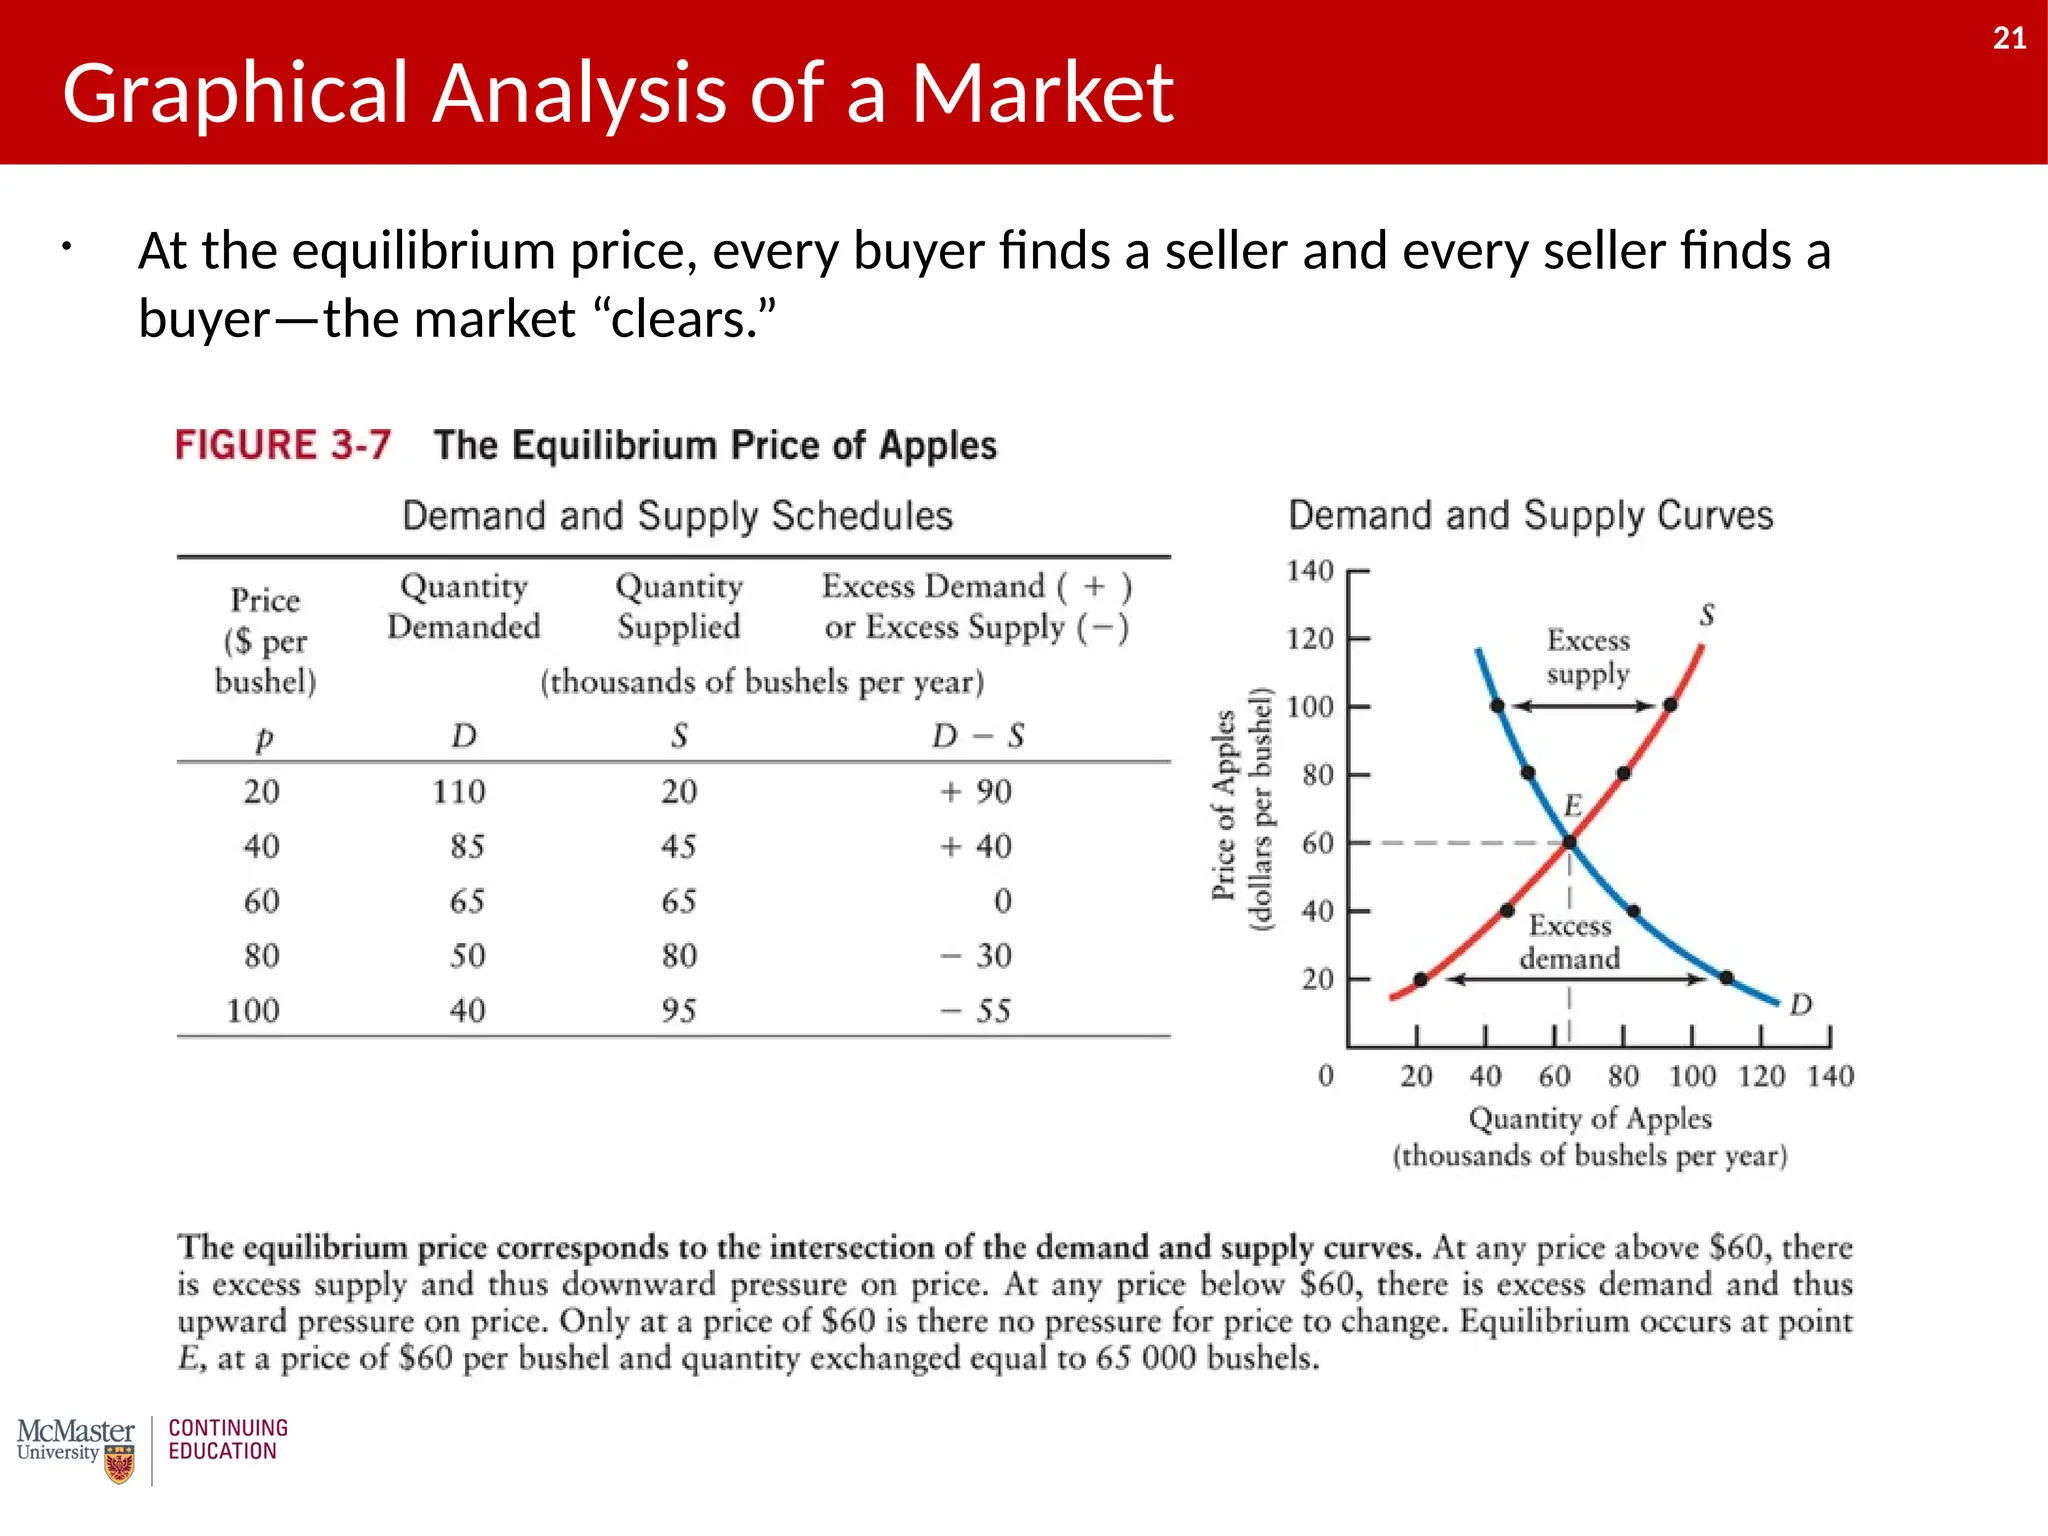
21
• At theequilibrium price, every buyer finds a seller and every seller finds a
buyer—the market “clears.”
Graphical Analysis of a Market
21
22.
22
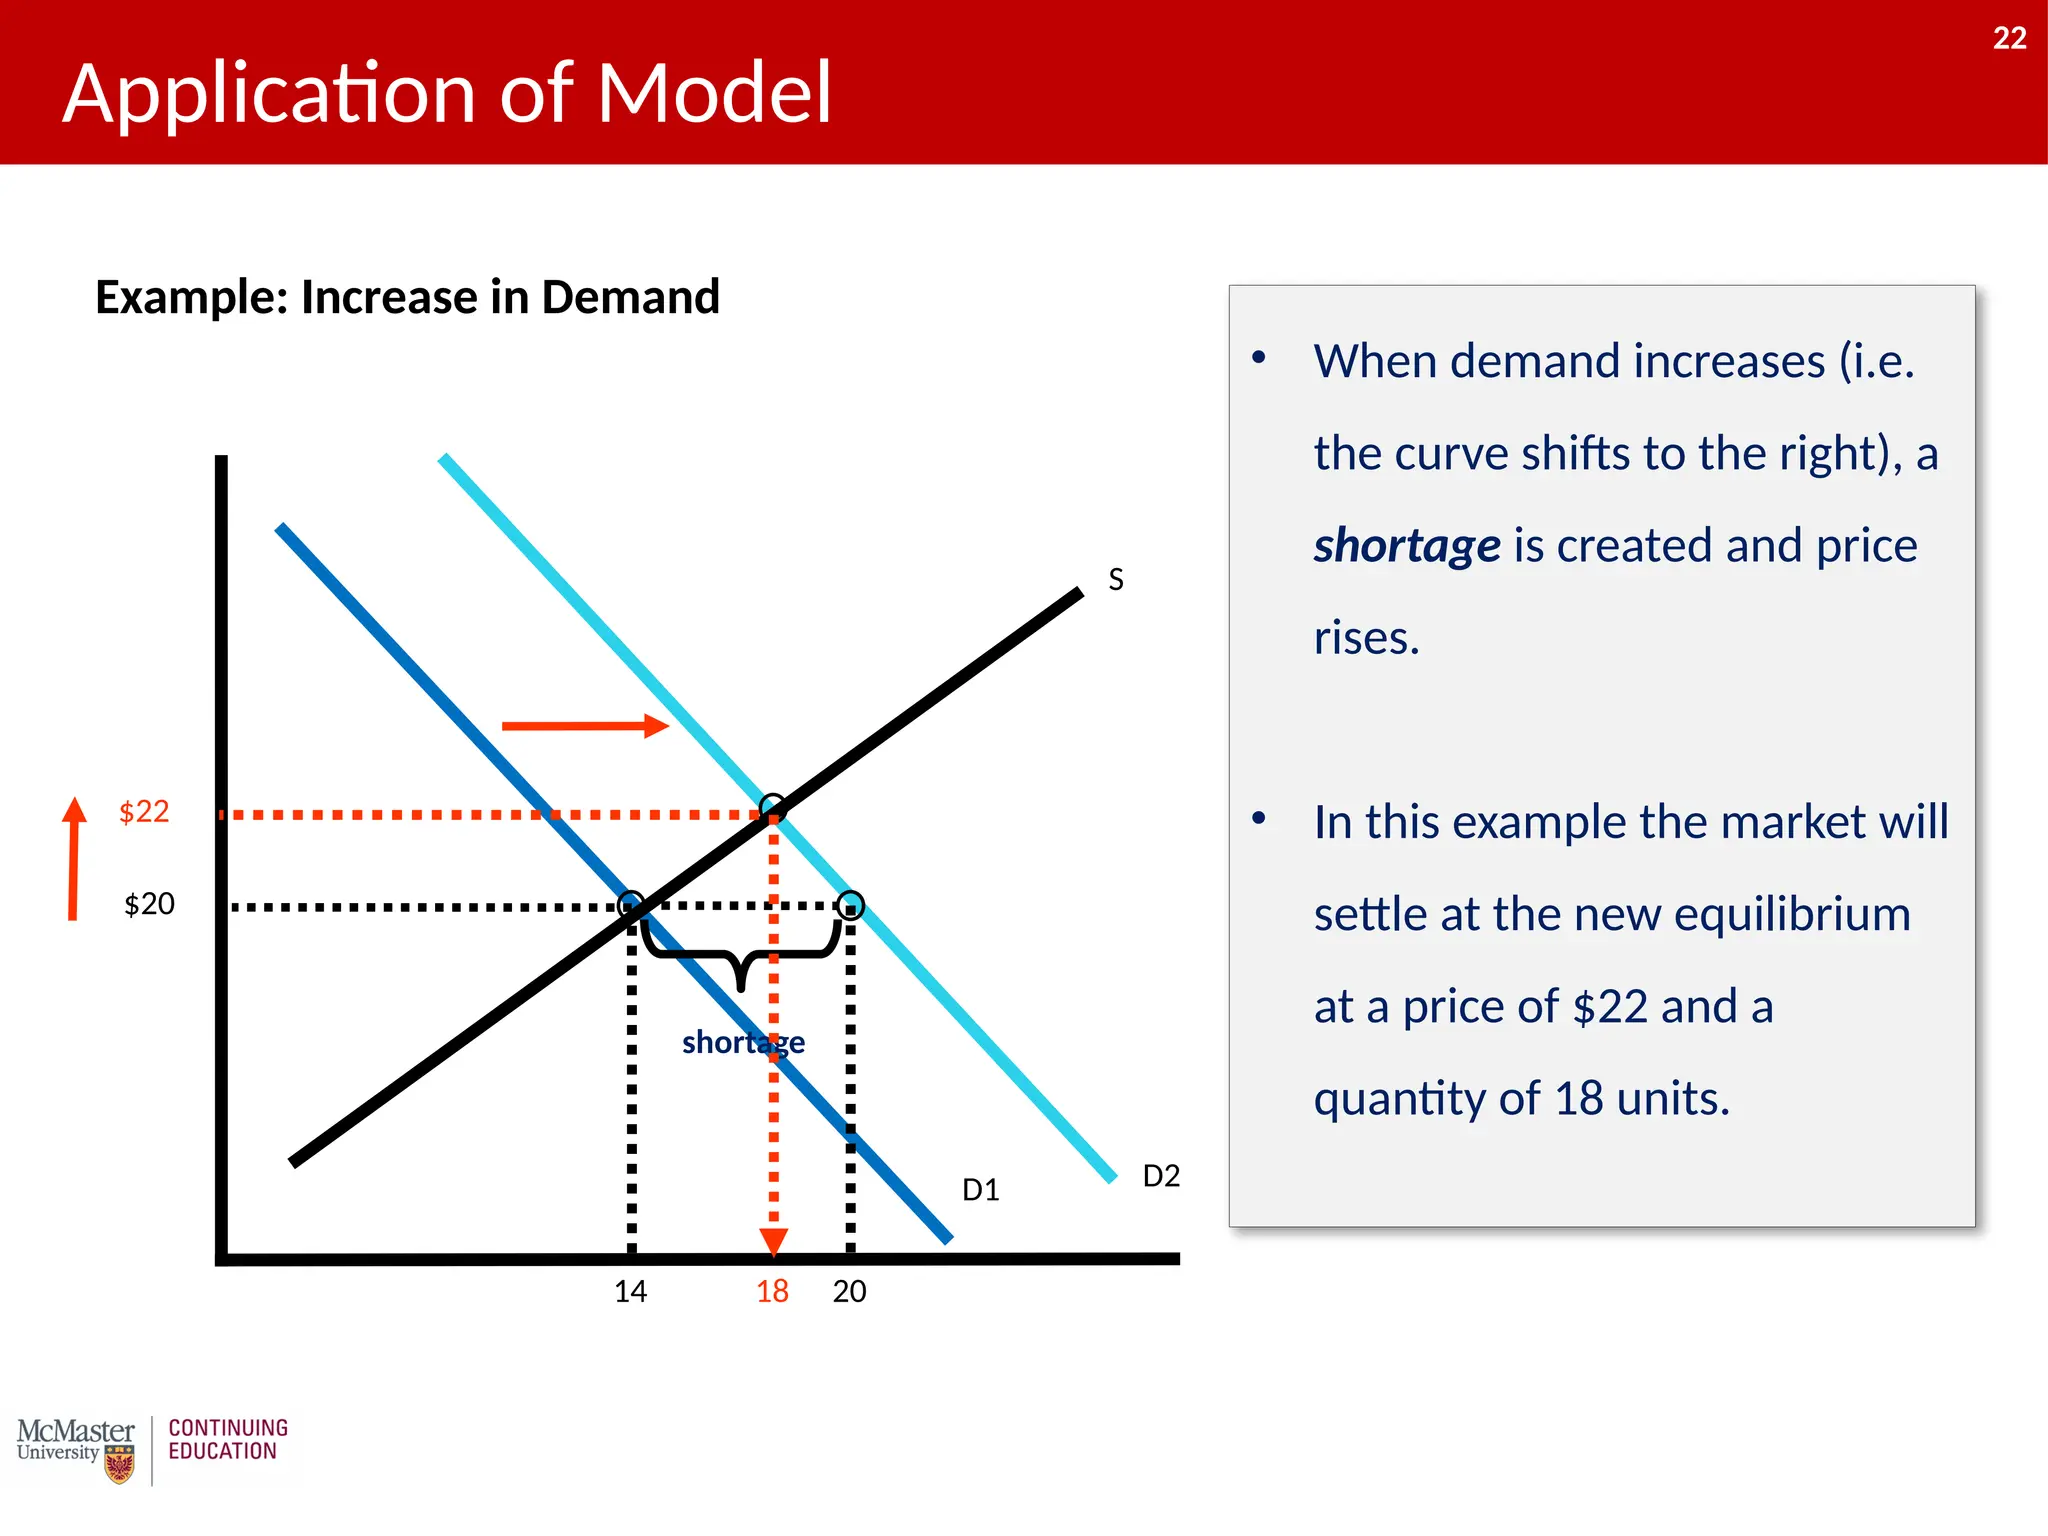
Application of Model
D2
14
S
D1
$20
20
shortage
•When demand increases (i.e.
the curve shifts to the right), a
shortage is created and price
rises.
• In this example the market will
settle at the new equilibrium
at a price of $22 and a
quantity of 18 units.
18
$22
Example: Increase in Demand
22
23.
23
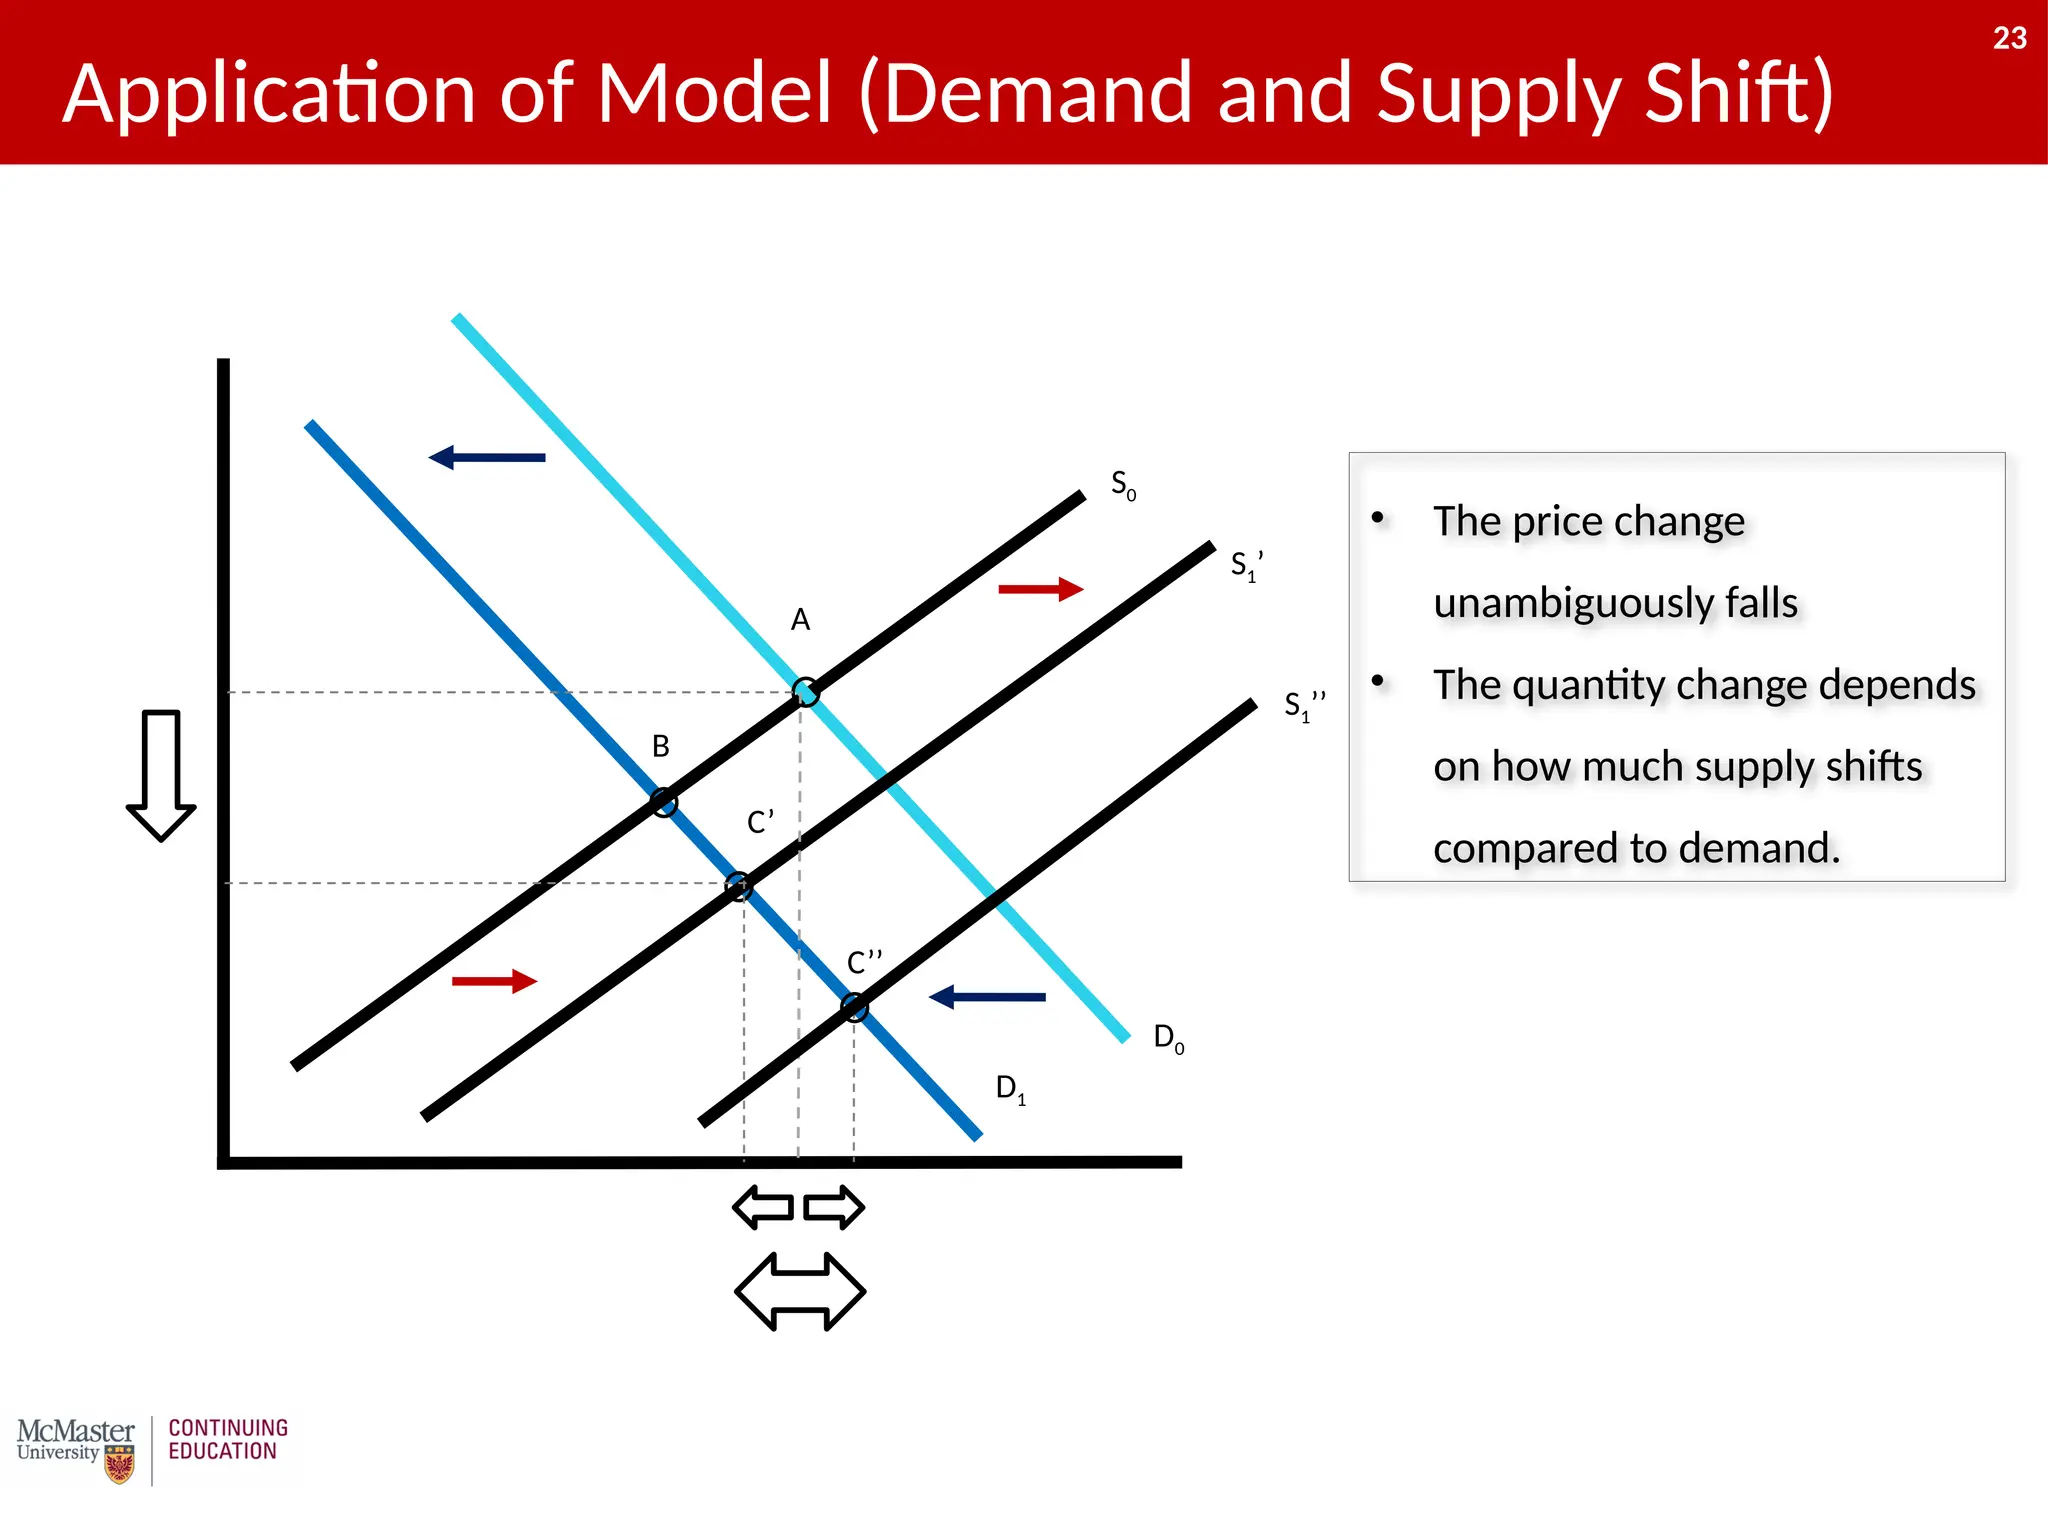
Application of Model(Demand and Supply Shift)
D1
S0
D0
S1’
?
A
B
C’
C’’
S1’’
• The price change
unambiguously falls
• The quantity change depends
on how much supply shifts
compared to demand.
23
24.
24
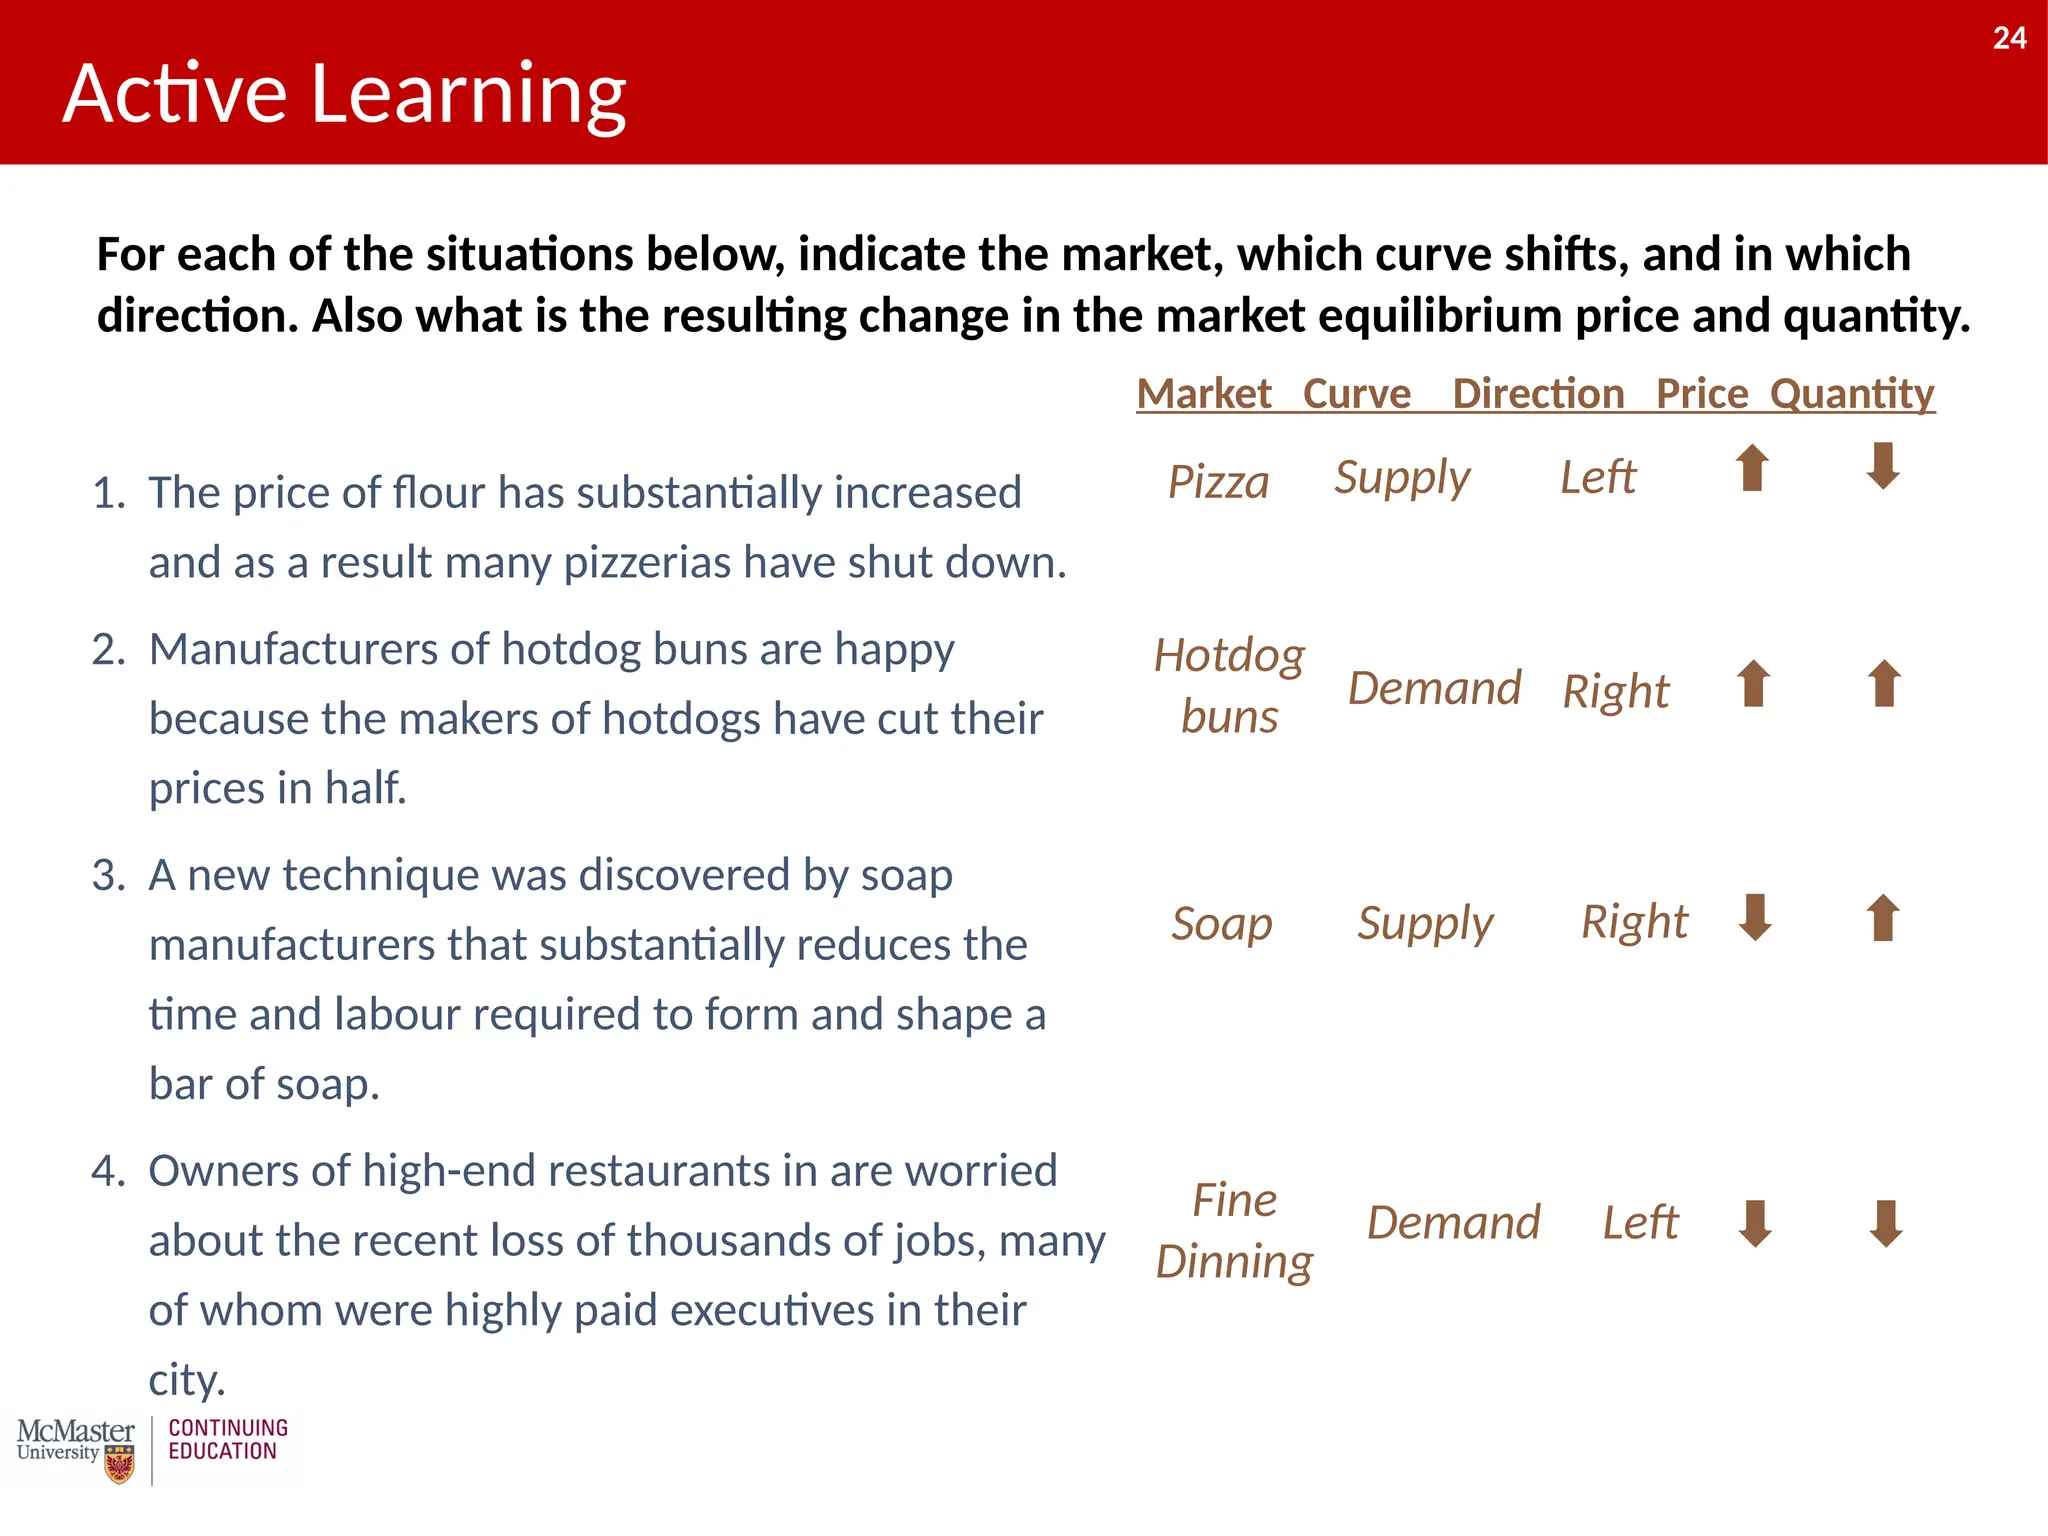
Active Learning
24
1. Theprice of flour has substantially increased
and as a result many pizzerias have shut down.
2. Manufacturers of hotdog buns are happy
because the makers of hotdogs have cut their
prices in half.
3. A new technique was discovered by soap
manufacturers that substantially reduces the
time and labour required to form and shape a
bar of soap.
4. Owners of high-end restaurants in are worried
about the recent loss of thousands of jobs, many
of whom were highly paid executives in their
city.
Market Curve Direction Price Quantity
Pizza Supply Left
Soap Supply Right
Hotdog
buns
Demand Right
Fine
Dinning
Demand Left
For each of the situations below, indicate the market, which curve shifts, and in which
direction. Also what is the resulting change in the market equilibrium price and quantity.
27
Next Week
• ReadChapter 3
• Practice questions for Chapter 3 Self Study (answers are posted)
• Complete self study quiz
• Read Chapter 4
• Email me if questions
– olearj@mcmaster.ca
27