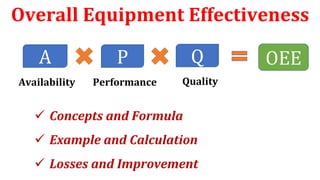
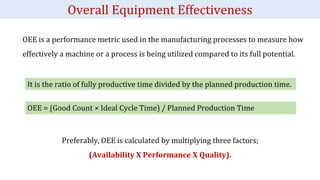
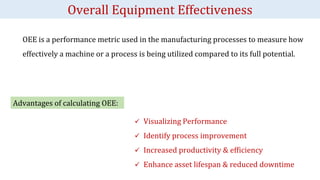
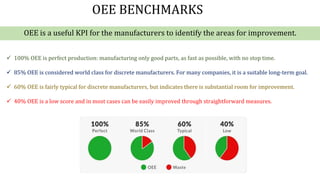
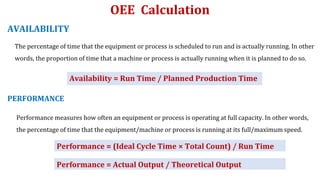
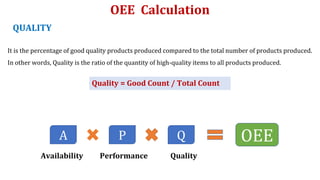
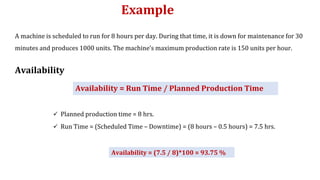
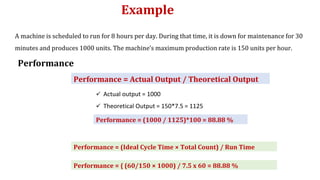
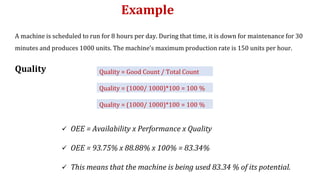
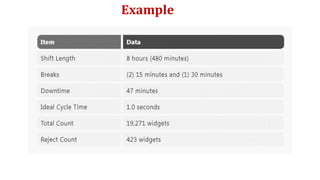
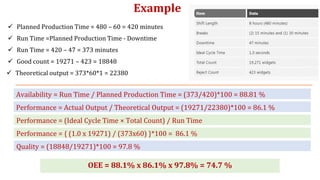
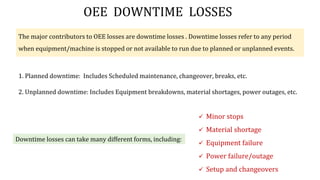
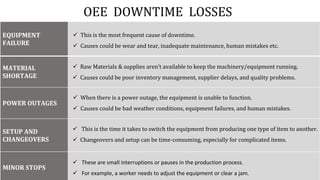
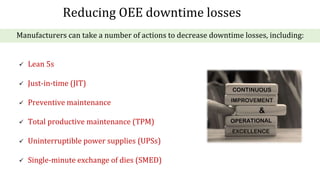
Overall Equipment Effectiveness
 Concepts and Formula
 Example and Calculation
 Losses and Improvement
A P Q OEE
Availability Quality
Performance
OEE is a performance metric used in the manufacturing processes to measure how
effectively a machine or a process is being utilized compared to its full potential.
Overall Equipment Effectiveness
It is the ratio of fully productive time divided by the planned production time.
OEE = (Good Count × Ideal Cycle Time) / Planned Production Time
Preferably, OEE is calculated by multiplying three factors;
(Availability X Performance X Quality).
OEE is a performance metric used in the manufacturing processes to measure how
effectively a machine or a process is being utilized compared to its full potential.
Overall Equipment Effectiveness
Advantages of calculating OEE:
 Visualizing Performance
 Identify process improvement
 Increased productivity & efficiency
 Enhance asset lifespan & reduced downtime
OEE is a useful KPI for the manufacturers to identify the areas for improvement.
OEE BENCHMARKS
 100% OEE is perfect production: manufacturing only good parts, as fast as possible, with no stop time.
 85% OEE is considered world class for discrete manufacturers. For many companies, it is a suitable long-term goal.
 60% OEE is fairly typical for discrete manufacturers, but indicates there is substantial room for improvement.
 40% OEE is a low score and in most cases can be easily improved through straightforward measures.
The percentage of time that the equipment or process is scheduled to run and is actually running. In other
words, the proportion of time that a machine or process is actually running when it is planned to do so.
Performance measures how often an equipment or process is operating at full capacity. In other words,
the percentage of time that the equipment/machine or process is running at its full/maximum speed.
OEE Calculation
AVAILABILITY
PERFORMANCE
Availability = Run Time / Planned Production Time
Performance = (Ideal Cycle Time × Total Count) / Run Time
Performance = Actual Output / Theoretical Output
It is the percentage of good quality products produced compared to the total number of products produced.
In other words, Quality is the ratio of the quantity of high-quality items to all products produced.
OEE Calculation
QUALITY
Quality = Good Count / Total Count
A P Q OEE
Availability Quality
Performance
A machine is scheduled to run for 8 hours per day. During that time, it is down for maintenance for 30
minutes and produces 1000 units. The machine’s maximum production rate is 150 units per hour.
 Run Time = (Scheduled Time – Downtime) = (8 hours – 0.5 hours) = 7.5 hrs.
Example
Availability
Availability = Run Time / Planned Production Time
 Planned production time = 8 hrs.
Availability = (7.5 / 8)*100 = 93.75 %
A machine is scheduled to run for 8 hours per day. During that time, it is down for maintenance for 30
minutes and produces 1000 units. The machine’s maximum production rate is 150 units per hour.
Example
Performance
Performance = Actual Output / Theoretical Output
 Actual output = 1000
 Theoretical Output = 150*7.5 = 1125
Performance = (1000 / 1125)*100 = 88.88 %
Performance = (Ideal Cycle Time × Total Count) / Run Time
Performance = { (60/150 × 1000) / 7.5 x 60 = 88.88 %
A machine is scheduled to run for 8 hours per day. During that time, it is down for maintenance for 30
minutes and produces 1000 units. The machine’s maximum production rate is 150 units per hour.
Example
 OEE = Availability x Performance x Quality
 OEE = 93.75% x 88.88% x 100% = 83.34%
 This means that the machine is being used 83.34 % of its potential.
Quality = Good Count / Total Count
Quality
Quality = (1000/ 1000)*100 = 100 %
Example
Example
 Planned Production Time = 480 – 60 = 420 minutes
 Run Time =Planned Production Time - Downtime
 Run Time = 420 – 47 = 373 minutes
 Good count = 19271 – 423 = 18848
Availability = Run Time / Planned Production Time = (373/420)*100 = 88.81 %
Performance = Actual Output / Theoretical Output = (19271/22380)*100 = 86.1 %
 Theoretical output = 373*60*1 = 22380
Performance = (Ideal Cycle Time × Total Count) / Run Time
Performance = { (1.0 x 19271) / (373x60) }*100 = 86.1 %
Quality = (18848/19271)*100 = 97.8 %
OEE = 88.1% x 86.1% x 97.8% = 74.7 %
1. Planned downtime: Includes Scheduled maintenance, changeover, breaks, etc.
2. Unplanned downtime: Includes Equipment breakdowns, material shortages, power outages, etc.
OEE DOWNTIME LOSSES
The major contributors to OEE losses are downtime losses . Downtime losses refer to any period
when equipment/machine is stopped or not available to run due to planned or unplanned events.
Downtime losses can take many different forms, including:
 Minor stops
 Material shortage
 Equipment failure
 Power failure/outage
 Setup and changeovers
EQUIPMENT
FAILURE
MATERIAL
SHORTAGE
POWER OUTAGES
SETUP AND
CHANGEOVERS
MINOR STOPS
 This is the most frequent cause of downtime.
 Causes could be wear and tear, inadequate maintenance, human mistakes etc.
 Raw Materials & supplies aren’t available to keep the machinery/equipment running.
 Causes could be poor inventory management, supplier delays, and quality problems.
 When there is a power outage, the equipment is unable to function.
 Causes could be bad weather conditions, equipment failures, and human mistakes.
 This is the time it takes to switch the equipment from producing one type of item to another.
 Changeovers and setup can be time-consuming, especially for complicated items.
 These are small interruptions or pauses in the production process.
 For example, a worker needs to adjust the equipment or clear a jam.
OEE DOWNTIME LOSSES
 Lean 5s
 Just-in-time (JIT)
 Preventive maintenance
 Total productive maintenance (TPM)
 Uninterruptible power supplies (UPSs)
 Single-minute exchange of dies (SMED)
Manufacturers can take a number of actions to decrease downtime losses, including:
Reducing OEE downtime losses
Or type “Overall equipment effectiveness (OEE) E-Concepts”
On you tube
https://youtu.be/C2iCnSCfbaE
For complete video explanation of this Ppt in
Hindi/Urdu, Click the below link

Overall Equipment Effectiveness, Complete Lecture.pptx

  • 1.
    Overall Equipment Effectiveness Concepts and Formula  Example and Calculation  Losses and Improvement A P Q OEE Availability Quality Performance
  • 2.
    OEE is aperformance metric used in the manufacturing processes to measure how effectively a machine or a process is being utilized compared to its full potential. Overall Equipment Effectiveness It is the ratio of fully productive time divided by the planned production time. OEE = (Good Count × Ideal Cycle Time) / Planned Production Time Preferably, OEE is calculated by multiplying three factors; (Availability X Performance X Quality).
  • 3.
    OEE is aperformance metric used in the manufacturing processes to measure how effectively a machine or a process is being utilized compared to its full potential. Overall Equipment Effectiveness Advantages of calculating OEE:  Visualizing Performance  Identify process improvement  Increased productivity & efficiency  Enhance asset lifespan & reduced downtime
  • 4.
    OEE is auseful KPI for the manufacturers to identify the areas for improvement. OEE BENCHMARKS  100% OEE is perfect production: manufacturing only good parts, as fast as possible, with no stop time.  85% OEE is considered world class for discrete manufacturers. For many companies, it is a suitable long-term goal.  60% OEE is fairly typical for discrete manufacturers, but indicates there is substantial room for improvement.  40% OEE is a low score and in most cases can be easily improved through straightforward measures.
  • 5.
    The percentage oftime that the equipment or process is scheduled to run and is actually running. In other words, the proportion of time that a machine or process is actually running when it is planned to do so. Performance measures how often an equipment or process is operating at full capacity. In other words, the percentage of time that the equipment/machine or process is running at its full/maximum speed. OEE Calculation AVAILABILITY PERFORMANCE Availability = Run Time / Planned Production Time Performance = (Ideal Cycle Time × Total Count) / Run Time Performance = Actual Output / Theoretical Output
  • 6.
    It is thepercentage of good quality products produced compared to the total number of products produced. In other words, Quality is the ratio of the quantity of high-quality items to all products produced. OEE Calculation QUALITY Quality = Good Count / Total Count A P Q OEE Availability Quality Performance
  • 7.
    A machine isscheduled to run for 8 hours per day. During that time, it is down for maintenance for 30 minutes and produces 1000 units. The machine’s maximum production rate is 150 units per hour.  Run Time = (Scheduled Time – Downtime) = (8 hours – 0.5 hours) = 7.5 hrs. Example Availability Availability = Run Time / Planned Production Time  Planned production time = 8 hrs. Availability = (7.5 / 8)*100 = 93.75 %
  • 8.
    A machine isscheduled to run for 8 hours per day. During that time, it is down for maintenance for 30 minutes and produces 1000 units. The machine’s maximum production rate is 150 units per hour. Example Performance Performance = Actual Output / Theoretical Output  Actual output = 1000  Theoretical Output = 150*7.5 = 1125 Performance = (1000 / 1125)*100 = 88.88 % Performance = (Ideal Cycle Time × Total Count) / Run Time Performance = { (60/150 × 1000) / 7.5 x 60 = 88.88 %
  • 9.
    A machine isscheduled to run for 8 hours per day. During that time, it is down for maintenance for 30 minutes and produces 1000 units. The machine’s maximum production rate is 150 units per hour. Example  OEE = Availability x Performance x Quality  OEE = 93.75% x 88.88% x 100% = 83.34%  This means that the machine is being used 83.34 % of its potential. Quality = Good Count / Total Count Quality Quality = (1000/ 1000)*100 = 100 % Quality = (1000/ 1000)*100 = 100 %
  • 10.
  • 11.
    Example  Planned ProductionTime = 480 – 60 = 420 minutes  Run Time =Planned Production Time - Downtime  Run Time = 420 – 47 = 373 minutes  Good count = 19271 – 423 = 18848 Availability = Run Time / Planned Production Time = (373/420)*100 = 88.81 % Performance = Actual Output / Theoretical Output = (19271/22380)*100 = 86.1 %  Theoretical output = 373*60*1 = 22380 Performance = (Ideal Cycle Time × Total Count) / Run Time Performance = { (1.0 x 19271) / (373x60) }*100 = 86.1 % Quality = (18848/19271)*100 = 97.8 % OEE = 88.1% x 86.1% x 97.8% = 74.7 %
  • 12.
    1. Planned downtime:Includes Scheduled maintenance, changeover, breaks, etc. 2. Unplanned downtime: Includes Equipment breakdowns, material shortages, power outages, etc. OEE DOWNTIME LOSSES The major contributors to OEE losses are downtime losses . Downtime losses refer to any period when equipment/machine is stopped or not available to run due to planned or unplanned events. Downtime losses can take many different forms, including:  Minor stops  Material shortage  Equipment failure  Power failure/outage  Setup and changeovers
  • 13.
    EQUIPMENT FAILURE MATERIAL SHORTAGE POWER OUTAGES SETUP AND CHANGEOVERS MINORSTOPS  This is the most frequent cause of downtime.  Causes could be wear and tear, inadequate maintenance, human mistakes etc.  Raw Materials & supplies aren’t available to keep the machinery/equipment running.  Causes could be poor inventory management, supplier delays, and quality problems.  When there is a power outage, the equipment is unable to function.  Causes could be bad weather conditions, equipment failures, and human mistakes.  This is the time it takes to switch the equipment from producing one type of item to another.  Changeovers and setup can be time-consuming, especially for complicated items.  These are small interruptions or pauses in the production process.  For example, a worker needs to adjust the equipment or clear a jam. OEE DOWNTIME LOSSES
  • 14.
     Lean 5s Just-in-time (JIT)  Preventive maintenance  Total productive maintenance (TPM)  Uninterruptible power supplies (UPSs)  Single-minute exchange of dies (SMED) Manufacturers can take a number of actions to decrease downtime losses, including: Reducing OEE downtime losses
  • 15.
    Or type “Overallequipment effectiveness (OEE) E-Concepts” On you tube https://youtu.be/C2iCnSCfbaE For complete video explanation of this Ppt in Hindi/Urdu, Click the below link