Download as PDF, PPTX


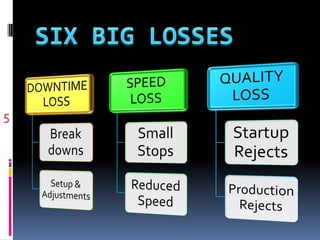
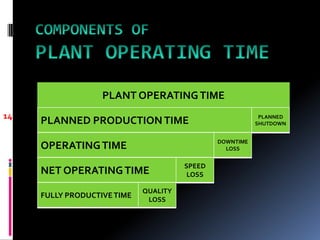
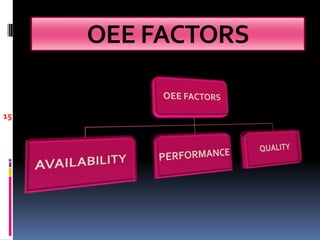
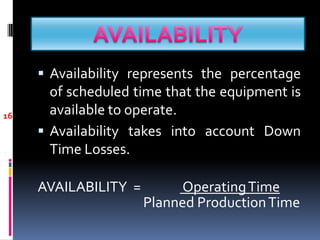
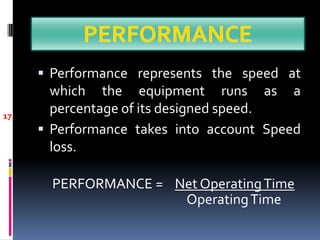
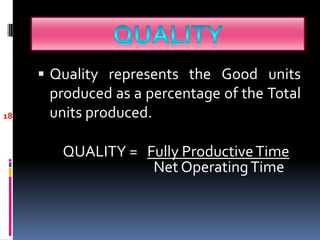
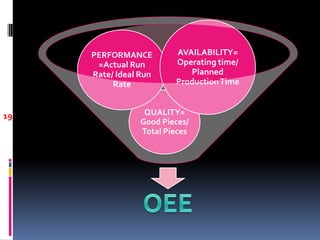
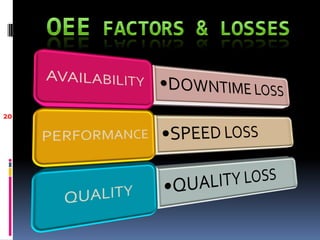
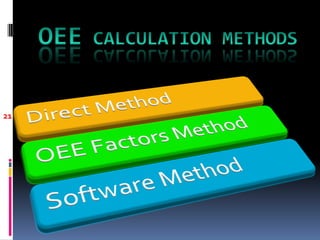
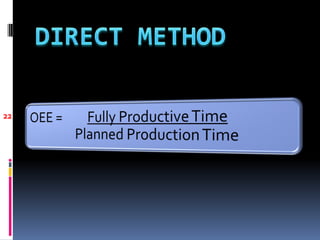
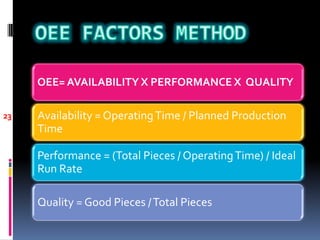

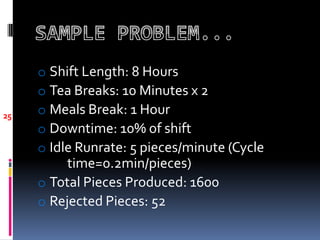
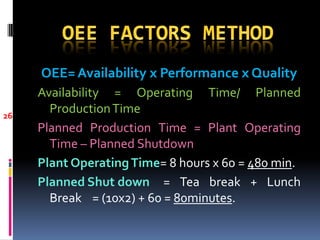
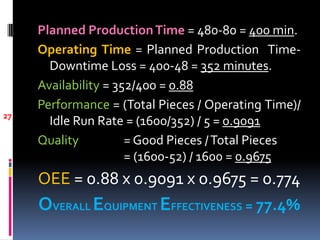
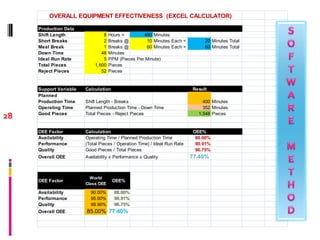

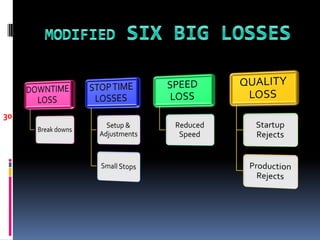
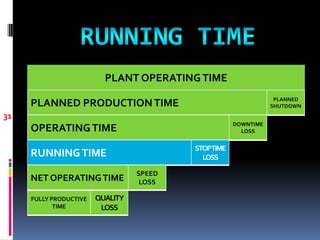
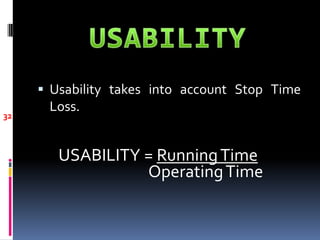
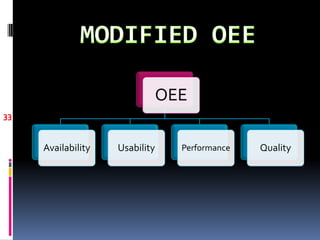
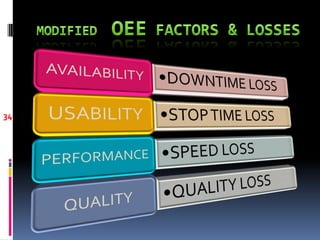
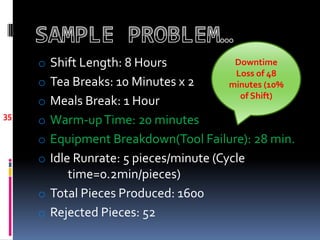
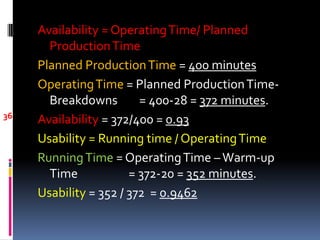
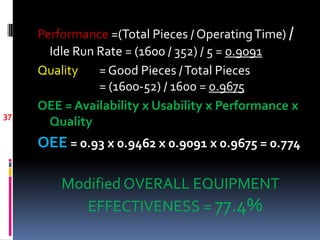


The document discusses overall equipment effectiveness (OEE) and its calculation. It defines OEE as the product of availability, performance, and quality. Availability accounts for downtime losses. Performance considers speed losses. Quality looks at good units produced. The document provides an example calculation of OEE for a machine with a 77.4% effectiveness rate. It also modifies the OEE calculation to include usability which accounts for stop time losses.


![Getting Started with Apache Spark: Big Data Made Simple [Free Meetup]](https://cdn.slidesharecdn.com/ss_thumbnails/apachesparkgettingstarted-260203175547-8361bcc3-thumbnail.jpg?width=640&height=640&fit=bounds)
