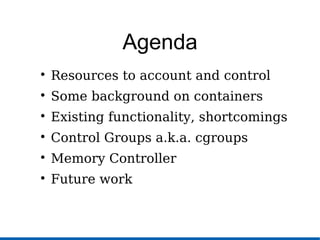
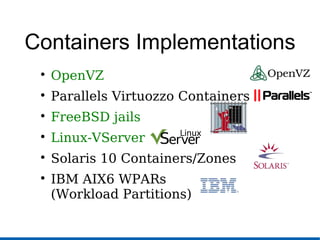
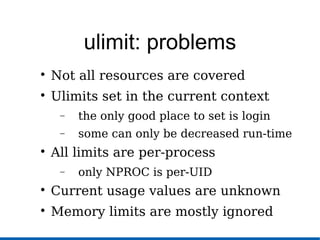
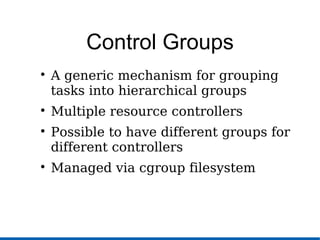
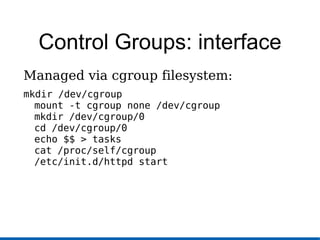
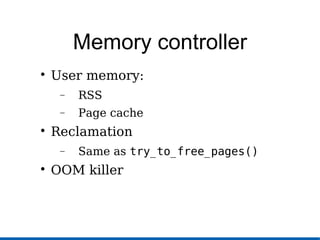
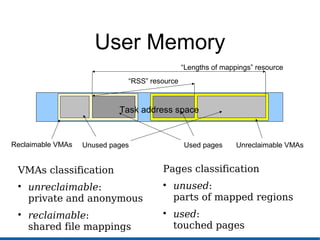
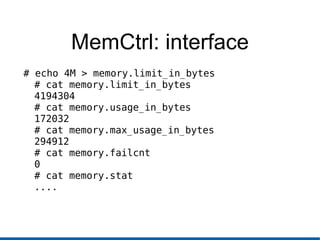
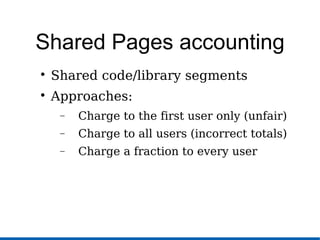
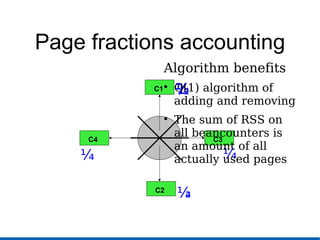
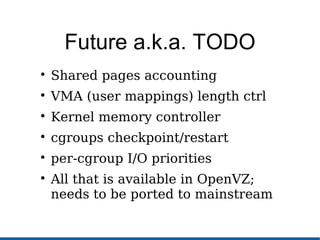
This document discusses recent advances in Linux kernel resource management through control groups (cgroups). It provides background on containers and their implementation, outlines existing resource management mechanisms and their shortcomings, and describes how cgroups provide a generic mechanism for grouping tasks and controlling their access to resources like CPU, memory, disk I/O through hierarchical groups and controllers. Specifically, it details the memory controller for cgroups which accounts for and reclaims user memory and triggers the OOM killer if limits are exceeded. Future work is needed to improve accounting of shared memory and implement other resource controllers.
A summary of available MongoDB backup options. We manage backup for hundreds of MongoDB servers at scalegrid.io and we have learnt a few things along the way.
For the first time this year, 10gen will be offering a track completely dedicated to Operations at MongoSV, 10gen's annual MongoDB user conference on December 4. Learn more at MongoSV.com
Come learn about the different ways to back up your single servers, replica sets, and sharded clusters
This talk is about a new interface to get information about processes, called task_diag, which we developed.
Currently /proc file system is used to get information about the processes running on the system. All information are presented as text files, which is convenient for humans, but not for programs such as ps and top. This incurs significant delays, especially on a systems with lots of containers running, which is frequently the case nowdays.
Ideally, tools such top and ps would get information in binary format, and use flexible means to specify which kinds of information and for which tasks is required. Presented is a new interface with all these features, called task_diag.
task_diag is based on netlink sockets and looks like socket-diag, which is used to get information about sockets. It uses the request-response model. An request specifies a set of processes and required properties for them. A response contains requested information and can be divided into a few netlink packets if it's too long.
The task diag is much faster than the /proc file system. For example, when reading from /proc, ps opens, reads, and closes many files -- and iterates this for every single processes. With task_diag, it's just sending a request and getting a response.
Except for ps and top, the proposed interface is to be used by CRIU, a containers checkpoint/restore and live migration mechanism. Also, developers of perf tool found that it can be useful to them and implemented a prototype which show a big performance improvements in case of using task_diag instead of procfs.
Our performance measurements show that the ps tool works at least four times faster if task_diag is used instead of procfs.
OSDC 2012 | Extremes Wolken Dateisystem!? by Dr. Udo SeidelNETWAYS
So-Called shared file systems have been known in the Unix / Linux-environment for a long time. The network-based and cluster data systems are thereby almost an old hat. The project XtreemFS– a part of the grid operating system XtreemOS – is a quite new but budded alternative in this field. The current version finally has some important features and is worth taking a closer look.
This presentation gives an insight into the data systems approaches, explains the architecture and describes the first steps of a XtreemFS-Cluster set-up.
Linux memory consumption - Why memory utilities show a little amount of free RAM? How does Linux kernel utilizes free RAM? What is the real amount of free RAM in the system?
The current Linux kernel /proc/PID interface is great, time-proven and reliable way to get info about processes running on a system. Right? Well, yes and no. We found out (and you, too, might have noticed it) this is what makes ps and top slow when there are thousands of processes running. Besides the speed, there are a number of other problems with the current /proc/PID interface.
The talk describes all those in great details, then goes on to the alternative we are proposing for inclusion to the kernel, a new interface called task_diag. The new interface is slick, fast (5-10x speed improvement), and extendable.
"An Elephan can't jump. But can carry heavy load".
Besides Facebook and Yahoo!, many other organizations are using Hadoop to run large distributed computations: Amazon.com, Apple, eBay, IBM, ImageShack, LinkedIn, Microsoft, Twitter, The New York Times...
Seastore: Next Generation Backing Store for CephScyllaDB
Ceph is an open source distributed file system addressing file, block, and object storage use cases. Next generation storage devices require a change in strategy, so the community has been developing crimson-osd, an eventual replacement for ceph-osd intended to minimize cpu overhead and improve throughput and latency. Seastore is a new backing store for crimson-osd targeted at emerging storage technologies including persistent memory and ZNS devices.
This document explains how to use docker container in Ubuntu 14.04 VM for trying out cgroups without actually using the host/guest operating system. It talks about using 'cpu' subcomponent and demostrates the effect of process isolation by 'htop' utility.
The docker containers are very effective way of trying out things by launching a container using standard/custom docker image from docker hub or your own image repository.
Linux Performance Analysis: New Tools and Old SecretsBrendan Gregg
Talk for USENIX/LISA2014 by Brendan Gregg, Netflix. At Netflix performance is crucial, and we use many high to low level tools to analyze our stack in different ways. In this talk, I will introduce new system observability tools we are using at Netflix, which I've ported from my DTraceToolkit, and are intended for our Linux 3.2 cloud instances. These show that Linux can do more than you may think, by using creative hacks and workarounds with existing kernel features (ftrace, perf_events). While these are solving issues on current versions of Linux, I'll also briefly summarize the future in this space: eBPF, ktap, SystemTap, sysdig, etc.
Talk for PerconaLive 2016 by Brendan Gregg. Video: https://www.youtube.com/watch?v=CbmEDXq7es0 . "Systems performance provides a different perspective for analysis and tuning, and can help you find performance wins for your databases, applications, and the kernel. However, most of us are not performance or kernel engineers, and have limited time to study this topic. This talk summarizes six important areas of Linux systems performance in 50 minutes: observability tools, methodologies, benchmarking, profiling, tracing, and tuning. Included are recipes for Linux performance analysis and tuning (using vmstat, mpstat, iostat, etc), overviews of complex areas including profiling (perf_events), static tracing (tracepoints), and dynamic tracing (kprobes, uprobes), and much advice about what is and isn't important to learn. This talk is aimed at everyone: DBAs, developers, operations, etc, and in any environment running Linux, bare-metal or the cloud."
Broken benchmarks, misleading metrics, and terrible tools. This talk will help you navigate the treacherous waters of Linux performance tools, touring common problems with system tools, metrics, statistics, visualizations, measurement overhead, and benchmarks. You might discover that tools you have been using for years, are in fact, misleading, dangerous, or broken.
The speaker, Brendan Gregg, has given many talks on tools that work, including giving the Linux PerformanceTools talk originally at SCALE. This is an anti-version of that talk, to focus on broken tools and metrics instead of the working ones. Metrics can be misleading, and counters can be counter-intuitive! This talk will include advice for verifying new performance tools, understanding how they work, and using them successfully.
Video: https://www.youtube.com/watch?v=JRFNIKUROPE . Talk for linux.conf.au 2017 (LCA2017) by Brendan Gregg, about Linux enhanced BPF (eBPF). Abstract:
A world of new capabilities is emerging for the Linux 4.x series, thanks to enhancements that have been included in Linux for to Berkeley Packet Filter (BPF): an in-kernel virtual machine that can execute user space-defined programs. It is finding uses for security auditing and enforcement, enhancing networking (including eXpress Data Path), and performance observability and troubleshooting. Many new open source tools that have been written in the past 12 months for performance analysis that use BPF. Tracing superpowers have finally arrived for Linux!
For its use with tracing, BPF provides the programmable capabilities to the existing tracing frameworks: kprobes, uprobes, and tracepoints. In particular, BPF allows timestamps to be recorded and compared from custom events, allowing latency to be studied in many new places: kernel and application internals. It also allows data to be efficiently summarized in-kernel, including as histograms. This has allowed dozens of new observability tools to be developed so far, including measuring latency distributions for file system I/O and run queue latency, printing details of storage device I/O and TCP retransmits, investigating blocked stack traces and memory leaks, and a whole lot more.
This talk will summarize BPF capabilities and use cases so far, and then focus on its use to enhance Linux tracing, especially with the open source bcc collection. bcc includes BPF versions of old classics, and many new tools, including execsnoop, opensnoop, funcccount, ext4slower, and more (many of which I developed). Perhaps you'd like to develop new tools, or use the existing tools to find performance wins large and small, especially when instrumenting areas that previously had zero visibility. I'll also summarize how we intend to use these new capabilities to enhance systems analysis at Netflix.
Video: https://www.youtube.com/watch?v=FJW8nGV4jxY and https://www.youtube.com/watch?v=zrr2nUln9Kk . Tutorial slides for O'Reilly Velocity SC 2015, by Brendan Gregg.
There are many performance tools nowadays for Linux, but how do they all fit together, and when do we use them? This tutorial explains methodologies for using these tools, and provides a tour of four tool types: observability, benchmarking, tuning, and static tuning. Many tools will be discussed, including top, iostat, tcpdump, sar, perf_events, ftrace, SystemTap, sysdig, and others, as well observability frameworks in the Linux kernel: PMCs, tracepoints, kprobes, and uprobes.
This tutorial is updated and extended on an earlier talk that summarizes the Linux performance tool landscape. The value of this tutorial is not just learning that these tools exist and what they do, but hearing when and how they are used by a performance engineer to solve real world problems — important context that is typically not included in the standard documentation.
Talk for SCaLE13x. Video: https://www.youtube.com/watch?v=_Ik8oiQvWgo . Profiling can show what your Linux kernel and appliacations are doing in detail, across all software stack layers. This talk shows how we are using Linux perf_events (aka "perf") and flame graphs at Netflix to understand CPU usage in detail, to optimize our cloud usage, solve performance issues, and identify regressions. This will be more than just an intro: profiling difficult targets, including Java and Node.js, will be covered, which includes ways to resolve JITed symbols and broken stacks. Included are the easy examples, the hard, and the cutting edge.
Anatomy of a Container: Namespaces, cgroups & Some Filesystem Magic - LinuxConJérôme Petazzoni
Containers are everywhere. But what exactly is a container? What are they made from? What's the difference between LXC, butts-nspawn, Docker, and the other container systems out there? And why should we bother about specific filesystems?
In this talk, Jérôme will show the individual roles and behaviors of the components making up a container: namespaces, control groups, and copy-on-write systems. Then, he will use them to assemble a container from scratch, and highlight the differences (and likelinesses) with existing container systems.
Advanced cgroups and namespaces
This talk picks up where we left off in the previous cgroups and namespaces talk and dive in even deeper!
Agenda:
* cgroups v2 design (cgroup v2 was started to be merged in the current kernel, 4.4)
* cgroups v2 examples (migrating tasks, enabling and disabling controllers, and more).
* comparison between cgroup v2 unified hierarchy and cgroup v1 legacy hierarchy.
* PIDs namespaces (from kernel 4.3)
* cgroup namespaces (not merged yet)
Алексей Лесовский "Тюнинг Linux для баз данных. "Tanya Denisyuk
В любом проекте всегда есть данные которые важно не потерять. И если проект перешагнул размеры домашнего, то наверняка там уже используется что-то более надежное чем текстовые файлы на диске. Скорее всего это какая-то конкретная база данных. Учитывая важную роль баз данных к ним предъявляют жесткие требования производительности и стабильности. Отдельной особенностью является и операционная система на которой работает база данных. Опыт и практика подсказывает что это будет Linux - одна из наиболее популярных на сегодняшний день операционных систем. Прогрессивное развитие в сочетании с гибкостью и стабильностью делает Linux хорошим кандидатом в качестве платформы для баз данных (да и не только). Однако настройки по-умолчанию в большинстве дистрибутивов предназначены для широкого круга задач и потребностей. В этом докладе я расскажу о том, на какие настройки следует обратить внимание и как они влияют на работу СУБД. Как сделать работу СУБД более предсказуемой, как в простых условиях, так и в условиях непостоянной или растущей нагрузки.
This presentation provides a basic overview of Ceph, upon which SUSE Storage is based. It discusses the various factors and trade-offs that affect the performance and other functional and non-functional properties of a software-defined storage (SDS) environment.
Controlling Memory Footprint at All Layers: Linux Kernel, Applications, Libra...peknap
Reducing memory usage is well covered in the history of this conference, yet new tricks still do exist. When optimizing memory footprint for an home gateway device, the author found some unexpected places where small changes can save valuable amount of DRAM or Flash space. This talk will visit different areas including - Kernel: fragmentation threshold, page frame reclamation task and atomic memory. Application level: Memory inefficient shared libraries due to ABI compliance and dynamic loading. Toolchain: Tuning malloc allocator parameters and compiler options. System level: General kernel might be more memory efficient than MMU-less uClinux, and preventing lock up when the system is on the brink of running out of memory.
Introduction to OS LEVEL Virtualization & ContainersVaibhav Sharma
This Presentation contains information about os level virtualization and Containers internals. It has used other material on slide share which is referenced in Notes of PPT
Making distributed storage easy: usability in Ceph Luminous and beyondSage Weil
Distributed storage is complicated, and historically Ceph hasn't spent a lot of time trying to hide that complexity, instead focusing on correctness, features, and flexibility. There has been a recent shift in focus to simplifying and streamlining the user/operator experience so that the information that is actually important is available without the noise of irrelevant details. Recent feature work has also focused on simplifying configurations that were previously possible but required tedious configuration steps to manage.
This talk will cover the key new efforts in Ceph Luminous that aim to simplify and automate cluster management, as well as the plans for upcoming releases to address longstanding Cephisms that make it "hard" (e.g., choosing PG counts).
Optimizing Servers for High-Throughput and Low-Latency at DropboxScyllaDB
I'm going to discuss the efficiency/performance optimizations of different layers of the system. Starting from the lowest levels like hardware and drivers: these tunings can be applied to pretty much any high-load server. Then we’ll move to Linux kernel and its TCP/IP stack: these are the knobs you want to try on any of your TCP-heavy boxes. Finally, we’ll discuss library and application-level tunings, which are mostly applicable to HTTP servers in general and nginx/envoy specifically.
For each potential area of optimization I’ll try to give some background on latency/throughput tradeoffs (if any), monitoring guidelines, and, finally, suggest tunings for different workloads.
Also, I'll cover more theoretical approaches to performance analysis and the newly developed tooling like `bpftrace` and new `perf` features.
How to improve the network of Docker? How to integrate with OpenVSwitch? How to apply more fine-grained QoS limitation and monitor the resource usage of containers? How to improve Docker in non-intrusive ways? This slides shared by Li Yulai, the Chief Architect of SpeedyCloud, is to answer questions above. Visit http://www.speedycloud.cn to find out more.
Live migrating a container: pros, cons and gotchas -- Pavel EmelyanovOpenVZ
Live migrating a container: pros, cons and gotchas
Monday, November 16 • 17:20 - 18:05
Pavel Emelyanov
Principal Engineer, Odin
Principal engineer at Odin Server Virtualization team, creator and maintainer of the CRIU project. Joined Parallels in 2004 as junior Linux kernel developer, later became kernel team leader. Now works on architecture of the Odin Server products. | | Pavel tweets at @xemulp.
http://dockerconeu2015.sched.org/event/62e6d2ea7380442a48fafaeee26c9842
В своей презентации мы на примере дистрибутива Linux расскажем об опыте организации процесса тестирования продукта, существенная часть (более 90%) кода которого создается независимыми от компании разработчиками.
https://www.youtube.com/watch?v=AstgrnE7_dI
Управление ресурсами в Linux и OpenVZ Кирилл Колышкин kir@openvz.org http://openvz.org/
Отчет - http://yourcmc.ru/wiki/RootConf_2009:_%D0%9E%D1%82%D1%87%D1%91%D1%82_%D0%92%D0%B8%D1%82%D0%B0%D0%BB%D0%B8%D1%8F_%D0%A4%D0%B8%D0%BB%D0%B8%D0%BF%D0%BF%D0%BE%D0%B2%D0%B0#.D0.A3.D0.BF.D1.80.D0.B0.D0.B2.D0.BB.D0.B5.D0.BD.D0.B8.D0.B5_.D1.80.D0.B5.D1.81.D1.83.D1.80.D1.81.D0.B0.D0.BC.D0.B8_.D0.B2_Linux_.D0.B8_OpenVZ_.28.D0.B7.D0.B0.D1.87.D1.91.D1.82.21.29
Why React Native as a Strategic Advantage for Startup Innovation.pdfayushiqss
Do you know that React Native is being increasingly adopted by startups as well as big companies in the mobile app development industry? Big names like Facebook, Instagram, and Pinterest have already integrated this robust open-source framework.
In fact, according to a report by Statista, the number of React Native developers has been steadily increasing over the years, reaching an estimated 1.9 million by the end of 2024. This means that the demand for this framework in the job market has been growing making it a valuable skill.
But what makes React Native so popular for mobile application development? It offers excellent cross-platform capabilities among other benefits. This way, with React Native, developers can write code once and run it on both iOS and Android devices thus saving time and resources leading to shorter development cycles hence faster time-to-market for your app.
Let’s take the example of a startup, which wanted to release their app on both iOS and Android at once. Through the use of React Native they managed to create an app and bring it into the market within a very short period. This helped them gain an advantage over their competitors because they had access to a large user base who were able to generate revenue quickly for them.
Into the Box Keynote Day 2: Unveiling amazing updates and announcements for modern CFML developers! Get ready for exciting releases and updates on Ortus tools and products. Stay tuned for cutting-edge innovations designed to boost your productivity.
SOCRadar Research Team: Latest Activities of IntelBrokerSOCRadar
The European Union Agency for Law Enforcement Cooperation (Europol) has suffered an alleged data breach after a notorious threat actor claimed to have exfiltrated data from its systems. Infamous data leaker IntelBroker posted on the even more infamous BreachForums hacking forum, saying that Europol suffered a data breach this month.
The alleged breach affected Europol agencies CCSE, EC3, Europol Platform for Experts, Law Enforcement Forum, and SIRIUS. Infiltration of these entities can disrupt ongoing investigations and compromise sensitive intelligence shared among international law enforcement agencies.
However, this is neither the first nor the last activity of IntekBroker. We have compiled for you what happened in the last few days. To track such hacker activities on dark web sources like hacker forums, private Telegram channels, and other hidden platforms where cyber threats often originate, you can check SOCRadar’s Dark Web News.
Stay Informed on Threat Actors’ Activity on the Dark Web with SOCRadar!
Gamify Your Mind; The Secret Sauce to Delivering Success, Continuously Improv...Shahin Sheidaei
Games are powerful teaching tools, fostering hands-on engagement and fun. But they require careful consideration to succeed. Join me to explore factors in running and selecting games, ensuring they serve as effective teaching tools. Learn to maintain focus on learning objectives while playing, and how to measure the ROI of gaming in education. Discover strategies for pitching gaming to leadership. This session offers insights, tips, and examples for coaches, team leads, and enterprise leaders seeking to teach from simple to complex concepts.
First Steps with Globus Compute Multi-User EndpointsGlobus
In this presentation we will share our experiences around getting started with the Globus Compute multi-user endpoint. Working with the Pharmacology group at the University of Auckland, we have previously written an application using Globus Compute that can offload computationally expensive steps in the researcher's workflows, which they wish to manage from their familiar Windows environments, onto the NeSI (New Zealand eScience Infrastructure) cluster. Some of the challenges we have encountered were that each researcher had to set up and manage their own single-user globus compute endpoint and that the workloads had varying resource requirements (CPUs, memory and wall time) between different runs. We hope that the multi-user endpoint will help to address these challenges and share an update on our progress here.
Check out the webinar slides to learn more about how XfilesPro transforms Salesforce document management by leveraging its world-class applications. For more details, please connect with sales@xfilespro.com
If you want to watch the on-demand webinar, please click here: https://www.xfilespro.com/webinars/salesforce-document-management-2-0-smarter-faster-better/
Designing for Privacy in Amazon Web ServicesKrzysztofKkol1
Data privacy is one of the most critical issues that businesses face. This presentation shares insights on the principles and best practices for ensuring the resilience and security of your workload.
Drawing on a real-life project from the HR industry, the various challenges will be demonstrated: data protection, self-healing, business continuity, security, and transparency of data processing. This systematized approach allowed to create a secure AWS cloud infrastructure that not only met strict compliance rules but also exceeded the client's expectations.
In 2015, I used to write extensions for Joomla, WordPress, phpBB3, etc and I ...Juraj Vysvader
In 2015, I used to write extensions for Joomla, WordPress, phpBB3, etc and I didn't get rich from it but it did have 63K downloads (powered possible tens of thousands of websites).
Developing Distributed High-performance Computing Capabilities of an Open Sci...Globus
COVID-19 had an unprecedented impact on scientific collaboration. The pandemic and its broad response from the scientific community has forged new relationships among public health practitioners, mathematical modelers, and scientific computing specialists, while revealing critical gaps in exploiting advanced computing systems to support urgent decision making. Informed by our team’s work in applying high-performance computing in support of public health decision makers during the COVID-19 pandemic, we present how Globus technologies are enabling the development of an open science platform for robust epidemic analysis, with the goal of collaborative, secure, distributed, on-demand, and fast time-to-solution analyses to support public health.
TROUBLESHOOTING 9 TYPES OF OUTOFMEMORYERRORTier1 app
Even though at surface level ‘java.lang.OutOfMemoryError’ appears as one single error; underlyingly there are 9 types of OutOfMemoryError. Each type of OutOfMemoryError has different causes, diagnosis approaches and solutions. This session equips you with the knowledge, tools, and techniques needed to troubleshoot and conquer OutOfMemoryError in all its forms, ensuring smoother, more efficient Java applications.
Globus Connect Server Deep Dive - GlobusWorld 2024Globus
We explore the Globus Connect Server (GCS) architecture and experiment with advanced configuration options and use cases. This content is targeted at system administrators who are familiar with GCS and currently operate—or are planning to operate—broader deployments at their institution.
Prosigns: Transforming Business with Tailored Technology SolutionsProsigns
Unlocking Business Potential: Tailored Technology Solutions by Prosigns
Discover how Prosigns, a leading technology solutions provider, partners with businesses to drive innovation and success. Our presentation showcases our comprehensive range of services, including custom software development, web and mobile app development, AI & ML solutions, blockchain integration, DevOps services, and Microsoft Dynamics 365 support.
Custom Software Development: Prosigns specializes in creating bespoke software solutions that cater to your unique business needs. Our team of experts works closely with you to understand your requirements and deliver tailor-made software that enhances efficiency and drives growth.
Web and Mobile App Development: From responsive websites to intuitive mobile applications, Prosigns develops cutting-edge solutions that engage users and deliver seamless experiences across devices.
AI & ML Solutions: Harnessing the power of Artificial Intelligence and Machine Learning, Prosigns provides smart solutions that automate processes, provide valuable insights, and drive informed decision-making.
Blockchain Integration: Prosigns offers comprehensive blockchain solutions, including development, integration, and consulting services, enabling businesses to leverage blockchain technology for enhanced security, transparency, and efficiency.
DevOps Services: Prosigns' DevOps services streamline development and operations processes, ensuring faster and more reliable software delivery through automation and continuous integration.
Microsoft Dynamics 365 Support: Prosigns provides comprehensive support and maintenance services for Microsoft Dynamics 365, ensuring your system is always up-to-date, secure, and running smoothly.
Learn how our collaborative approach and dedication to excellence help businesses achieve their goals and stay ahead in today's digital landscape. From concept to deployment, Prosigns is your trusted partner for transforming ideas into reality and unlocking the full potential of your business.
Join us on a journey of innovation and growth. Let's partner for success with Prosigns.
top nidhi software solution freedownloadvrstrong314
This presentation emphasizes the importance of data security and legal compliance for Nidhi companies in India. It highlights how online Nidhi software solutions, like Vector Nidhi Software, offer advanced features tailored to these needs. Key aspects include encryption, access controls, and audit trails to ensure data security. The software complies with regulatory guidelines from the MCA and RBI and adheres to Nidhi Rules, 2014. With customizable, user-friendly interfaces and real-time features, these Nidhi software solutions enhance efficiency, support growth, and provide exceptional member services. The presentation concludes with contact information for further inquiries.
Understanding Globus Data Transfers with NetSageGlobus
NetSage is an open privacy-aware network measurement, analysis, and visualization service designed to help end-users visualize and reason about large data transfers. NetSage traditionally has used a combination of passive measurements, including SNMP and flow data, as well as active measurements, mainly perfSONAR, to provide longitudinal network performance data visualization. It has been deployed by dozens of networks world wide, and is supported domestically by the Engagement and Performance Operations Center (EPOC), NSF #2328479. We have recently expanded the NetSage data sources to include logs for Globus data transfers, following the same privacy-preserving approach as for Flow data. Using the logs for the Texas Advanced Computing Center (TACC) as an example, this talk will walk through several different example use cases that NetSage can answer, including: Who is using Globus to share data with my institution, and what kind of performance are they able to achieve? How many transfers has Globus supported for us? Which sites are we sharing the most data with, and how is that changing over time? How is my site using Globus to move data internally, and what kind of performance do we see for those transfers? What percentage of data transfers at my institution used Globus, and how did the overall data transfer performance compare to the Globus users?
Providing Globus Services to Users of JASMIN for Environmental Data AnalysisGlobus
JASMIN is the UK’s high-performance data analysis platform for environmental science, operated by STFC on behalf of the UK Natural Environment Research Council (NERC). In addition to its role in hosting the CEDA Archive (NERC’s long-term repository for climate, atmospheric science & Earth observation data in the UK), JASMIN provides a collaborative platform to a community of around 2,000 scientists in the UK and beyond, providing nearly 400 environmental science projects with working space, compute resources and tools to facilitate their work. High-performance data transfer into and out of JASMIN has always been a key feature, with many scientists bringing model outputs from supercomputers elsewhere in the UK, to analyse against observational or other model data in the CEDA Archive. A growing number of JASMIN users are now realising the benefits of using the Globus service to provide reliable and efficient data movement and other tasks in this and other contexts. Further use cases involve long-distance (intercontinental) transfers to and from JASMIN, and collecting results from a mobile atmospheric radar system, pushing data to JASMIN via a lightweight Globus deployment. We provide details of how Globus fits into our current infrastructure, our experience of the recent migration to GCSv5.4, and of our interest in developing use of the wider ecosystem of Globus services for the benefit of our user community.
Paketo Buildpacks : la meilleure façon de construire des images OCI? DevopsDa...Anthony Dahanne
Les Buildpacks existent depuis plus de 10 ans ! D’abord, ils étaient utilisés pour détecter et construire une application avant de la déployer sur certains PaaS. Ensuite, nous avons pu créer des images Docker (OCI) avec leur dernière génération, les Cloud Native Buildpacks (CNCF en incubation). Sont-ils une bonne alternative au Dockerfile ? Que sont les buildpacks Paketo ? Quelles communautés les soutiennent et comment ?
Venez le découvrir lors de cette session ignite
Globus Compute wth IRI Workflows - GlobusWorld 2024Globus
As part of the DOE Integrated Research Infrastructure (IRI) program, NERSC at Lawrence Berkeley National Lab and ALCF at Argonne National Lab are working closely with General Atomics on accelerating the computing requirements of the DIII-D experiment. As part of the work the team is investigating ways to speedup the time to solution for many different parts of the DIII-D workflow including how they run jobs on HPC systems. One of these routes is looking at Globus Compute as a way to replace the current method for managing tasks and we describe a brief proof of concept showing how Globus Compute could help to schedule jobs and be a tool to connect compute at different facilities.
A Comprehensive Look at Generative AI in Retail App Testing.pdfkalichargn70th171
Traditional software testing methods are being challenged in retail, where customer expectations and technological advancements continually shape the landscape. Enter generative AI—a transformative subset of artificial intelligence technologies poised to revolutionize software testing.
Exploring Innovations in Data Repository Solutions - Insights from the U.S. G...Globus
The U.S. Geological Survey (USGS) has made substantial investments in meeting evolving scientific, technical, and policy driven demands on storing, managing, and delivering data. As these demands continue to grow in complexity and scale, the USGS must continue to explore innovative solutions to improve its management, curation, sharing, delivering, and preservation approaches for large-scale research data. Supporting these needs, the USGS has partnered with the University of Chicago-Globus to research and develop advanced repository components and workflows leveraging its current investment in Globus. The primary outcome of this partnership includes the development of a prototype enterprise repository, driven by USGS Data Release requirements, through exploration and implementation of the entire suite of the Globus platform offerings, including Globus Flow, Globus Auth, Globus Transfer, and Globus Search. This presentation will provide insights into this research partnership, introduce the unique requirements and challenges being addressed and provide relevant project progress.
Exploring Innovations in Data Repository Solutions - Insights from the U.S. G...
Recent advances in the Linux kernel resource management
1. Recent advances
in the Linux kernel
resource management
Kir Kolyshkin, OpenVZ
kir@openvz.org
2. Agenda
Resources to account and control
Some background on containers
Existing functionality, shortcomings
Control Groups a.k.a. cgroups
Memory Controller
Future work
4. Why?
All resources are finite
Multiple tasks and users
Need usage statistics / bookkeeping
Need Denial of Service protection
Need Quality of Service level
(not only limits but guarantees)
11. What are containers?
Multiple isolated userspace
instances
Running on top of a single kernel
Like VMs but very lightweight,
native performance, low overhead
13. Containers cont'd
Multiple containers should
peacefully co-exist, need DoS
protection
From the resource management
point of view, containers are just
groups of processes.
15. Disk Quota
Per mount point disk quota
for users and groups
Soft limits, hard limits, grace periods
Can see the current usage
Can be inc'd/dec'd on-the-fly
Applications are expecting disk
space shortage (or at least should
be)
16. CPU
Per-process nice value which can be
changed on-the-fly (nice, renice)
Real-time priority queue
Hard CPU time limit (ulimit -c)
17. ulimit
setrlimit()/getrlimit() syscalls
Controls 16 different resources:
core file size, data seg size, scheduling priority, file size, pending signals,
max locked memory, max memory size, number of open files, pipe size,
POSIX message queues, real-time priority, stack size, cpu time, max user processes,
virtual memory, file locks
Soft limits and hard limits
18. ulimit: problems
Not all resources are covered
Ulimits set in the current context
− the only good place to set is login
− some can only be decreased run-time
All limits are per-process
− only NPROC is per-UID
Current usage values are unknown
Memory limits are mostly ignored
20. Control Groups
A generic mechanism for grouping
tasks into hierarchical groups
Multiple resource controllers
Possible to have different groups for
different controllers
Managed via cgroup filesystem
21. Control Groups: interface
Managed via cgroup filesystem:
mkdir /dev/cgroup
mount -t cgroup none /dev/cgroup
mkdir /dev/cgroup/0
cd /dev/cgroup/0
echo $$ > tasks
cat /proc/self/cgroup
/etc/init.d/httpd start
22. Control Groups: history
A feature known as cpusets was
developed by big iron Bull/SGI guys
Used to maintain process groups to
NUMA nodes affinity
Paul Menage generalized it
Now cpusets is just one of the
resource controllers
27. Shared Pages accounting
Shared code/library segments
Approaches:
− Charge to the first user only (unfair)
− Charge to all users (incorrect totals)
− Charge a fraction to every user
30. Future a.k.a. TODO
Shared pages accounting
VMA (user mappings) length ctrl
Kernel memory controller
cgroups checkpoint/restart
per-cgroup I/O priorities
All that is available in OpenVZ;
needs to be ported to mainstream
OK, here's the first resource – the lenghts of mappings.
It works with the task address space. All the vm areas it may have are splitted <click> into two classes: the unreclaimable areas <click> – those that are not backed by any disk file and thus will go to swap on memory shortage; and <click> the reclaimable ones – those that are backed by a disk file and its reclamation is almost always succeeds.
Next, we distinguish two <click> pages types in the areas. The "unused" page <click> is the "hole" in the vm area – the page place is reserved, but the physical page is not yet created. This page becomes "used" <click> in the page fault. Used page is the synonym for a physical page.
Using these terms the "lenghts of mapping" resource is <click> the sum of used pages and unused ones in the unreclaimable areas.
The RSS resource is <click> merely the number of used pages
The most interesting part of RSS accounting is how the shared page is accounted between the owning beancounters.
Let's start with the single page. When the first beancounter touches it <click> it gets the whole page into its RSS resource.
Then goes the second one <click>. We take one half of the page from the first beancounter and move this to the newbie.
The third gay (sorry for my english – gUy) will <click> steal a quarter from the second one, without bothering the first.
The forth <click> beancounter gets the quarter from the first one and doesn't mess with the rest owners.
That is – we account the pages with the halves. Then we'll have one eigths and so on. This algorithm's benefits <click> are the follwong.
The first is that we have a constant time algorithm of adding and removind the page owners – each touch we work with only one of the existing owners and do not bother the others.
The second, is that when we sum-up the RSS values from all the beancounters we'll get the real physical memory consumption by the user space.