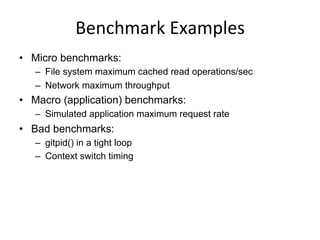
Download as PDF, PPTX


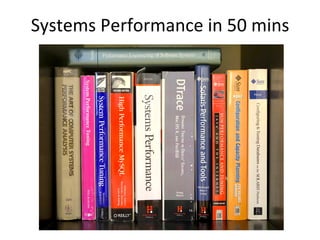


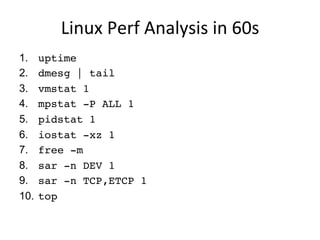
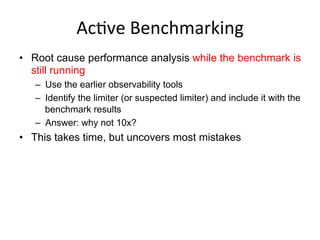
![top
(or
htop)
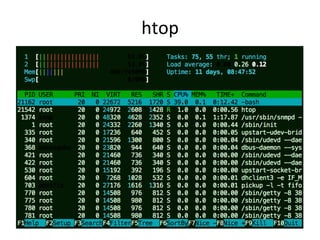
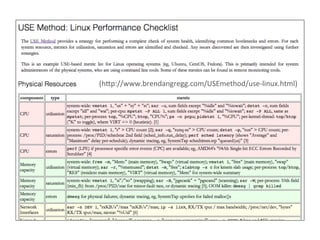
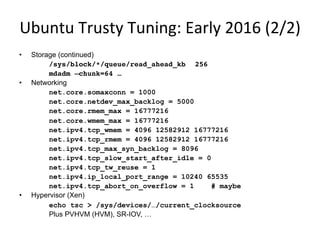
• System and per-process interval summary:
• %CPU is summed across all CPUs
• Can miss short-lived processes (atop won’t)
• Can consume noticeable CPU to read /proc
$ top - 18:50:26 up 7:43, 1 user, load average: 4.11, 4.91, 5.22
Tasks: 209 total, 1 running, 206 sleeping, 0 stopped, 2 zombie
Cpu(s): 47.1%us, 4.0%sy, 0.0%ni, 48.4%id, 0.0%wa, 0.0%hi, 0.3%si, 0.2%st
Mem: 70197156k total, 44831072k used, 25366084k free, 36360k buffers
Swap: 0k total, 0k used, 0k free, 11873356k cached
PID USER PR NI VIRT RES SHR S %CPU %MEM TIME+ COMMAND
5738 apiprod 20 0 62.6g 29g 352m S 417 44.2 2144:15 java
1386 apiprod 20 0 17452 1388 964 R 0 0.0 0:00.02 top
1 root 20 0 24340 2272 1340 S 0 0.0 0:01.51 init
2 root 20 0 0 0 0 S 0 0.0 0:00.00 kthreadd
[…]](https://image.slidesharecdn.com/percona2016linuxsystemsperf-160421182216/85/Linux-Systems-Performance-2016-10-320.jpg)
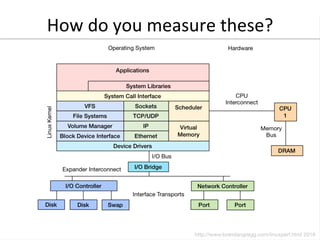
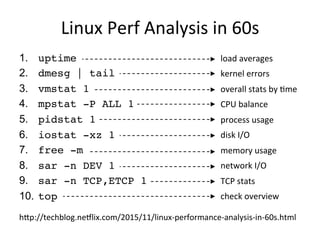
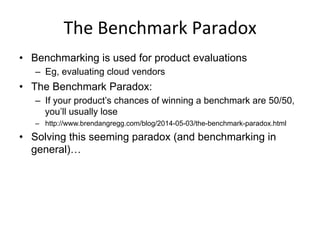
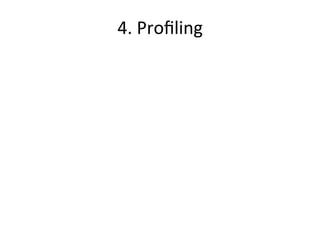
![vmstat
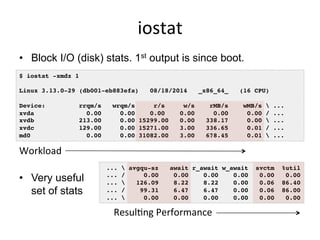
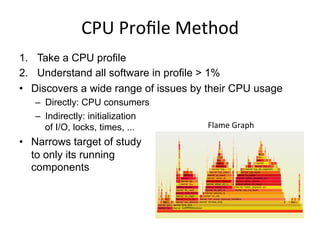
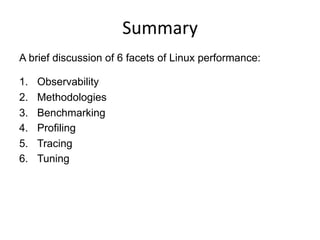
• Virtual memory statistics and more:
• USAGE: vmstat [interval [count]]
• First output line has some summary since boot values
– Should be all; partial is confusing
• High level CPU summary
– “r” is runnable tasks
$ vmstat –Sm 1
procs -----------memory---------- ---swap-- -----io---- -system-- ----cpu----
r b swpd free buff cache si so bi bo in cs us sy id wa
8 0 0 1620 149 552 0 0 1 179 77 12 25 34 0 0
7 0 0 1598 149 552 0 0 0 0 205 186 46 13 0 0
8 0 0 1617 149 552 0 0 0 8 210 435 39 21 0 0
8 0 0 1589 149 552 0 0 0 0 218 219 42 17 0 0
[…]](https://image.slidesharecdn.com/percona2016linuxsystemsperf-160421182216/85/Linux-Systems-Performance-2016-12-320.jpg)
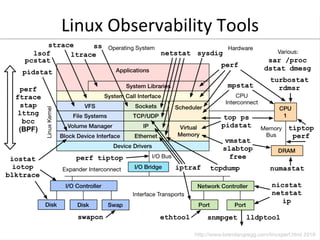
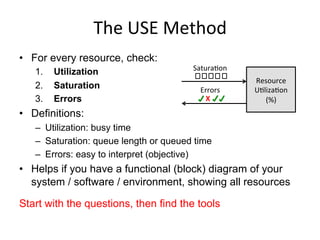
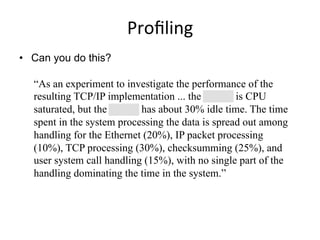
![strace
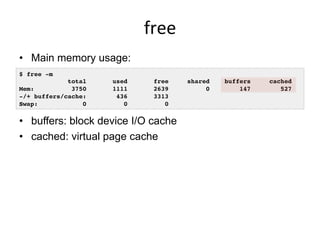
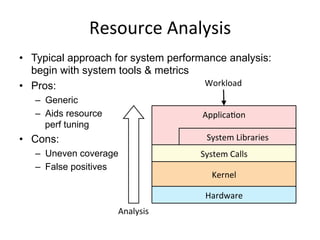
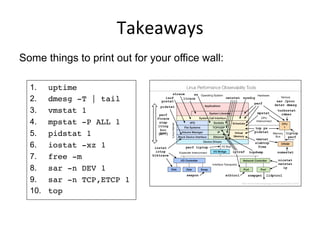
• System call tracer:
• Eg, -ttt: time (us) since epoch; -T: syscall time (s)
• Translates syscall args
– Very helpful for solving system usage issues
• Currently has massive overhead (ptrace based)
– Can slow the target by > 100x. Use extreme caution.
$ strace –tttT –p 313
1408393285.779746 getgroups(0, NULL) = 1 <0.000016>
1408393285.779873 getgroups(1, [0]) = 1 <0.000015>
1408393285.780797 close(3) = 0 <0.000016>
1408393285.781338 write(1, "LinuxCon 2014!n", 15LinuxCon 2014!
) = 15 <0.000048>](https://image.slidesharecdn.com/percona2016linuxsystemsperf-160421182216/85/Linux-Systems-Performance-2016-15-320.jpg)
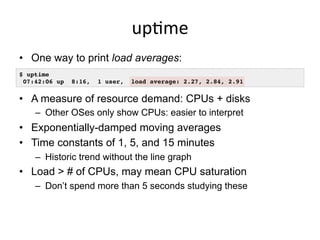
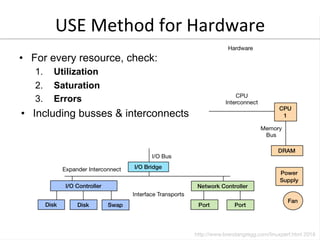
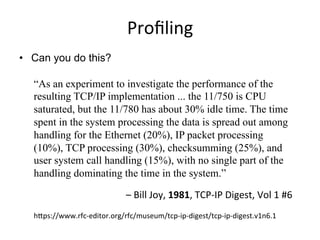
![tcpdump
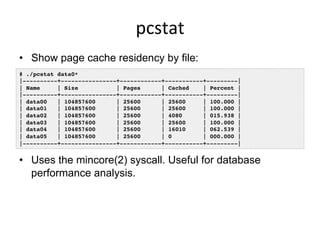
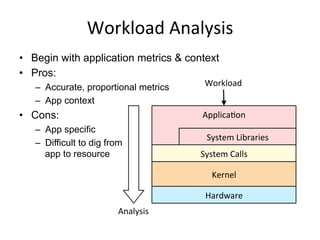
• Sniff network packets for post analysis:
• Study packet sequences with timestamps (us)
• CPU overhead optimized (socket ring buffers), but can
still be significant. Use caution.
$ tcpdump -i eth0 -w /tmp/out.tcpdump
tcpdump: listening on eth0, link-type EN10MB (Ethernet), capture size 65535 bytes
^C7985 packets captured
8996 packets received by filter
1010 packets dropped by kernel
# tcpdump -nr /tmp/out.tcpdump | head
reading from file /tmp/out.tcpdump, link-type EN10MB (Ethernet)
20:41:05.038437 IP 10.44.107.151.22 > 10.53.237.72.46425: Flags [P.], seq 18...
20:41:05.038533 IP 10.44.107.151.22 > 10.53.237.72.46425: Flags [P.], seq 48...
20:41:05.038584 IP 10.44.107.151.22 > 10.53.237.72.46425: Flags [P.], seq 96...
[…]](https://image.slidesharecdn.com/percona2016linuxsystemsperf-160421182216/85/Linux-Systems-Performance-2016-16-320.jpg)
![netstat
• Various network protocol statistics using -s:
• A multi-tool:
-i: interface stats
-r: route table
default: list conns
• netstat -p: shows
process details!
• Per-second interval
with -c
$ netstat –s
[…]
Tcp:
736455 active connections openings
176887 passive connection openings
33 failed connection attempts
1466 connection resets received
3311 connections established
91975192 segments received
180415763 segments send out
223685 segments retransmited
2 bad segments received.
39481 resets sent
[…]
TcpExt:
12377 invalid SYN cookies received
2982 delayed acks sent
[…]](https://image.slidesharecdn.com/percona2016linuxsystemsperf-160421182216/85/Linux-Systems-Performance-2016-17-320.jpg)
![slabtop
• Kernel slab allocator memory usage:
$ slabtop
Active / Total Objects (% used) : 4692768 / 4751161 (98.8%)
Active / Total Slabs (% used) : 129083 / 129083 (100.0%)
Active / Total Caches (% used) : 71 / 109 (65.1%)
Active / Total Size (% used) : 729966.22K / 738277.47K (98.9%)
Minimum / Average / Maximum Object : 0.01K / 0.16K / 8.00K
OBJS ACTIVE USE OBJ SIZE SLABS OBJ/SLAB CACHE SIZE NAME
3565575 3565575 100% 0.10K 91425 39 365700K buffer_head
314916 314066 99% 0.19K 14996 21 59984K dentry
184192 183751 99% 0.06K 2878 64 11512K kmalloc-64
138618 138618 100% 0.94K 4077 34 130464K xfs_inode
138602 138602 100% 0.21K 3746 37 29968K xfs_ili
102116 99012 96% 0.55K 3647 28 58352K radix_tree_node
97482 49093 50% 0.09K 2321 42 9284K kmalloc-96
22695 20777 91% 0.05K 267 85 1068K shared_policy_node
21312 21312 100% 0.86K 576 37 18432K ext4_inode_cache
16288 14601 89% 0.25K 509 32 4072K kmalloc-256
[…]](https://image.slidesharecdn.com/percona2016linuxsystemsperf-160421182216/85/Linux-Systems-Performance-2016-18-320.jpg)
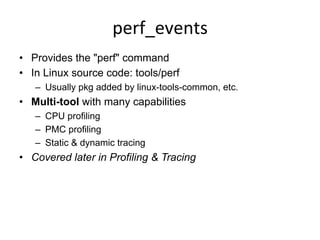


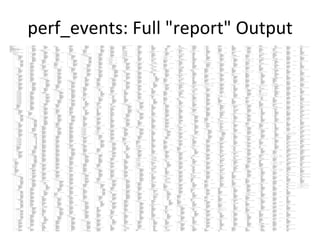
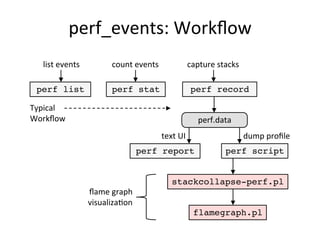
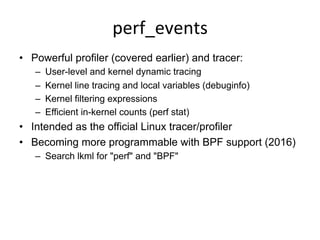
![perf_events
• Introduced earlier: multi-tool, profiler. Provides "perf".
usage: perf [--version] [--help] [OPTIONS] COMMAND [ARGS]
The most commonly used perf commands are:
annotate Read perf.data (created by perf record) and display annotated code
archive Create archive with object files with build-ids found in perf.data file
bench General framework for benchmark suites
buildid-cache Manage build-id cache.
buildid-list List the buildids in a perf.data file
data Data file related processing
diff Read perf.data files and display the differential profile
evlist List the event names in a perf.data file
inject Filter to augment the events stream with additional information
kmem Tool to trace/measure kernel memory(slab) properties
kvm Tool to trace/measure kvm guest os
list List all symbolic event types
lock Analyze lock events
mem Profile memory accesses
record Run a command and record its profile into perf.data
report Read perf.data (created by perf record) and display the profile
sched Tool to trace/measure scheduler properties (latencies)
script Read perf.data (created by perf record) and display trace output
stat Run a command and gather performance counter statistics
test Runs sanity tests.
timechart Tool to visualize total system behavior during a workload
top System profiling tool.
trace strace inspired tool
probe Define new dynamic tracepoints
See 'perf help COMMAND' for more information on a specific command.](https://image.slidesharecdn.com/percona2016linuxsystemsperf-160421182216/85/Linux-Systems-Performance-2016-43-320.jpg)
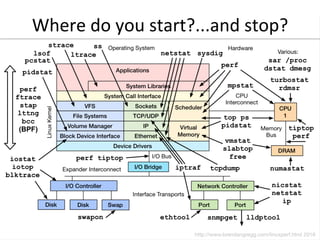
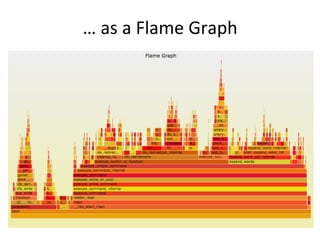
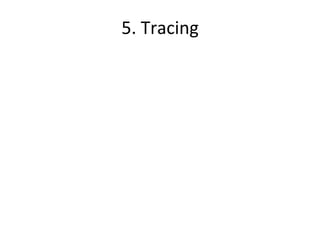
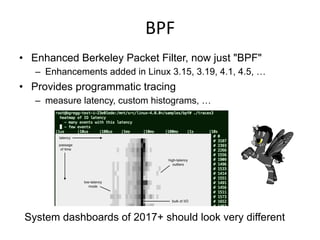
![perf_events:
CPU
profiling
• Sampling full stack traces at 99 Hertz, for 30 secs:
# perf record -F 99 -ag -- sleep 30
[ perf record: Woken up 9 times to write data ]
[ perf record: Captured and wrote 2.745 MB perf.data (~119930 samples) ]
# perf report -n --stdio
1.40% 162 java [kernel.kallsyms] [k] _raw_spin_lock
|
--- _raw_spin_lock
|
|--63.21%-- try_to_wake_up
| |
| |--63.91%-- default_wake_function
| | |
| | |--56.11%-- __wake_up_common
| | | __wake_up_locked
| | | ep_poll_callback
| | | __wake_up_common
| | | __wake_up_sync_key
| | | |
| | | |--59.19%-- sock_def_readable
[…78,000 lines truncated…]](https://image.slidesharecdn.com/percona2016linuxsystemsperf-160421182216/85/Linux-Systems-Performance-2016-44-320.jpg)

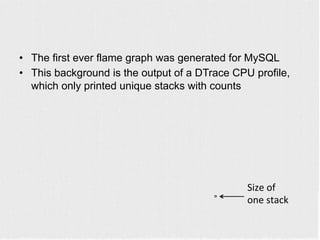
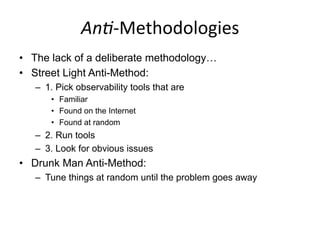
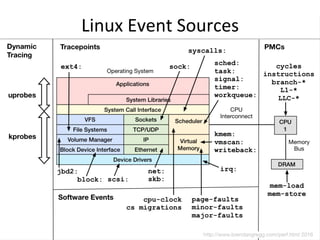
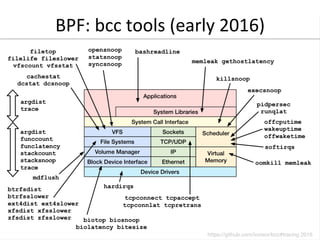
![perf_events:
Counters
• Performance Monitoring Counters (PMCs):
• Identify CPU cycle breakdowns, esp. stall types
• PMCs not enabled by-default in clouds (yet)
• Can be time-consuming to use (CPU manuals)
$ perf list | grep –i hardware
cpu-cycles OR cycles [Hardware event]
stalled-cycles-frontend OR idle-cycles-frontend [Hardware event]
stalled-cycles-backend OR idle-cycles-backend [Hardware event]
instructions [Hardware event]
[…]
branch-misses [Hardware event]
bus-cycles [Hardware event]
L1-dcache-loads [Hardware cache event]
L1-dcache-load-misses [Hardware cache event]
[…]
rNNN (see 'perf list --help' on how to encode it) [Raw hardware event …
mem:<addr>[:access] [Hardware breakpoint]](https://image.slidesharecdn.com/percona2016linuxsystemsperf-160421182216/85/Linux-Systems-Performance-2016-51-320.jpg)
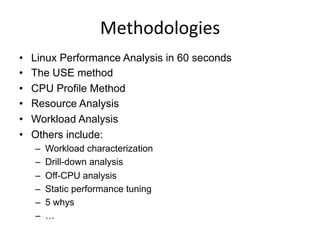
![jrace
• Added by Steven Rostedt and others since 2.6.27
– CONFIG_FTRACE, CONFIG_FUNCTION_PROFILER, …
– See Linux source: Documentation/trace/ftrace.txt
– A collection of powerful features, good for hacking
• Use directly via /sys/kernel/debug/tracing (not easy):
• Or via front-ends:
– Steven's trace-cmd
– my perf-tools: iosnoop, iolatency, funccount, kprobe, …
linux-4.0.0+# ls /sys/kernel/debug/tracing/
available_events max_graph_depth stack_max_size
available_filter_functions options stack_trace
available_tracers per_cpu stack_trace_filter
buffer_size_kb printk_formats trace
[…]](https://image.slidesharecdn.com/percona2016linuxsystemsperf-160421182216/85/Linux-Systems-Performance-2016-55-320.jpg)
![jrace:
perf-‐tools
iosnoop
• Block I/O (disk) events with latency:
# ./iosnoop –ts
Tracing block I/O. Ctrl-C to end.
STARTs ENDs COMM PID TYPE DEV BLOCK BYTES LATms
5982800.302061 5982800.302679 supervise 1809 W 202,1 17039600 4096 0.62
5982800.302423 5982800.302842 supervise 1809 W 202,1 17039608 4096 0.42
5982800.304962 5982800.305446 supervise 1801 W 202,1 17039616 4096 0.48
5982800.305250 5982800.305676 supervise 1801 W 202,1 17039624 4096 0.43
[…]
# ./iosnoop –h
USAGE: iosnoop [-hQst] [-d device] [-i iotype] [-p PID] [-n name] [duration]
-d device # device string (eg, "202,1)
-i iotype # match type (eg, '*R*' for all reads)
-n name # process name to match on I/O issue
-p PID # PID to match on I/O issue
-Q # include queueing time in LATms
-s # include start time of I/O (s)
-t # include completion time of I/O (s)
-h # this usage message
duration # duration seconds, and use buffers
[…]](https://image.slidesharecdn.com/percona2016linuxsystemsperf-160421182216/85/Linux-Systems-Performance-2016-56-320.jpg)
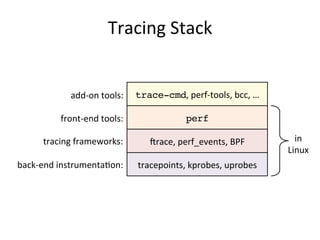
![jrace:
perf-‐tools
iolatency
• Block I/O (disk) latency distributions:
# ./iolatency
Tracing block I/O. Output every 1 seconds. Ctrl-C to end.
>=(ms) .. <(ms) : I/O |Distribution |
0 -> 1 : 2104 |######################################|
1 -> 2 : 280 |###### |
2 -> 4 : 2 |# |
4 -> 8 : 0 | |
8 -> 16 : 202 |#### |
>=(ms) .. <(ms) : I/O |Distribution |
0 -> 1 : 1144 |######################################|
1 -> 2 : 267 |######### |
2 -> 4 : 10 |# |
4 -> 8 : 5 |# |
8 -> 16 : 248 |######### |
16 -> 32 : 601 |#################### |
32 -> 64 : 117 |#### |
[…]](https://image.slidesharecdn.com/percona2016linuxsystemsperf-160421182216/85/Linux-Systems-Performance-2016-57-320.jpg)
![jrace:
perf-‐tools
funccount
• Count a kernel function call rate:
– -i: set an output interval (seconds), otherwise until Ctrl-C
# ./funccount -i 1 'bio_*'
Tracing "bio_*"... Ctrl-C to end.
FUNC COUNT
bio_attempt_back_merge 26
bio_get_nr_vecs 361
bio_alloc 536
bio_alloc_bioset 536
bio_endio 536
bio_free 536
bio_fs_destructor 536
bio_init 536
bio_integrity_enabled 536
bio_put 729
bio_add_page 1004
[...]
Counts
are
in-‐kernel,
for
low
overhead](https://image.slidesharecdn.com/percona2016linuxsystemsperf-160421182216/85/Linux-Systems-Performance-2016-58-320.jpg)
![jrace:
perf-‐tools
uprobe
• Dynamically trace user-level functions; eg, MySQL:
– Filter on string match; eg, "SELECT":
• Ok for hacking, but not friendly; need perf_events/BPF
# ./uprobe 'p:dispatch_command /opt/mysql/bin/mysqld:_Z16dispatch_command19enum_server_commandP3THDPcj
+0(%dx):string'
Tracing uprobe dispatch_command (p:dispatch_command /opt/mysql/bin/mysqld:0x2dbd40 +0(%dx):string).
Ctrl-C to end.
mysqld-2855 [001] d... 19956674.509085: dispatch_command: (0x6dbd40) arg1="show tables"
mysqld-2855 [001] d... 19956675.541155: dispatch_command: (0x6dbd40) arg1="SELECT * FROM
numbers where number > 32000"
# ./uprobe 'p:dispatch_command /opt/mysql/bin/mysqld:_Z16dispatch_command19enum_server_commandP3THDPcj
cmd=+0(%dx):string' 'cmd ~ "SELECT*"'
Tracing uprobe dispatch_command (p:dispatch_command /opt/mysql/bin/mysqld:0x2dbd40 cmd=
+0(%dx):string). Ctrl-C to end.
mysqld-2855 [001] d... 19956754.619958: dispatch_command: (0x6dbd40) cmd="SELECT * FROM
numbers where number > 32000"
mysqld-2855 [001] d... 19956755.060125: dispatch_command: (0x6dbd40) cmd="SELECT * FROM
numbers where number > 32000"](https://image.slidesharecdn.com/percona2016linuxsystemsperf-160421182216/85/Linux-Systems-Performance-2016-59-320.jpg)
![perf_events:
LisGng
Events
# perf list
cpu-cycles OR cycles [Hardware event]
instructions [Hardware event]
cache-references [Hardware event]
cache-misses [Hardware event]
branch-instructions OR branches [Hardware event]
[…]
skb:kfree_skb [Tracepoint event]
skb:consume_skb [Tracepoint event]
skb:skb_copy_datagram_iovec [Tracepoint event]
net:net_dev_xmit [Tracepoint event]
net:net_dev_queue [Tracepoint event]
net:netif_receive_skb [Tracepoint event]
net:netif_rx [Tracepoint event]
[…]
block:block_rq_abort [Tracepoint event]
block:block_rq_requeue [Tracepoint event]
block:block_rq_complete [Tracepoint event]
block:block_rq_insert [Tracepoint event]
block:block_rq_issue [Tracepoint event]
block:block_bio_bounce [Tracepoint event]
block:block_bio_complete [Tracepoint event]
[…]](https://image.slidesharecdn.com/percona2016linuxsystemsperf-160421182216/85/Linux-Systems-Performance-2016-61-320.jpg)
![perf_events:
Tracing
Tracepoints
• If -g is used in "perf record", stack traces are included
• If "perf script" output is too verbose, try "perf report",
or making a flame graph
# perf record -e block:block_rq_complete -a sleep 10
[ perf record: Woken up 1 times to write data ]
[ perf record: Captured and wrote 0.428 MB perf.data (~18687 samples) ]
# perf script
run 30339 [000] 2083345.722767: block:block_rq_complete: 202,1 W () 12984648 + 8 [0]
run 30339 [000] 2083345.722857: block:block_rq_complete: 202,1 W () 12986336 + 8 [0]
run 30339 [000] 2083345.723180: block:block_rq_complete: 202,1 W () 12986528 + 8 [0]
swapper 0 [000] 2083345.723489: block:block_rq_complete: 202,1 W () 12986496 + 8 [0]
swapper 0 [000] 2083346.745840: block:block_rq_complete: 202,1 WS () 1052984 + 144 [0]
supervise 30342 [000] 2083346.746571: block:block_rq_complete: 202,1 WS () 1053128 + 8 [0]
supervise 30342 [000] 2083346.746663: block:block_rq_complete: 202,1 W () 12986608 + 8 [0]
run 30342 [000] 2083346.747003: block:block_rq_complete: 202,1 W () 12986832 + 8 [0]
[...]](https://image.slidesharecdn.com/percona2016linuxsystemsperf-160421182216/85/Linux-Systems-Performance-2016-62-320.jpg)
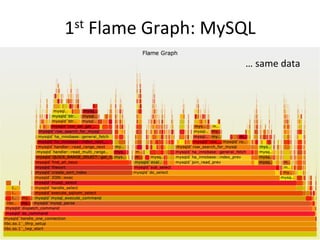
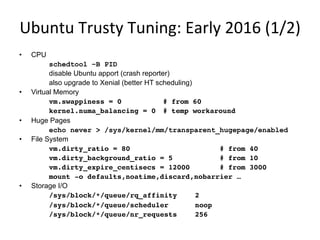
![BPF:
bcc
ext4slower
• ext4 operations slower than the threshold:
• Better indicator of application pain than disk I/O
• Measures & filters in-kernel for efficiency using BPF
– https://github.com/iovisor/bcc
# ./ext4slower 1
Tracing ext4 operations slower than 1 ms
TIME COMM PID T BYTES OFF_KB LAT(ms) FILENAME
06:49:17 bash 3616 R 128 0 7.75 cksum
06:49:17 cksum 3616 R 39552 0 1.34 [
06:49:17 cksum 3616 R 96 0 5.36 2to3-2.7
06:49:17 cksum 3616 R 96 0 14.94 2to3-3.4
06:49:17 cksum 3616 R 10320 0 6.82 411toppm
06:49:17 cksum 3616 R 65536 0 4.01 a2p
06:49:17 cksum 3616 R 55400 0 8.77 ab
06:49:17 cksum 3616 R 36792 0 16.34 aclocal-1.14
06:49:17 cksum 3616 R 15008 0 19.31 acpi_listen
[…]](https://image.slidesharecdn.com/percona2016linuxsystemsperf-160421182216/85/Linux-Systems-Performance-2016-64-320.jpg)


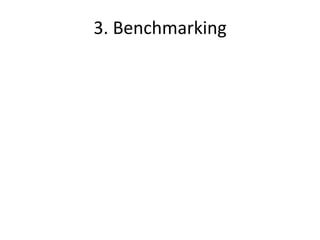
The document discusses various aspects of Linux systems performance, focusing on six key facets: observability, methodologies, benchmarking, profiling, tracing, and tuning. It details several Linux observability tools and methodologies for analyzing system performance, including CPU profiling and resource analysis. The document emphasizes the importance of careful benchmarking and provides examples of different types of benchmarks, highlighting common pitfalls.


![Getting Started with Apache Spark: Big Data Made Simple [Free Meetup]](https://cdn.slidesharecdn.com/ss_thumbnails/apachesparkgettingstarted-260203175547-8361bcc3-thumbnail.jpg?width=640&height=640&fit=bounds)


