Download to read offline


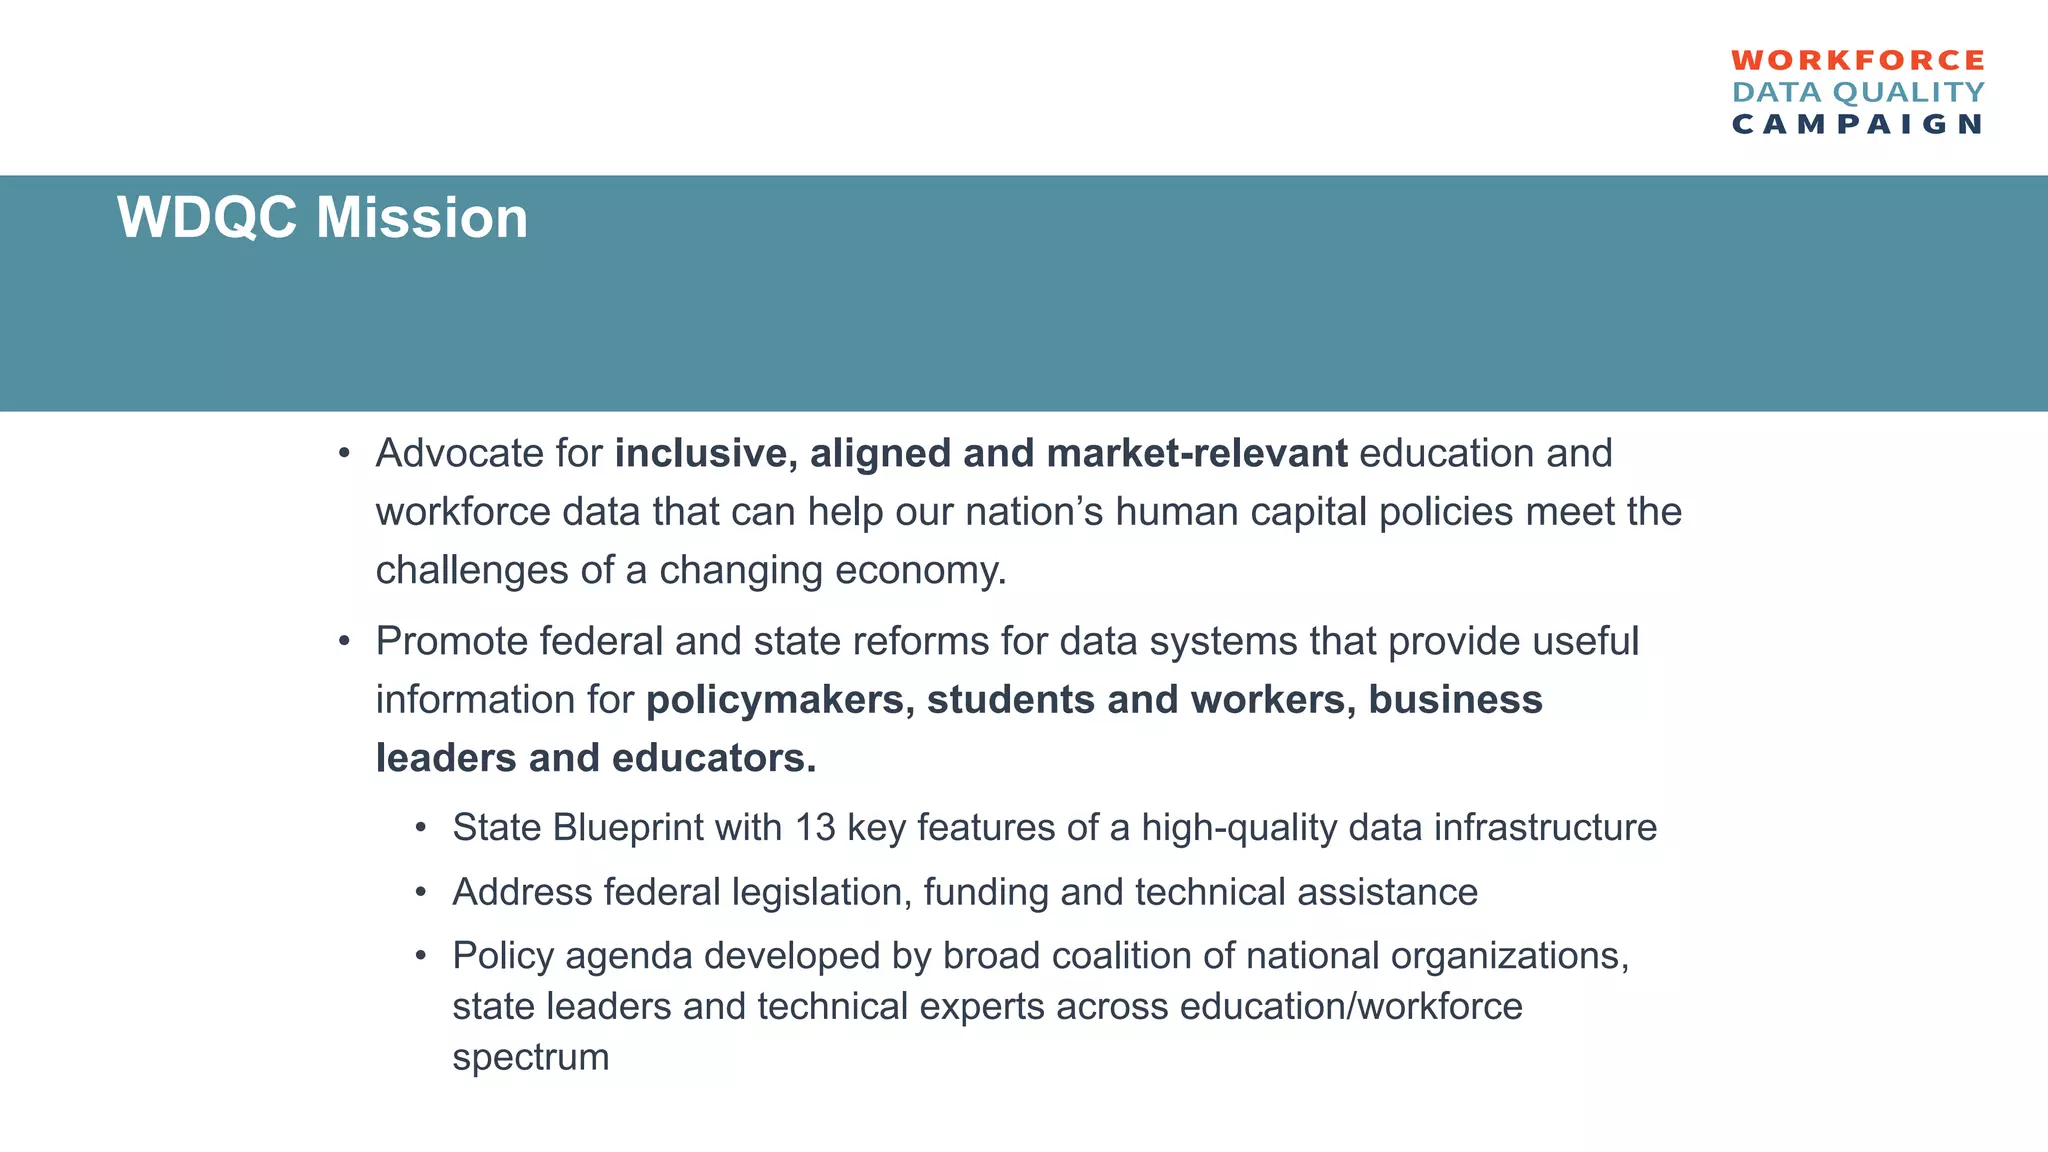
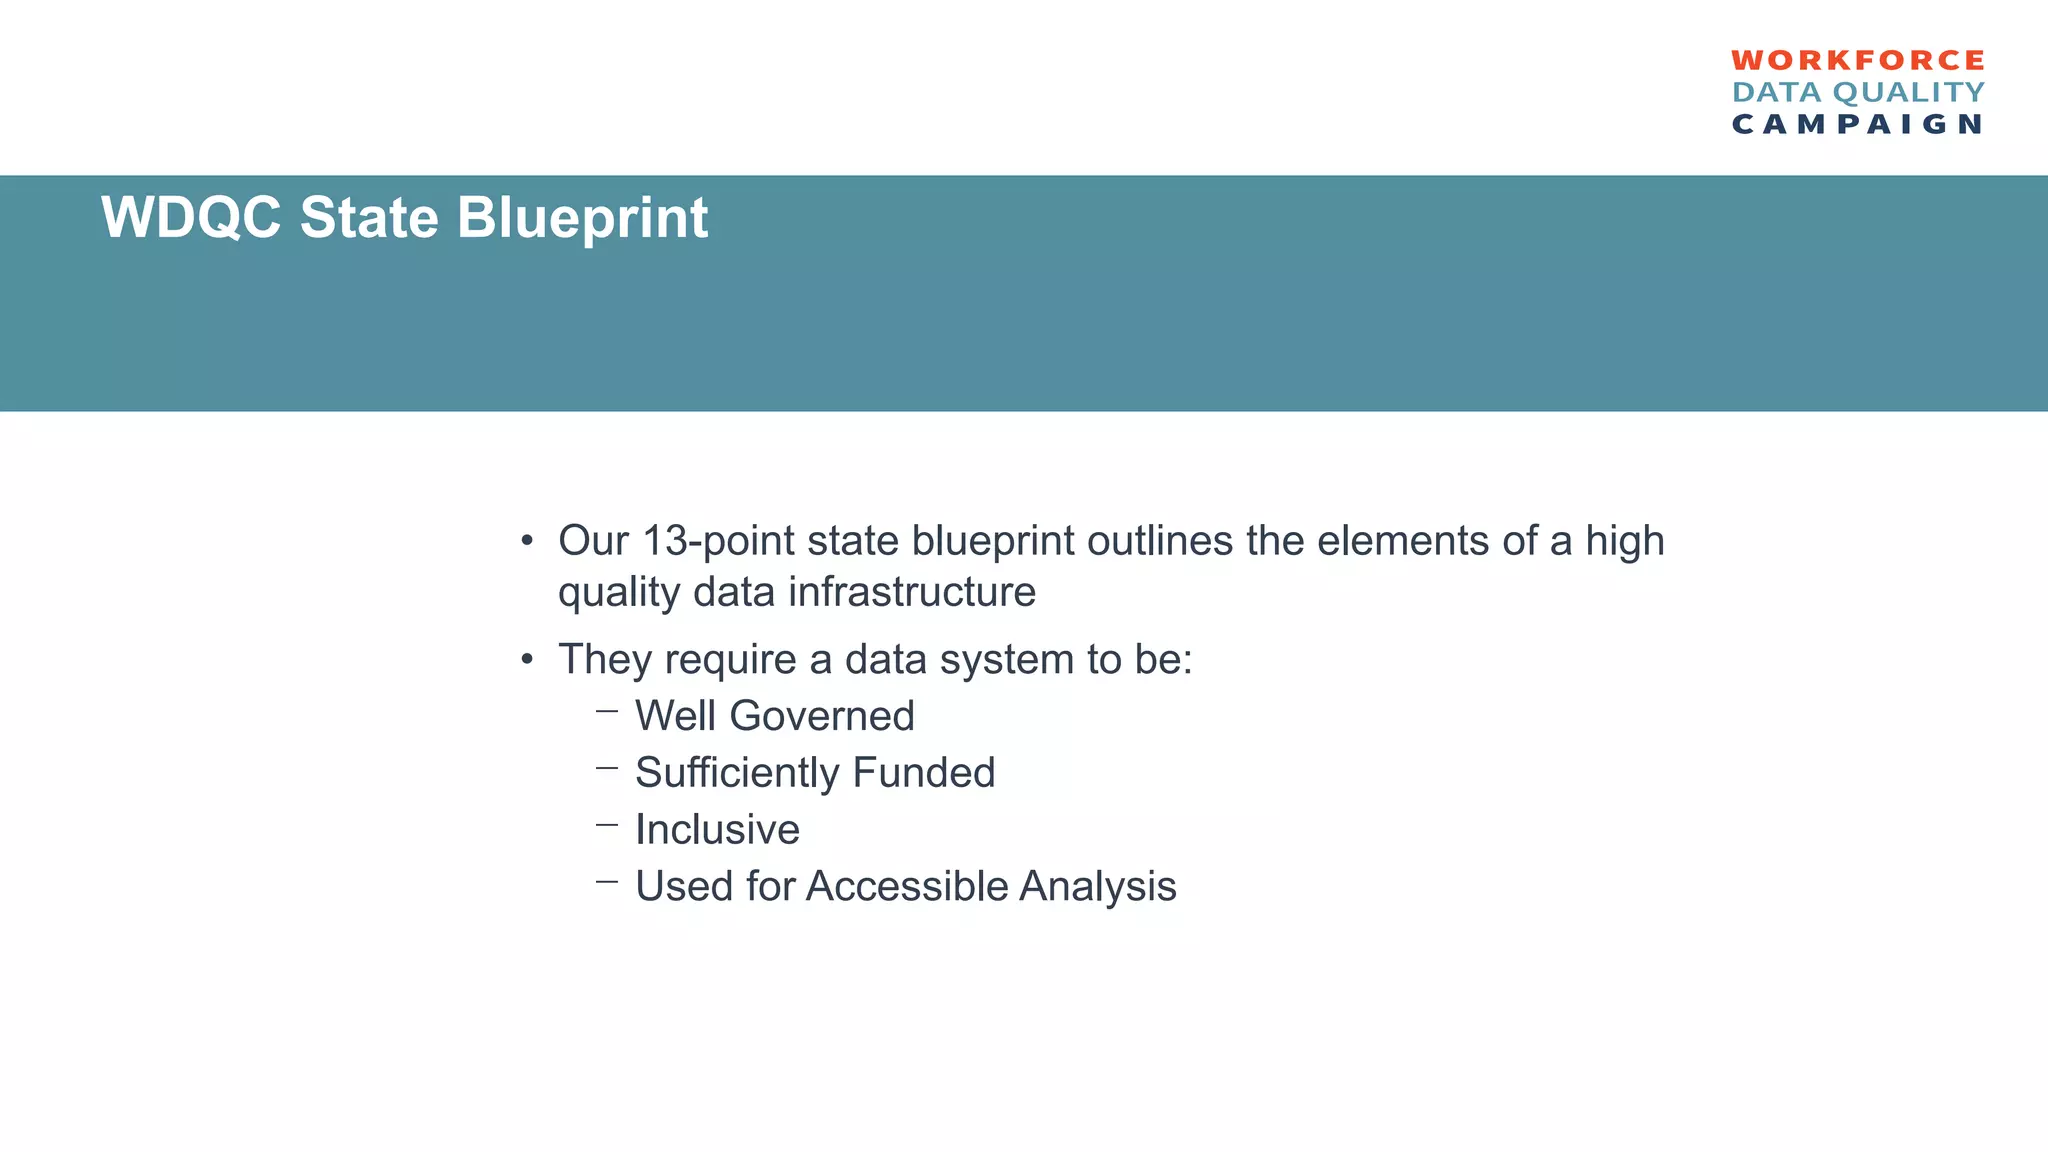
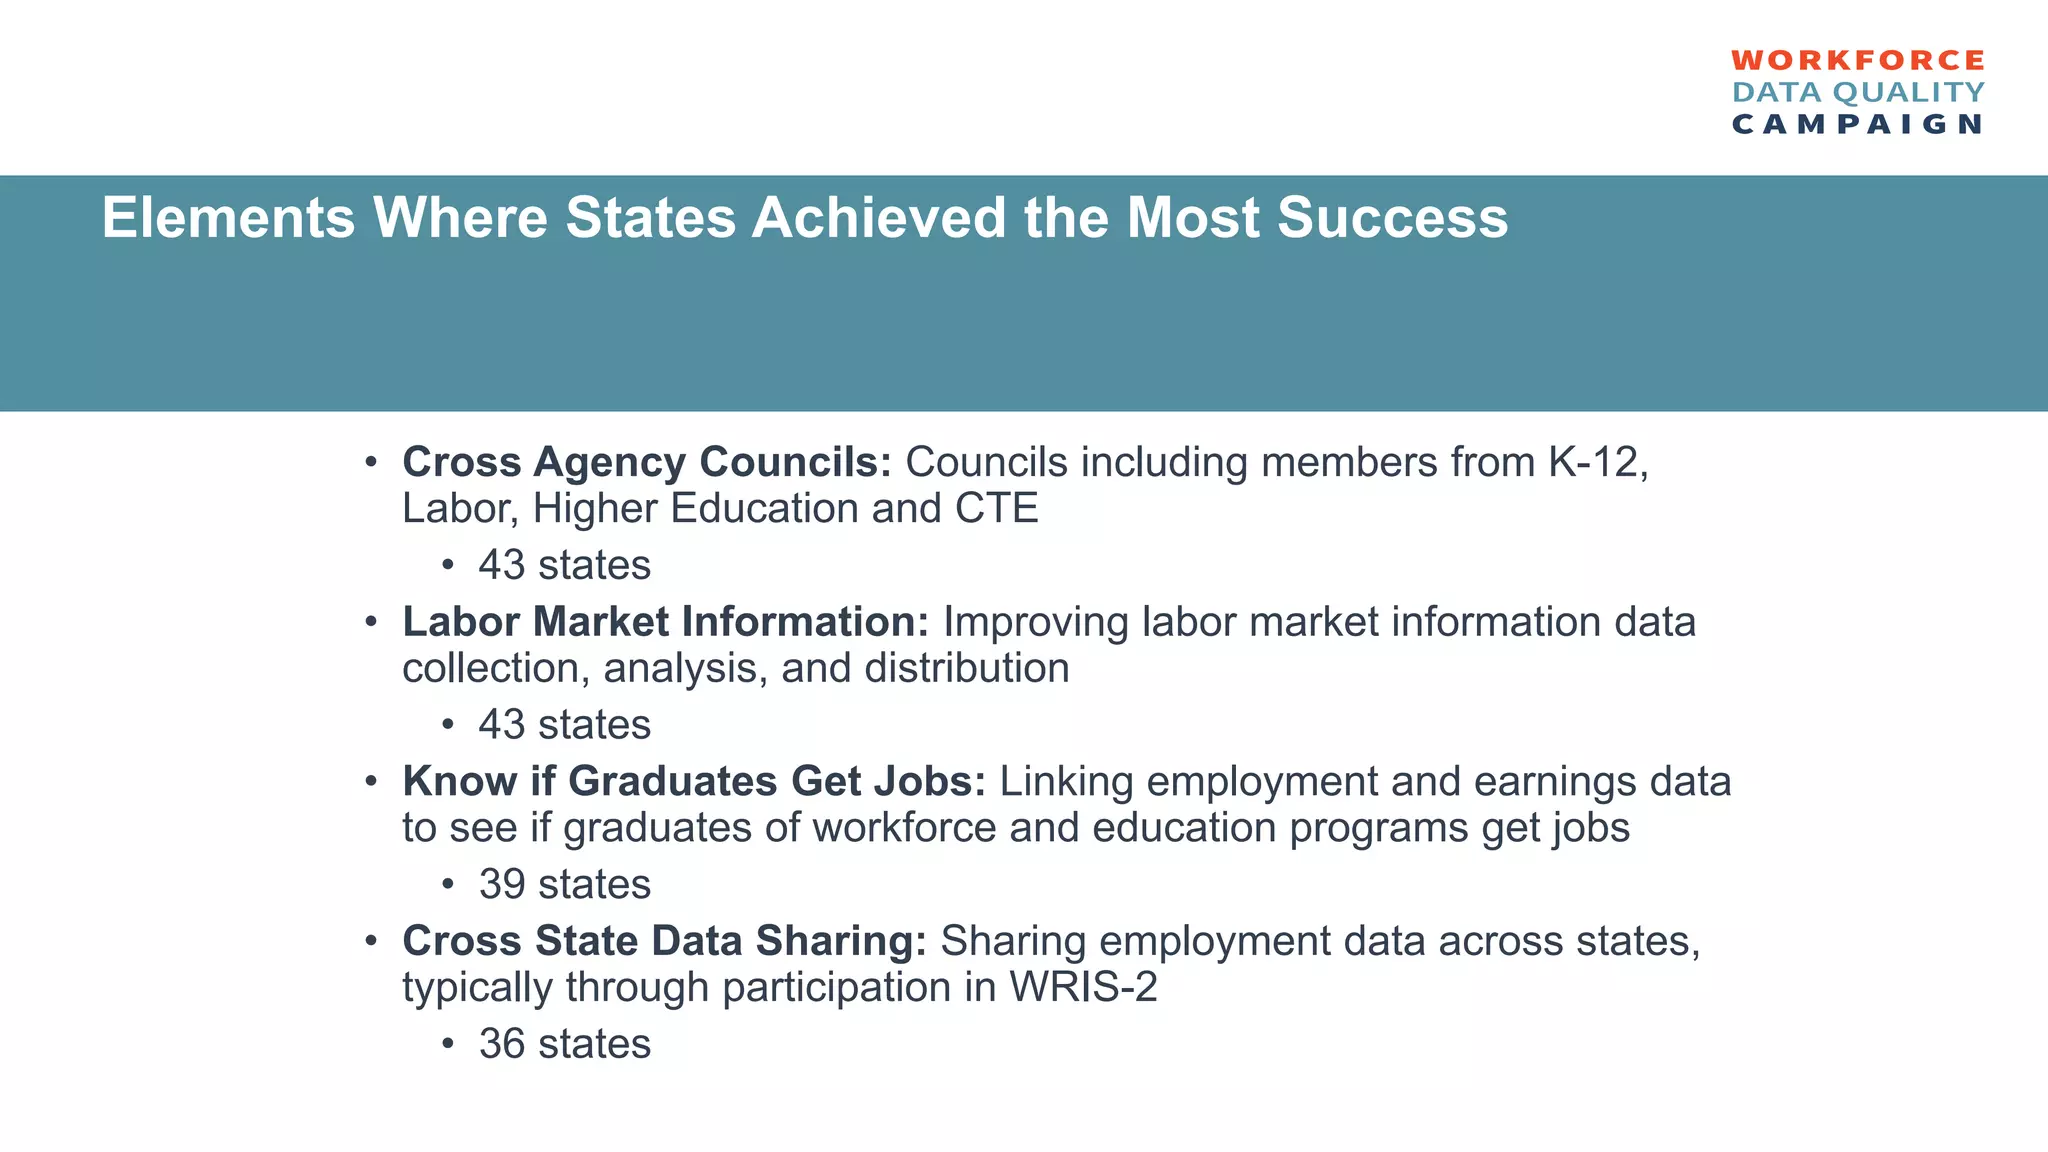
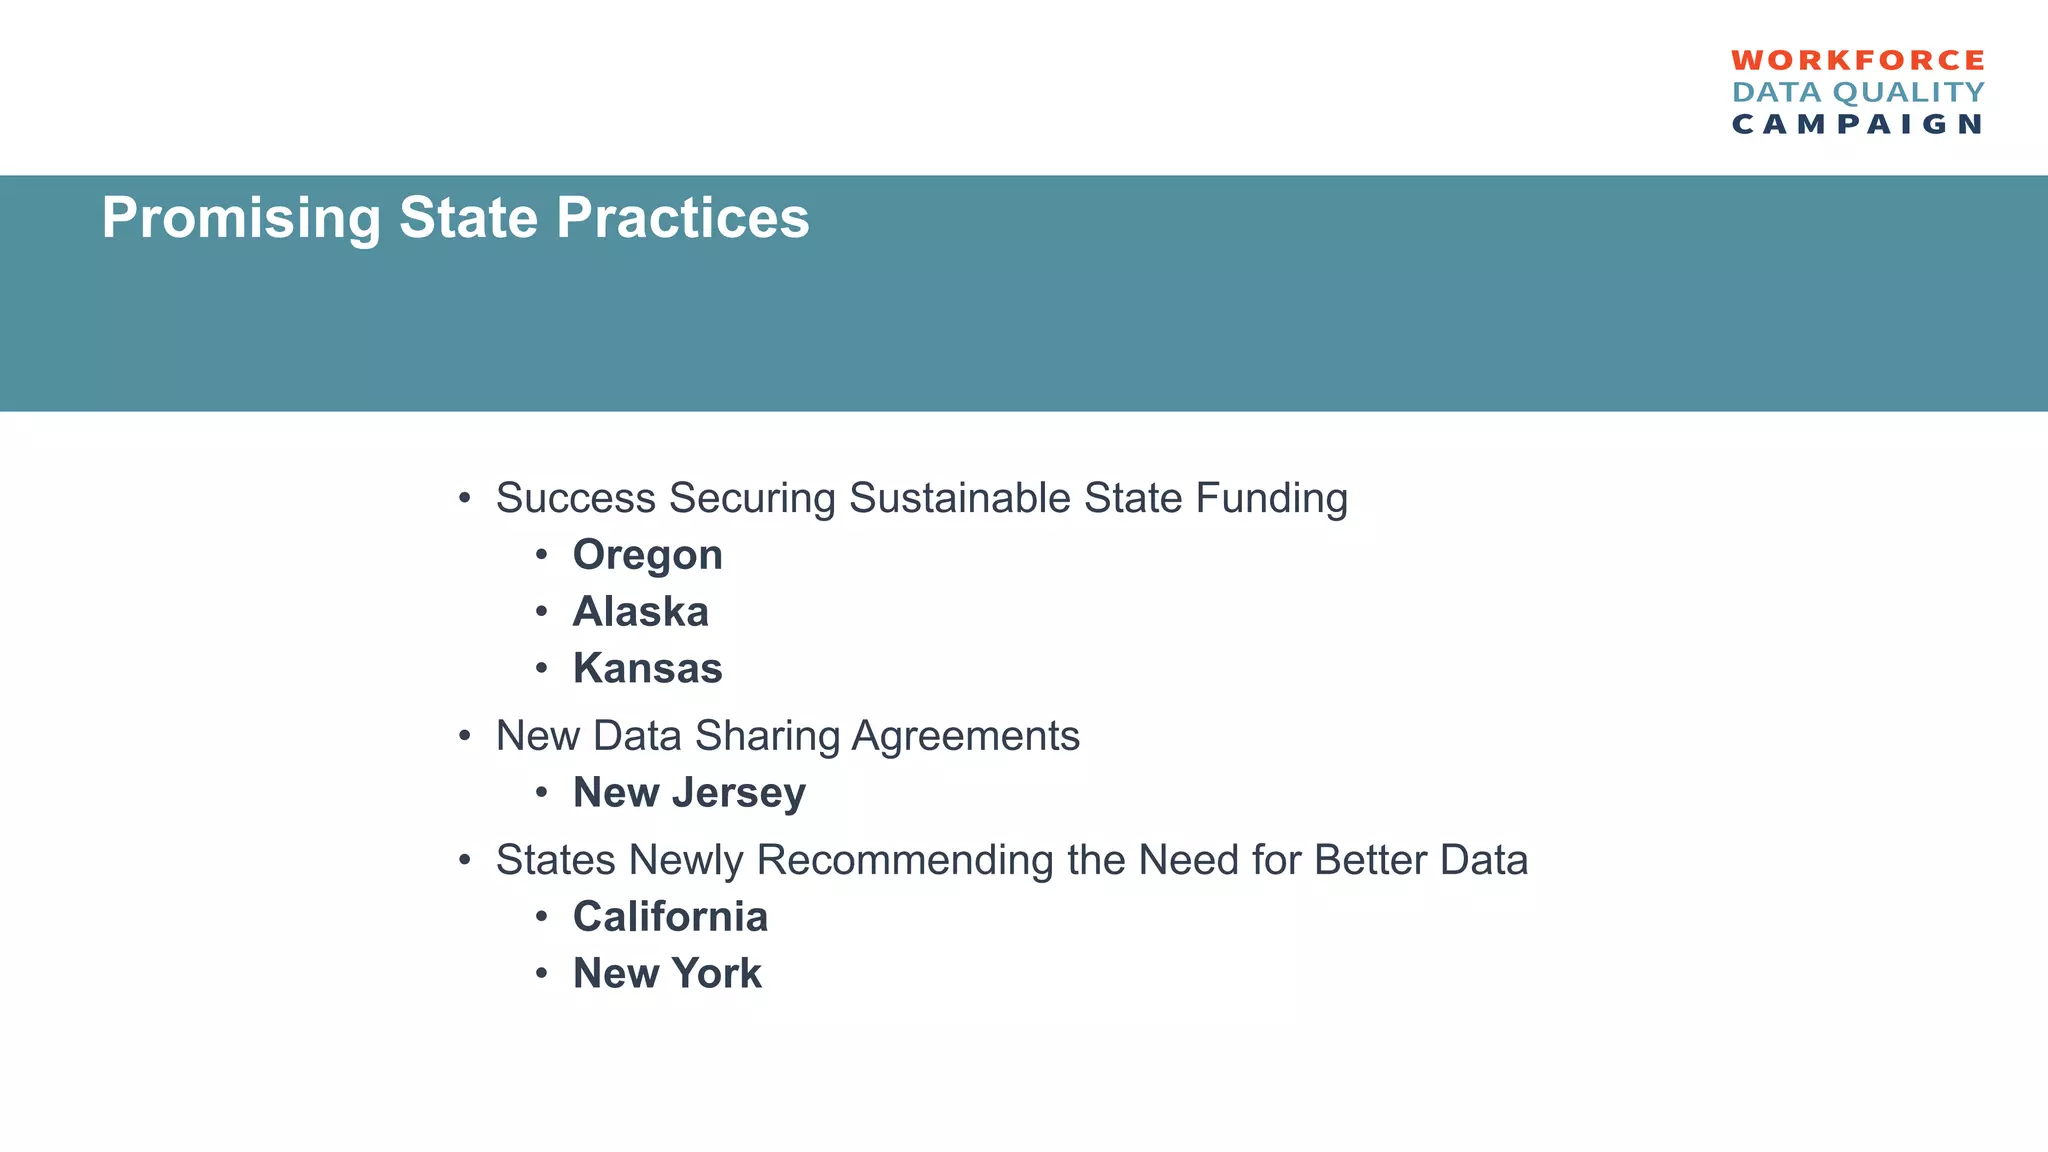


This document summarizes a presentation given at the NAWB Forum in Washington DC on March 13, 2016. The presentation focused on how states can use quality data to do good better by developing inclusive, aligned, and market-relevant education and workforce data systems. It discusses the importance of evidence-based policymaking and describes the Workforce Data Quality Campaign's 13-point state blueprint for a high-quality data infrastructure. The presentation outlines some elements that states have achieved success in, like cross-agency councils and improving labor market information, as well as promising state practices from places like Oregon, Alaska, and Kansas. It concludes by emphasizing the importance of data sharing agreements and continued progress in developing better data systems.