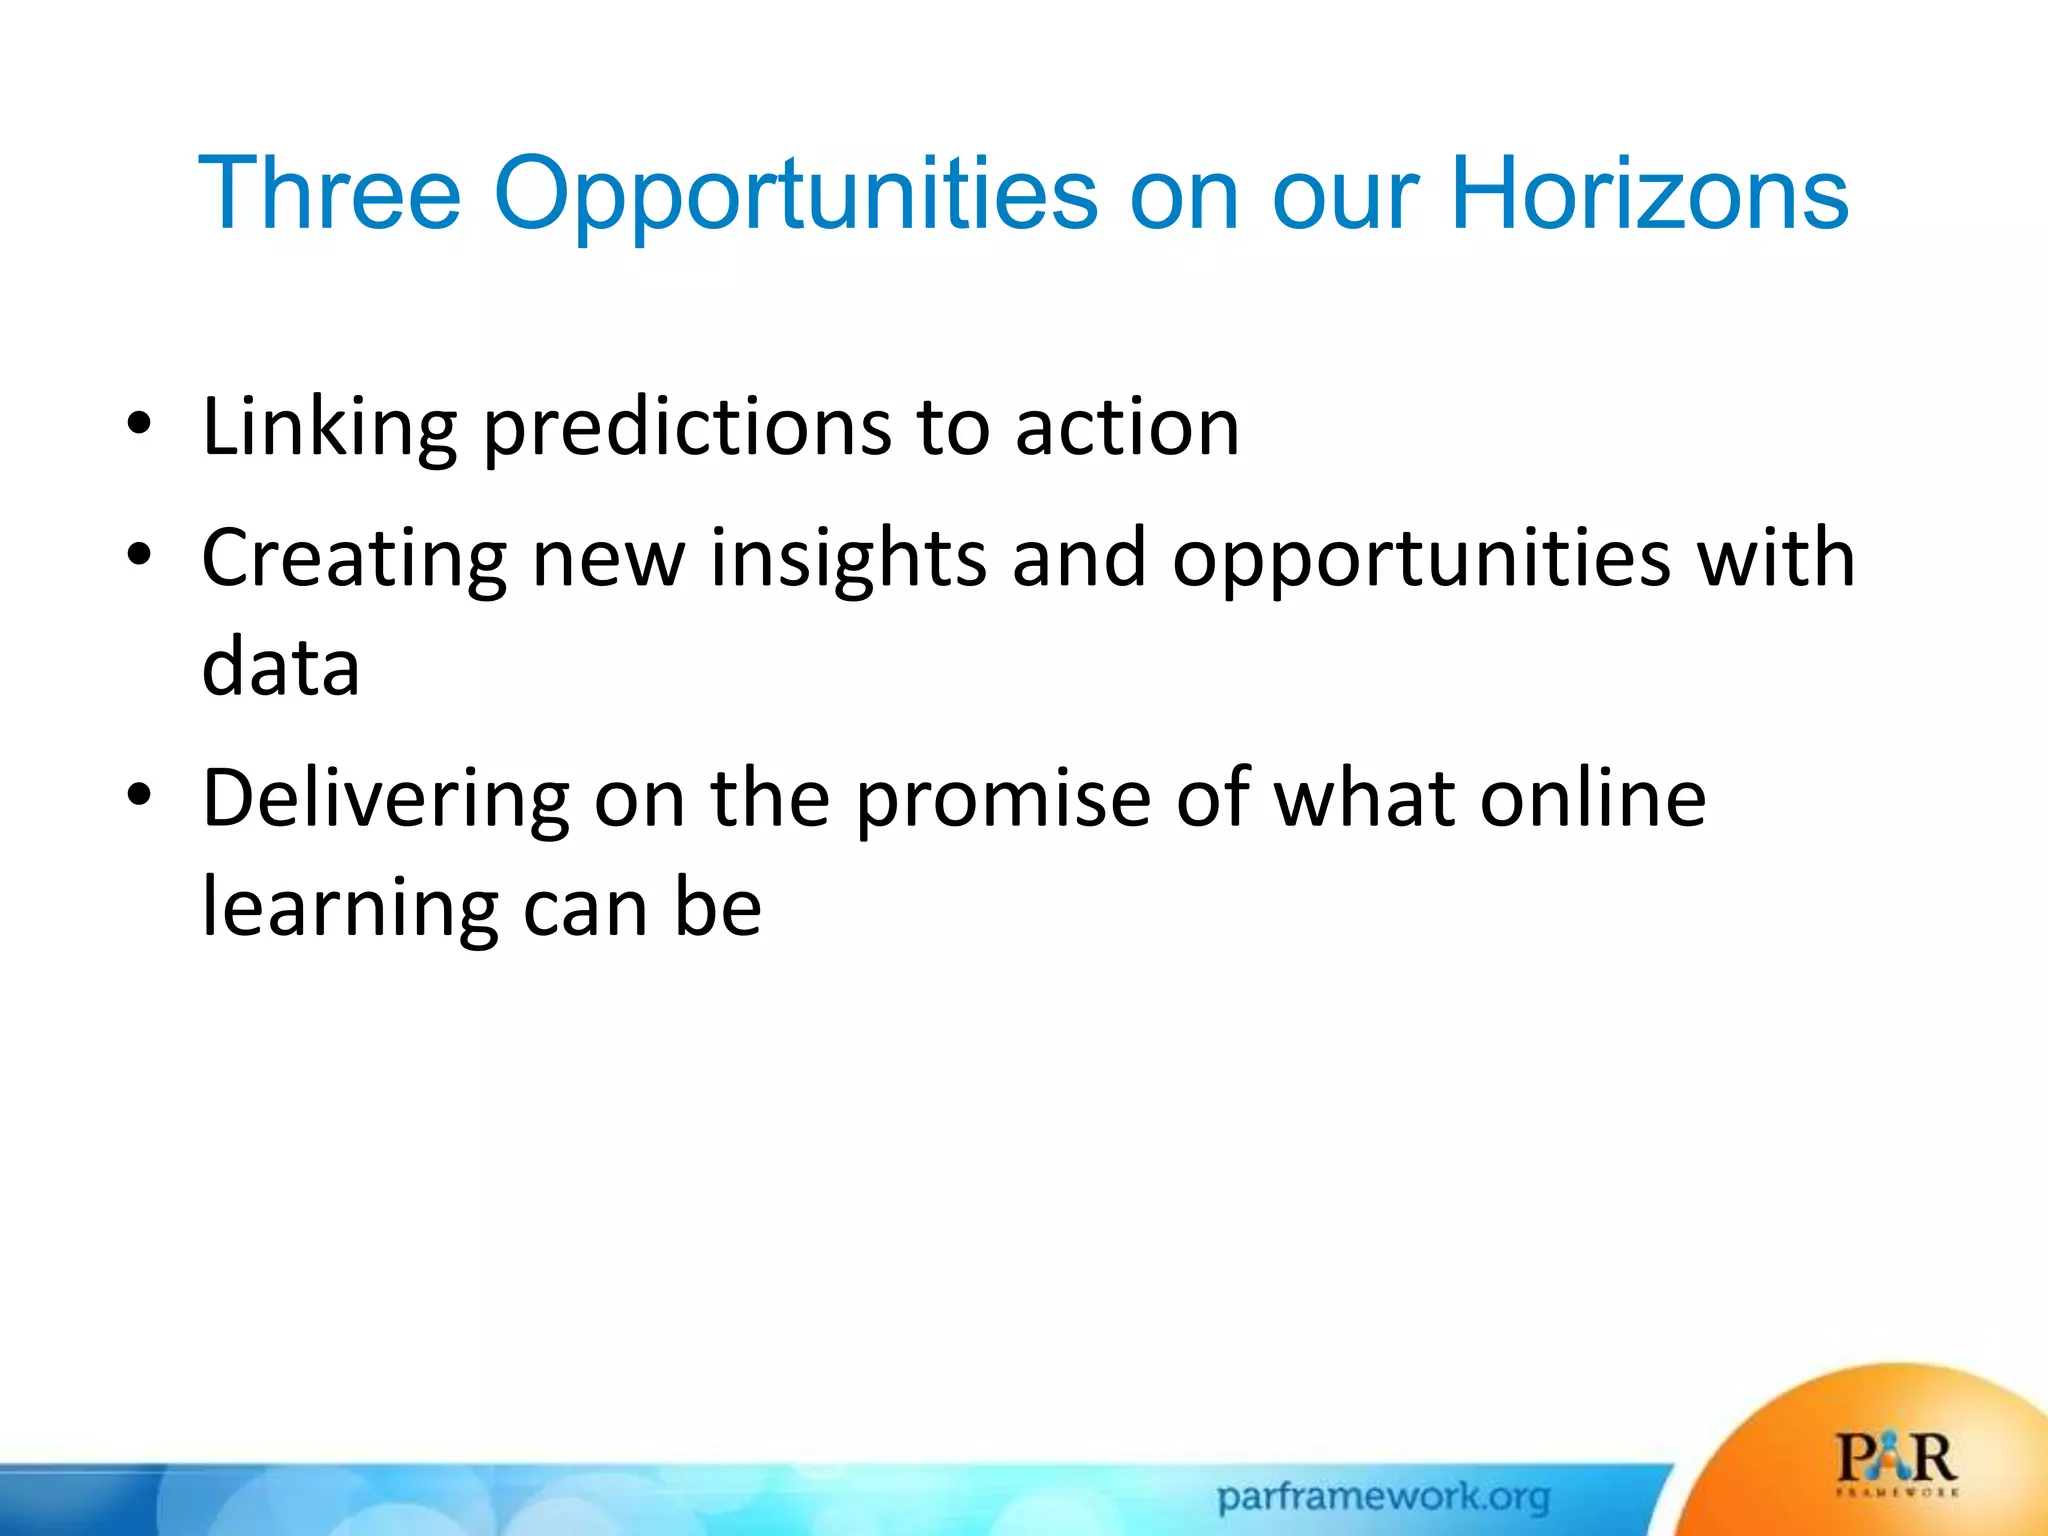
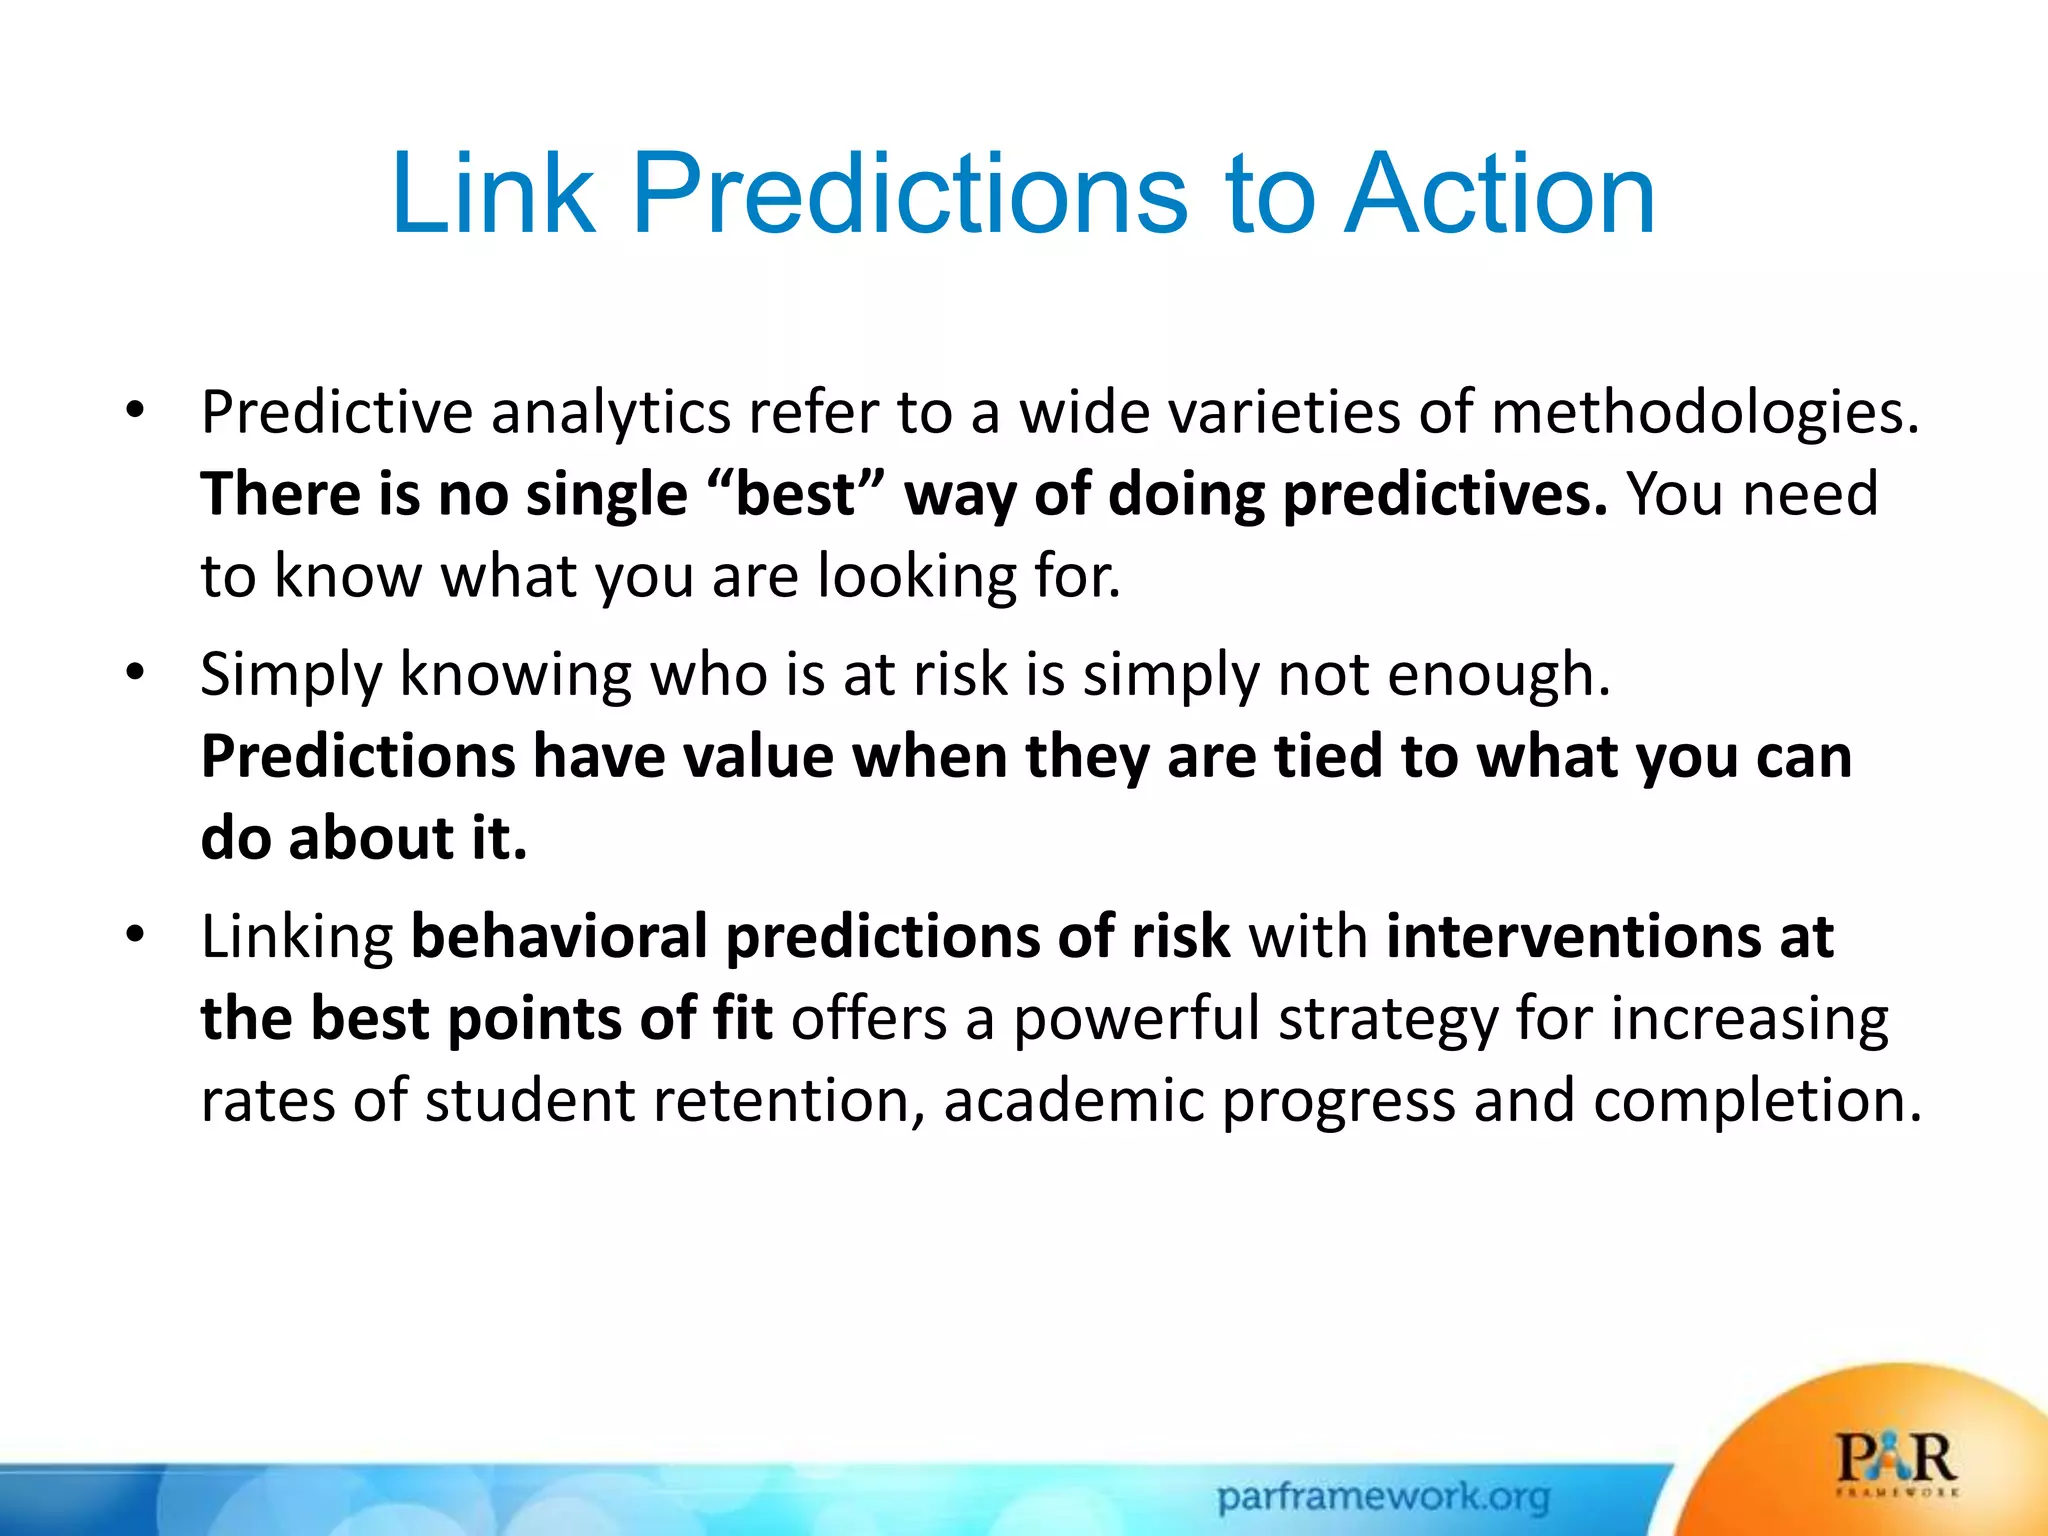
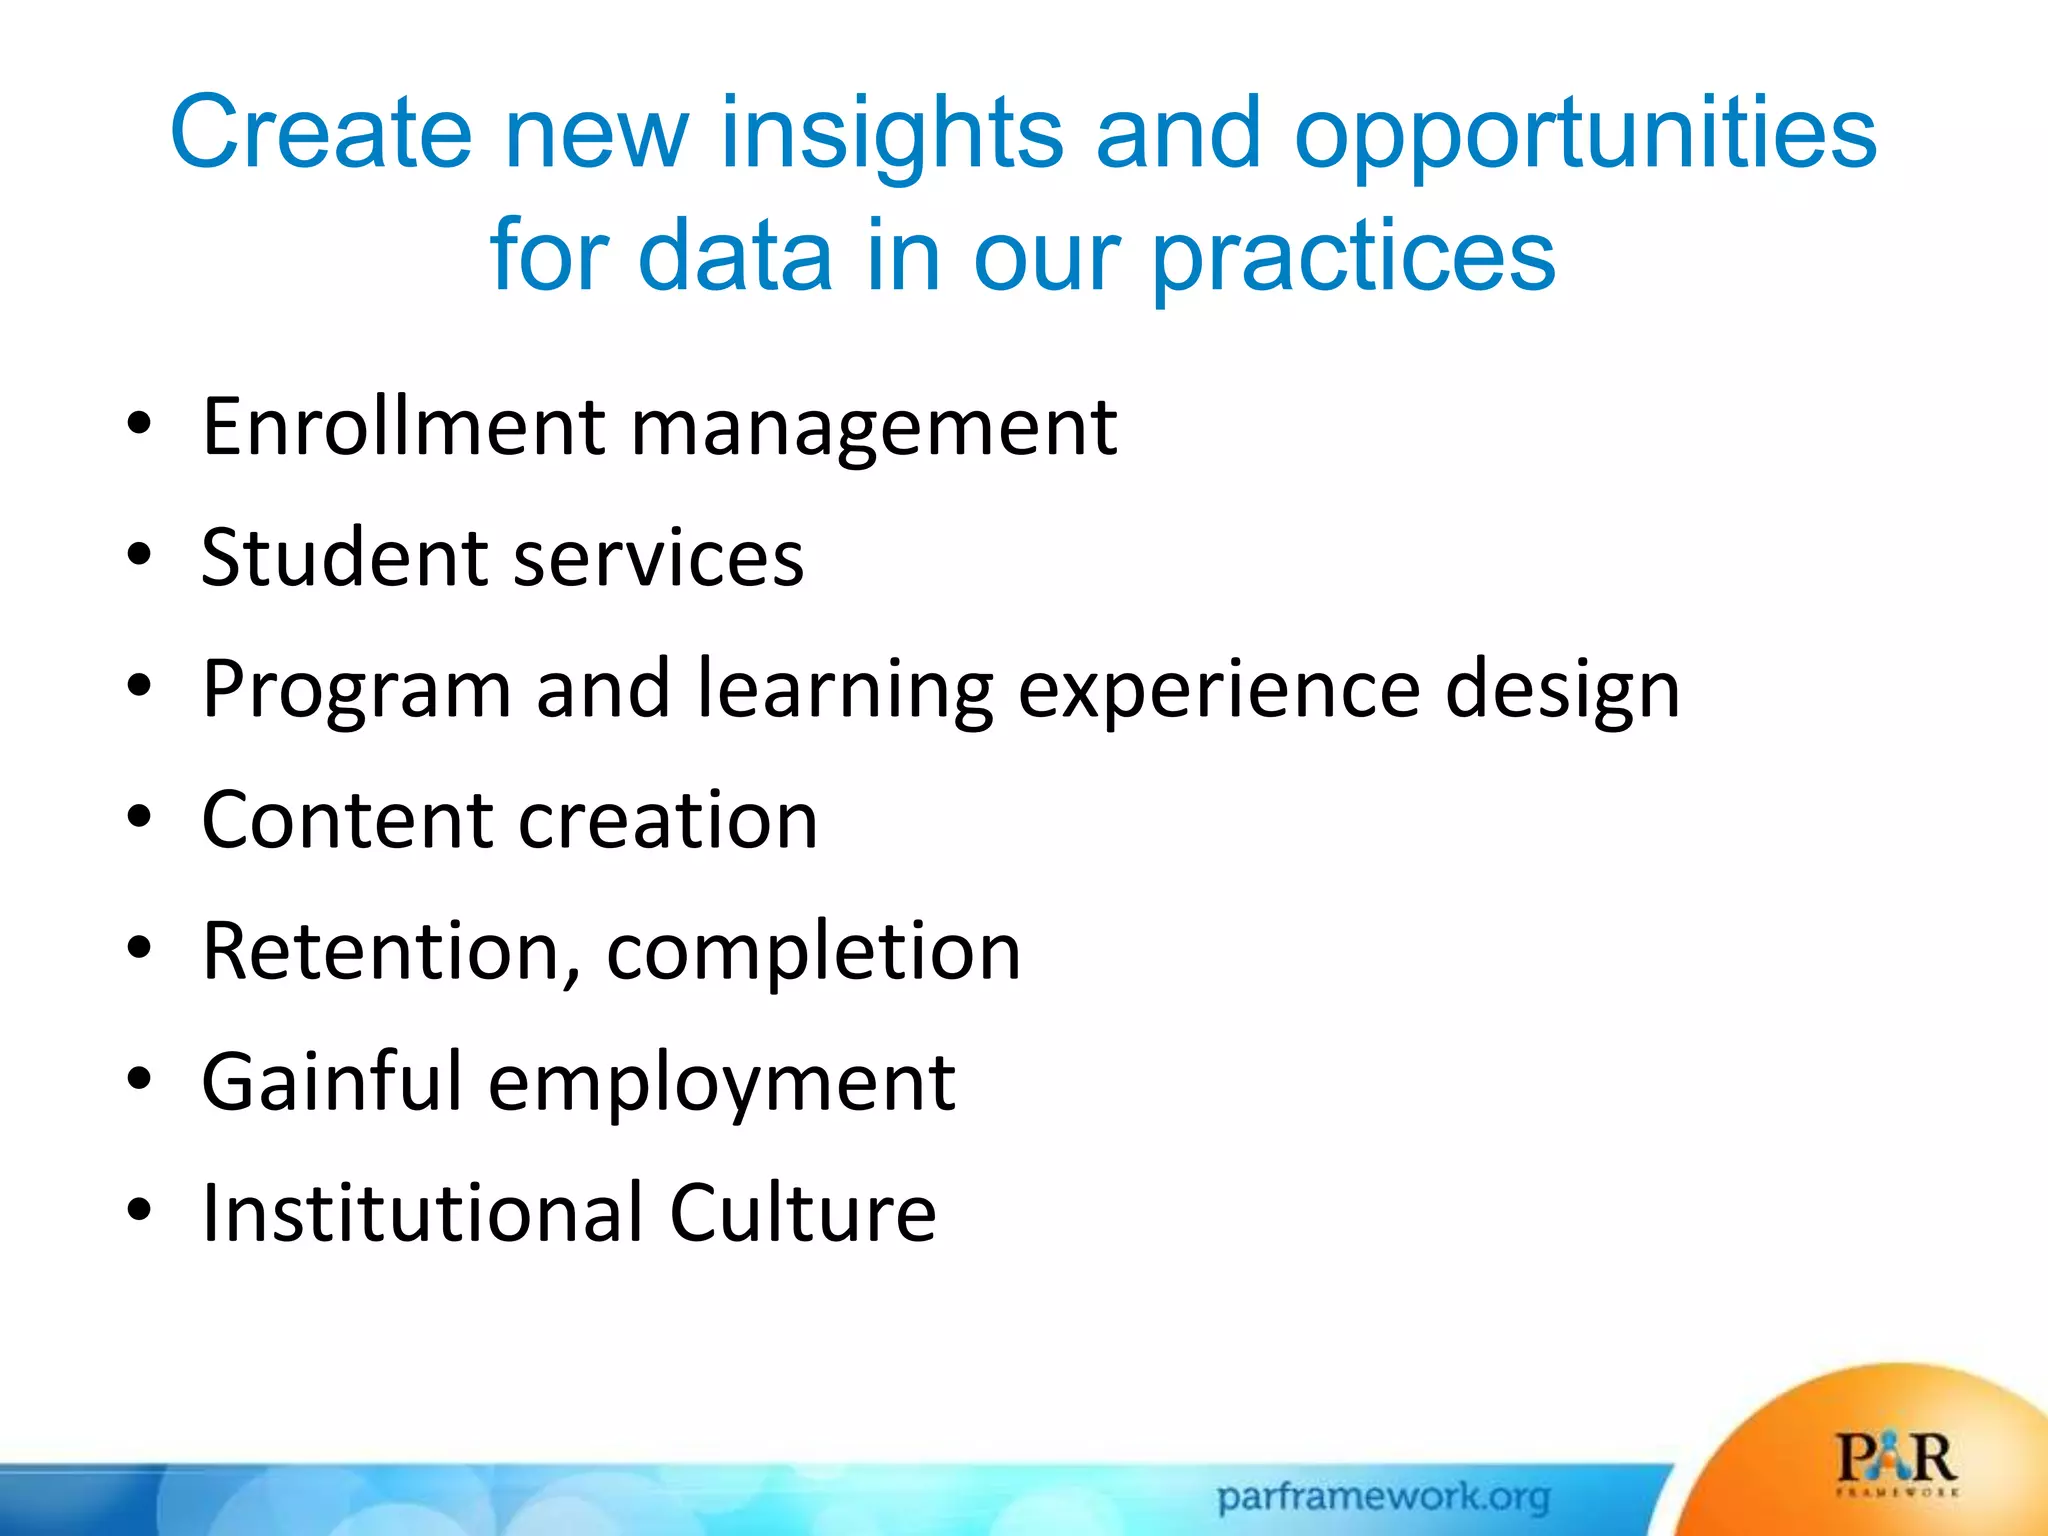
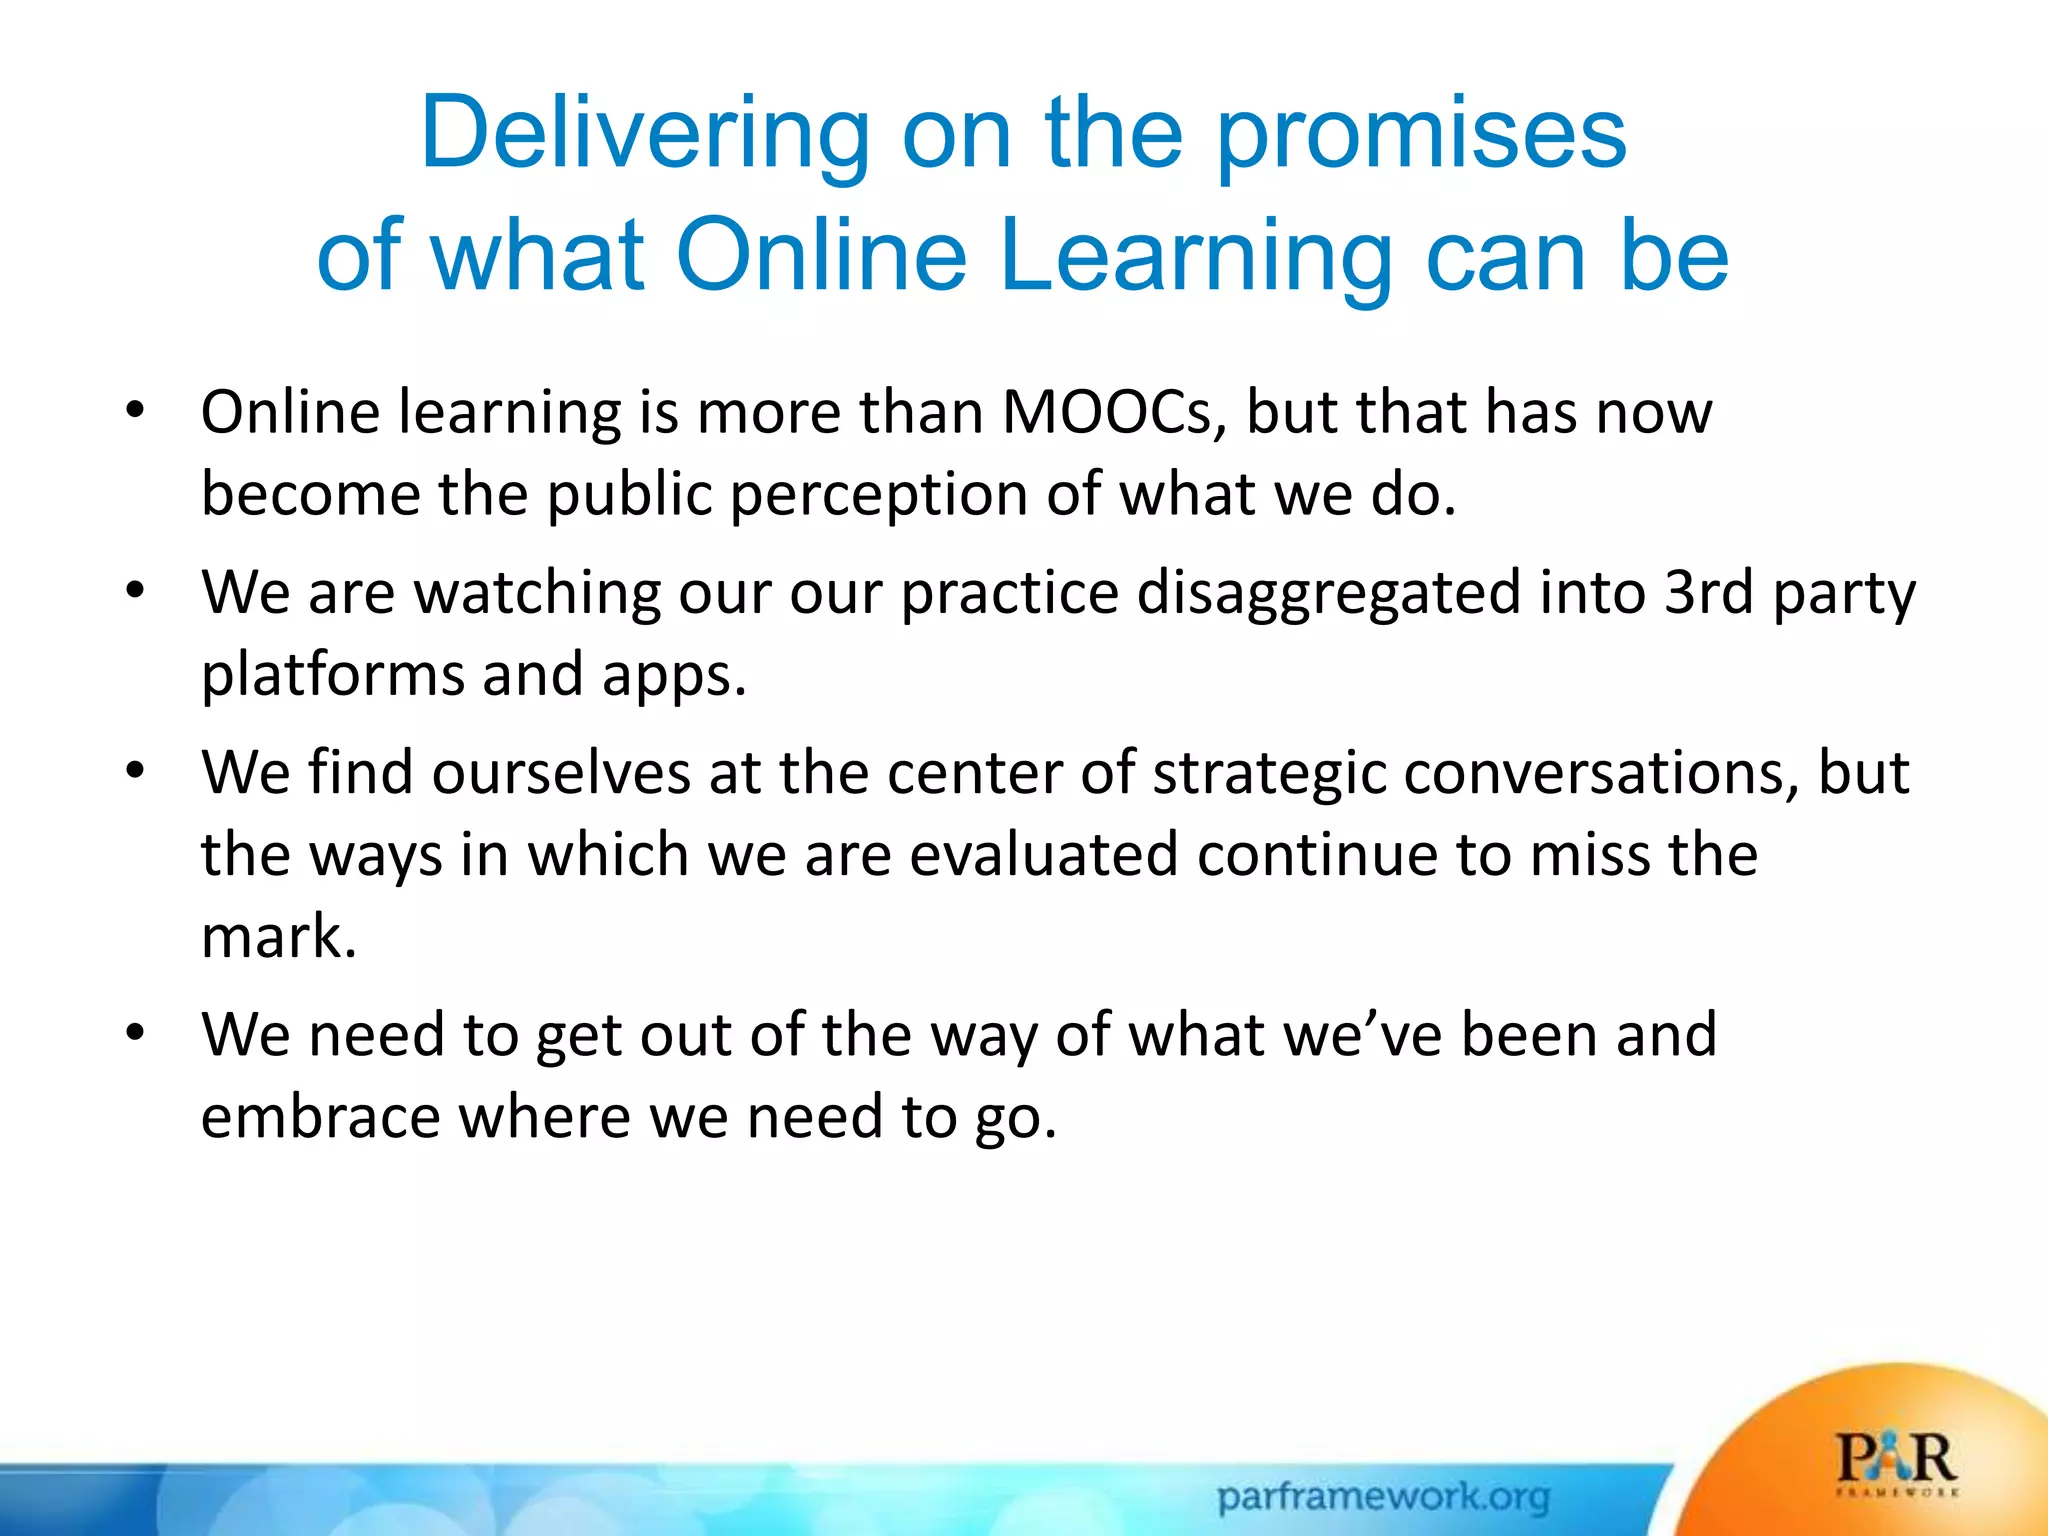
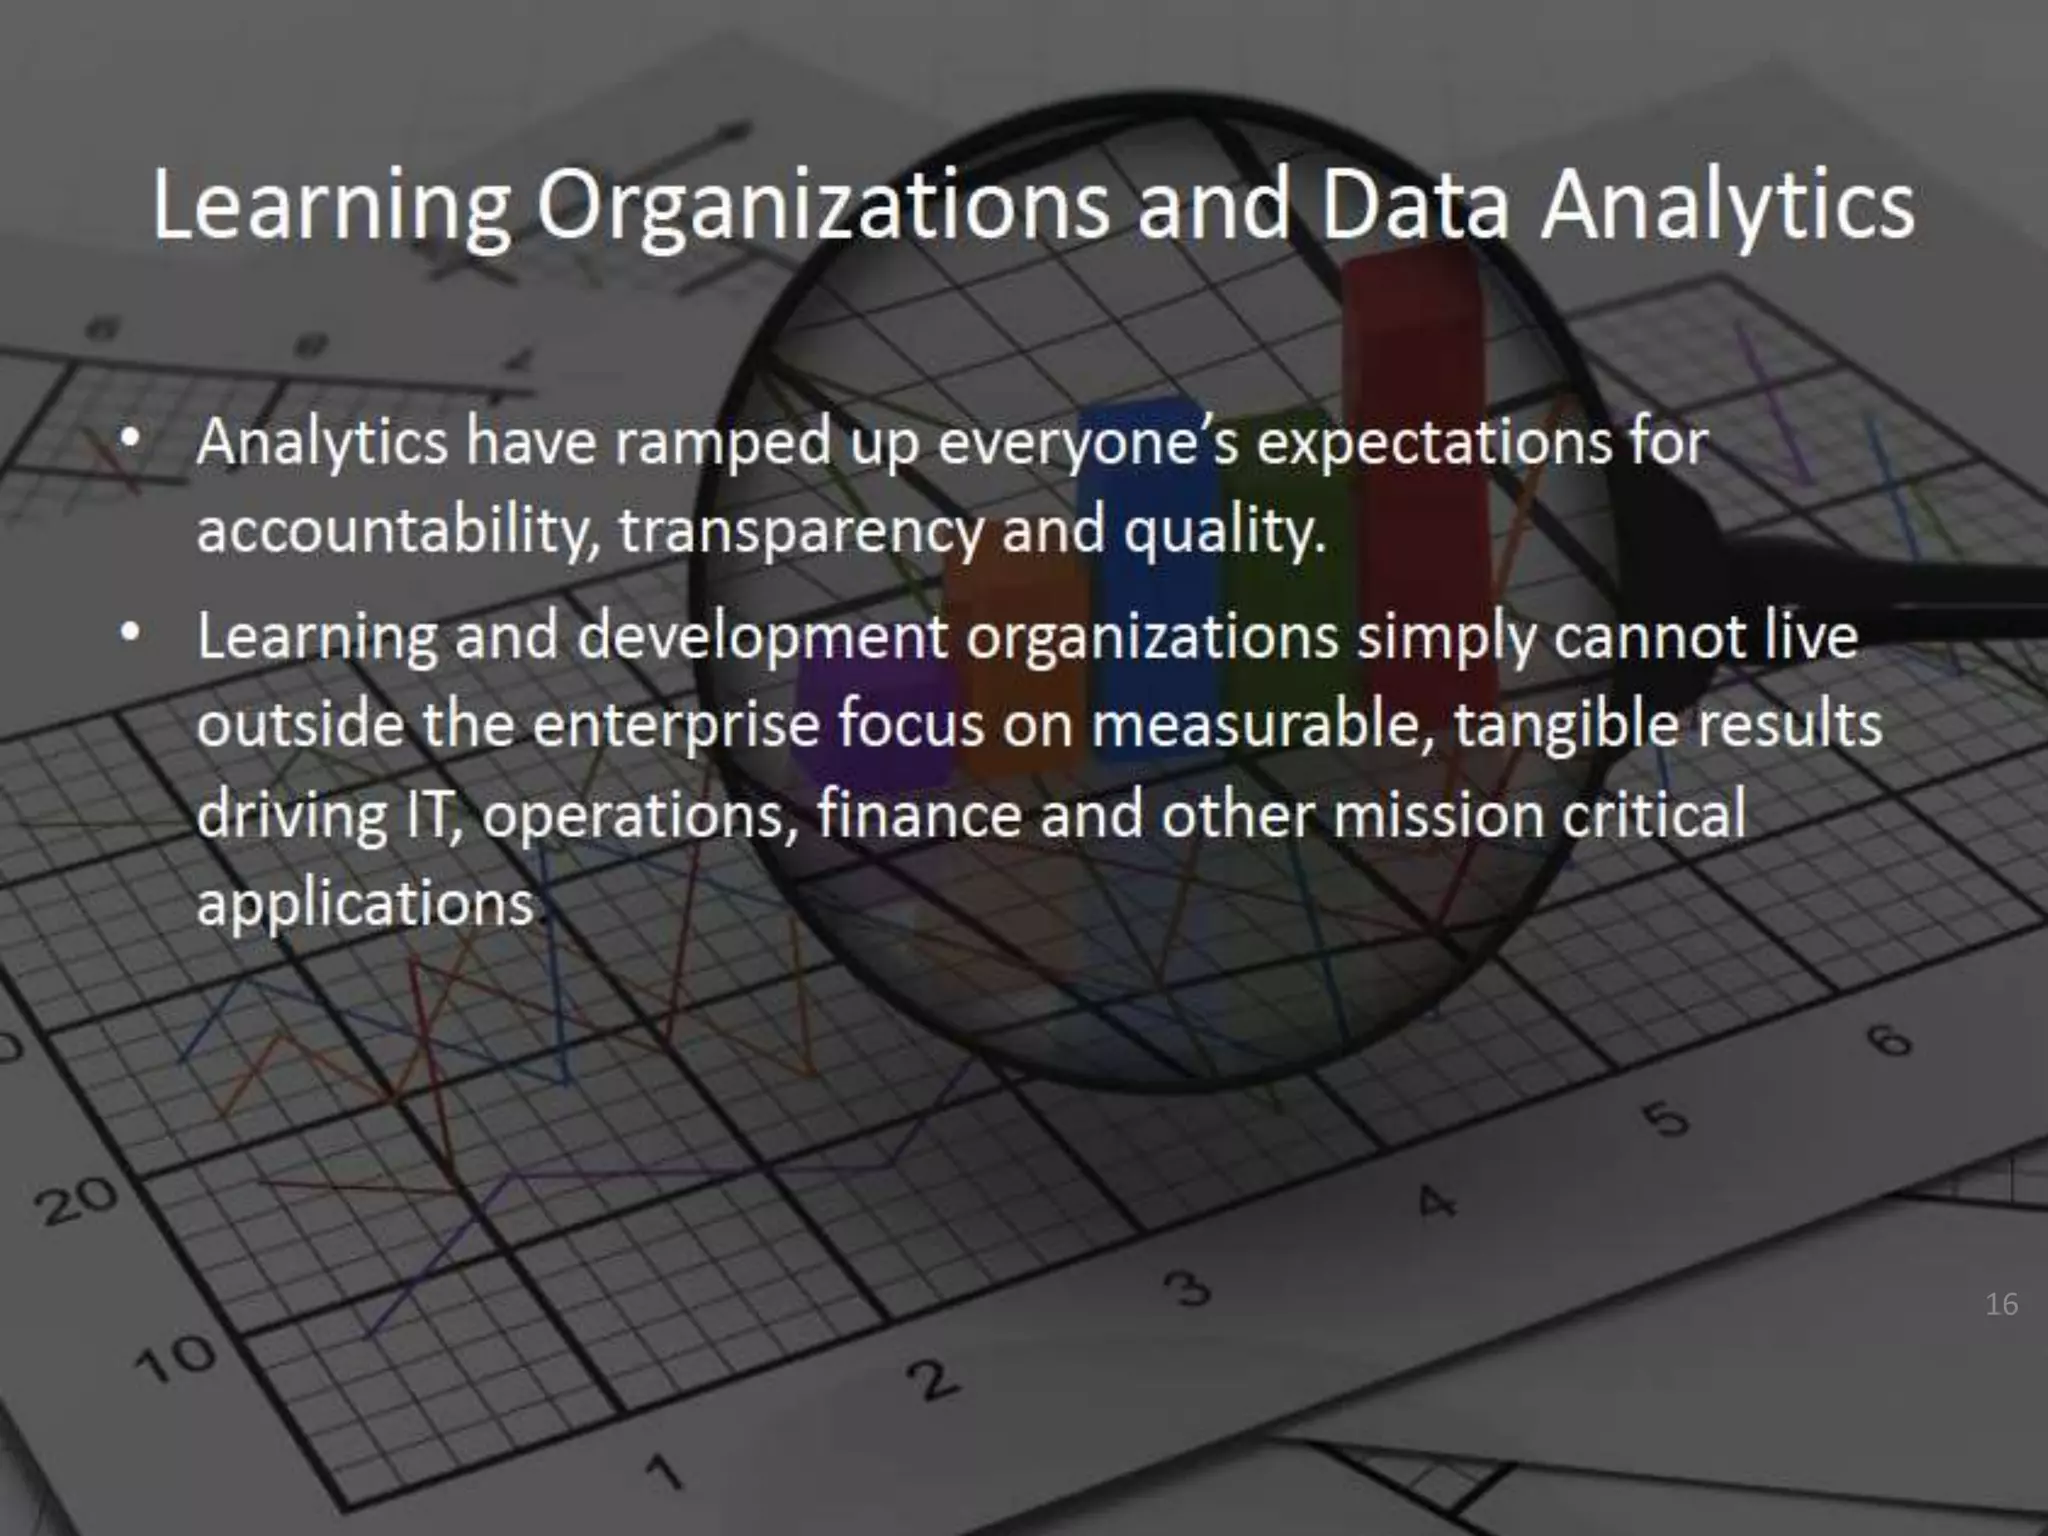
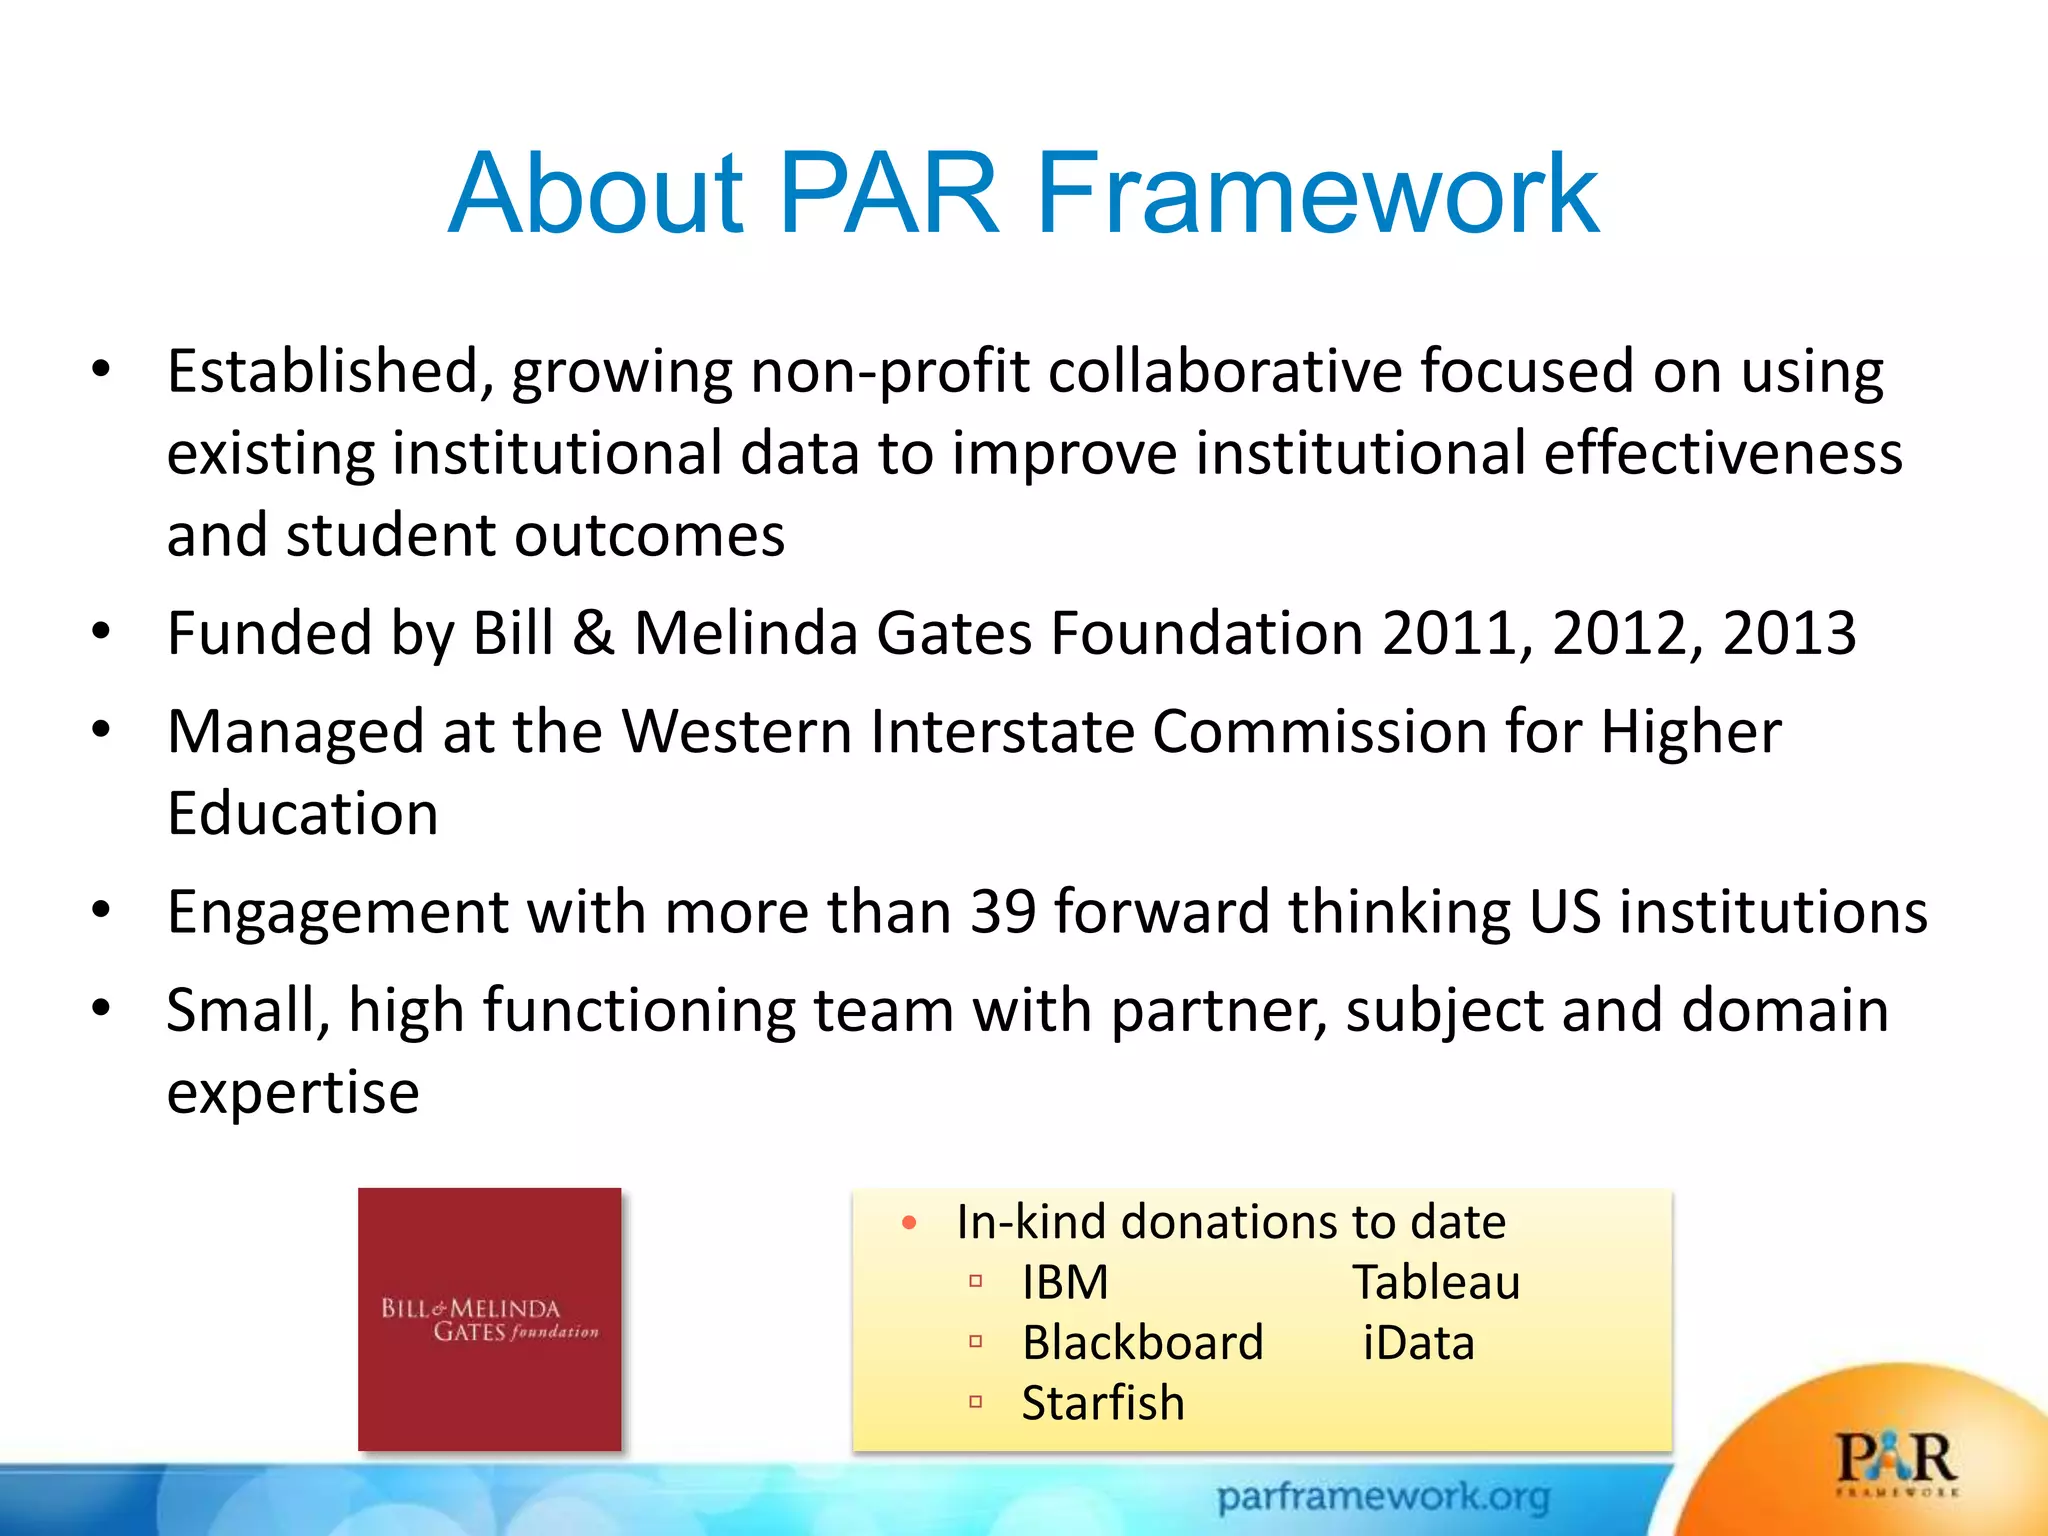
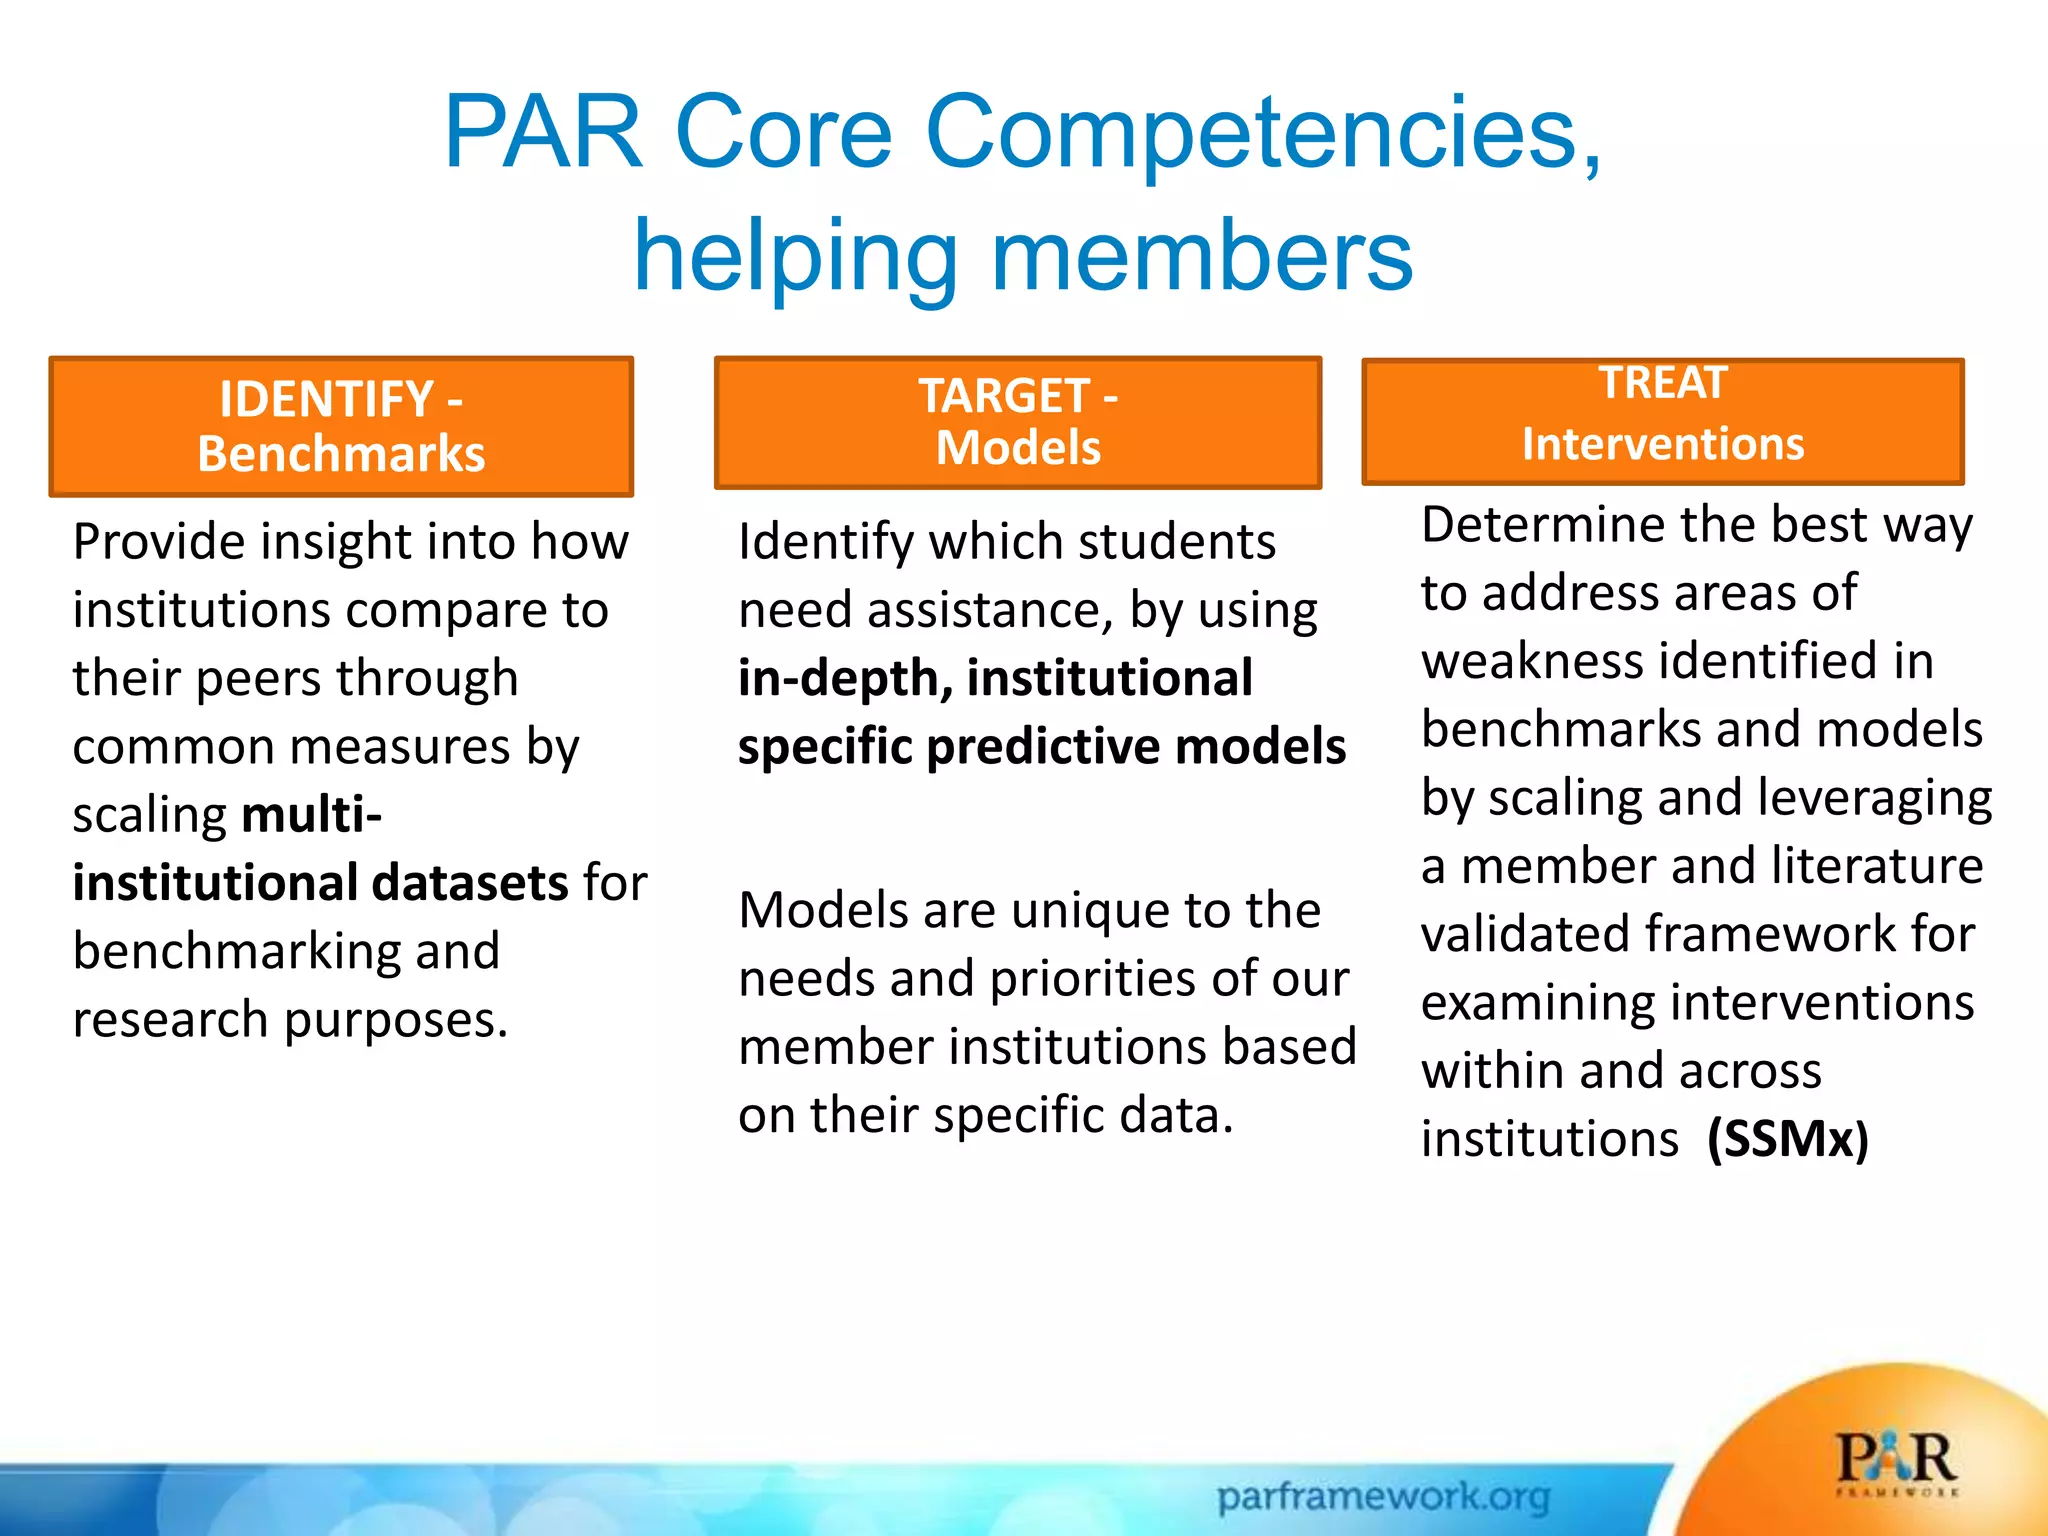
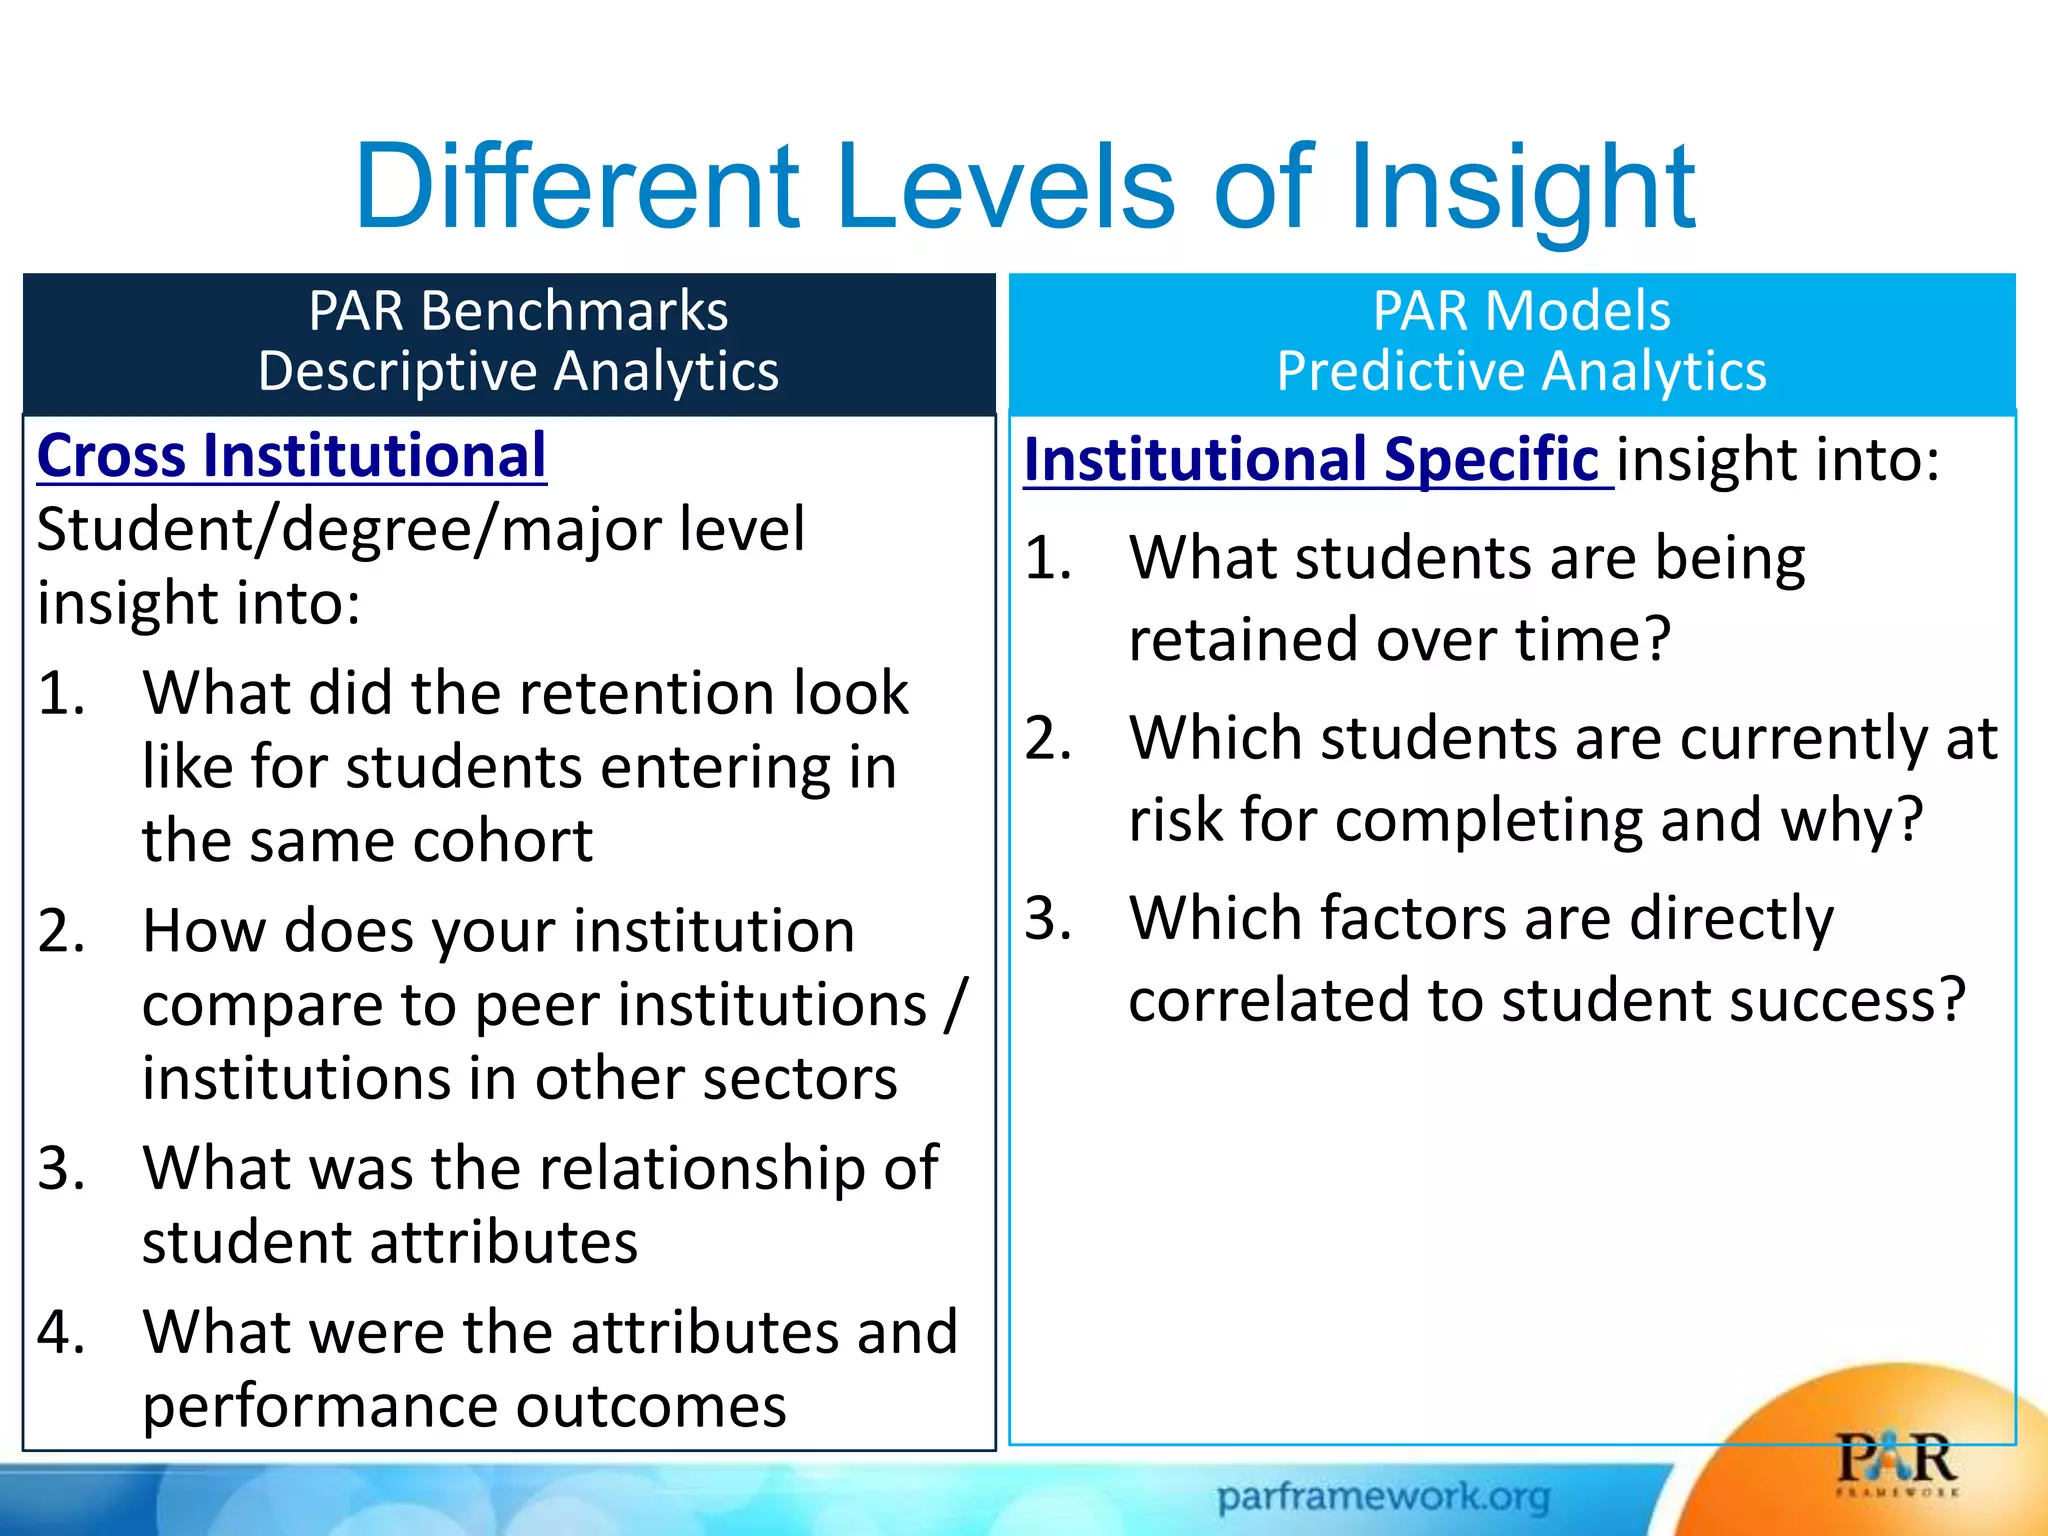
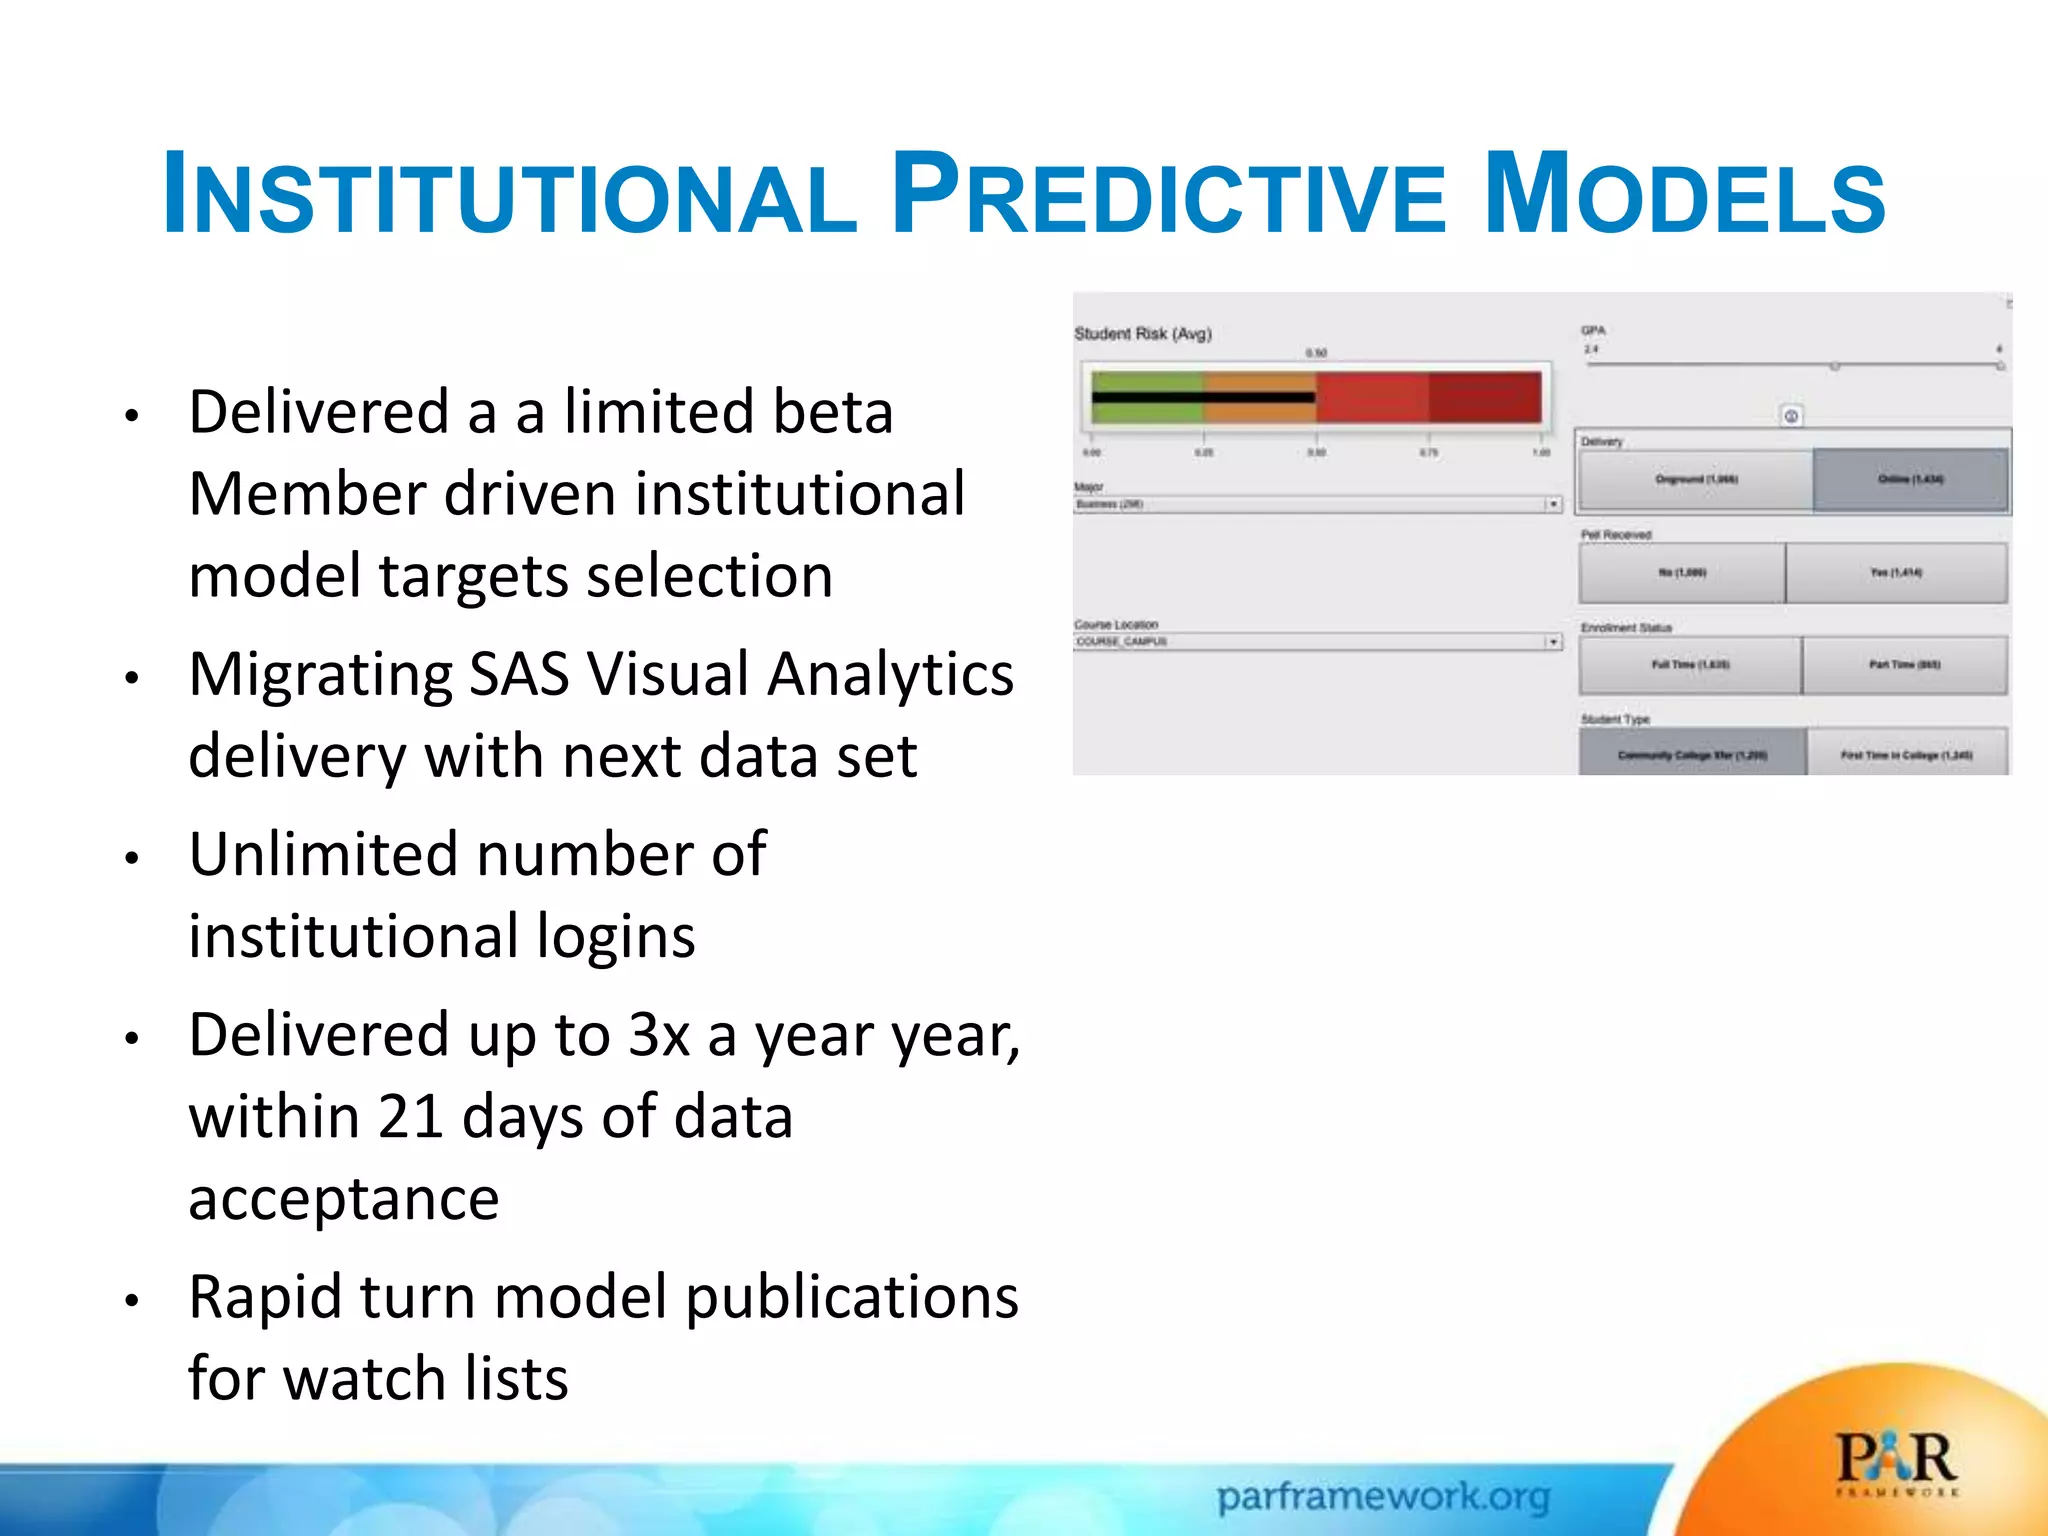
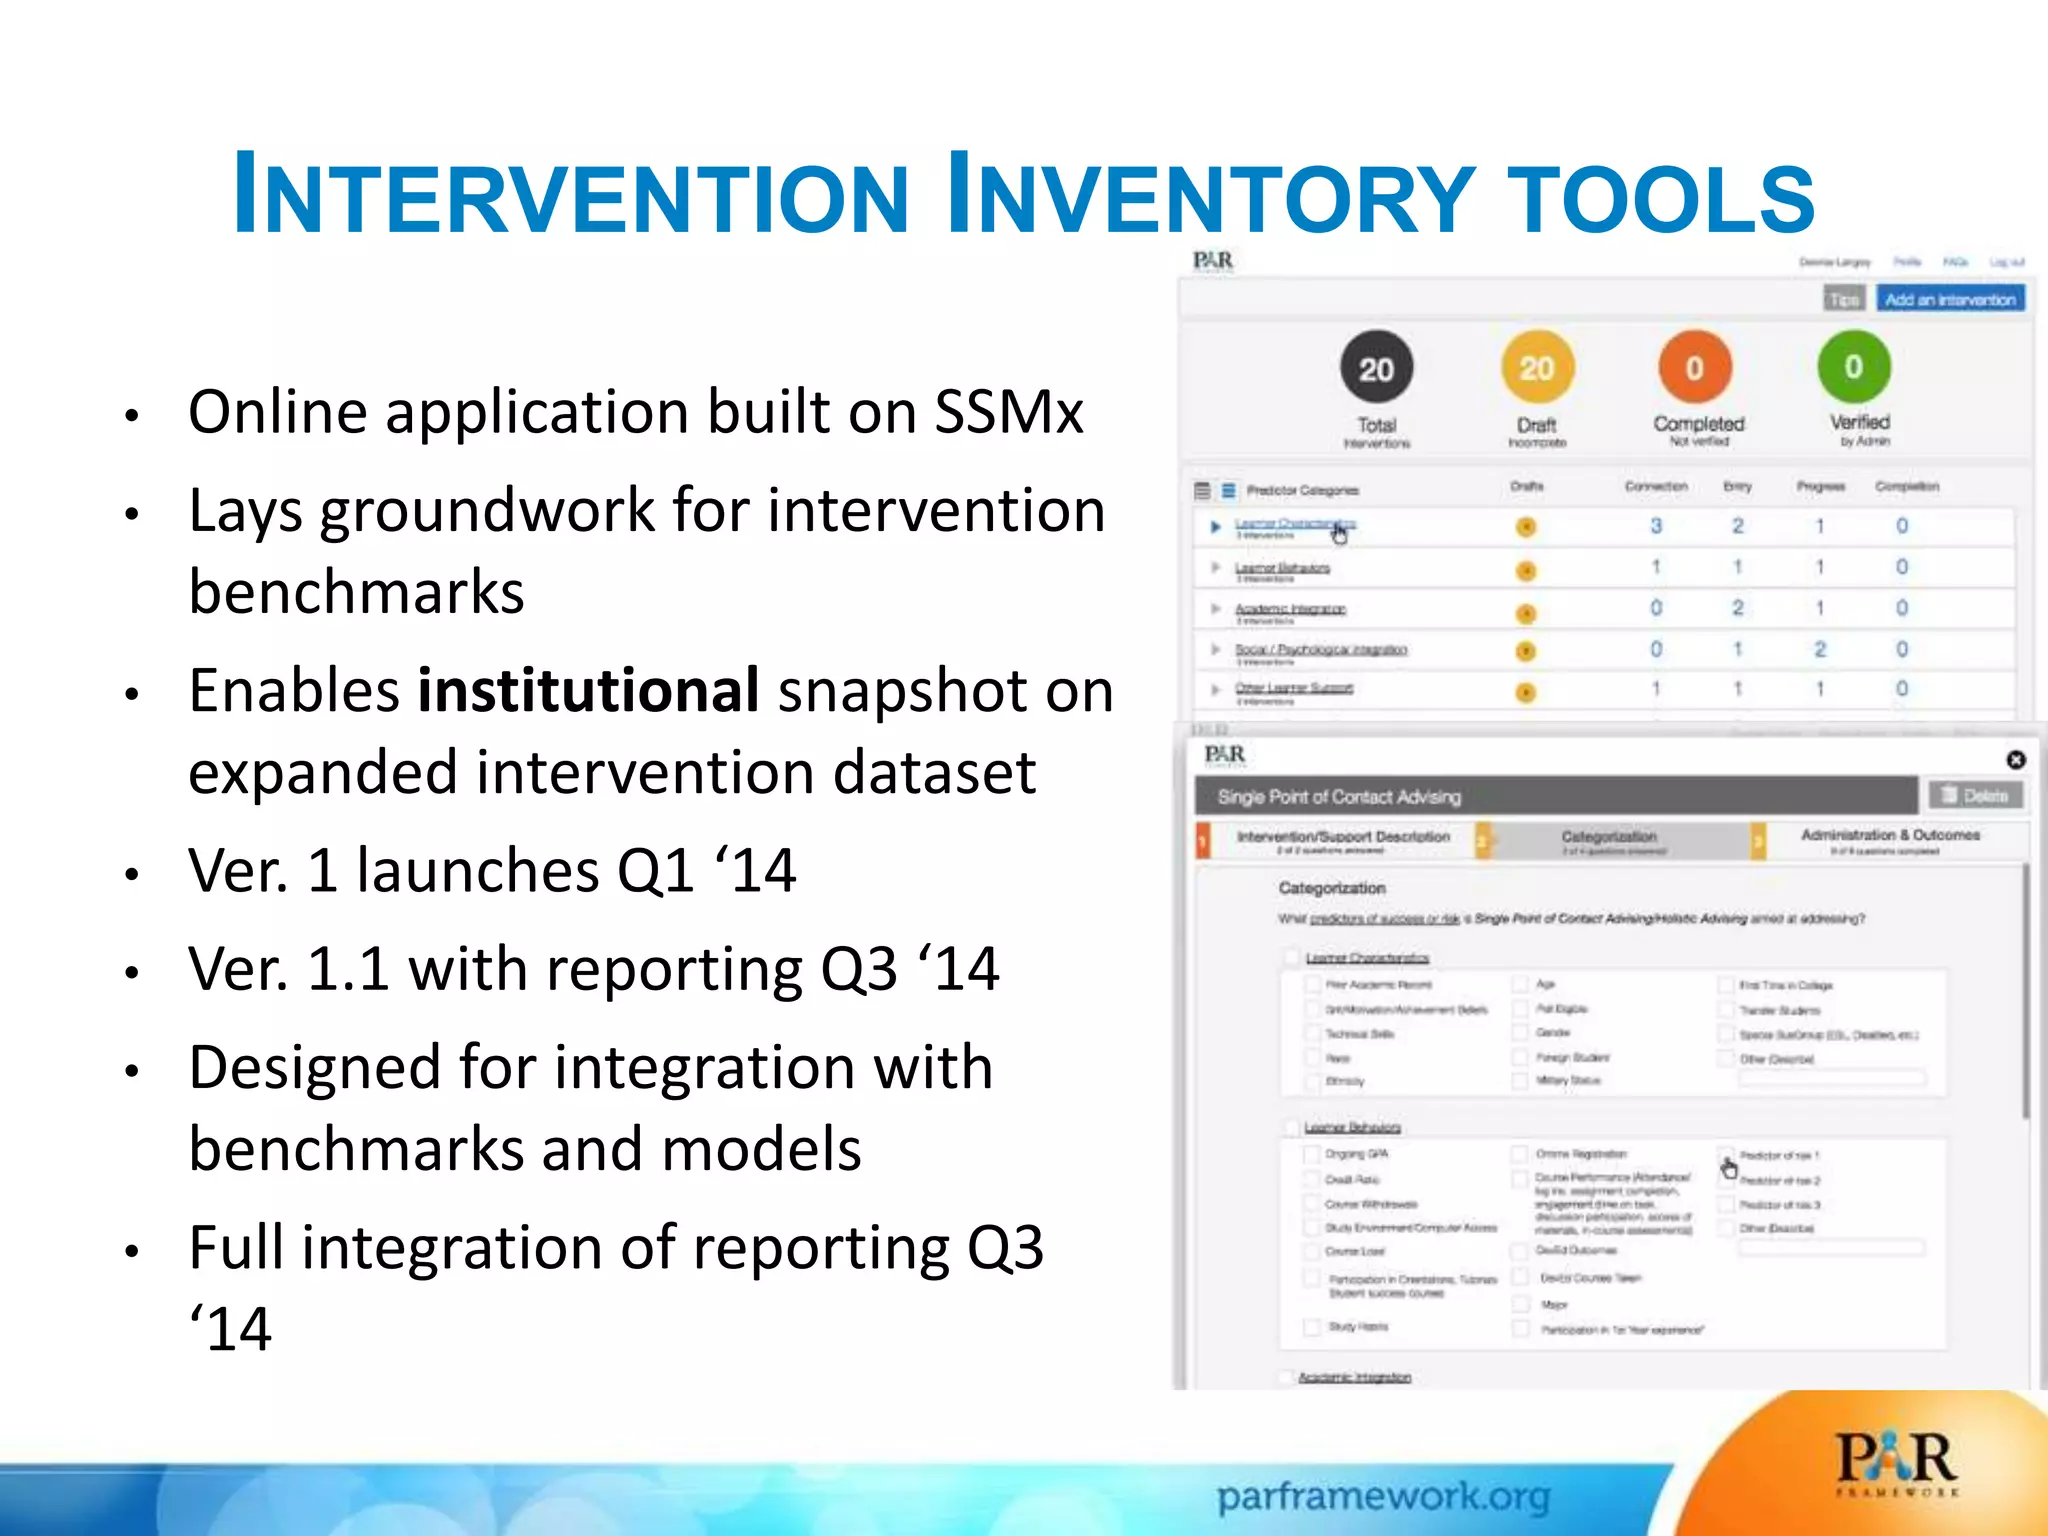
From Reporting to Insight to Action:
How Data are Changing Post-secondary Education
Ellen D. Wagner
Chief Strategy Officer, PAR Framework
Session Overview
• This session explores changing data sensibilities at US post-
secondary institutions. Particular attention is paid to how
predictive analytics are changing expectations for
institutional accountability and student success.
• Results from current work in postsecondary education show
that predictive modeling can effectively identify students at
risk.
• Is predicting risk enough to move the needle on risk
mitigation to improve student success?
• What does this mean for online learning?
Setting the Context:
Data Are Changing Everything
“Meh… education researchers have
always worked with data.”
• We do qualitative research with data
• We do quantitative research with data
• We do evaluations with data
• We develop surveys and instruments and experiments to
collect more data
• We pull data from LMSs, SISs, ERPs, CRMs …
• We write reports, summaries, make presentations, develop
articles and books and webcasts….
What is the one thing we don’t do???
Data
mining
Data Optimize Online Experience
The “digital breadcrumbs” that online technology users leave
about viewing, engagement and behaviors, interests
preferences provide massive amounts of information that
can be mined to better optimize online experience.
It’s about convenience, personalization, recommendations,
just-in-time, just-the-right-device.
What do we want?
The RIGHT Answers!!
When do we want them? NOW!!
Getting to the right answer takes work
• Analysis and model building is an
iterative process
• Around 70-80% efforts are spent
on data exploration and
understanding.
SAS Analysis/Modeling Process
Three Opportunities on our Horizons
• Linking predictions to action
• Creating new insights and opportunities with
data
• Delivering on the promise of what online
learning can be
Link Predictions to Action
• Predictive analytics refer to a wide varieties of methodologies.
There is no single “best” way of doing predictives. You need
to know what you are looking for.
• Simply knowing who is at risk is simply not enough.
Predictions have value when they are tied to what you can
do about it.
• Linking behavioral predictions of risk with interventions at
the best points of fit offers a powerful strategy for increasing
rates of student retention, academic progress and completion.
Create new insights and opportunities
for data in our practices
• Enrollment management
• Student services
• Program and learning experience design
• Content creation
• Retention, completion
• Gainful employment
• Institutional Culture
Delivering on the promises
of what Online Learning can be
• Online learning is more than MOOCs, but that has now
become the public perception of what we do.
• We are watching our our practice disaggregated into 3rd party
platforms and apps.
• We find ourselves at the center of strategic conversations, but
the ways in which we are evaluated continue to miss the
mark.
• We need to get out of the way of what we’ve been and
embrace where we need to go.
Online Learning as a Catalyst for
Changing Data Sensibilities
Sloan-C Babson, 2013
And yet……
Sloan-C Babson, 2013
Faculty still don’t trust it
Sloan-C Babson, 2013
16
How Are We Doing So Far?
• Data analytics are still emerging. Many organization still rely
on traditional technology (e.g. spreadsheets) and methods
(e.g. inferential statistics).
• Analytics tend to be used narrowly within departments and
business units, not integrated across the institutions.
• Intuition based on experience is still the driving factor in data-
driven decision-making. Analytics are used as a part of the
process.
17
Bloomberg BusinessWeek Research Services Analytics Insights (2014):
How Are We Doing So Far?
• Data is the number 1 challenge in the adoption and use of
analytics. Organization continue to struggle with data
accuracy, consistency, access.
• Analytics to solve big issues, with the primary focus on
reducing costs, improving the bottom line, managing risk.
• Many organizations lack the proper analytical talent.
Organizations that struggle with making good use of analytics
often don’t know how to apply the results.
• Culture plays a critical role in the effective use of data
analytics.
18
Collaborative
National
Multi-institutional
Non-profit
Institutional Effectiveness
+
Student Success
About PAR Framework
• Established, growing non-profit collaborative focused on using
existing institutional data to improve institutional effectiveness
and student outcomes
• Funded by Bill & Melinda Gates Foundation 2011, 2012, 2013
• Managed at the Western Interstate Commission for Higher
Education
• Engagement with more than 39 forward thinking US institutions
• Small, high functioning team with partner, subject and domain
expertise
• In-kind donations to date
▫ IBM Tableau
▫ Blackboard iData
▫ Starfish
DATA STATISTICS
• Total Counts Time Frame
• August 2009 – May 2013
– 13,090,351 course records
– 1,842,917 student records
PAR Objectives
Creating scalable solutions for institutional
effectiveness and student success through
-common data definitions
-common measures
-institutional collaboration
Structured, Readily Available Data
• Common data
definitions = reusable
predictive models and
meaningful
comparisons.
• Openly published via a
cc license @
https://public.datacook
book.com/public/institu
tions/par
Speak the
same
language
PAR Core Competencies,
helping members
IDENTIFY -
Benchmarks
Provide insight into how
institutions compare to
their peers through
common measures by
scaling multi-
institutional datasets for
benchmarking and
research purposes.
TARGET -
Models
Identify which students
need assistance, by using
in-depth, institutional
specific predictive models
Models are unique to the
needs and priorities of our
member institutions based
on their specific data.
Determine the best way
to address areas of
weakness identified in
benchmarks and models
by scaling and leveraging
a member and literature
validated framework for
examining interventions
within and across
institutions (SSMx)
TREAT
Interventions
Different Levels of Insight
Cross Institutional
Student/degree/major level
insight into:
1. What did the retention look
like for students entering in
the same cohort
2. How does your institution
compare to peer institutions /
institutions in other sectors
3. What was the relationship of
student attributes
4. What were the attributes and
performance outcomes
Institutional Specific insight into:
1. What students are being
retained over time?
2. Which students are currently at
risk for completing and why?
3. Which factors are directly
correlated to student success?
PAR Benchmarks
Descriptive Analytics
PAR Models
Predictive Analytics
DATA DELIVERY AND QA TOOLS
• Automated response and
self service Q1 2014
• 300 automated tests
BENCHMARKS
• Available now
• Unlimited institutional users
• Released November / May
• Member driven report
development
• Expanded report sets
• Releasing on tablets/devices
• Dynamic institution
INSTITUTIONAL PREDICTIVE MODELS
• Delivered a a limited beta
Member driven institutional
model targets selection
• Migrating SAS Visual Analytics
delivery with next data set
• Unlimited number of
institutional logins
• Delivered up to 3x a year year,
within 21 days of data
acceptance
• Rapid turn model publications
for watch lists
INTERVENTION INVENTORY TOOLS
• Online application built on SSMx
• Lays groundwork for intervention
benchmarks
• Enables institutional snapshot on
expanded intervention dataset
• Ver. 1 launches Q1 ‘14
• Ver. 1.1 with reporting Q3 ‘14
• Designed for integration with
benchmarks and models
• Full integration of reporting Q3
‘14
Thank you for interest
Ellen D. Wagner, Ph.D.
edwsonoma@gmail.com
ellen.wagner@parframework.org
http://.parframework.org
http://twitter.com/edwsonoma
+1.415.613.2690 mobile
31
From Reporting to Insight to Action

From Reporting to Insight to Action

  • 1.
    From Reporting toInsight to Action: How Data are Changing Post-secondary Education Ellen D. Wagner Chief Strategy Officer, PAR Framework
  • 2.
    Session Overview • Thissession explores changing data sensibilities at US post- secondary institutions. Particular attention is paid to how predictive analytics are changing expectations for institutional accountability and student success. • Results from current work in postsecondary education show that predictive modeling can effectively identify students at risk. • Is predicting risk enough to move the needle on risk mitigation to improve student success? • What does this mean for online learning?
  • 3.
    Setting the Context: DataAre Changing Everything
  • 4.
    “Meh… education researchershave always worked with data.” • We do qualitative research with data • We do quantitative research with data • We do evaluations with data • We develop surveys and instruments and experiments to collect more data • We pull data from LMSs, SISs, ERPs, CRMs … • We write reports, summaries, make presentations, develop articles and books and webcasts….
  • 5.
    What is theone thing we don’t do??? Data mining
  • 6.
    Data Optimize OnlineExperience The “digital breadcrumbs” that online technology users leave about viewing, engagement and behaviors, interests preferences provide massive amounts of information that can be mined to better optimize online experience. It’s about convenience, personalization, recommendations, just-in-time, just-the-right-device.
  • 7.
    What do wewant? The RIGHT Answers!! When do we want them? NOW!!
  • 8.
    Getting to theright answer takes work • Analysis and model building is an iterative process • Around 70-80% efforts are spent on data exploration and understanding. SAS Analysis/Modeling Process
  • 9.
    Three Opportunities onour Horizons • Linking predictions to action • Creating new insights and opportunities with data • Delivering on the promise of what online learning can be
  • 10.
    Link Predictions toAction • Predictive analytics refer to a wide varieties of methodologies. There is no single “best” way of doing predictives. You need to know what you are looking for. • Simply knowing who is at risk is simply not enough. Predictions have value when they are tied to what you can do about it. • Linking behavioral predictions of risk with interventions at the best points of fit offers a powerful strategy for increasing rates of student retention, academic progress and completion.
  • 11.
    Create new insightsand opportunities for data in our practices • Enrollment management • Student services • Program and learning experience design • Content creation • Retention, completion • Gainful employment • Institutional Culture
  • 12.
    Delivering on thepromises of what Online Learning can be • Online learning is more than MOOCs, but that has now become the public perception of what we do. • We are watching our our practice disaggregated into 3rd party platforms and apps. • We find ourselves at the center of strategic conversations, but the ways in which we are evaluated continue to miss the mark. • We need to get out of the way of what we’ve been and embrace where we need to go.
  • 13.
    Online Learning asa Catalyst for Changing Data Sensibilities Sloan-C Babson, 2013
  • 14.
  • 15.
    Faculty still don’ttrust it Sloan-C Babson, 2013
  • 16.
  • 17.
    How Are WeDoing So Far? • Data analytics are still emerging. Many organization still rely on traditional technology (e.g. spreadsheets) and methods (e.g. inferential statistics). • Analytics tend to be used narrowly within departments and business units, not integrated across the institutions. • Intuition based on experience is still the driving factor in data- driven decision-making. Analytics are used as a part of the process. 17 Bloomberg BusinessWeek Research Services Analytics Insights (2014):
  • 18.
    How Are WeDoing So Far? • Data is the number 1 challenge in the adoption and use of analytics. Organization continue to struggle with data accuracy, consistency, access. • Analytics to solve big issues, with the primary focus on reducing costs, improving the bottom line, managing risk. • Many organizations lack the proper analytical talent. Organizations that struggle with making good use of analytics often don’t know how to apply the results. • Culture plays a critical role in the effective use of data analytics. 18
  • 19.
  • 20.
    About PAR Framework •Established, growing non-profit collaborative focused on using existing institutional data to improve institutional effectiveness and student outcomes • Funded by Bill & Melinda Gates Foundation 2011, 2012, 2013 • Managed at the Western Interstate Commission for Higher Education • Engagement with more than 39 forward thinking US institutions • Small, high functioning team with partner, subject and domain expertise • In-kind donations to date ▫ IBM Tableau ▫ Blackboard iData ▫ Starfish
  • 21.
    DATA STATISTICS • TotalCounts Time Frame • August 2009 – May 2013 – 13,090,351 course records – 1,842,917 student records
  • 22.
    PAR Objectives Creating scalablesolutions for institutional effectiveness and student success through -common data definitions -common measures -institutional collaboration
  • 23.
    Structured, Readily AvailableData • Common data definitions = reusable predictive models and meaningful comparisons. • Openly published via a cc license @ https://public.datacook book.com/public/institu tions/par
  • 24.
  • 25.
    PAR Core Competencies, helpingmembers IDENTIFY - Benchmarks Provide insight into how institutions compare to their peers through common measures by scaling multi- institutional datasets for benchmarking and research purposes. TARGET - Models Identify which students need assistance, by using in-depth, institutional specific predictive models Models are unique to the needs and priorities of our member institutions based on their specific data. Determine the best way to address areas of weakness identified in benchmarks and models by scaling and leveraging a member and literature validated framework for examining interventions within and across institutions (SSMx) TREAT Interventions
  • 26.
    Different Levels ofInsight Cross Institutional Student/degree/major level insight into: 1. What did the retention look like for students entering in the same cohort 2. How does your institution compare to peer institutions / institutions in other sectors 3. What was the relationship of student attributes 4. What were the attributes and performance outcomes Institutional Specific insight into: 1. What students are being retained over time? 2. Which students are currently at risk for completing and why? 3. Which factors are directly correlated to student success? PAR Benchmarks Descriptive Analytics PAR Models Predictive Analytics
  • 27.
    DATA DELIVERY ANDQA TOOLS • Automated response and self service Q1 2014 • 300 automated tests
  • 28.
    BENCHMARKS • Available now •Unlimited institutional users • Released November / May • Member driven report development • Expanded report sets • Releasing on tablets/devices • Dynamic institution
  • 29.
    INSTITUTIONAL PREDICTIVE MODELS •Delivered a a limited beta Member driven institutional model targets selection • Migrating SAS Visual Analytics delivery with next data set • Unlimited number of institutional logins • Delivered up to 3x a year year, within 21 days of data acceptance • Rapid turn model publications for watch lists
  • 30.
    INTERVENTION INVENTORY TOOLS •Online application built on SSMx • Lays groundwork for intervention benchmarks • Enables institutional snapshot on expanded intervention dataset • Ver. 1 launches Q1 ‘14 • Ver. 1.1 with reporting Q3 ‘14 • Designed for integration with benchmarks and models • Full integration of reporting Q3 ‘14
  • 31.
    Thank you forinterest Ellen D. Wagner, Ph.D. edwsonoma@gmail.com ellen.wagner@parframework.org http://.parframework.org http://twitter.com/edwsonoma +1.415.613.2690 mobile 31