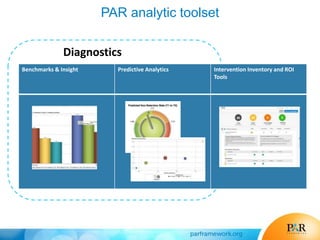
This document discusses how analytics can be used to improve student success. It begins by describing a session that shows how analytics identify opportunities to improve student success. Participants will learn how to connect predictions of risk to interventions most likely to work under different conditions. The document then discusses how data is changing education and how analytics can be applied in areas like enrollment management, student services, and program design. It provides examples of how predictive analytics have been used at various institutions to improve retention, successful course completion, and graduation rates. The document emphasizes linking predictions of risk to specific interventions and measuring the impact and ROI of different interventions.
Educational Data Mining in Program Evaluation: Lessons LearnedKerry Rice
AET 2016 Researchers present findings from a series of data mining studies, primarily examining data mining as part of an innovative triangulated approach in program evaluation. Findings suggest that is it possible to apply EDM techniques in online and blended learning classrooms to identify key variables important to the success of learners. Lessons learned will be shared as well as areas for improving data collection in learning management systems for meaningful analysis and visualization.
Ellen Wagner, Executive Director, WCET.
Putting Data to Work
This session explores changing data sensibilities at US post-secondary institutions with particular attention paid to how predictive analytics are changing expectations for institutional accountability and student success. Results from the Predictive Analytics Reporting Framework show that predictive modeling can identify students at risk and that linking behavioral predictions of risk with interventions to mitigate those risks at the point of need is a powerful strategy for increasing rates of student retention, academic progress and completion.
presentation at the 15th annual SLN SOLsummit February 27, 2014
http://slnsolsummit2014.edublogs.org/
The Role of Non-Cognitive Indicators in Predictive and Proactive Analytics: T...SmarterServices Owen
We have all heard of IQ—but what about the importance of SQ and EQ? Join SmarterServices and Nuro Retention to learn more about how your students’ social and emotional non-cognitive data directly impacts student success and educational outcomes. Nuro Retention will share how to make BIG data actionable by combining the power of SmarterMeasure Learning Readiness Indicator's non-cognitive data along with its retention software platform and predictive analytics models.
In addition, Dr. Mac Adkins, CEO and founder of SmarterServices, will share a case study on how Ashford University has been able to improve retention rates using the power of non-cognitive data. Nuro Chief Data Scientist Natalie Young will also share some key findings from a recent predictive analytics model that dramatically improved retention efforts for one of Nuro’s clients.
Don’t miss out on your chance to learn the latest strategies on the power of predictive, proactive, and prescriptive data!
Blackboard’s data science team conducts large-scale analysis of the relationship between the use of our academic technologies and student impact, in order to inform product design, disseminate effective practices, and advance the base of empirical research in educational technologies.
In this presentation, John Whitmer, Director of Analytics & Research, will discuss findings from 2016. Some findings challenge our conventional knowledge, while others confirm what we believed to be true.
Archived presentation made to JISC Learning Analytics workgroup on Feb 22, 2017
Open Academic Analytics Initiative - Campus Technology Innovator Award Presen...Joshua
The Open Academic Analytics Initiative (OAAI) has developed an open-source academic early alert system using Sakai and Pentaho, an open-source Business Intelligence tool, designed to identify students who are at risk to not complete their courses? successfully and then deploy an intervention intended to help the student succeed. The system includes a predictive model which has been released under an open-source license using a standard markup Language to facilitate use and enhancement by others. The system has been deployed to over 2200 students across four different institutions. Based on these pilots, research on critical scaling factors such as the ?portability? of such predictive models and success of intervention strategies has been conducted. Our presentation will update the community on this initiative and our latest research findings as well as discuss future work.
Education plays a vital role in nation’s overall development process. To be effective, analysis must be timely and cope with data scales. The scale of the data and the rates at which they arrive make manual inspection infeasible. Predictive analytics can help and improve the quality of education by analyzing the historical data of the student and allow the decision makers address factors such as increased drop-out rate, fees structure in the upcoming years, unemployment, Recommender Systems for Professional Development and curriculum Development. This paper presents an analytical study of student progress report and help to plan accordingly to achieve success.
What data from 3 million learners can tell us about effective course designJohn Whitmer, Ed.D.
Presentation of research findings and implications from a large-scale analysis of LMS activity and grade data from across 927 institutions, 70,000 courses, and 3.3 million students. This webinar will speak to the promise (and potential pitfalls) of large-scale learning analytics research to promote student success.
Designing Systemic Learning Analytics at the Open University
Belinda TynanPro-Vice-Chancellor Learning & TeachingThe Open University, UK
Simon Buckingham Shum Knowledge Media InstituteThe Open University, UK
Replay from today's webinar in the SoLAR online open course Strategy & Policy for Systemic Learning Analytics. Thanks to the Australian Office for Learning and Technology for sponsoring this, and to George Siemens for convening (replay):
Abstract: The OU has been analysing student data and feeding this back to faculties since its doors opened 40 years ago. However, the emergence of learning analytics technologies open new possibilities for engaging in more effective sensemaking of richer learner data, and more timely interventions. We will introduce the framework we are developing to orchestrate the rollout of a systemic organisational analytics infrastructure (both human and technical), and discuss some of the issues that arise. We will also describe how strategic research efforts will key into this design, should they prove effective.
From theory to practice blending the math classroom and creating a data cultu...DreamBox Learning
Transitioning your school to a fully blended model that leverages data to inform school wide goals, drive classroom instruction, and form small groups takes time and buy-in. Whether you’re in the beginning stages of your blended journey, or are several years into it, it’s important to stay dynamic and reflective to ensure your blended initiative is having a positive impact on student success. Hear how Aldeane Comito Ries Elementary was able to take data beyond the classroom and continue to successfully incorporate it into their school’s infrastructure.
Join the staff at Aldeane Comito Ries Elementary to hear about how they:
• Received buy-in from their staff at all levels
• Specifically use data in their day-to-day
• Continue to transform classroom teaching and learning
ABLE - the NTU Student Dashboard - University of DerbyEd Foster
implementing a university wide learning analytics system.
Presentation Overview:
- Introduction
- Developing the NTU Student Dashboard
- Transitioning from pilot phase to whole institution roll-out
- Embedding the resource into working practices
- Future development
Learning analytics and Moodle: So much we could measure, but what do we want to measure? A presentation to the USQ Math and Sciences Community of Practice May 2013
Presentation by Russ Little. Provides an overview of Integrated Planning and Advising Systems (IPAS). Demonstrates how the Student Success Plan software and My Academic Plan (MAP) function, and evidence of their effectiveness.
A Pulse of Predictive Analytics In Higher Education │ Civitas LearningCivitas Learning
Civitas Learning presents the findings of our survey conducted during the September 2014 Civitas Learning Summit, where more than 100 leaders representing 40 Pioneer Partner institutions gathered to share more on their work. The survey, distributed to all participants, resulted in 74 responses highlighting how this cross-section of higher education institutions are using advanced analytics to power student success initiatives.
Educators Pave the Way for Next Generation of LearnersCognizant
As educational assessments shift to outcome-based learning, providers must adopt new forms of test delivery to increase their global reach and provide ubiquitous services to a new student population.
Speakers:
David Lewis, senior analytics consultant, Jisc
Martin Lynch, learning systems manager, University of South Wales
An opportunity to find out about how an institution has been implementing learning analytics to support the student journey with and opportunity to discuss issues and possibilities that the use of learning analytics may create.
Moving Forward on Learning Analytics - A/Professor Deborah West, Charles Darw...Blackboard APAC
Learning analytics is a 'hot topic' in education with many institutions seeking to make better use of the data available via various systems. One of the key challenges in this process is to understand the business questions that people working in various roles in institutions would like to be able to answer. However, it is also important that these questions are appropriately structured and specific in order to gather the relevant data. This session builds on the workshop run at last year's Blackboard Learning and Teaching conference where participants explored business questions and use cases for learning analytics from a range of perspectives.
Delivered at Innovate and Educate: Teaching and Learning Conference by Blackboard. 24 -27 August 2015 in Adelaide, Australia.
Beyond Accreditation and Standards: The Distance Educator’s Opportunity for L...Gary Matkin
This presentation will provide practical suggestions for distance educators to take a leadership position amidst the call from accrediting bodies for institutions of higher education to become more accountable and transparent. Presentation will address content management, learner feedback, “openness”, and the establishment of infrastructure to meet these new requirements.
1. Leveraging Analytics
to Improve Student Success
Karen Vignare,
University Maryland University College
@kvignare
Ellen Wagner, PAR Framework
@edwsonoma
2. Session Description
• This session shows how analytics can be used to identify
opportunities for improving student success.
• By the end of the session, participants will make connections
between predictions about risk, and the interventions most
likely to work best under varying conditions and with different
populations.
4. “But education researchers have
always worked with data.”
• We do qualitative research with data
• We do quantitative research with data
• We do evaluations with data
• We develop surveys and instruments and experiments to
collect more data
• We pull data from LMSs, SISs, ERPs, CRMs …
• We write reports, summaries, make presentations, develop
articles and books and webcasts….
7. Analytics in Higher Education
Learning Analytics
Best way to teach and learn
Learner Analytics
Best way to support students
Organizational Analytics
Best ways to operate a college
Academic
Analytics
8. Create new insights and opportunities for
data in our practices
• Enrollment management
• Student services
• Program and learning experience design
• Content creation
• Retention, completion
• Gainful employment
• Institutional Culture
9. How Are We Doing So Far?
• Data is the number 1 challenge in the adoption and use of analytics.
Organizations continue to struggle with data accuracy, consistency,
access.
• The primary focus of analytics focuses on reducing costs, improving
the bottom line, managing risk.
• Intuition, based on experience, is still the driving factor in data-
driven decision-making. Analytics are used as a part of the process.
• Many organizations lack the proper analytical talent. Organizations
that struggle with making good use of analytics often don’t know
how to apply the results.
• Culture plays a critical role in the effective use of data analytics.
9
10. GROUP DISCUSSION
• Is your institution using (or planning to use) academic analytics
specifically to improve student success?
• What kinds of questions are you trying to answer?
• What kinds of data are you planning to use?
• What kinds of barriers are you encountering?
11. Getting to the right answer takes work
• Analysis and model building is an
iterative process
• Around 70-80% efforts are spent
on data exploration and
understanding.
SAS Analysis/Modeling Process
12. Link Predictions to Action
• Predictive analytics refer to a wide varieties of methodologies.
There is no single “best” way of doing predictive analytics.
You need to know what you are looking for.
• Simply knowing who is at risk is simply not enough. Predictions
have value when they are tied to what you can do about it.
• Linking behavioral predictions of risk with interventions at the
best points of fit offers a powerful strategy for increasing rates
of student retention, academic progress and completion.
14. What PAR does
PAR uses descriptive, inferential and predictive analyses to create
benchmarks, institutional predictive models and to inventory,
map and measure student success interventions that have direct
positive impact on behaviors correlated with success.
15. Linking Predictions to Action
• Identify obstacles and remove barriers from student success
pathways.
• Provide actionable information so students and advisors can
build informed opportunity pathways.
• Know where to invest in student success leveraging
collaborative insight that determine return on investment in
interventions and support.
16. Benchmarks & Insight Predictive Analytics Intervention Inventory and ROI
Tools
Diagnostics
PAR analytic toolset
17. Benchmarks & Insight Predictive Analytics Intervention Inventory and ROI
Tools
Web Tools
Student Success Matrix (SSMx)
18. PAR by the Numbers
• 2.2 million students and 24.5 million courses in the PAR data warehouse, in
a single federated data set, using common data definitions.
• 48 institutions, 351 unique campuses.
• 77 discrete variables are available for each student record in the data set.
Additional 2 dozen constructed variables used to explore specific
dimensions and promising patterns of risk and retention.
• 343 discrete interventions filtered on predictor behaviors, point in student
life cycle, student attributes, institutional priorities and ROI factors in the
growing SSMx dataset.
19. Structured, Readily Available Data
• Common data definitions
= reusable predictive
models and meaningful
comparisons.
• Openly published via a cc
license @
https://public.datacookb
ook.com/public/institutio
ns/par
21. PAR Puts it All Together
Determine students
probability of failure
(predictions)
Determine which
students respond to
interventions (uplift
modeling)
Determine which
interventions are most
effective (explanatory
modeling)
Allocate resources
accordingly (cost
benefit analysis)
22. Findings from aggregated dataset
Positive Predictors
High school GPA (when available)
Dual Enrollment – HS/College
Any prior credit
CC GPA
Credit Ratio
Successful Course Completion
Positive completion of DevEd
Courses
Negative Predictors
Withdrawals
Low # of credits attempted
Varies but can be significant
PELL Grant Recipient
Taken Dev Ed
Age
Fully online student
Race
27. Specific Examples of
Data Driven Improvements
• UMUC / U of Hawaii – replication of community college success
prediction studies
• U of Hawaii – “Obstacle courses”
• University of North Dakota – predictives tied to student
watchlist data
• Intervention measurement at Sinclair CC and Lone Star CC
• National online learning impact study on student retention (in
press, based on results from >500,000 students taking
onground, blended and online courses)
28. Intervention Measurement –
Student Success Courses Results
• 12 month credit ratio: Only 1 of the 8 Student Success
Courses analyzed showed a statistically significant positive
effect for students taking the course vs. those who did
not.
• Retention: 7 of the 8 courses showed a significantly
positive effect
• Retention higher by 14% to 4X
30. Public university offering online degree
programs to a diverse population of
working adults
Largest open access public online
university in U.S.
Premier provider of higher education to
U.S. military since 1949
Part of the University System of Maryland
About UMUC
31. 20th Century
Historical
Longitudinal
Warehouse
Siloed
External
Reporting
21st Century
Predictive
Real-Time
Dashboards
Integrated
Institutional Insights
Continuous
Improvements
Evolution of Data for Retention
32. Institutional Research
Institutional Effectiveness
Business Intelligence
Civitas Learning, Inc.
PAR Framework, Inc.
Retention Resources at UMUC
33. Pre-enrollment
Demographics
Enrollment
LMS Engagement
Student Performance
Transfer
Military
Factors Included in Predictive
Model for Retention at UMUC
34. Campus
Class Load
Military Status
Academic Performance
Payment Method
Key Factors for Retention at UMUC
35. One year retention (year over year measured
with a cohort)
Re-enrollment (term to term metric that
includes all students)
Successful course completion (percentage of
students receiving a successful grade)
Graduation (1,2,3,4,5, and 10 year rate tracks
the graduation status of the starting cohort over
time)
Metrics at UMUC
36. Curriculum Redesign (2010)
8-week Standard Sessions (2010)
Community College Transfer (2010)
Registration Policy (2013)
Onboarding (2014)
Just-in-Time Messages (2014)
Retention Initiatives
37. 71.2 72 71.6 73.2
60.5 59.5 61.5
66
0
10
20
30
40
50
60
70
80
Fall 2011 Fall 2012 Fall 2013 Fall 2014
Stateside
Overseas
Retention Rates and Headcounts
47,416 46,213 41,197 41,356
38. Operationalize
successful tests;
“Lessons
Learned” fed
back
to body of
knowledge
Student Retention Enterprise Framework
Diagnosed
from internal
data and
external
research
Root cause
analysis
performed
and search
of existing
body of
knowledge
solutions
Work within
Governance
Structure
Levers pulled
here;
Measure
success &
ROI;
Quarterly
Retention Root Cause Identification & Analysis
Retention
Opportunity
Problem
Analyzed
Hypothesis
Generated
Test &
Learn Cycle
Operationaliz
e or Re-
create
39. Discussion
How will you begin, or improve, your
analytics journey at YOUR institution?
40. Elements of a Data Model
Use modeling to
Test likely impact on retention when new
initiatives or planned interventions are
undertaken
Create models that build out retention
impact by segments, e.g., demographics,
academic programs, persistence, etc.
Analytics is not one size fits all
3 major areas of analytics in HE, according to Russ
Learning
The act & process of learning, Curricular, Best way to teach and learn
Learner
Demographics, Behaviors, Best way to support students (Individually is the goal)
Organizational
Capacity, budget, scheduling, Best way to operate a college
Place Holders for Demo Sections
We can give examples from each category
These are commonly used to report retention (as opposed to measuring success)
PRESENTATION NOTES
This is the strategic framework that we need to implement
In “Operationalize or re-create”, we didn’t abandon anything, because it always rolls back into body of knowledge
Governance is part of this!