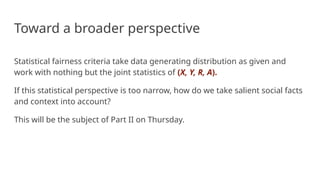
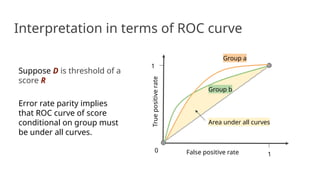
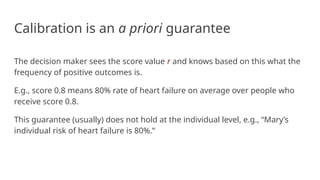
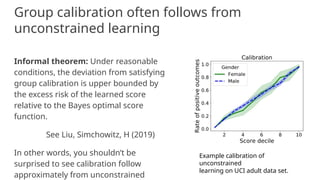
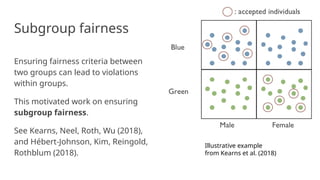
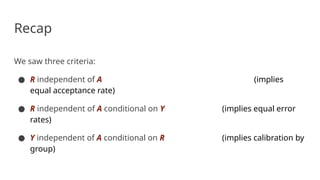
The document discusses the interplay between fairness and machine learning, highlighting how algorithmic processes can perpetuate existing inequalities while also offering opportunities for reform. It explores various legal doctrines in the U.S. concerning discrimination, examines statistical fairness criteria in decision-making, and the necessity of considering broader social contexts. Additionally, it critiques the notion of 'fairness through unawareness' and emphasizes that fairness definitions are complex and contextual, calling for a comprehensive approach to decision-making processes.


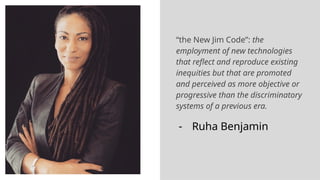
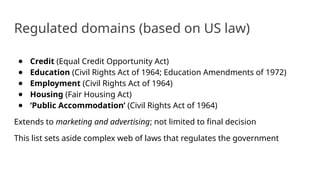


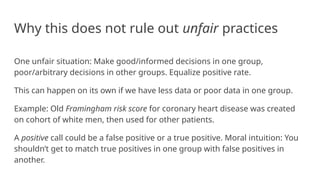
![Where do score functions come from
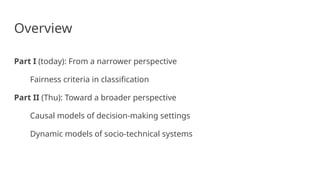
Score R could be:
● Based on parametric model of the data (X, Y), e.g. likelihood ratio test
● Non-parametric score, such as, Bayes optimal score R = E[ Y | X ]
● Most commonly, learned from labeled data using supervised learning](https://image.slidesharecdn.com/adviifairness-241014092813-3961693a/85/adv_ii_fairness-artificial-intelligence-pptx-23-320.jpg)
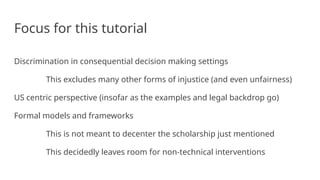
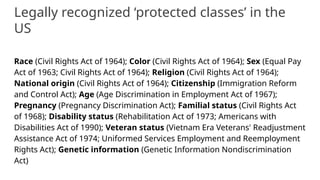
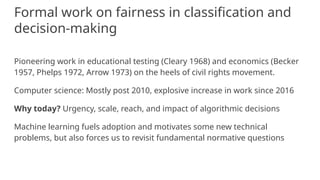
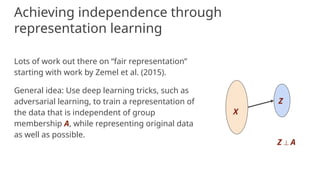
![Decision theory 101
True
negative
False
positive
False
negative
True
positive
Decision D
Outcome
Y
0
0
1
1
True positive rate = Pr[D = 1 | Y = 1]
False positive rate = Pr[D = 1 | Y =
0]
True negative rate = Pr[D = 0 | Y =
0]
False negative rate = Pr[D = 0 | Y =
1]](https://image.slidesharecdn.com/adviifairness-241014092813-3961693a/85/adv_ii_fairness-artificial-intelligence-pptx-24-320.jpg)
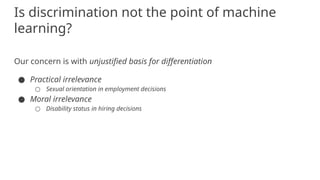
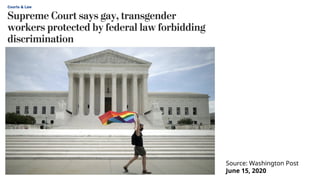
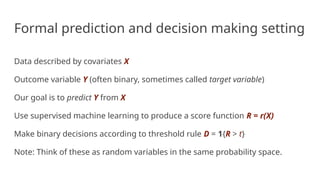
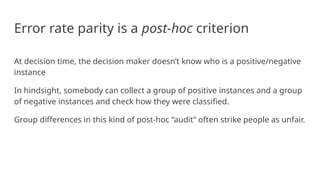
![Equalizing acceptance rate
Equal positive rate: For any two groups a, b, require
Pr[D = 1 | A = a] = Pr[D = 1 | A = b]
“Acceptance rate” equal in all groups
Generalization: Require D to be independent of A (Independence)
All sorts of variants, relaxations, equivalent formulations](https://image.slidesharecdn.com/adviifairness-241014092813-3961693a/85/adv_ii_fairness-artificial-intelligence-pptx-26-320.jpg)
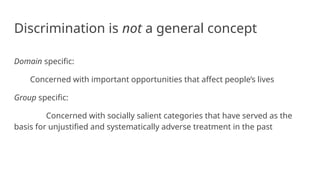
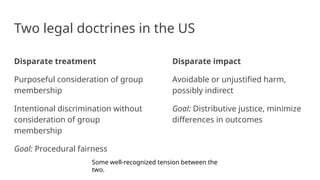
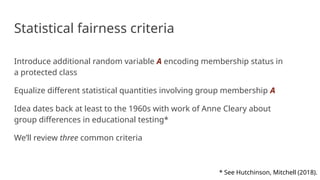
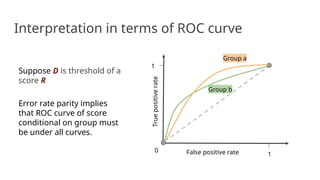
![Equalizing error rates
For any two groups a, b, require
Pr[D = 1 | Y = 0, A = a] = Pr[D = 1 | Y = 0, A = b] (equal false
positive rate)
Pr[D = 0 | Y = 1, A = a] = Pr[D = 0 | Y = 1, A = b] (equal false
negative rate)
Generalization: Require D to be independent of A given Y
Also makes sense for score: Require R to be independent of A given Y](https://image.slidesharecdn.com/adviifairness-241014092813-3961693a/85/adv_ii_fairness-artificial-intelligence-pptx-29-320.jpg)
![Column-wise criteria?
We could equalize expressions of the form
Pr[Y = y | D = d, A = a]
These are called “column-wise” rates, i.e.,
false omission and false discovery rate.
Nothing wrong with this, but something
closely related but different is more
common.
n00 n01
n10 n11
Decision
Reality
0
0
1
1](https://image.slidesharecdn.com/adviifairness-241014092813-3961693a/85/adv_ii_fairness-artificial-intelligence-pptx-33-320.jpg)
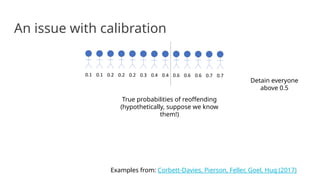
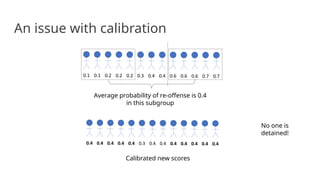
![Calibration
A score R is calibrated if: Pr[Y = 1 | R = r] = r
“You can pretend score is a probability” - although it may not actually be one!
Score value r corresponds to positive outcome rate r
Calibration by group: Pr[Y = y | R = r, A = a] = r
Follows from: Y independent of A conditional on R](https://image.slidesharecdn.com/adviifairness-241014092813-3961693a/85/adv_ii_fairness-artificial-intelligence-pptx-34-320.jpg)
![Error rate parity vs calibration
Theorem:
1. Assume unequal base rates: Pr[Y = 1 | A = a] ≠ Pr[Y = 1 | A
= b]
2. Assume imperfect decision rule: D has nonzero error rates
Then, calibration by group implies that error rate parity fails.
Related result due to Chouldechova (2016), Kleinberg,
Mullainathan, Raghavan (2017)](https://image.slidesharecdn.com/adviifairness-241014092813-3961693a/85/adv_ii_fairness-artificial-intelligence-pptx-40-320.jpg)