Download to read offline
![Questions? Don’t hesitate to call CEE – 425-283-0384 Sue is ext 1#, Greg is ext 2#, Jack at 425-444-6600 and Terry at ? OR you can email us: [email_address] [email_address] [email_address] [email_address]](https://image.slidesharecdn.com/presentationforgenesrevision3-090819224947-phpapp01/75/Presentation-For-Gene-S-Revision-3-74-2048.jpg)

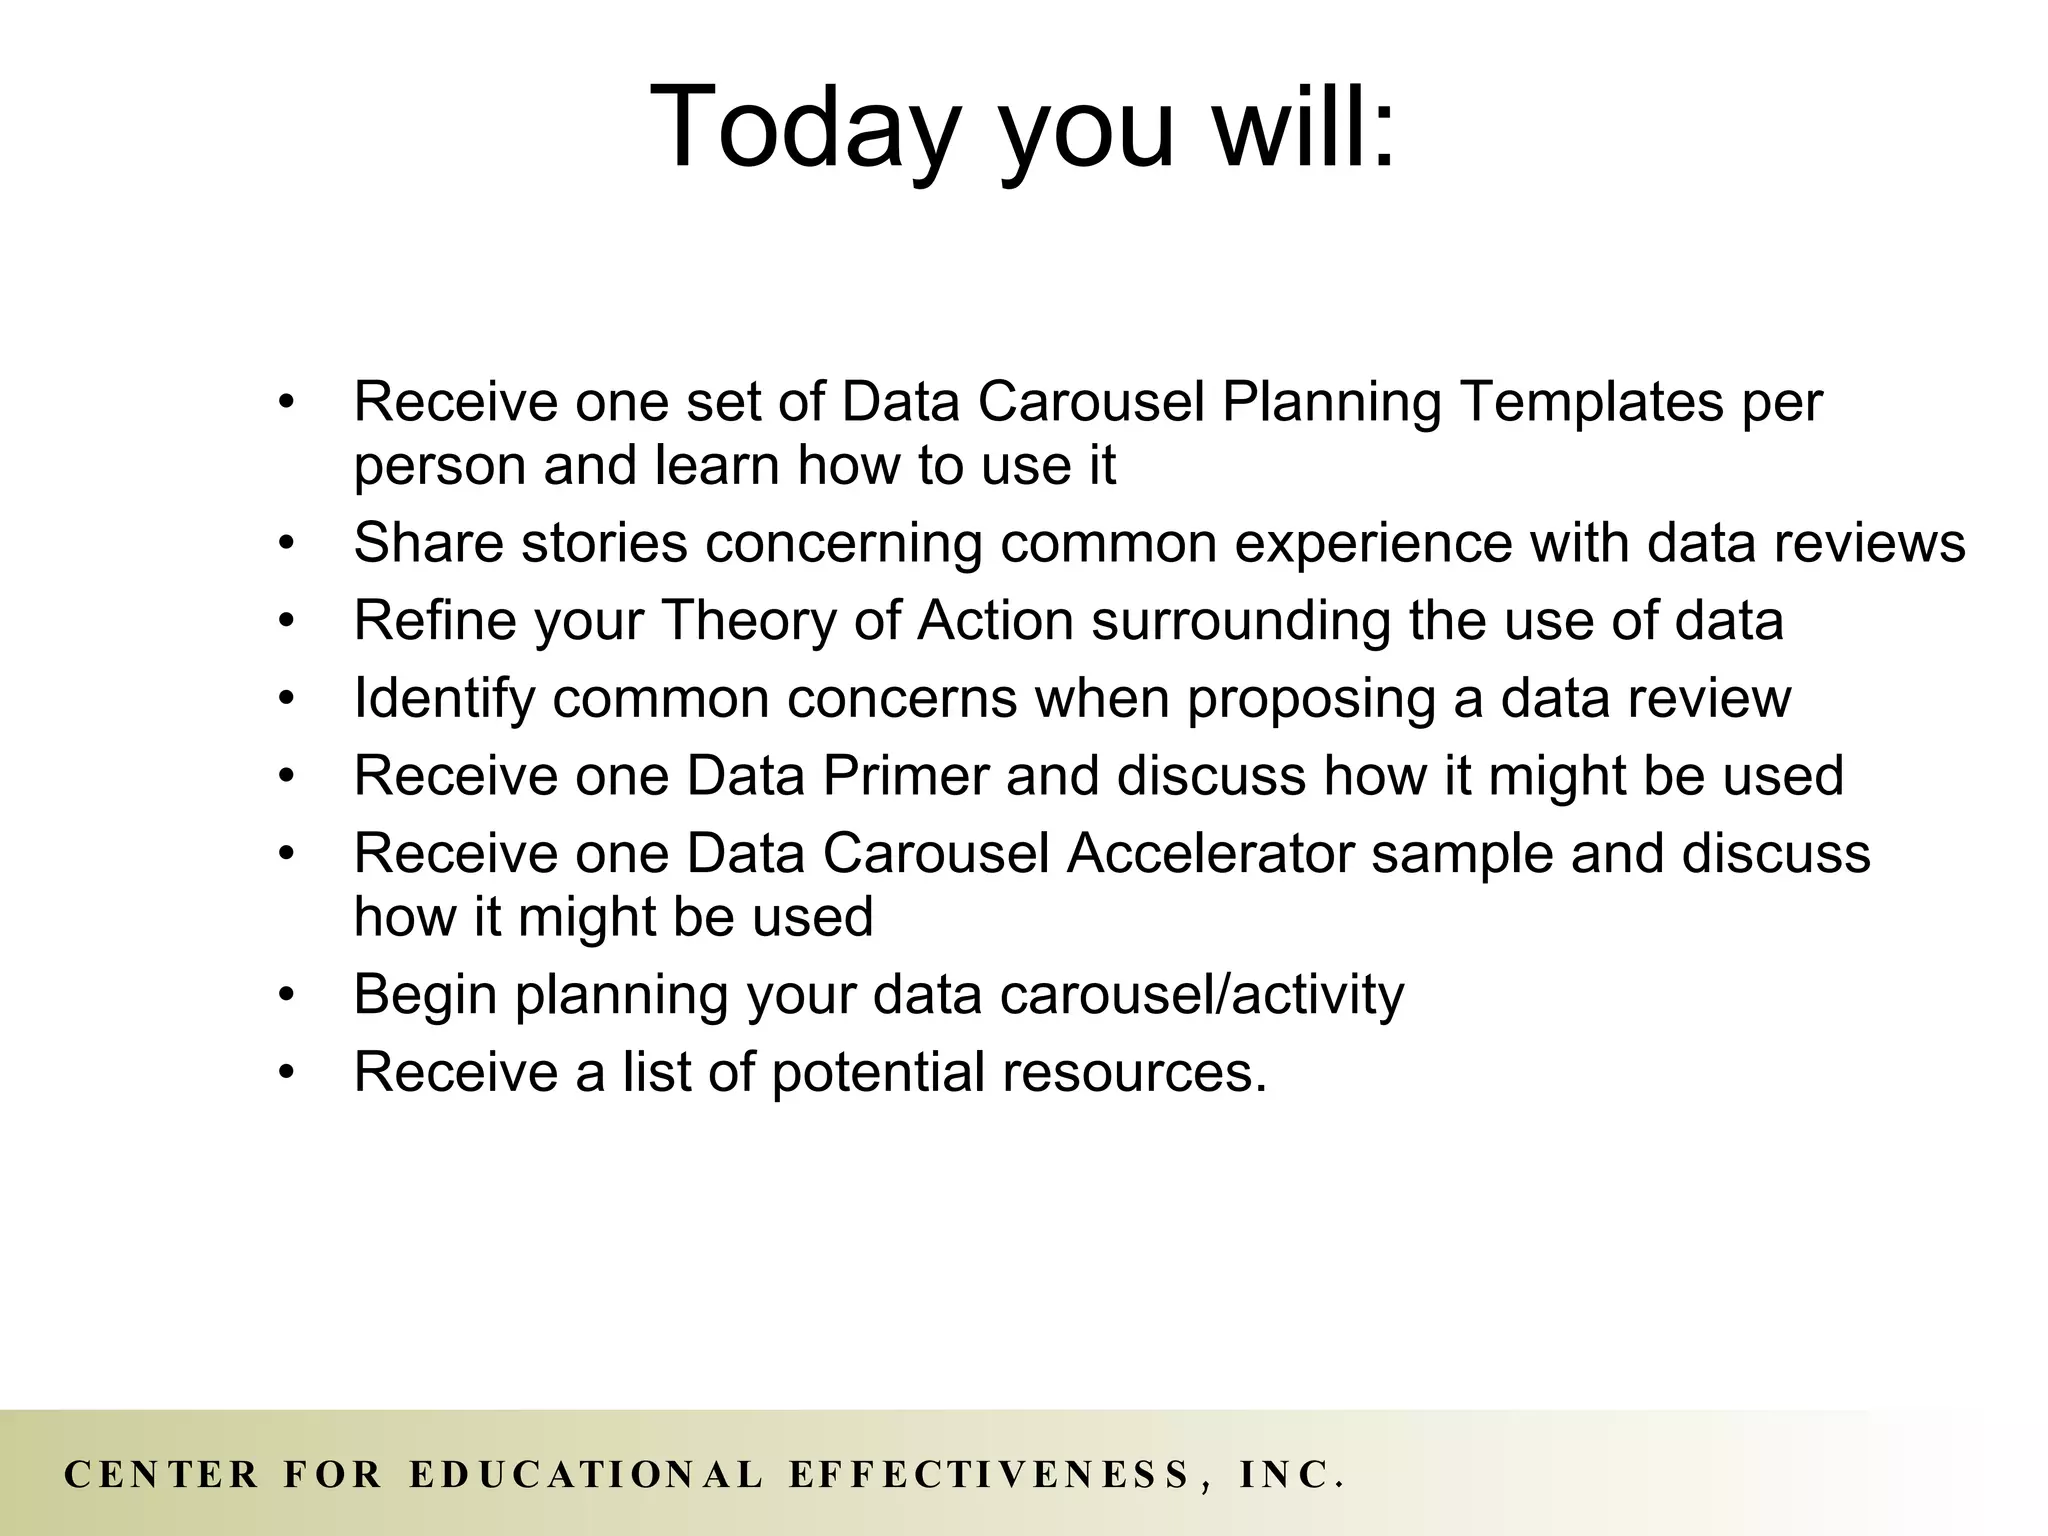
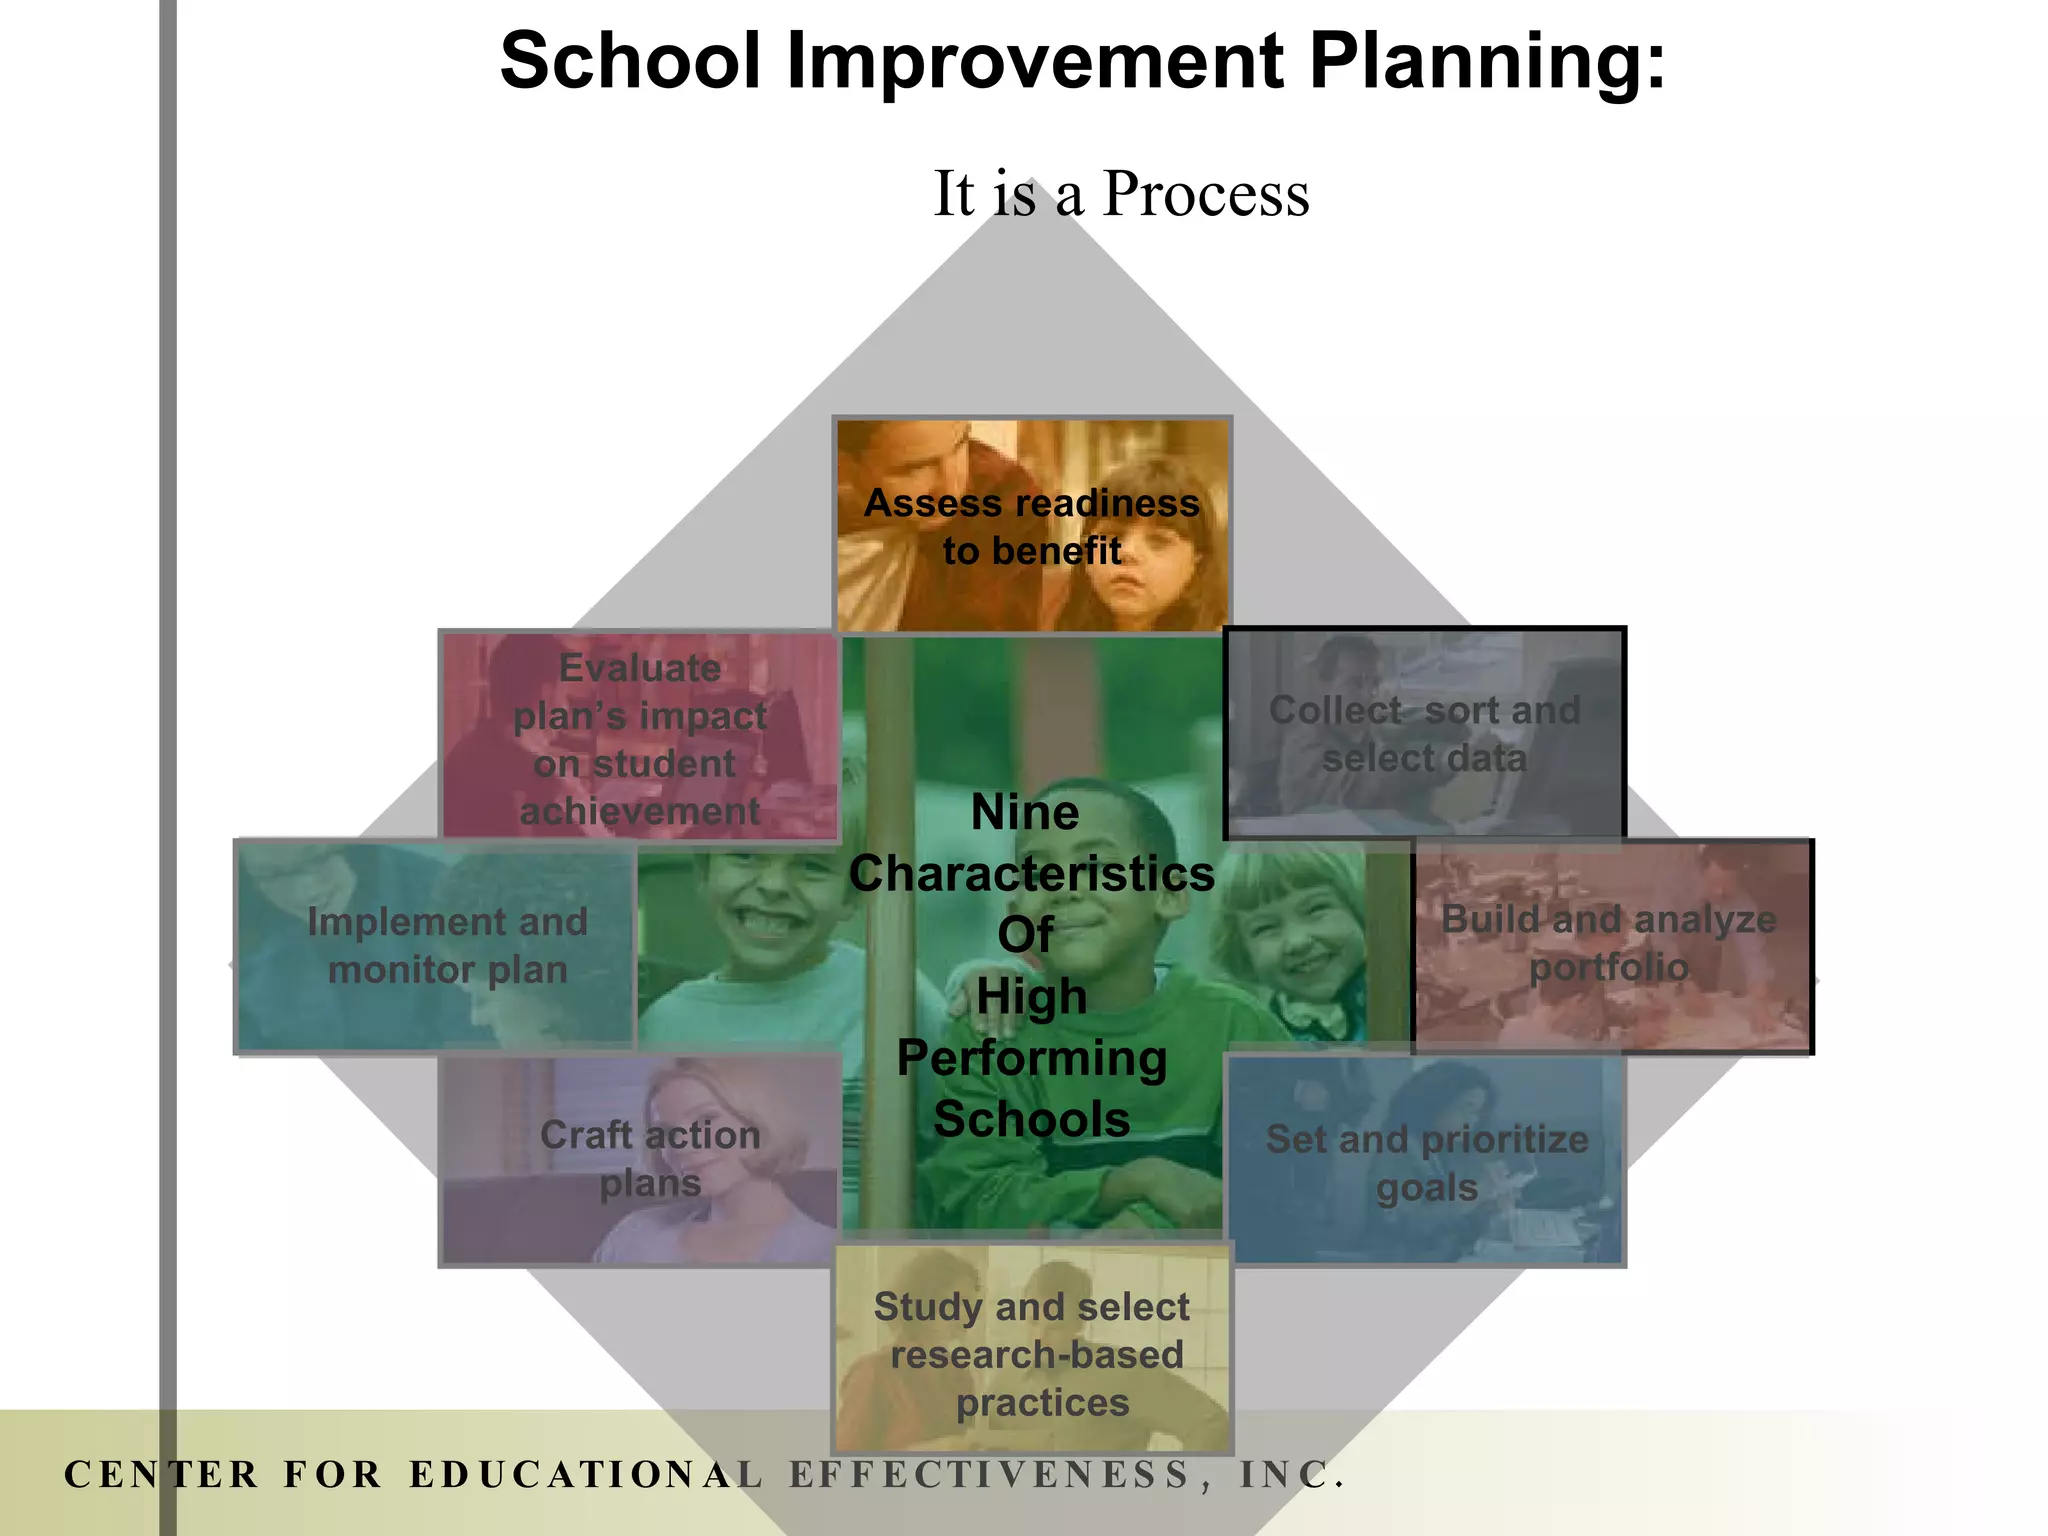
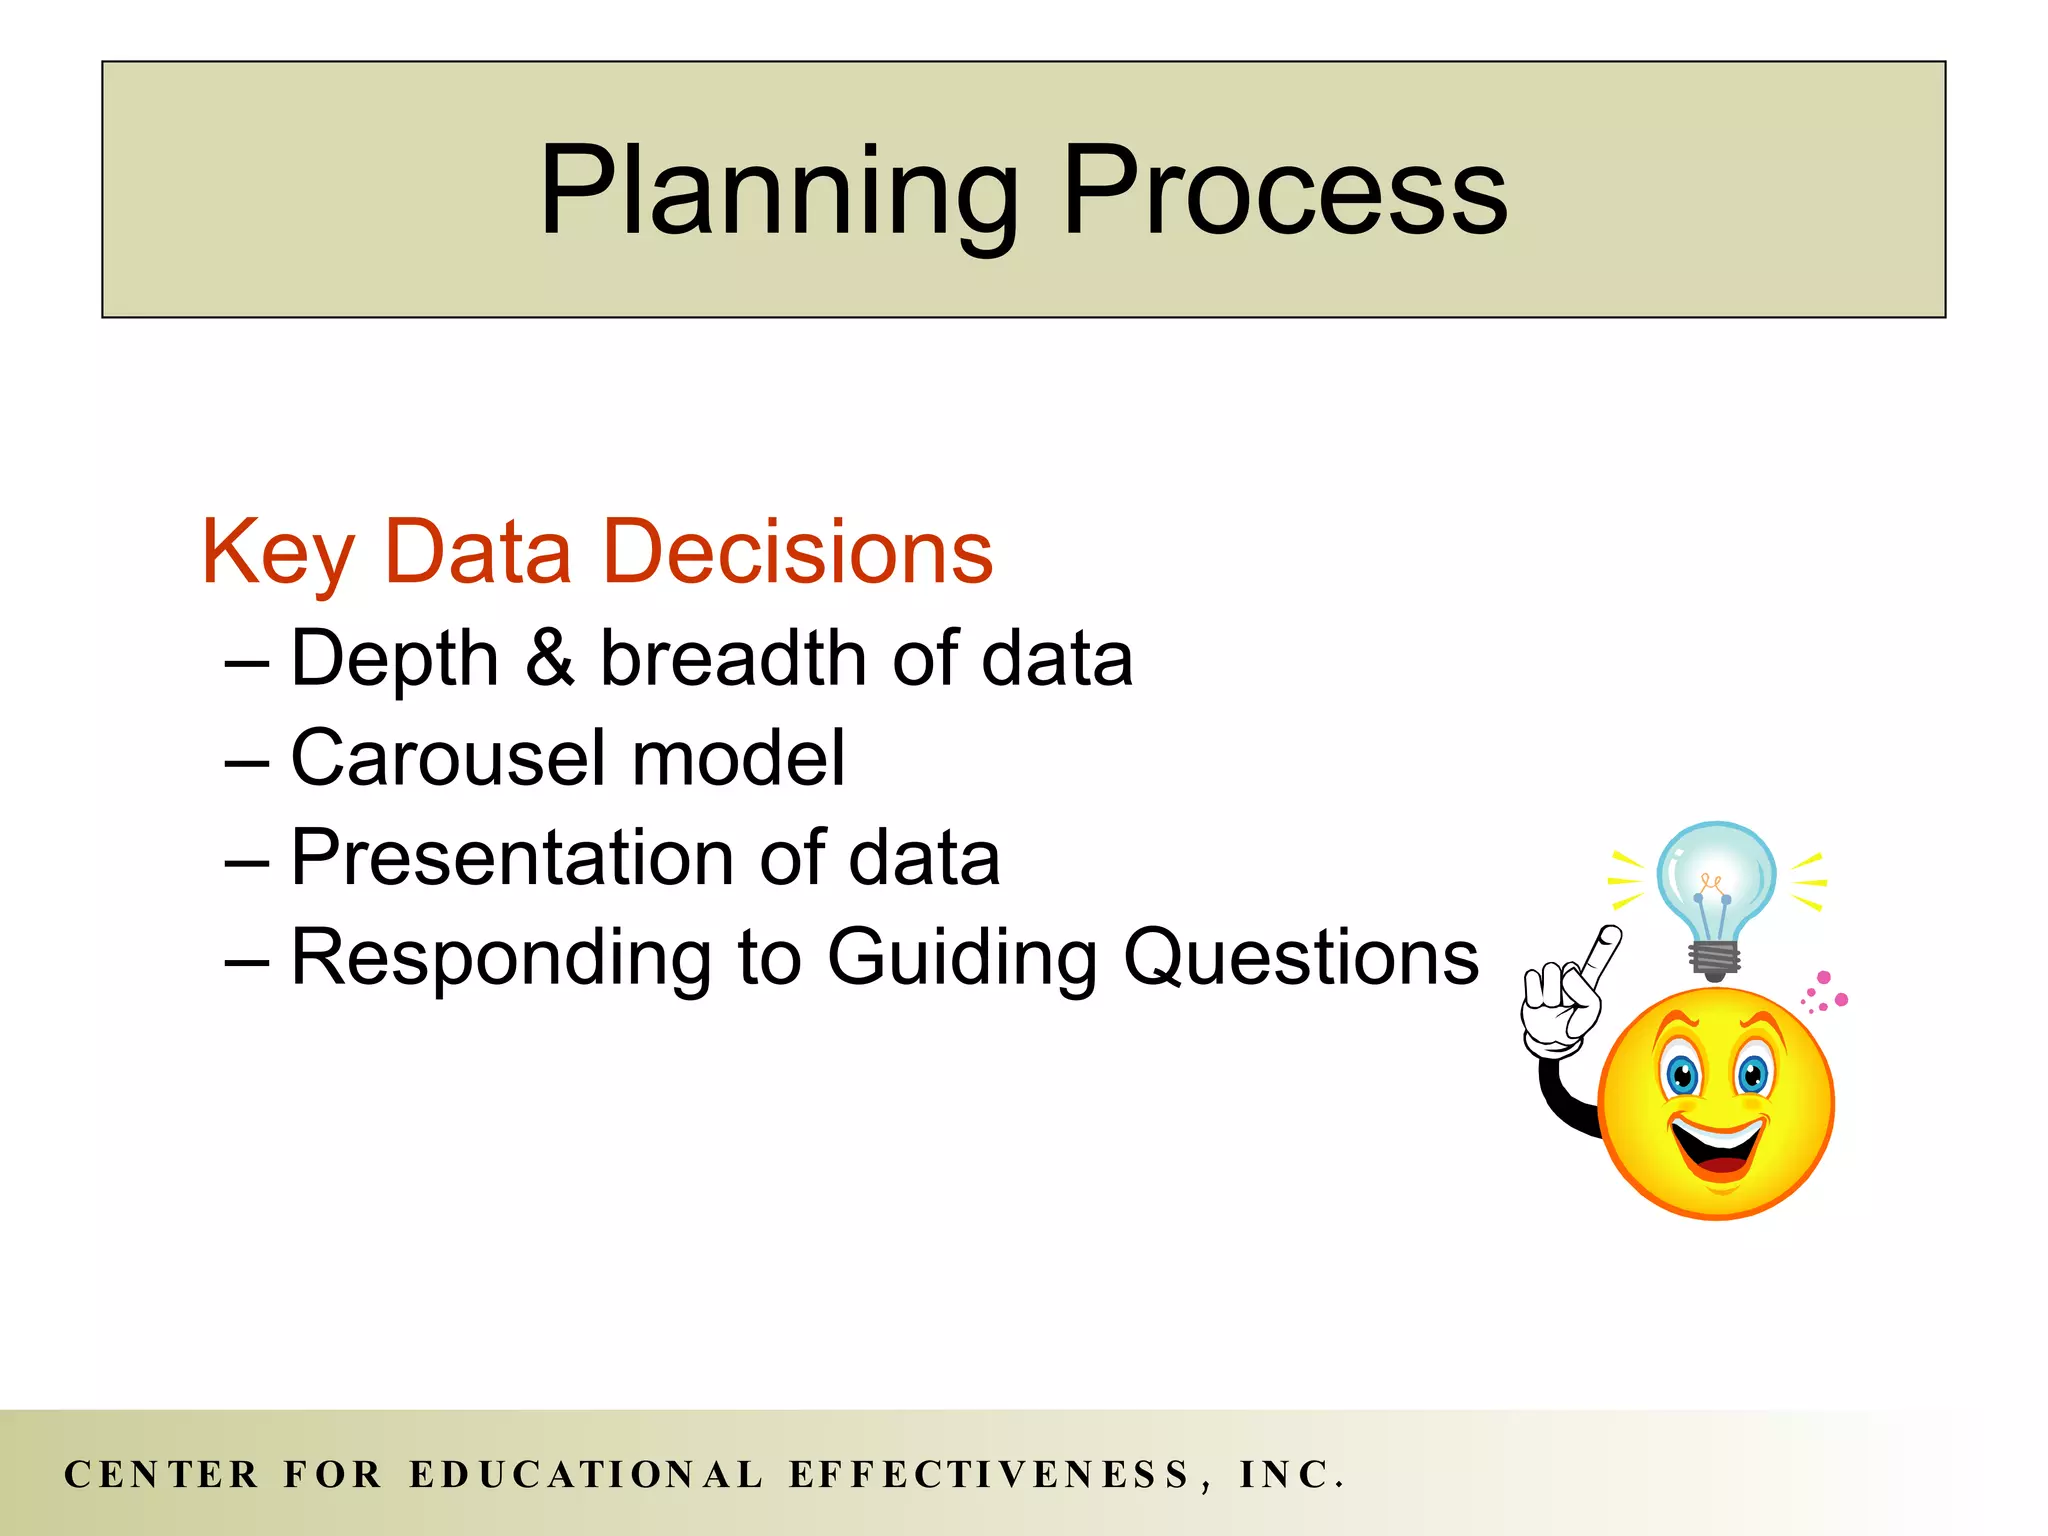
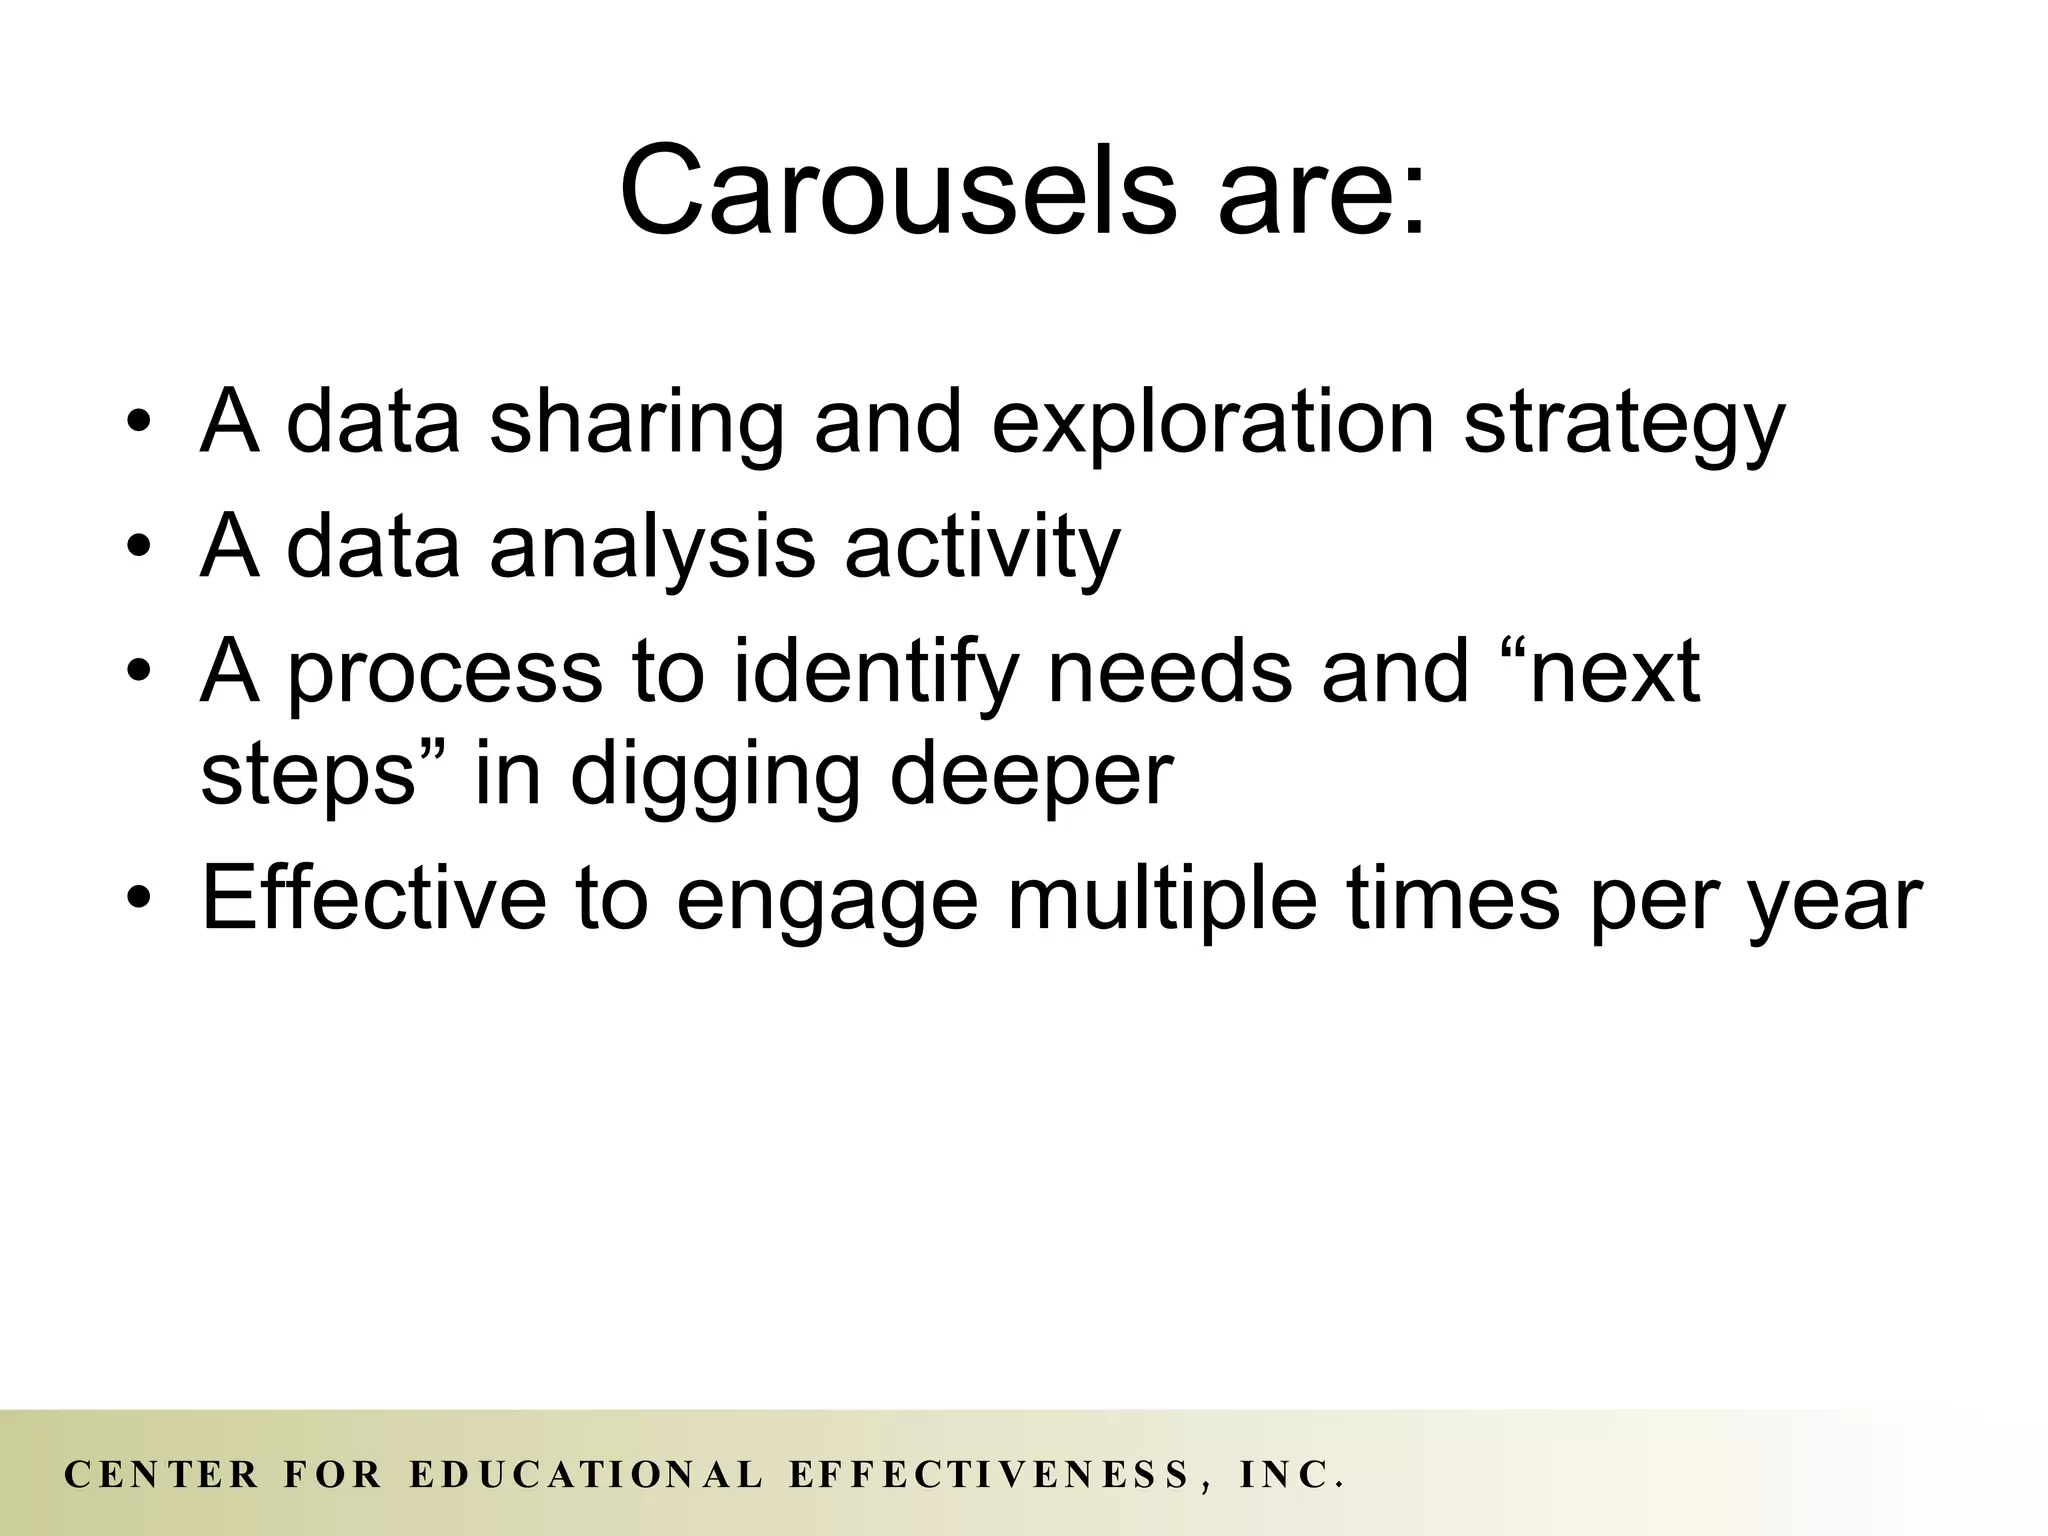
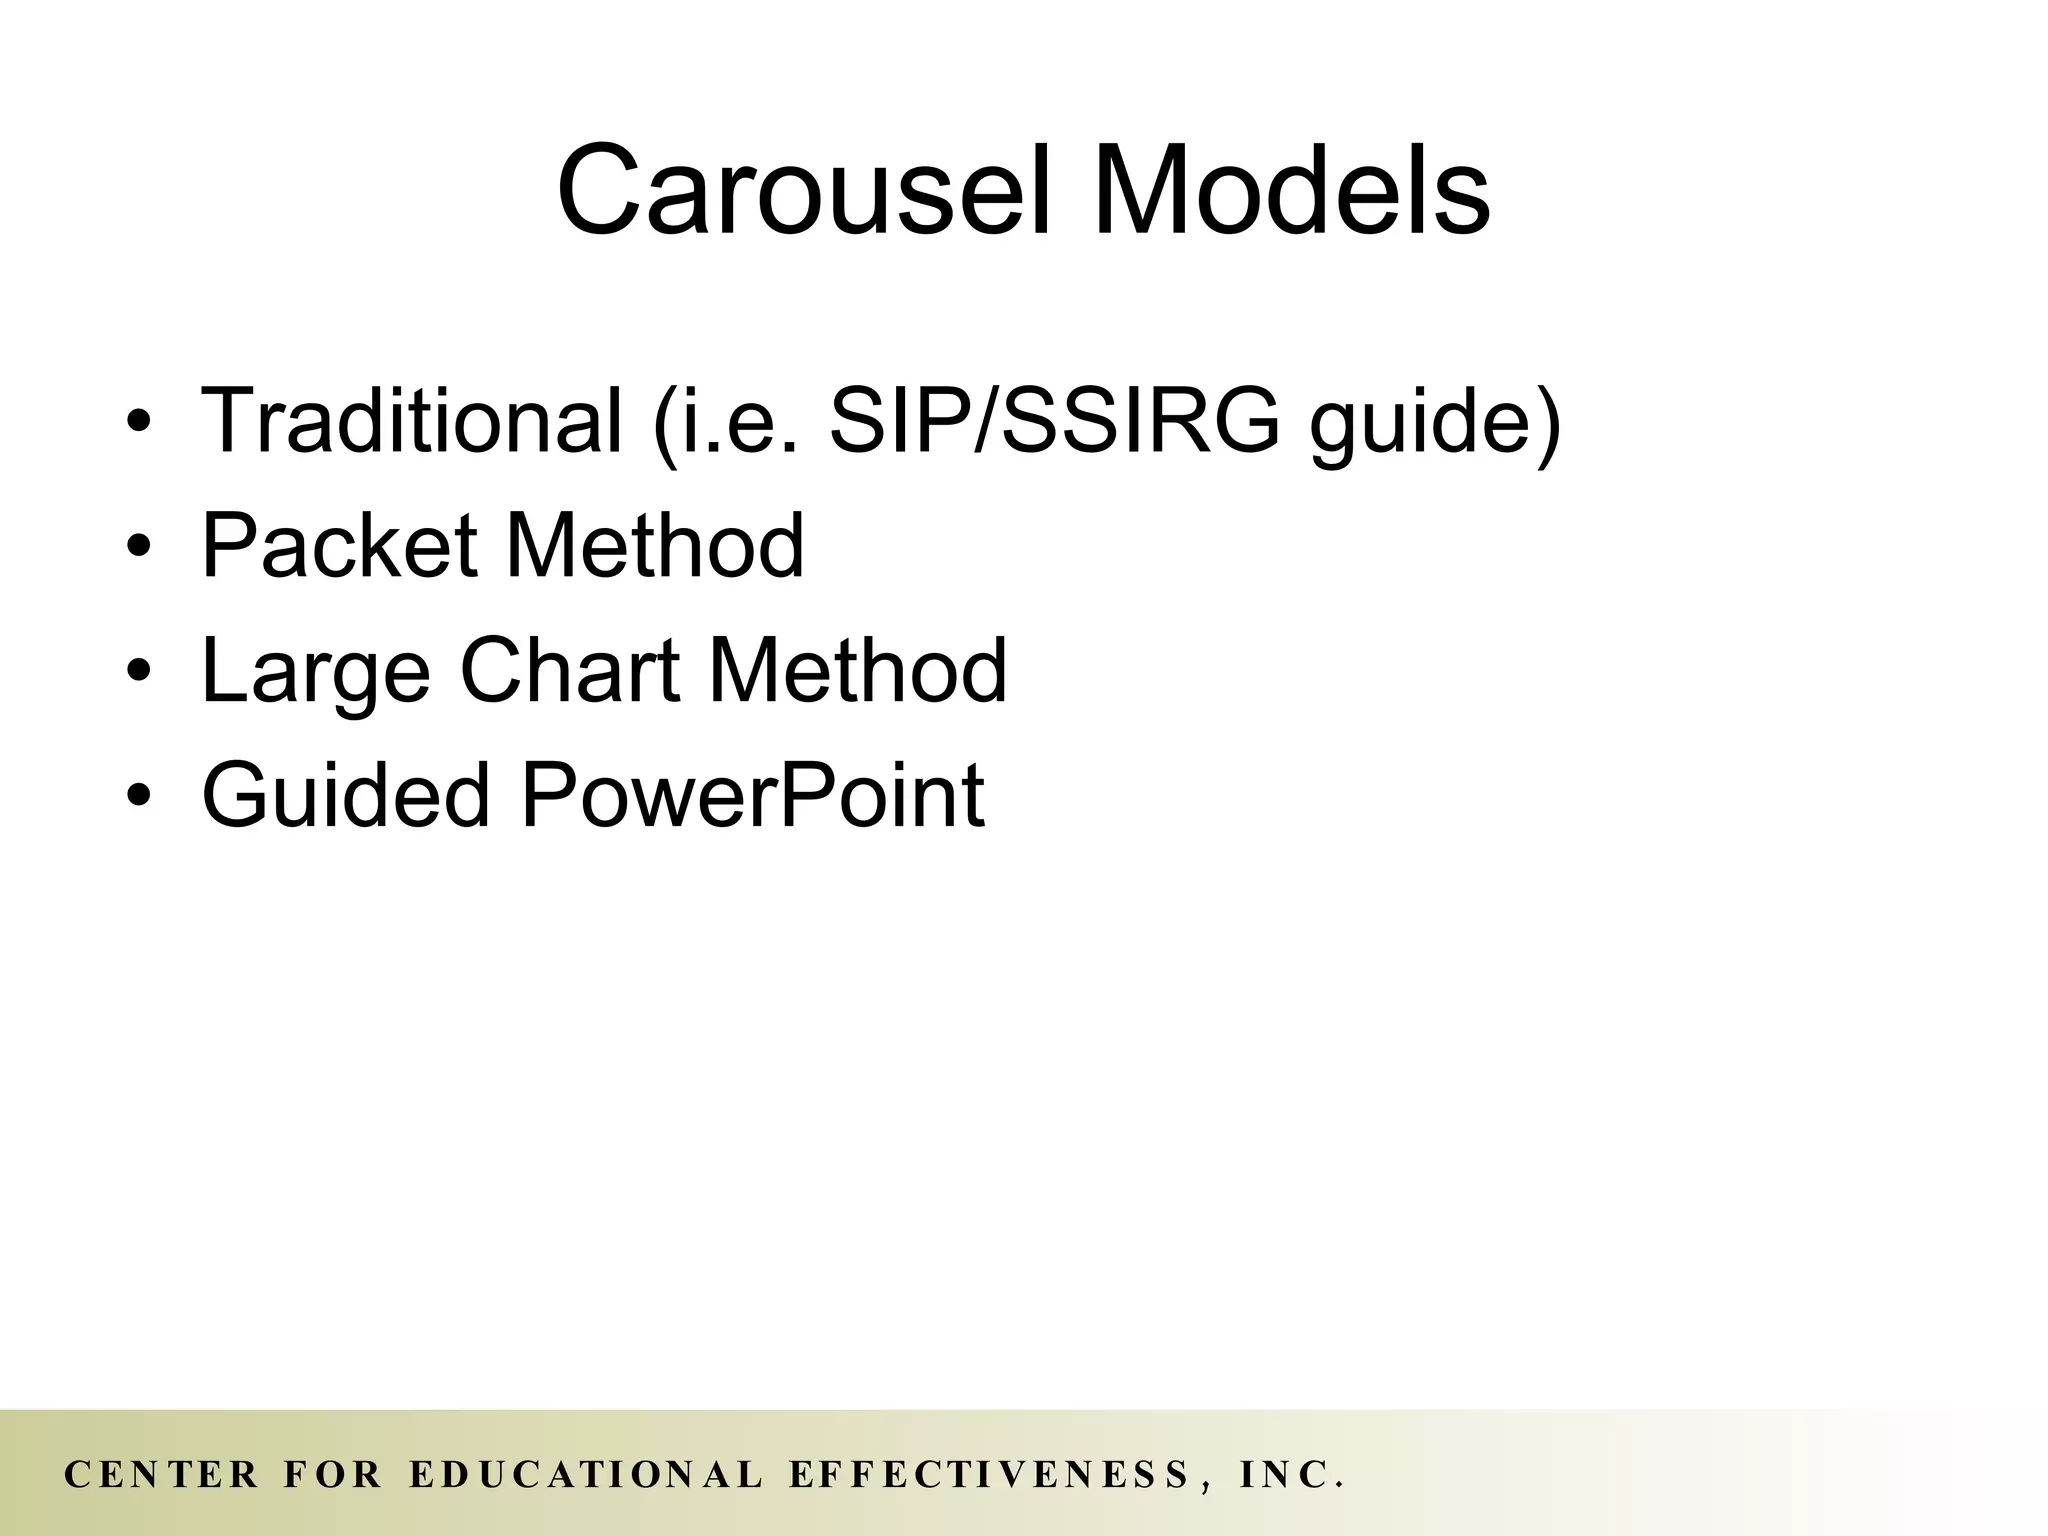
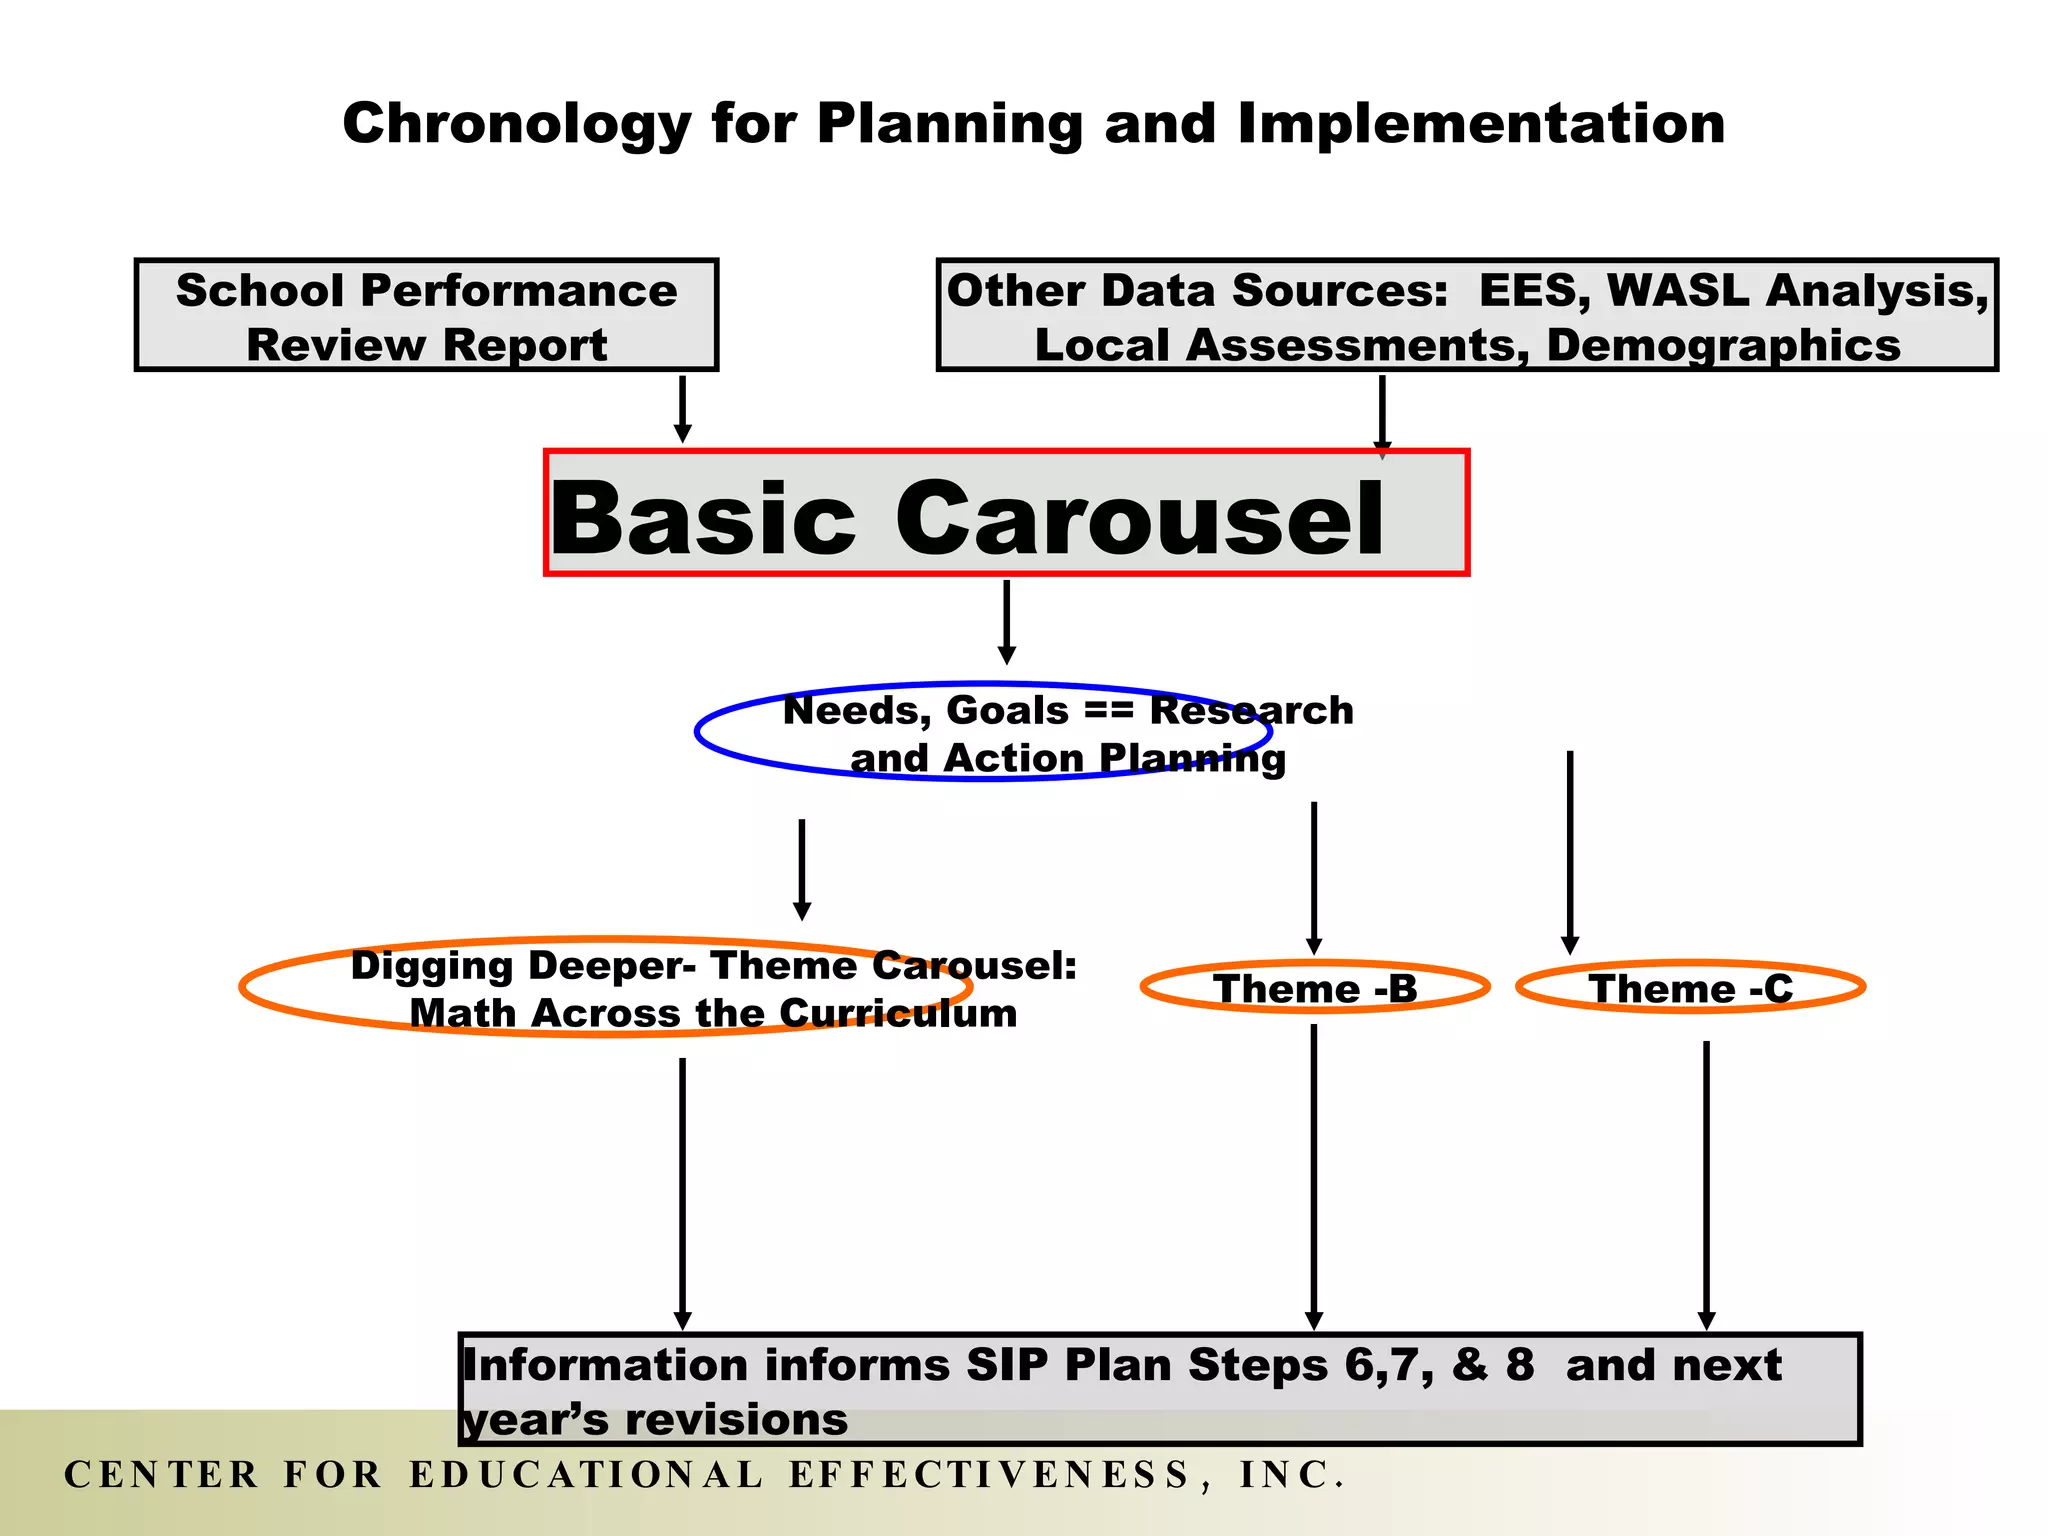
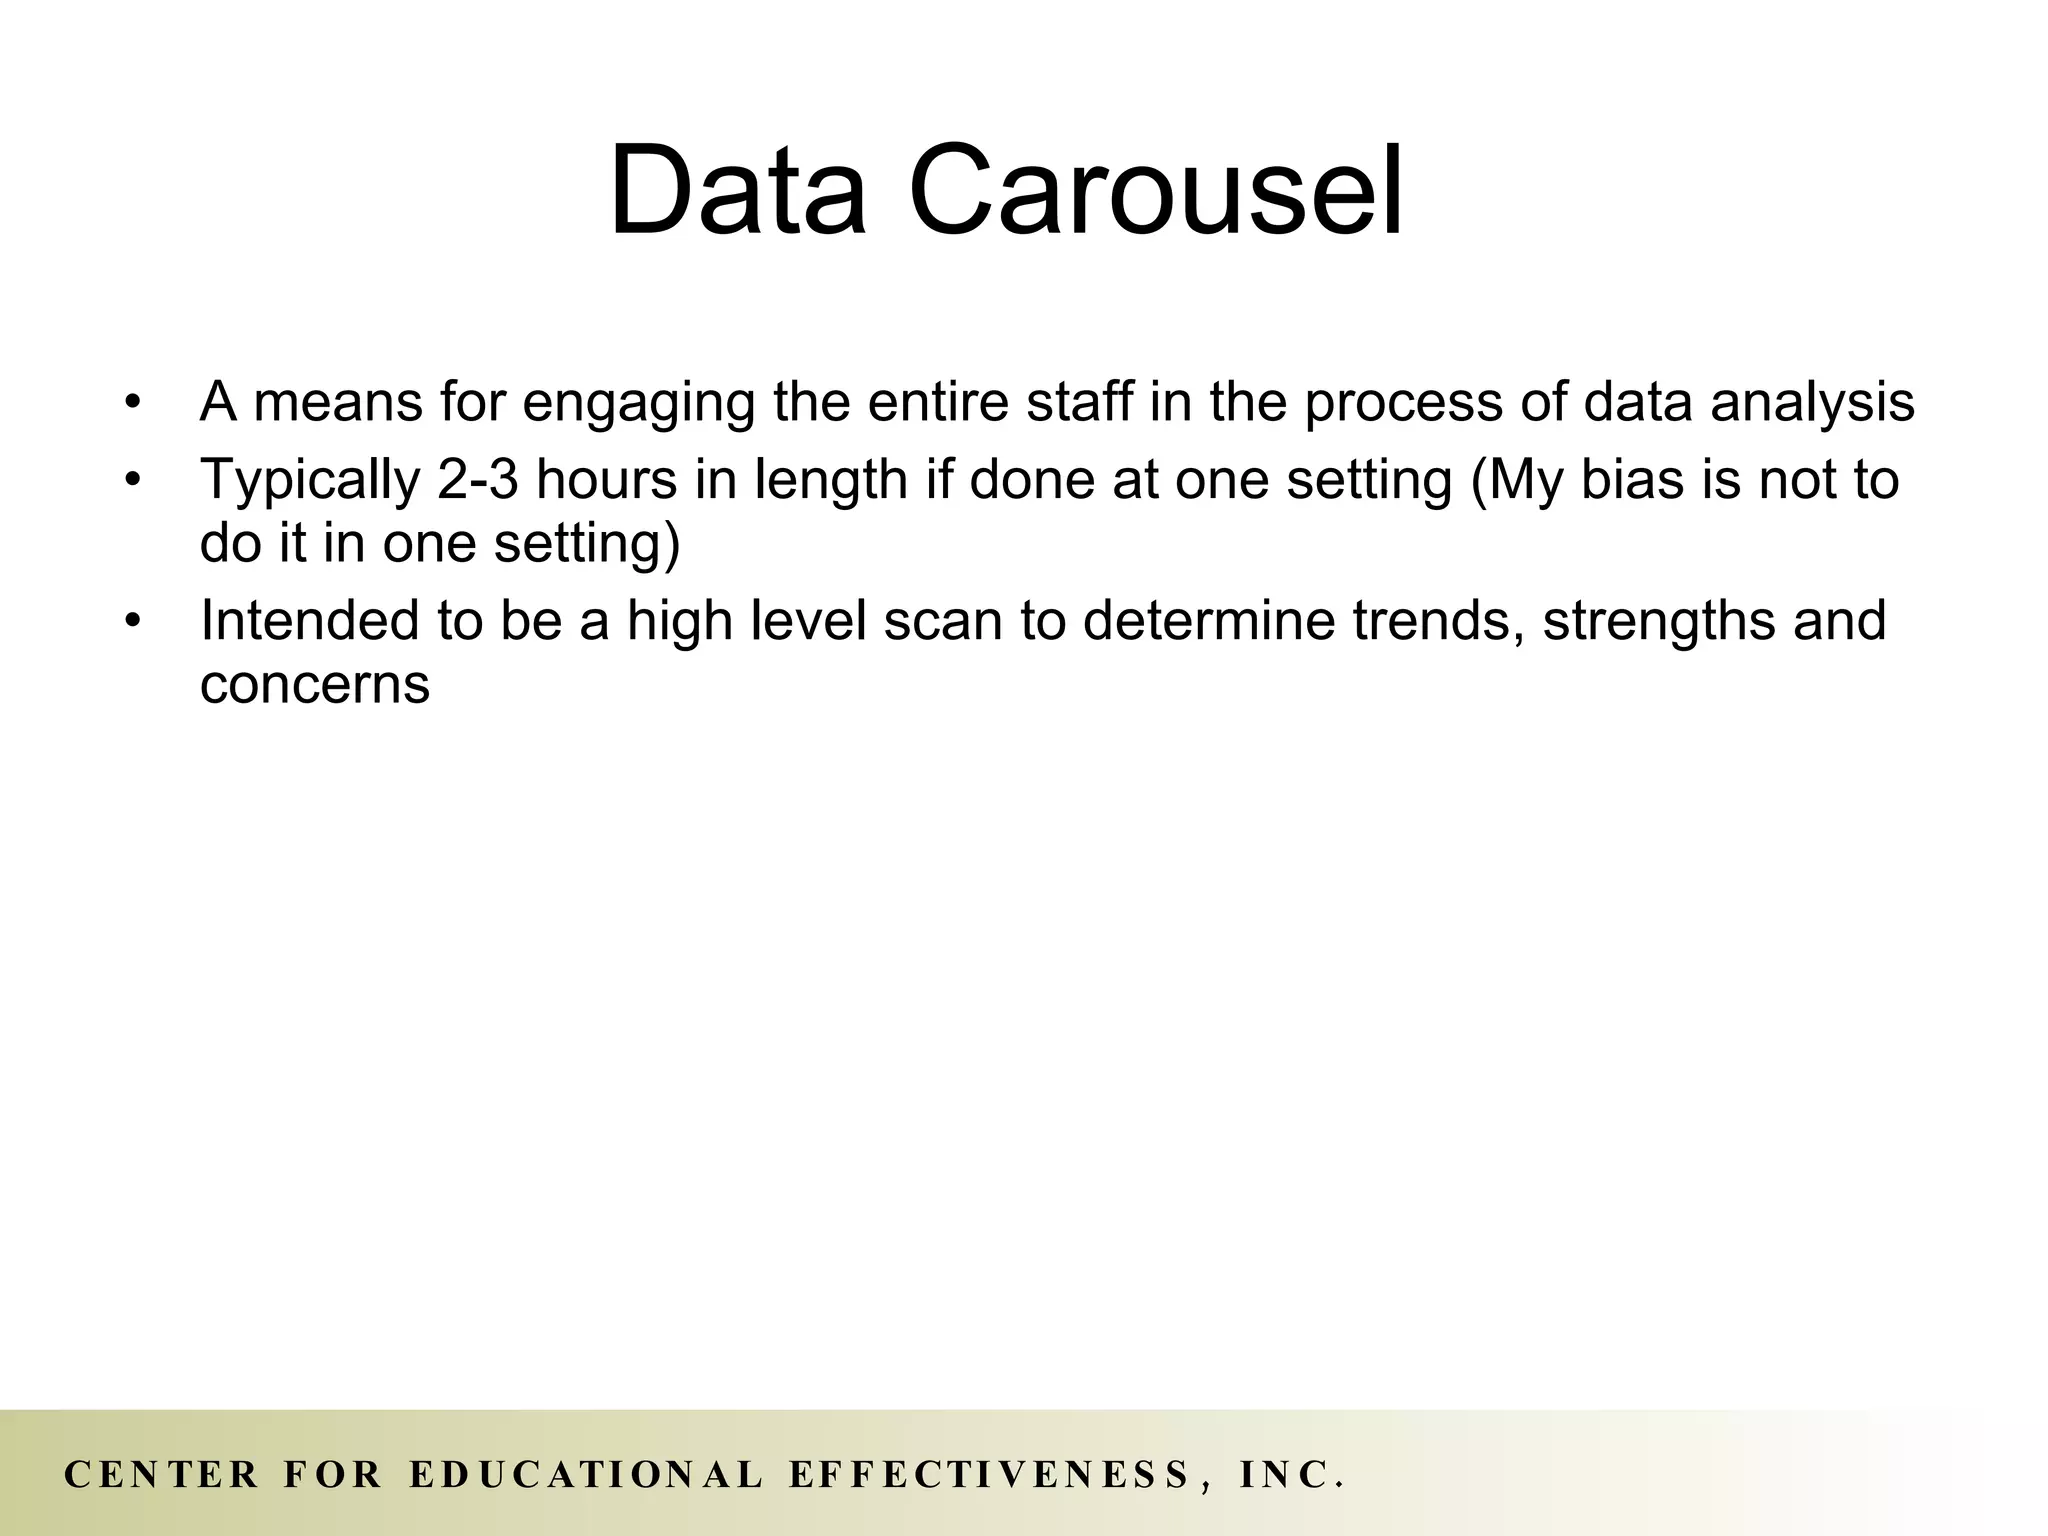
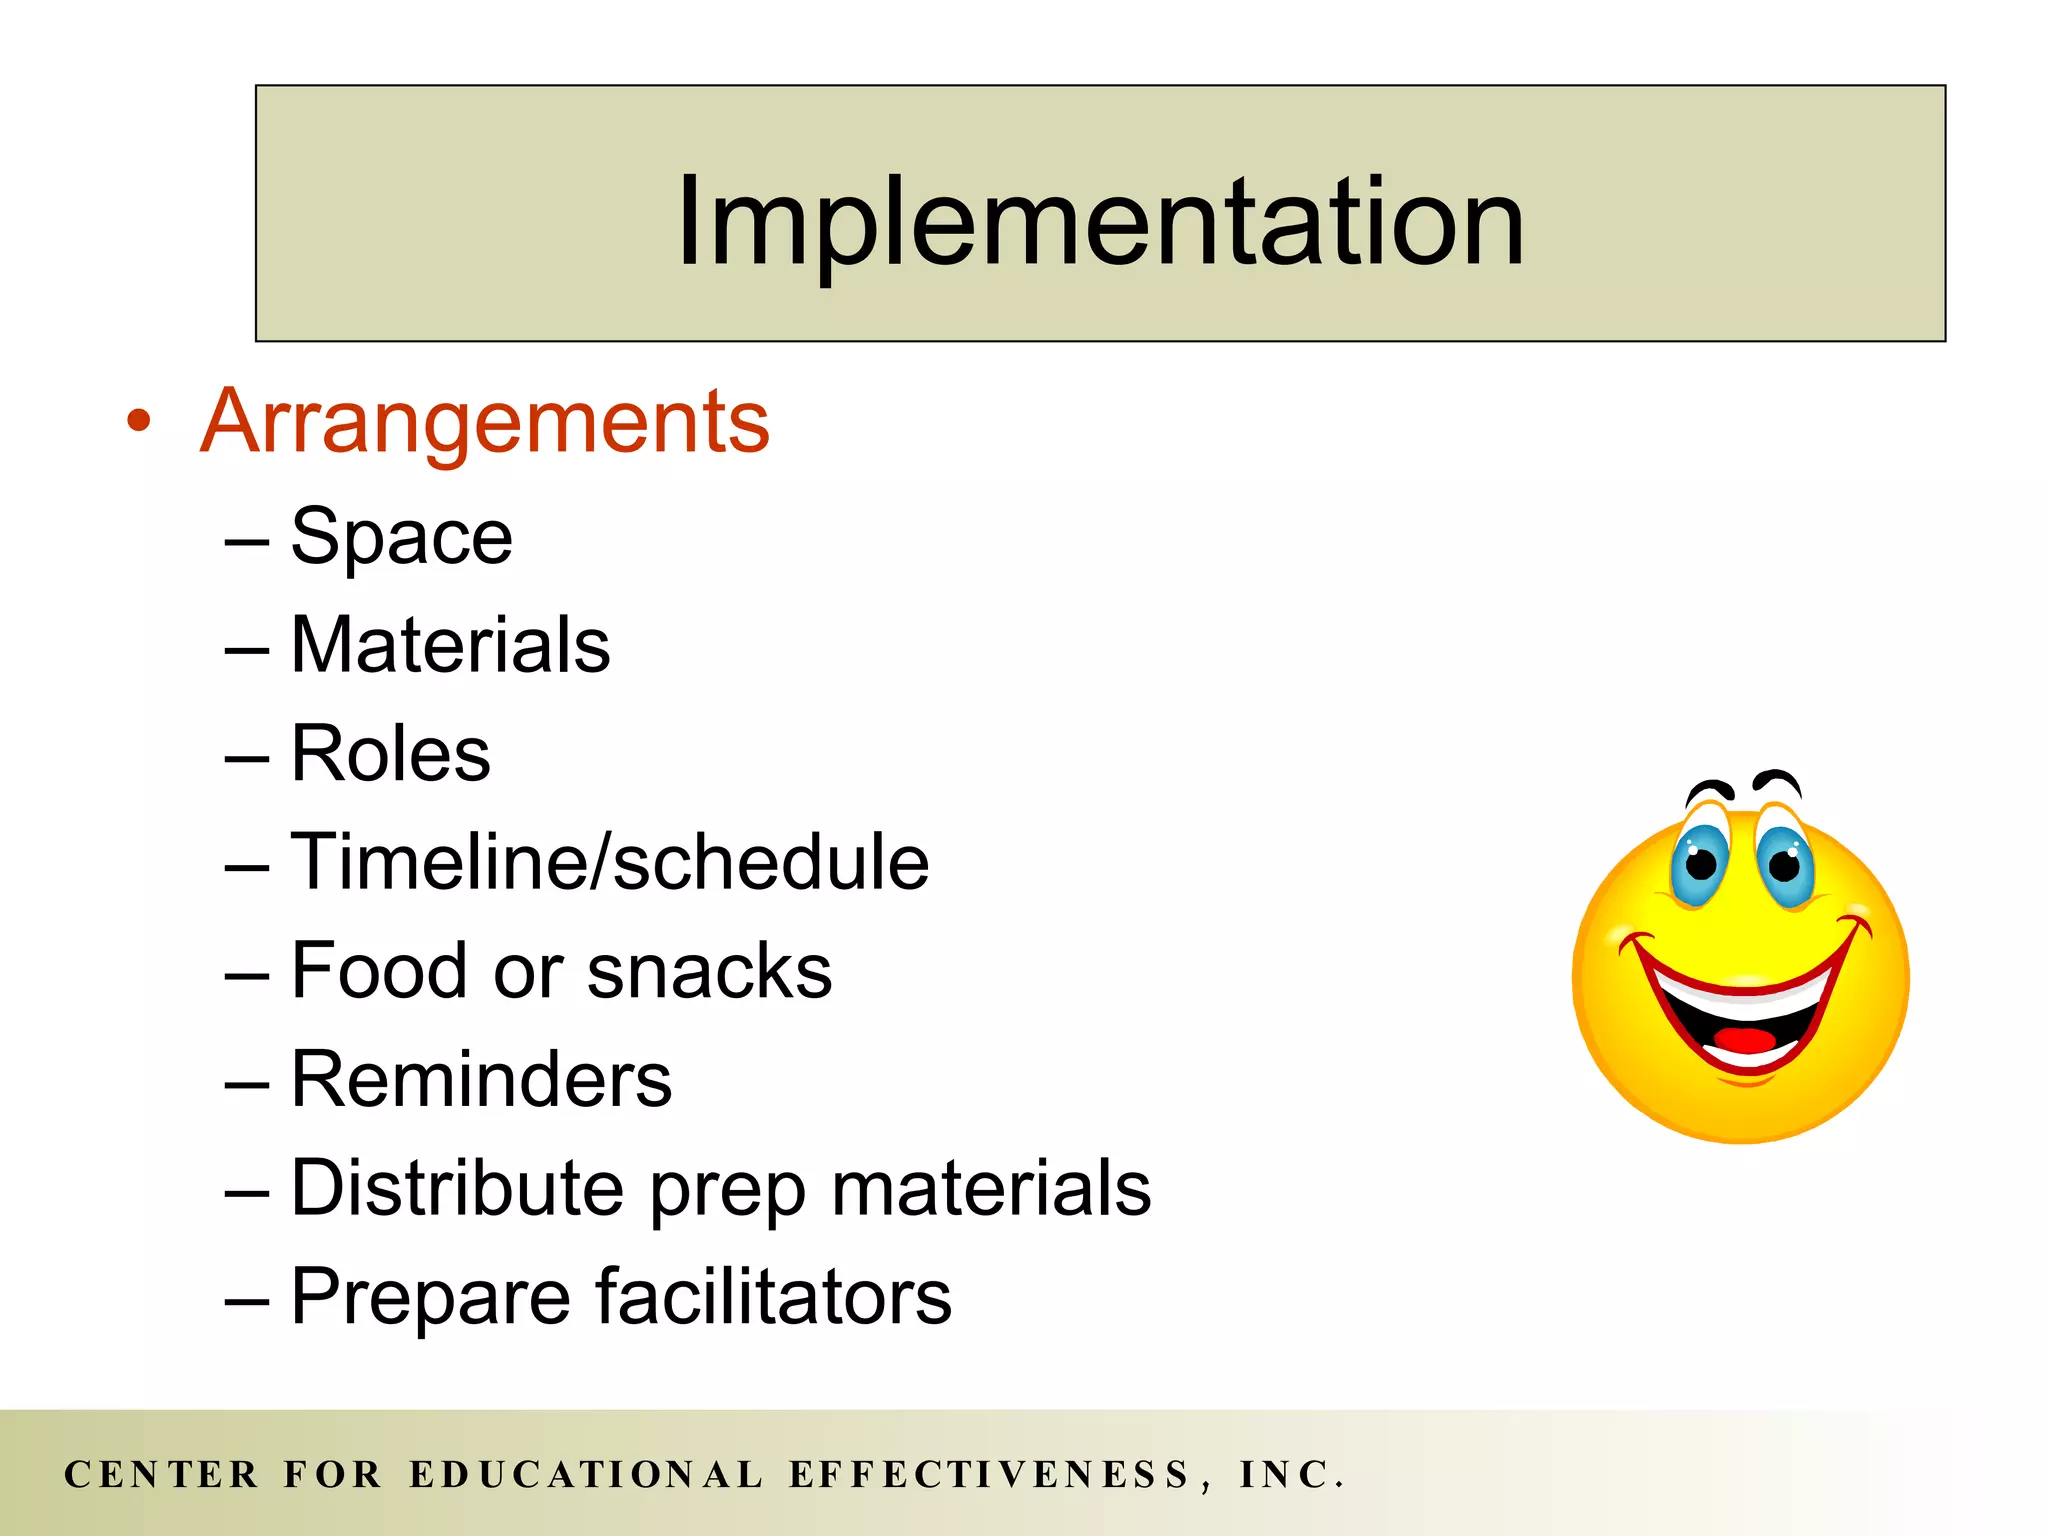
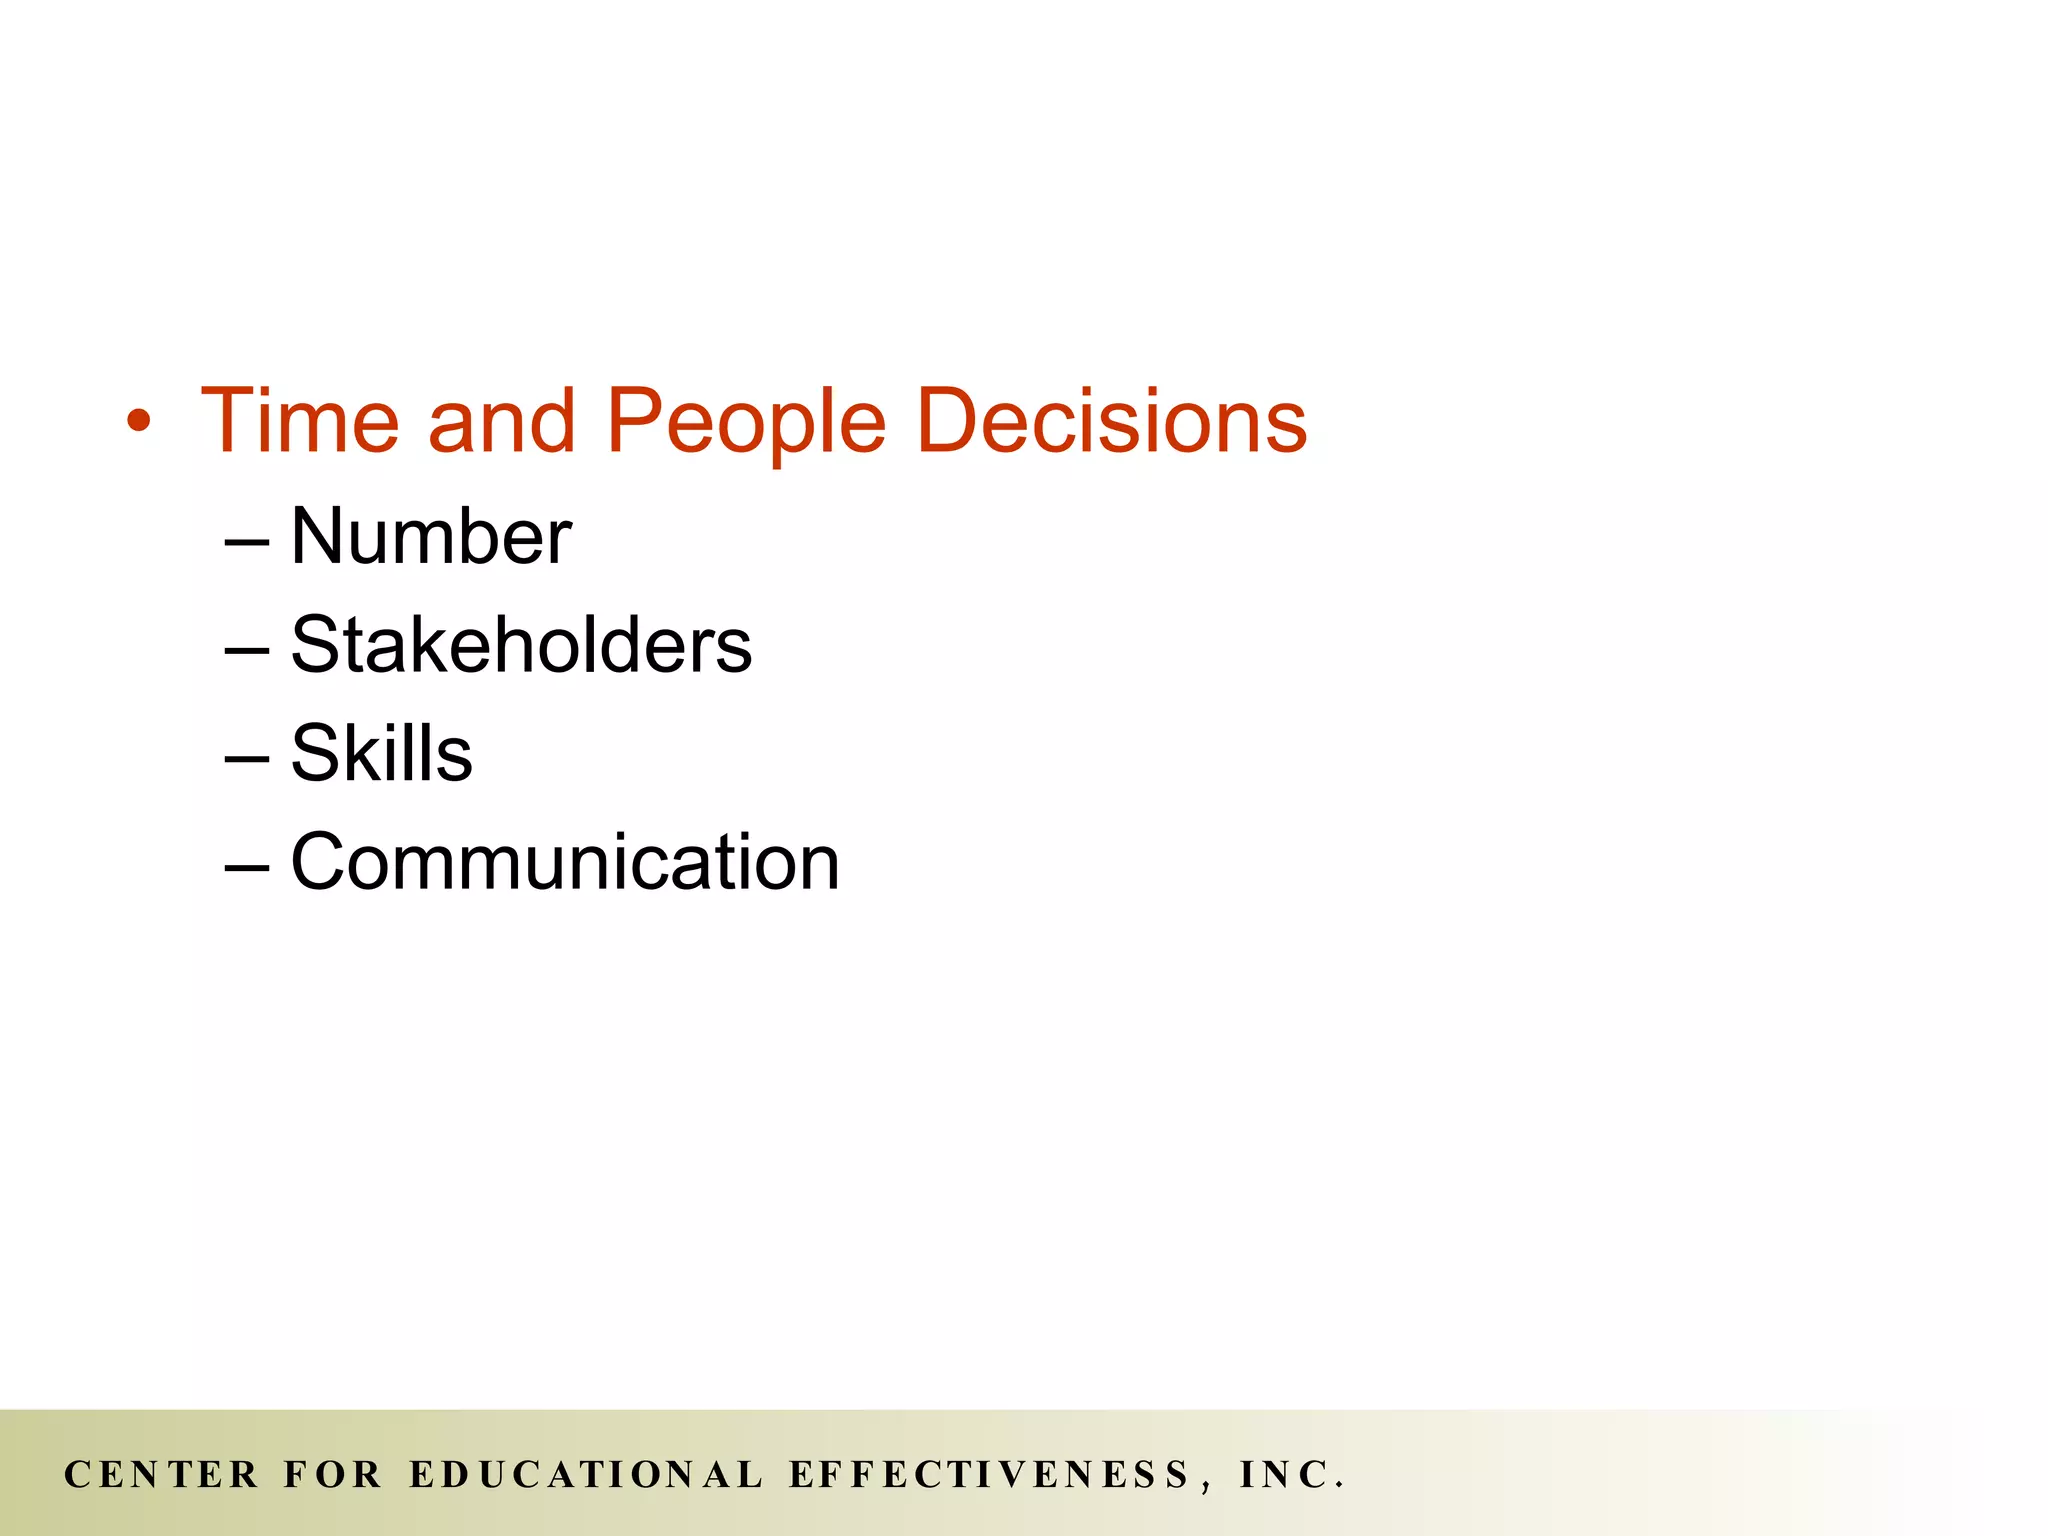
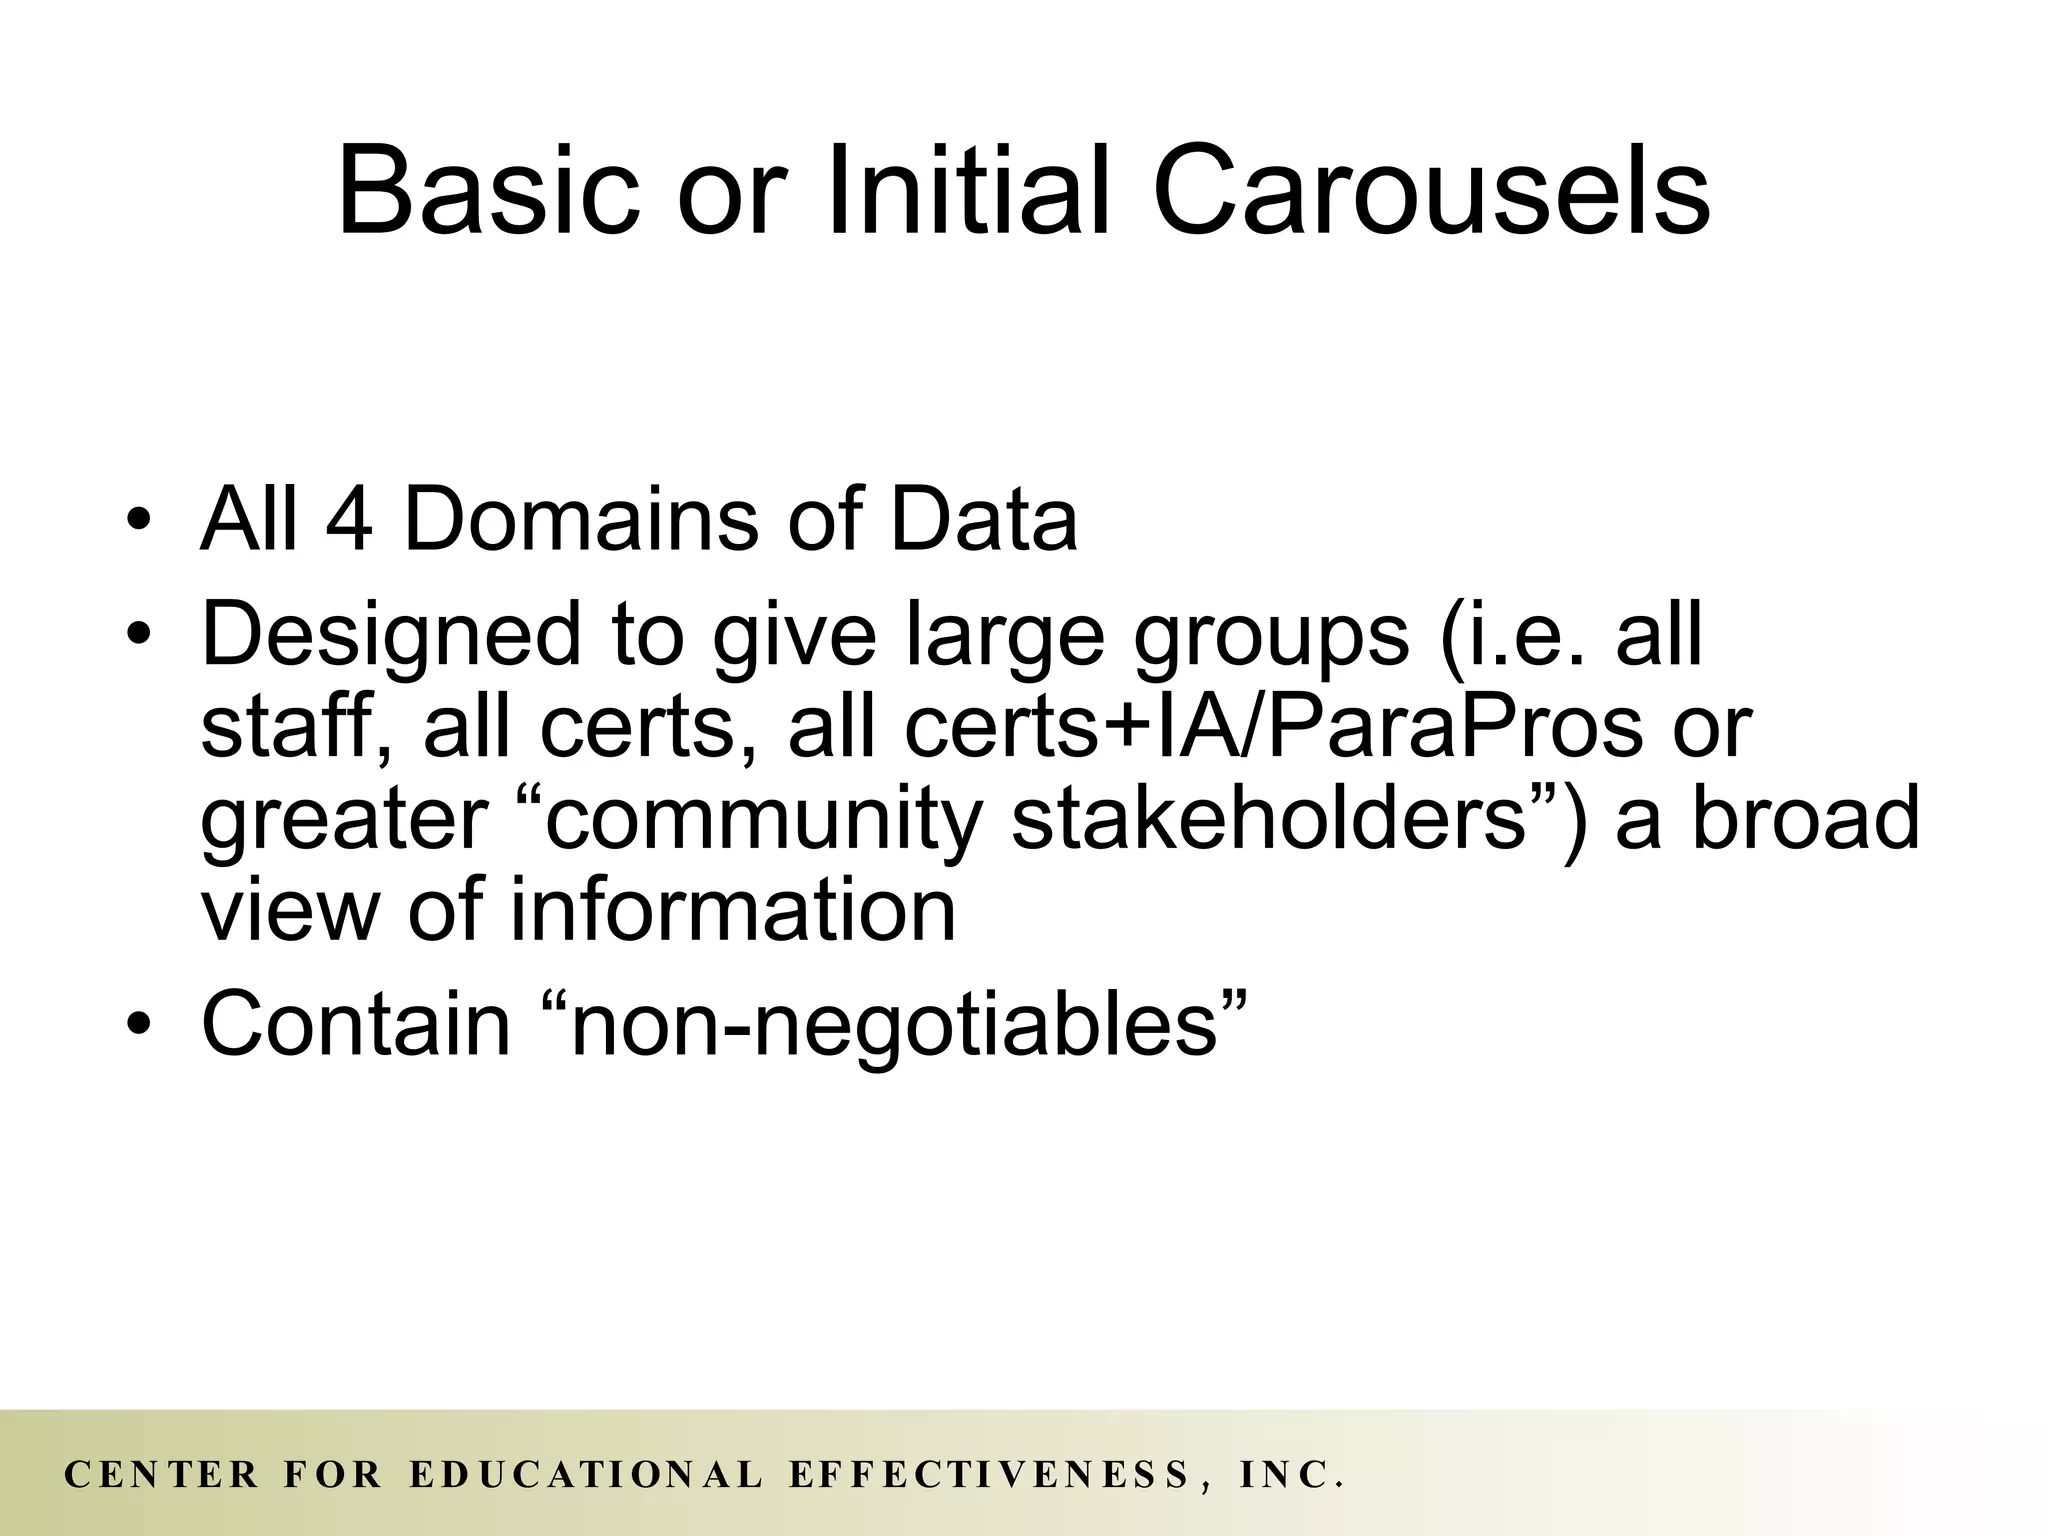
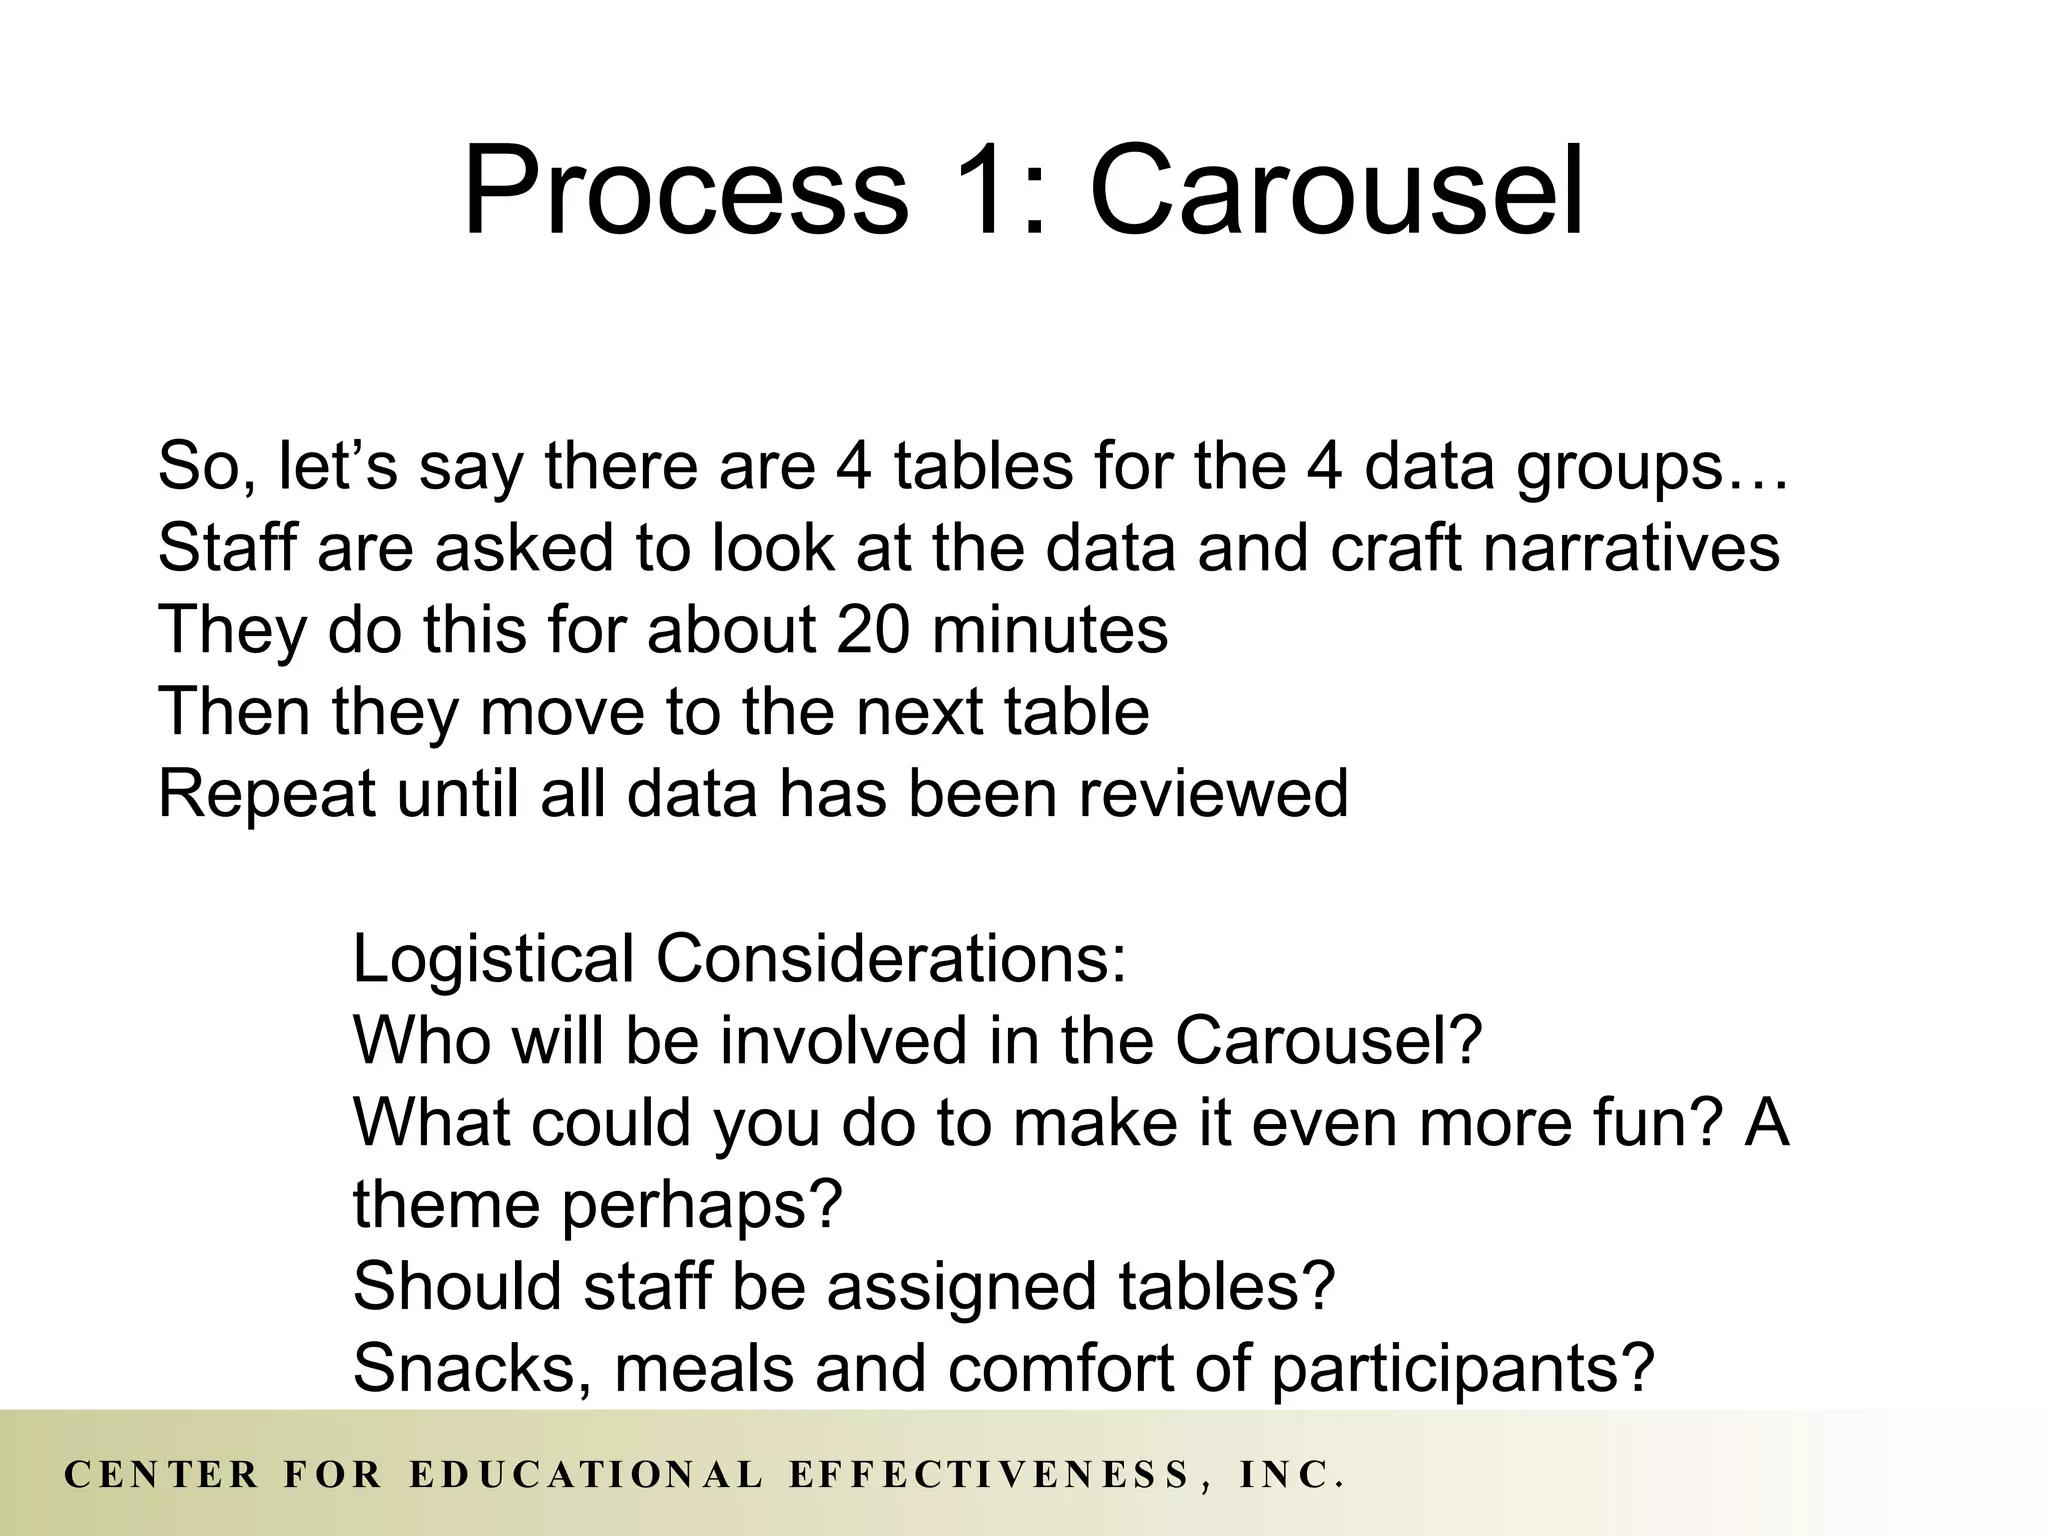
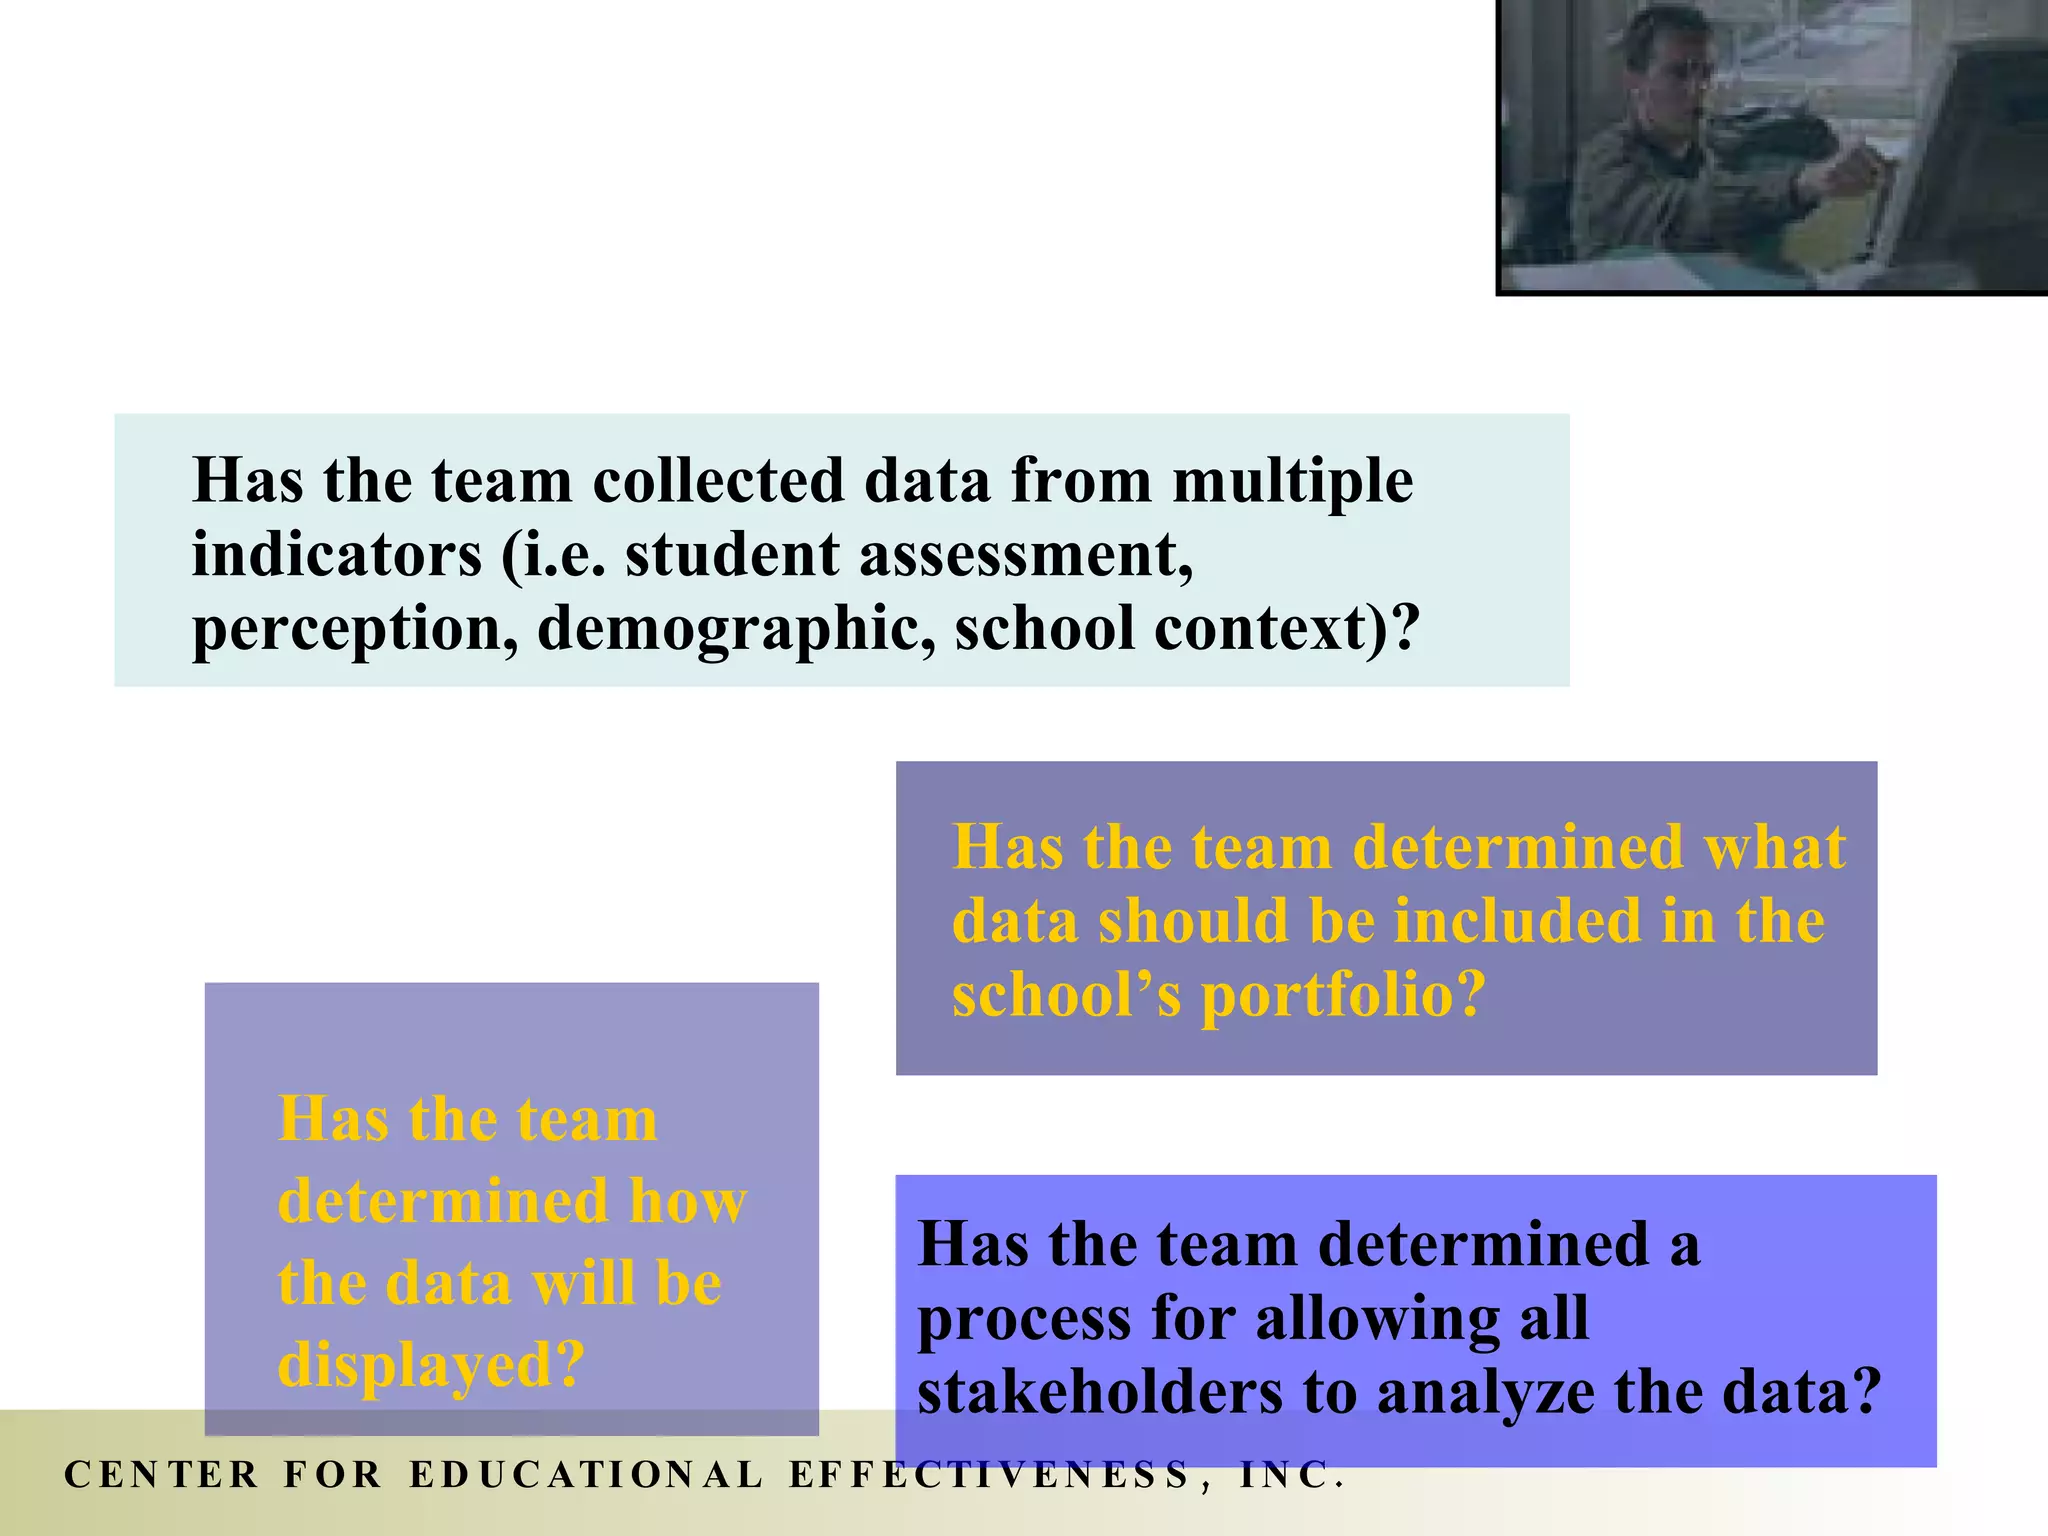
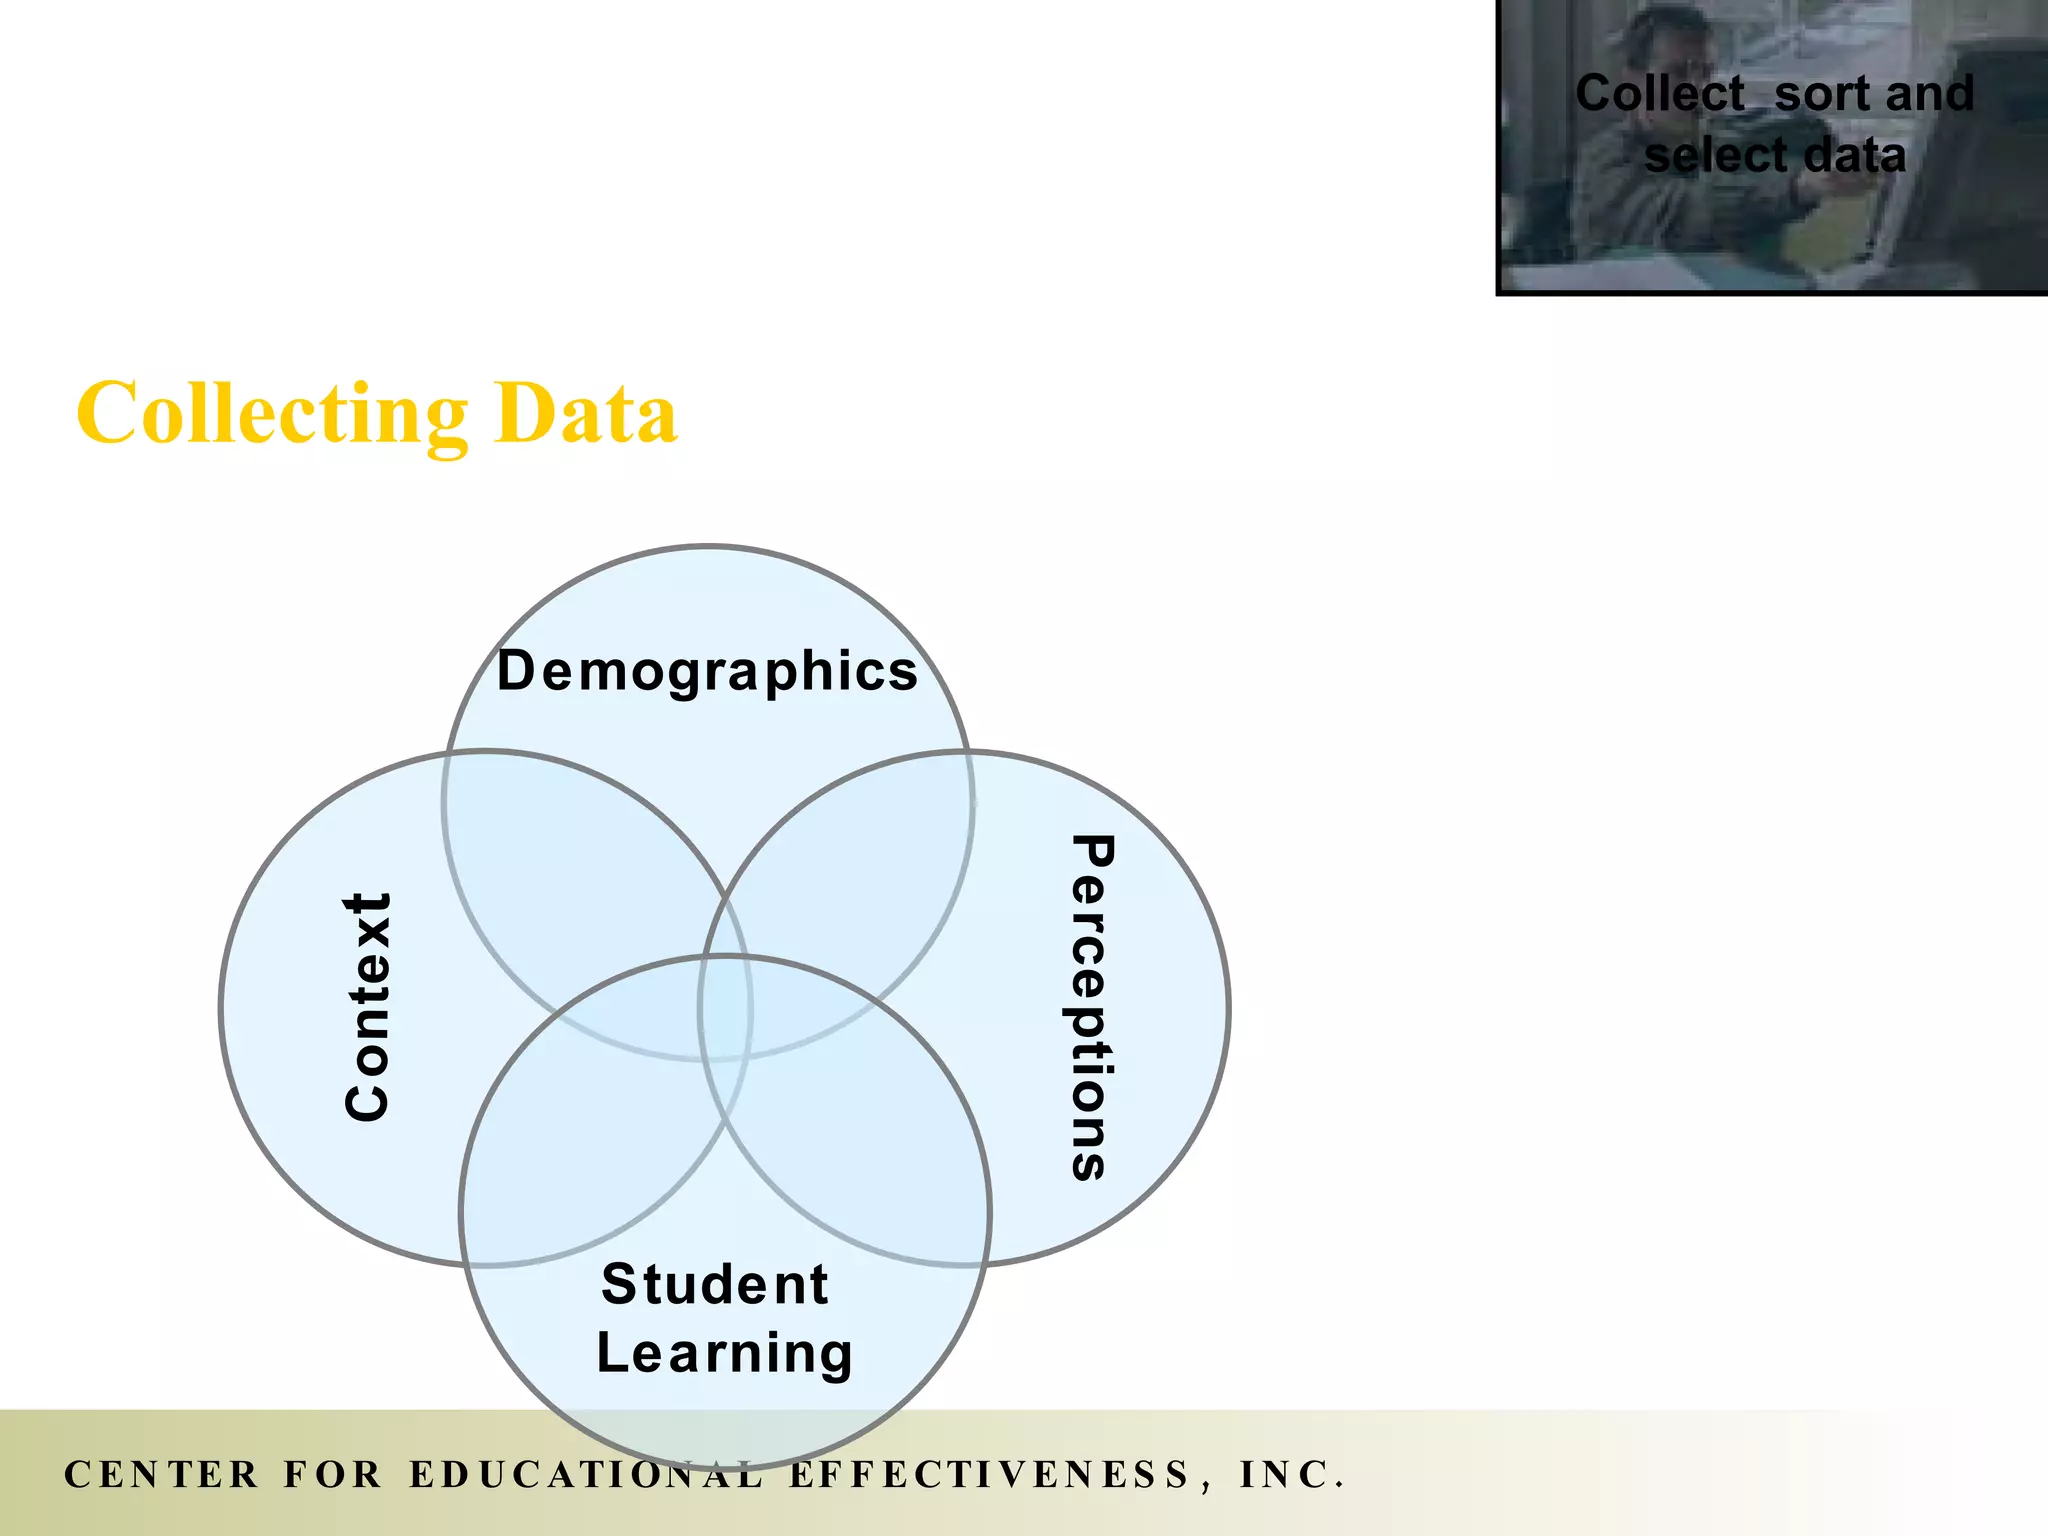
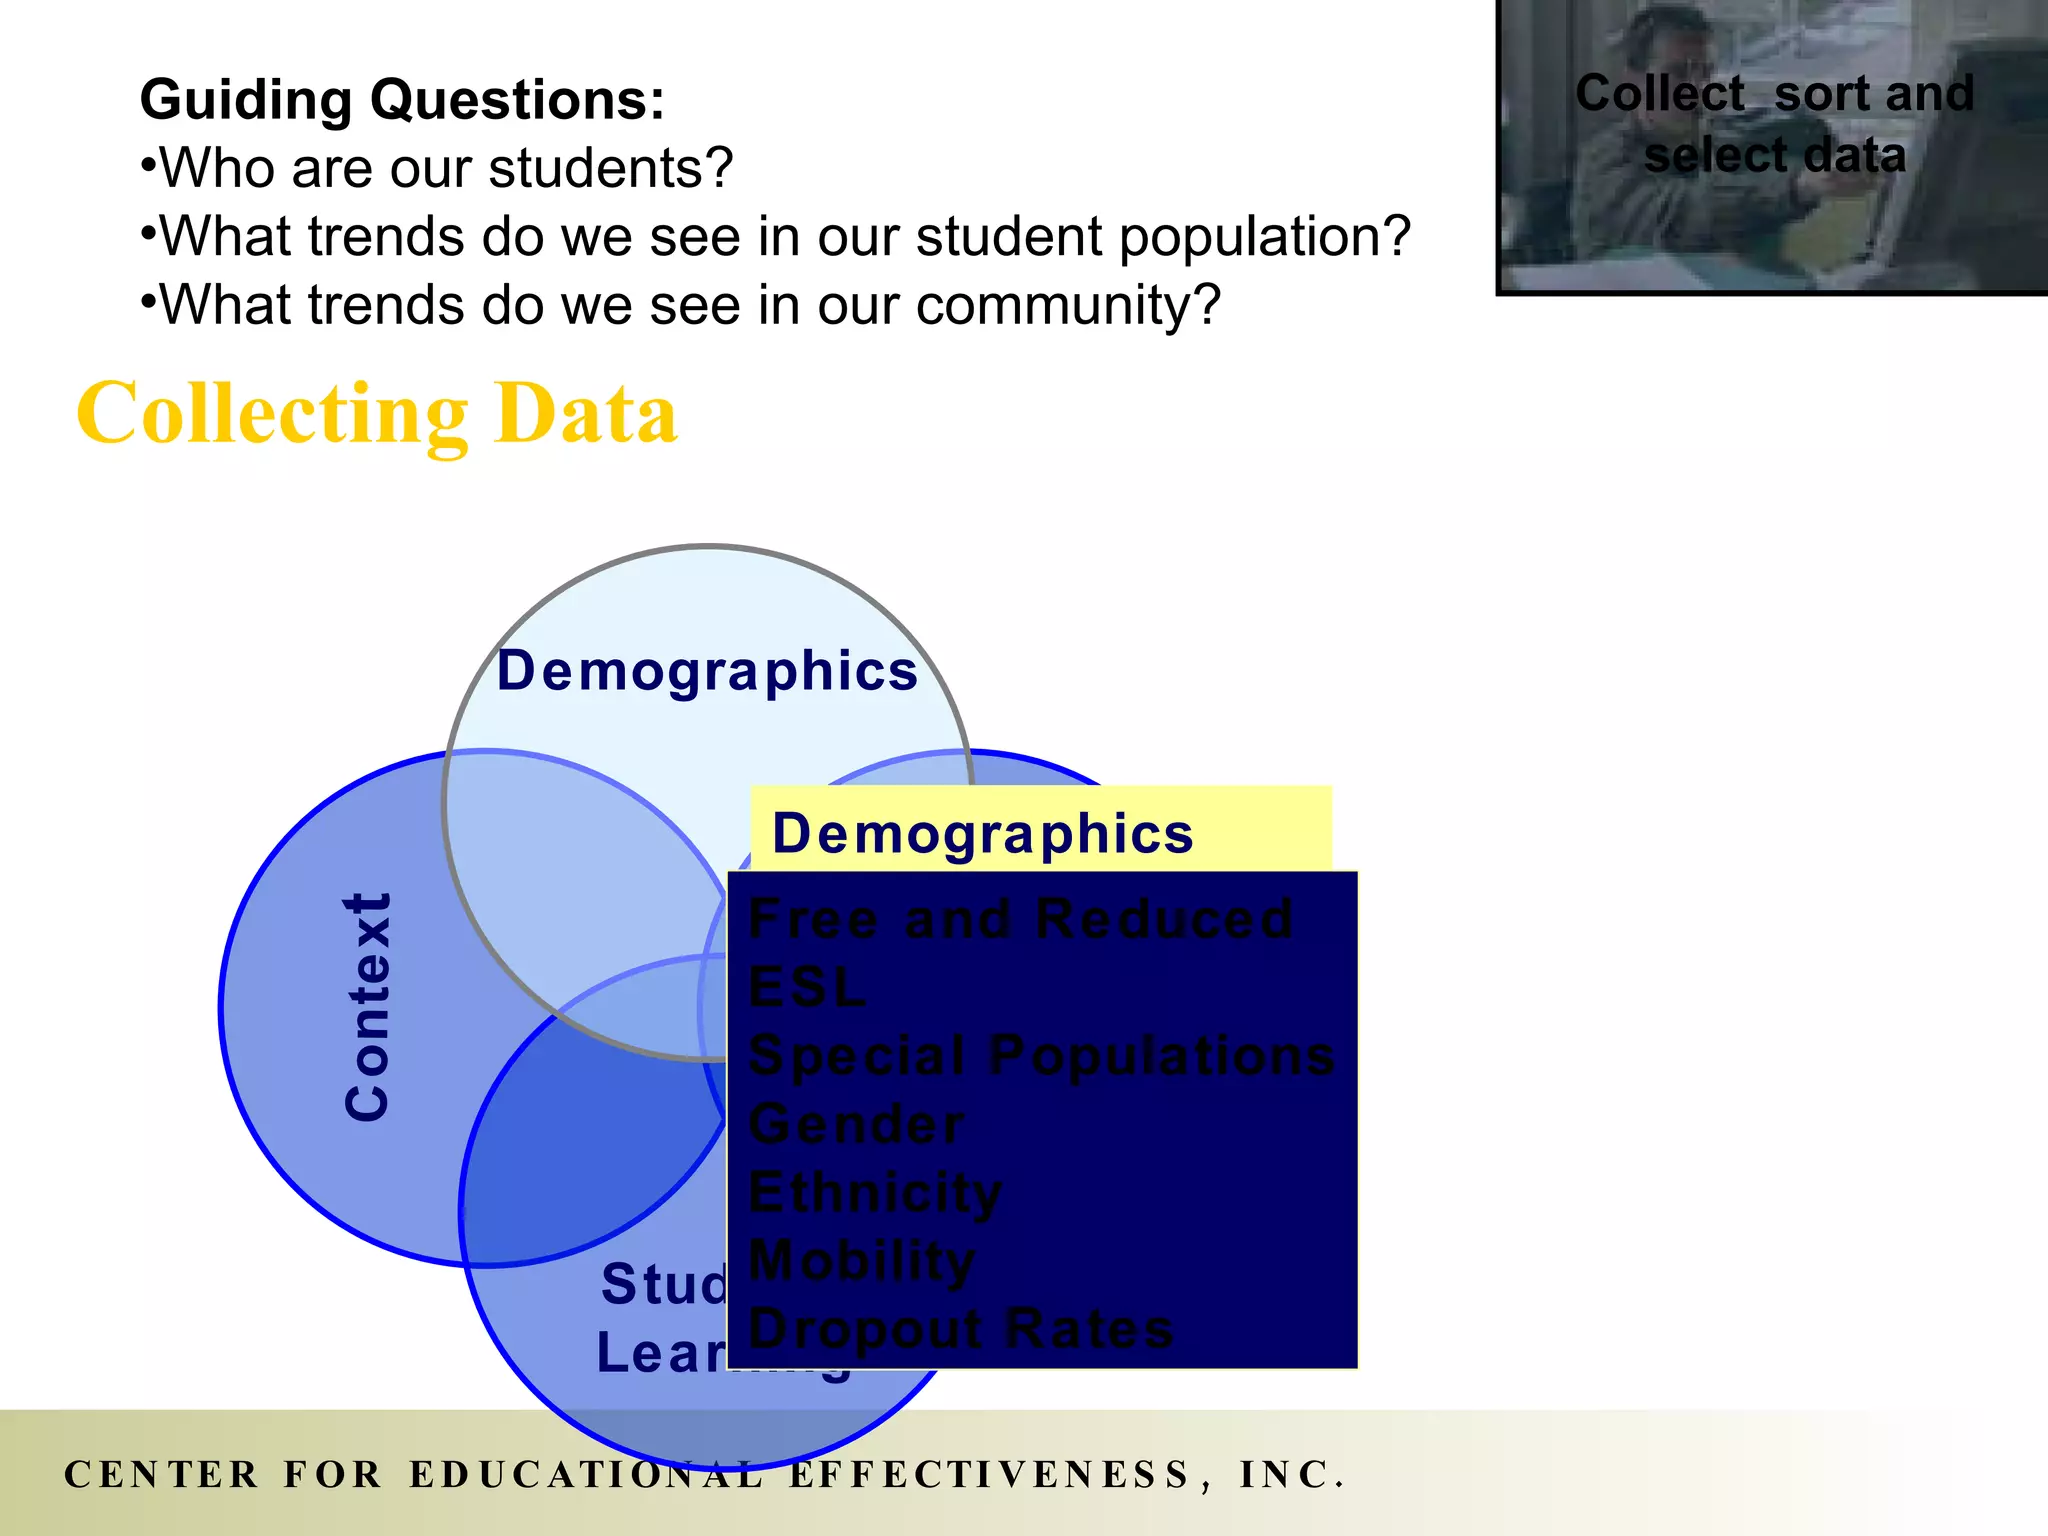
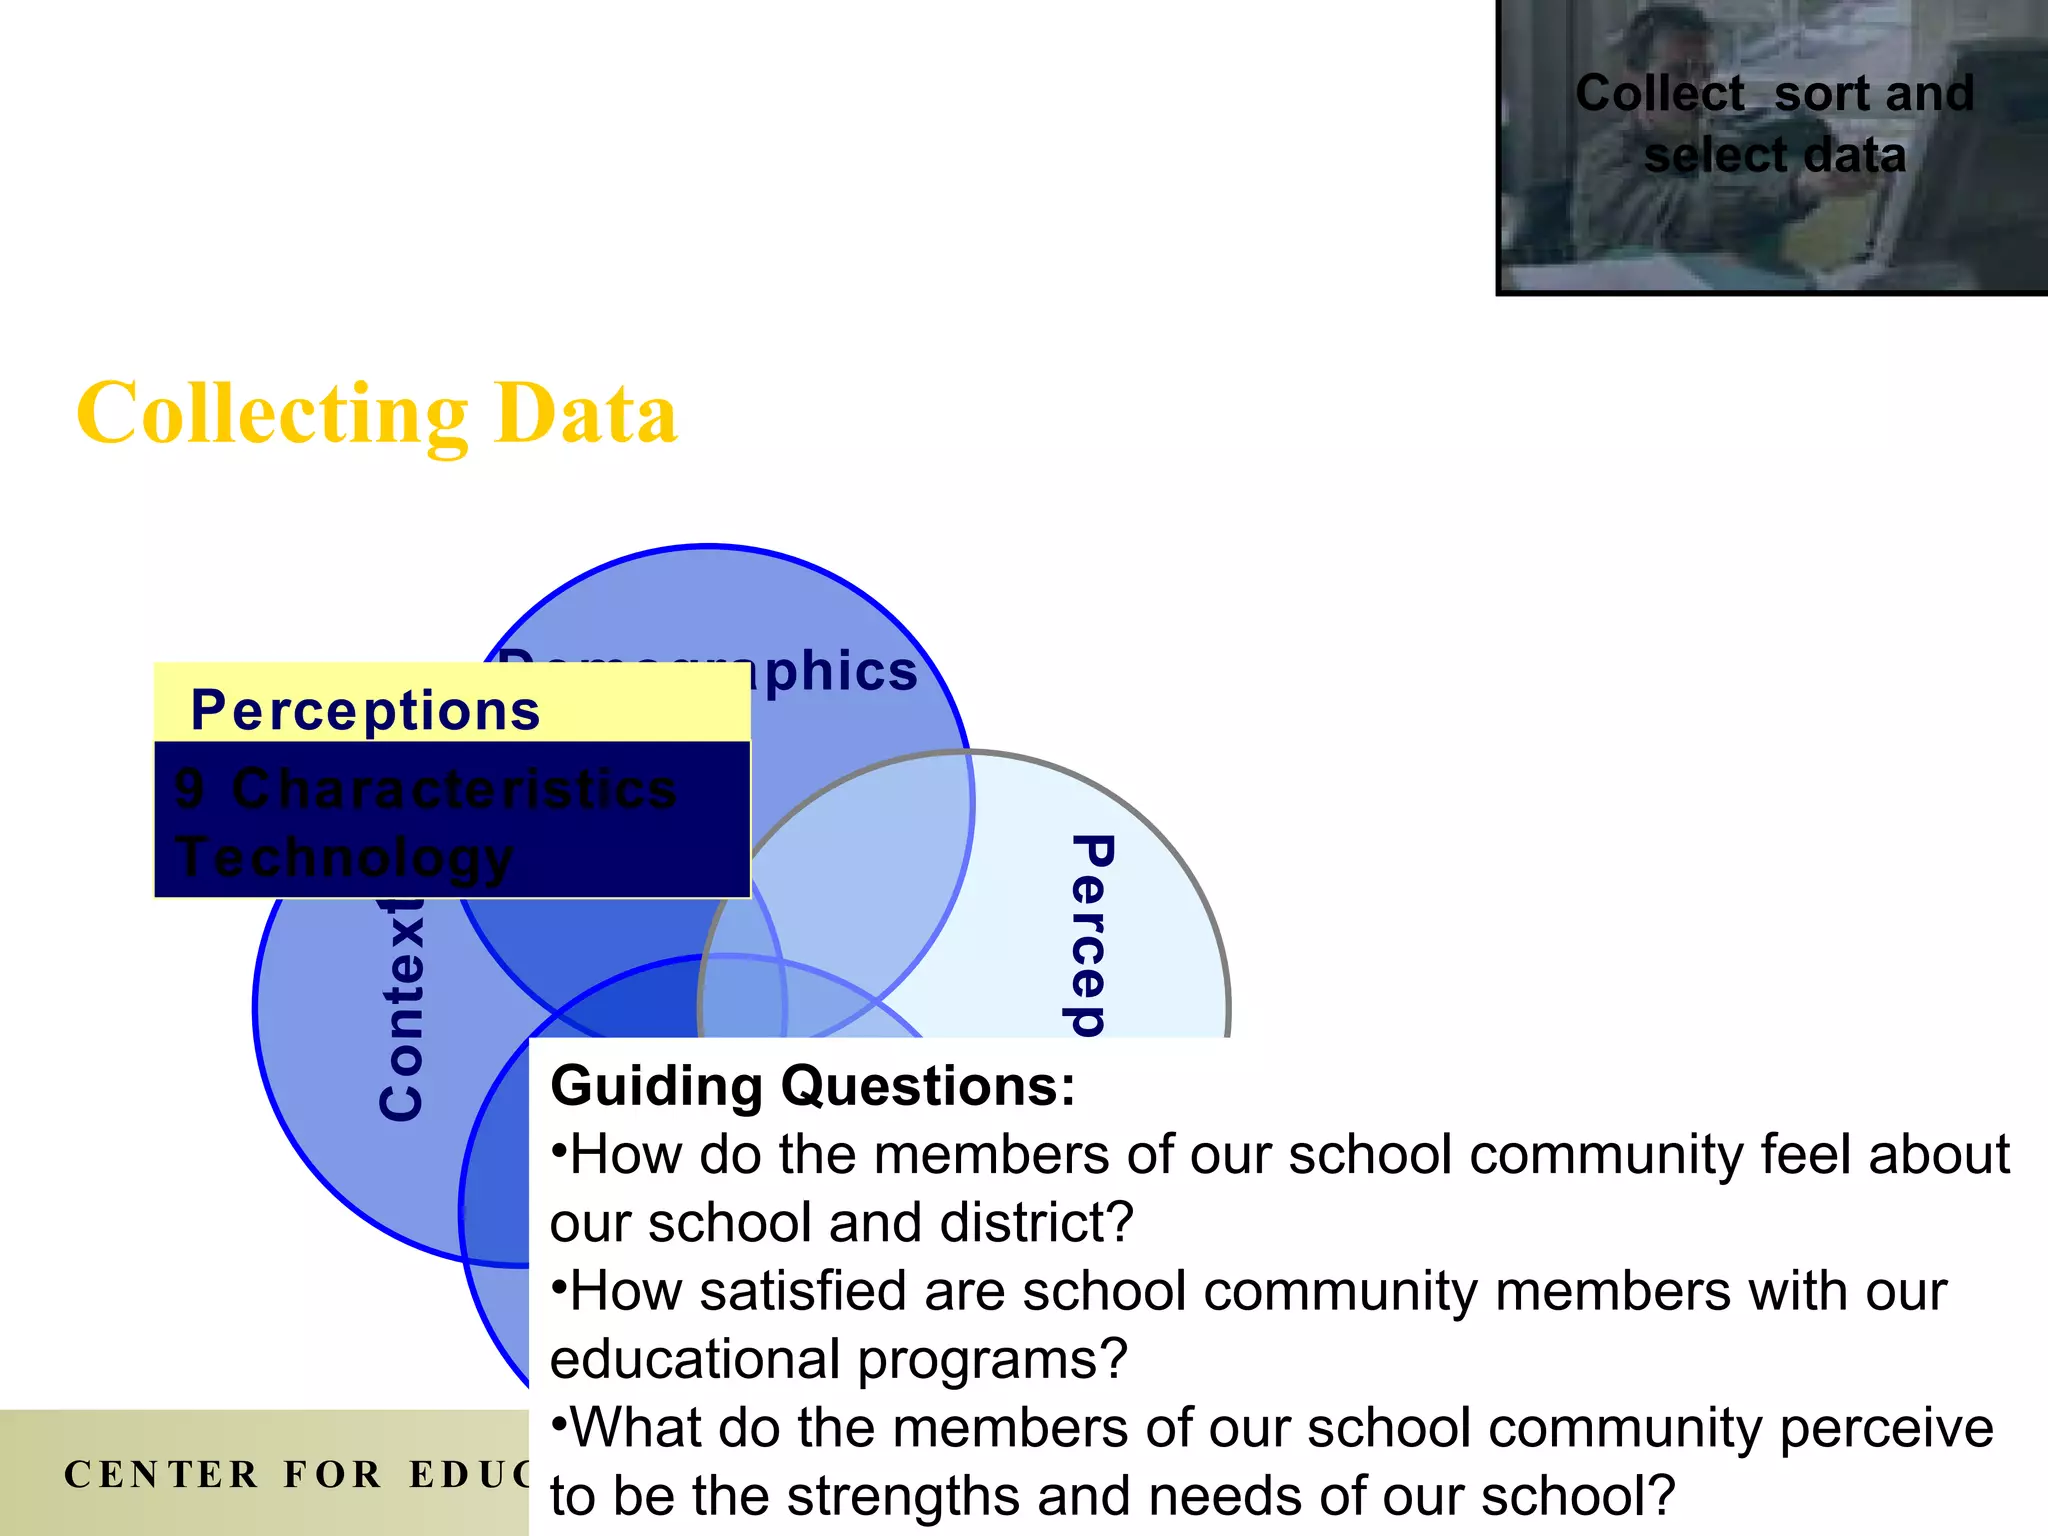
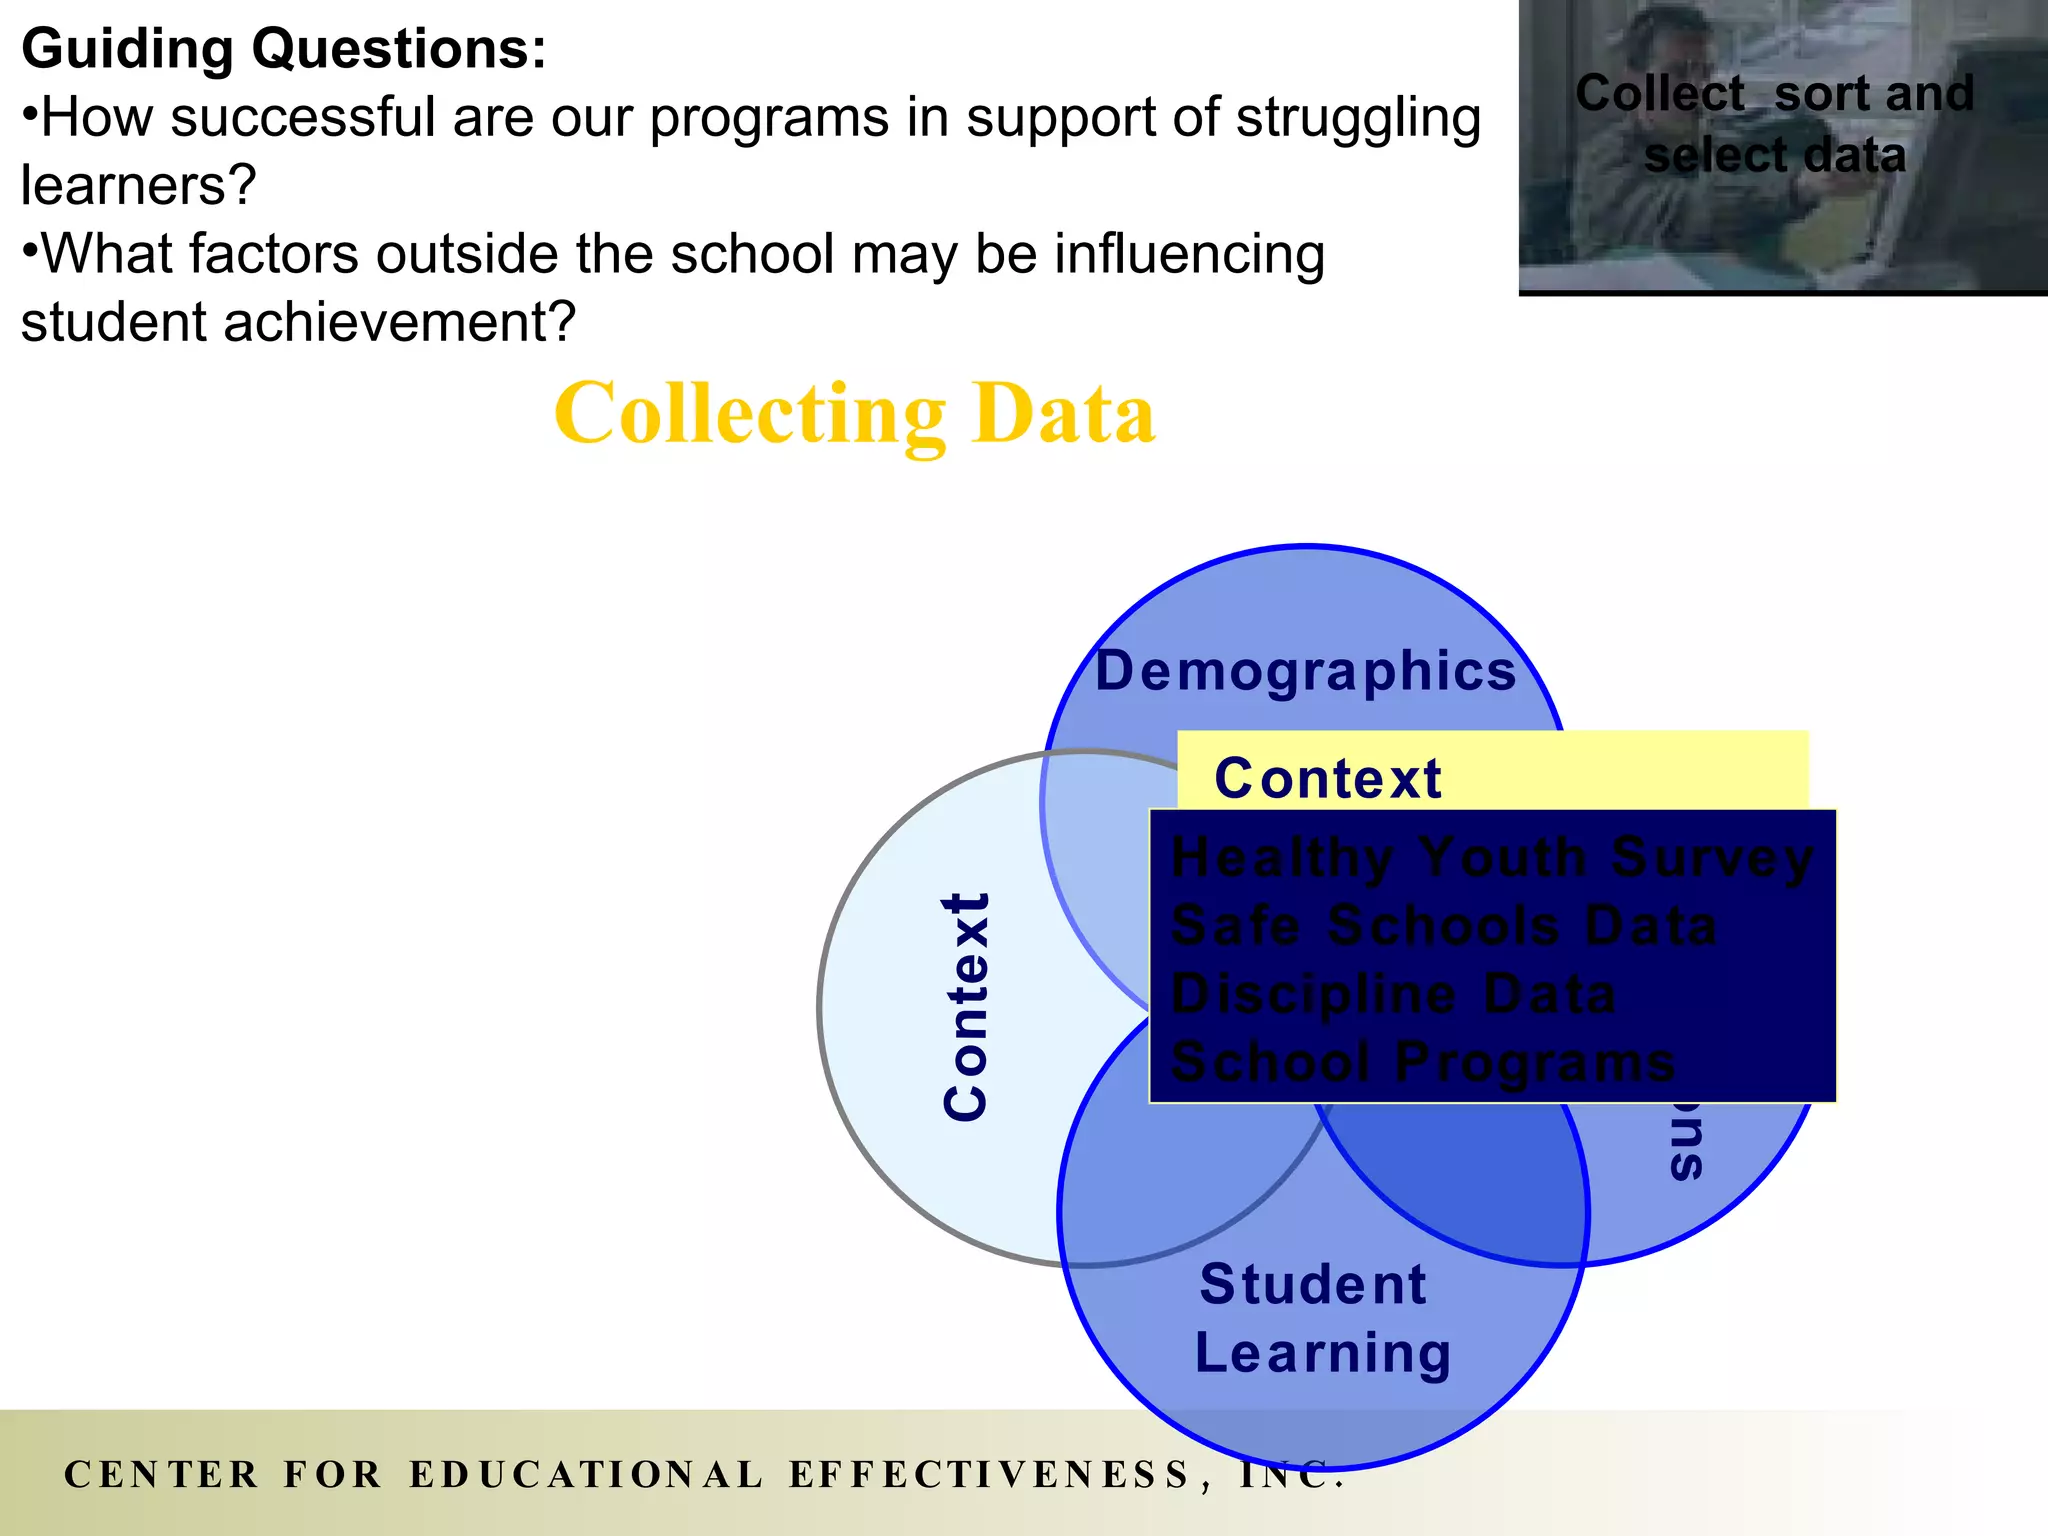
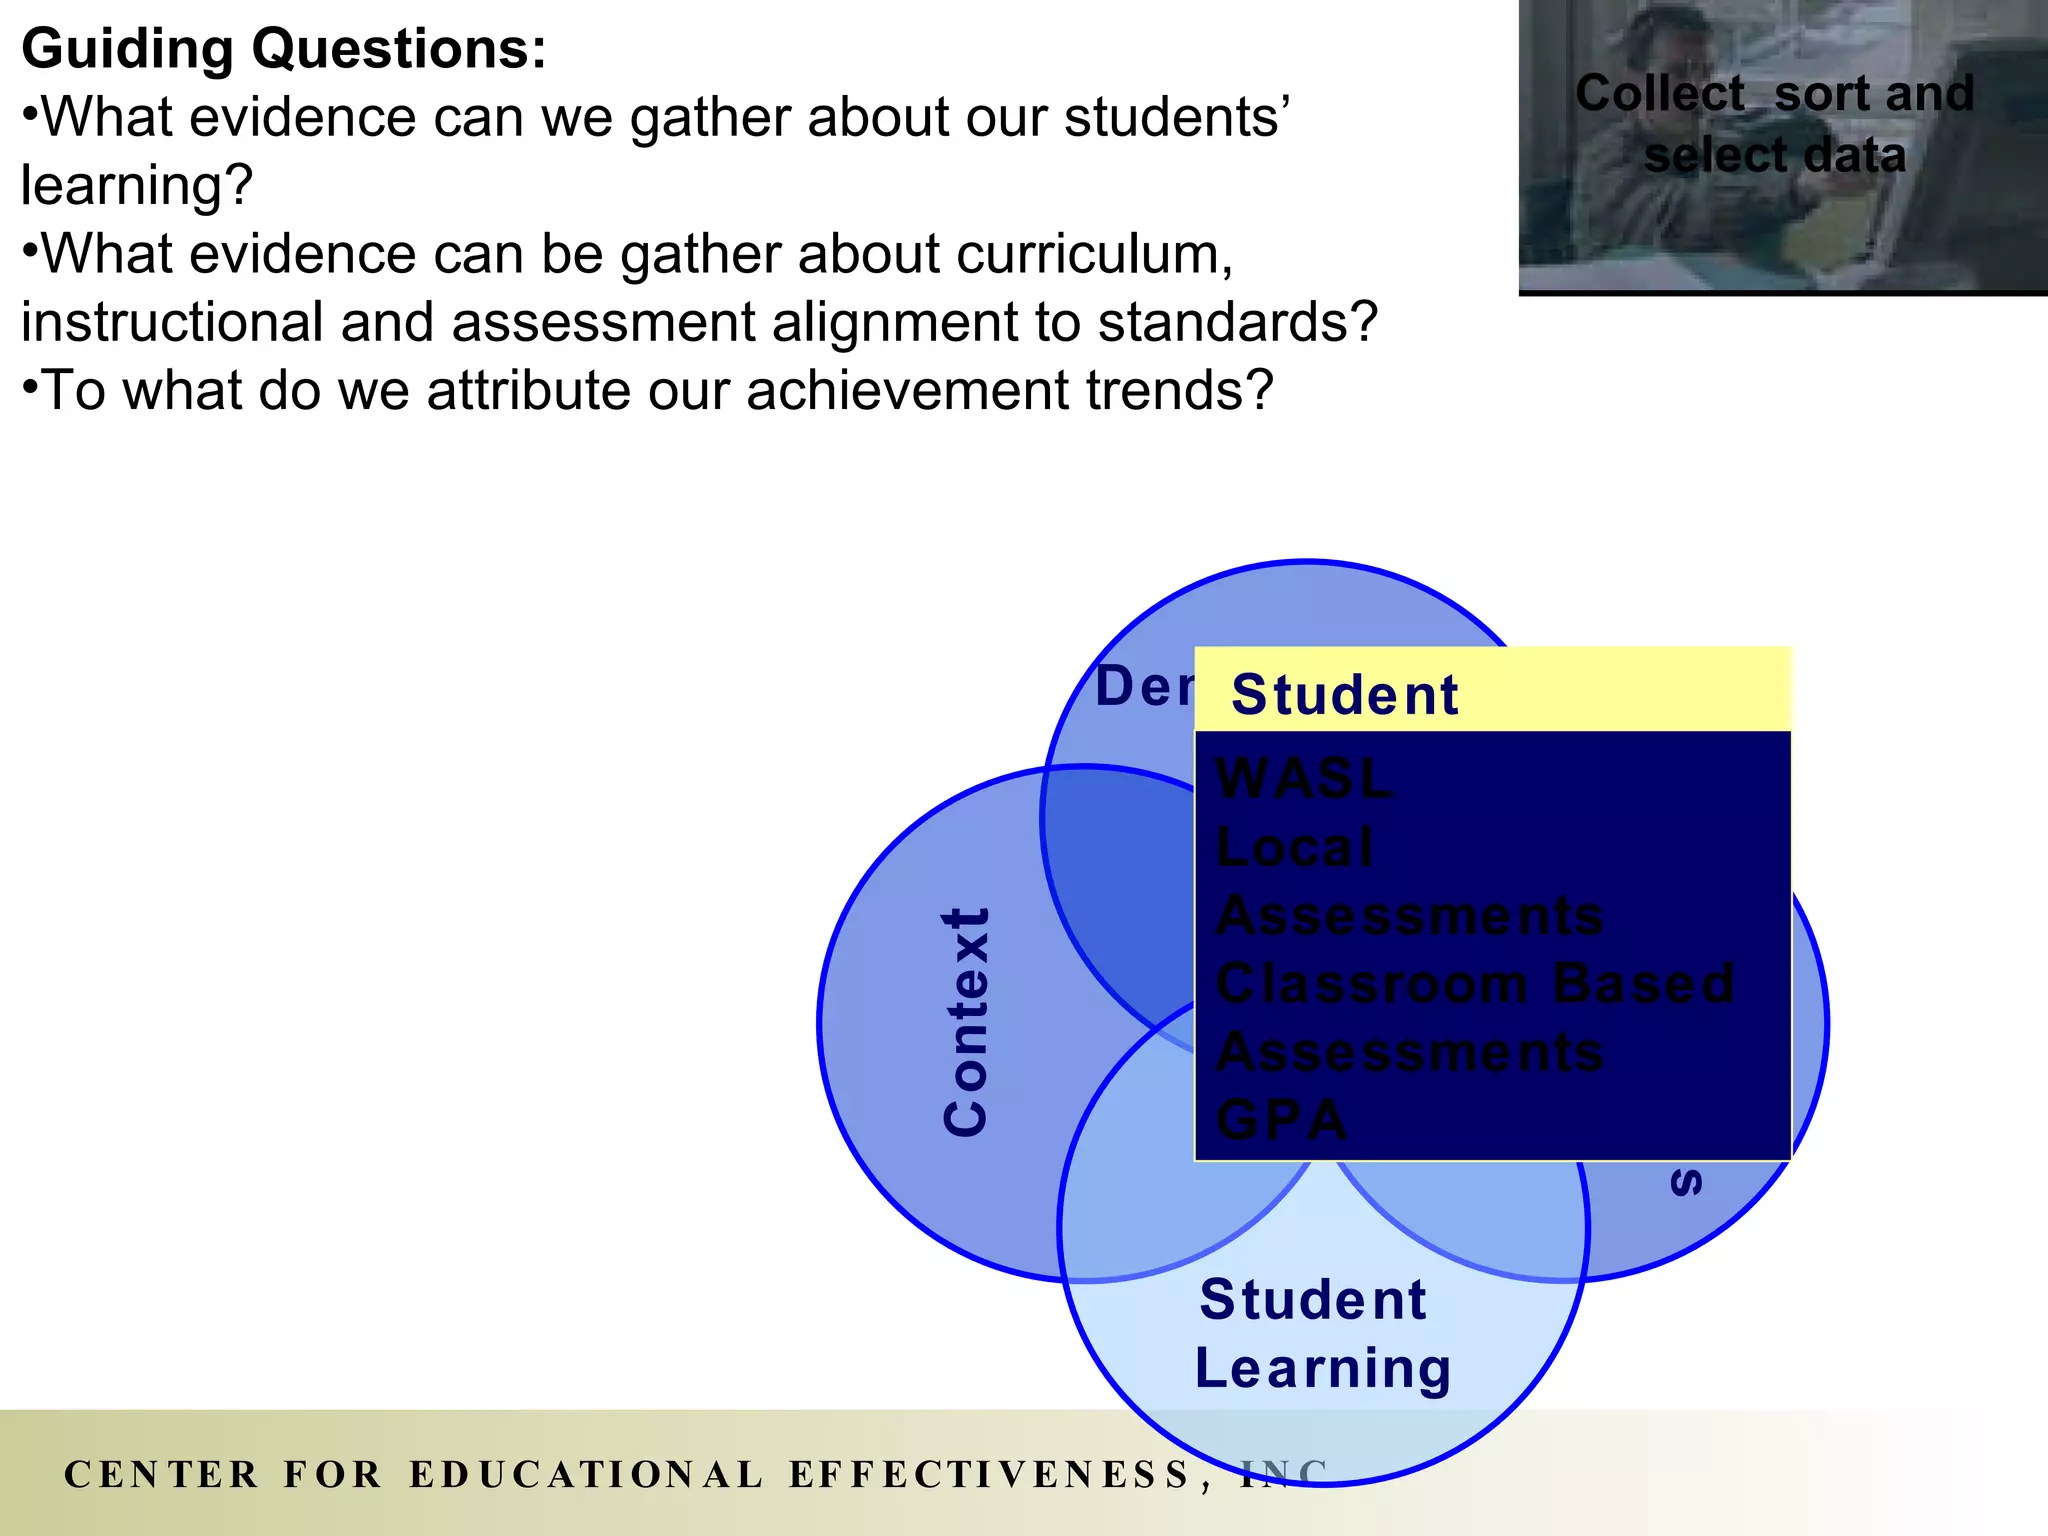
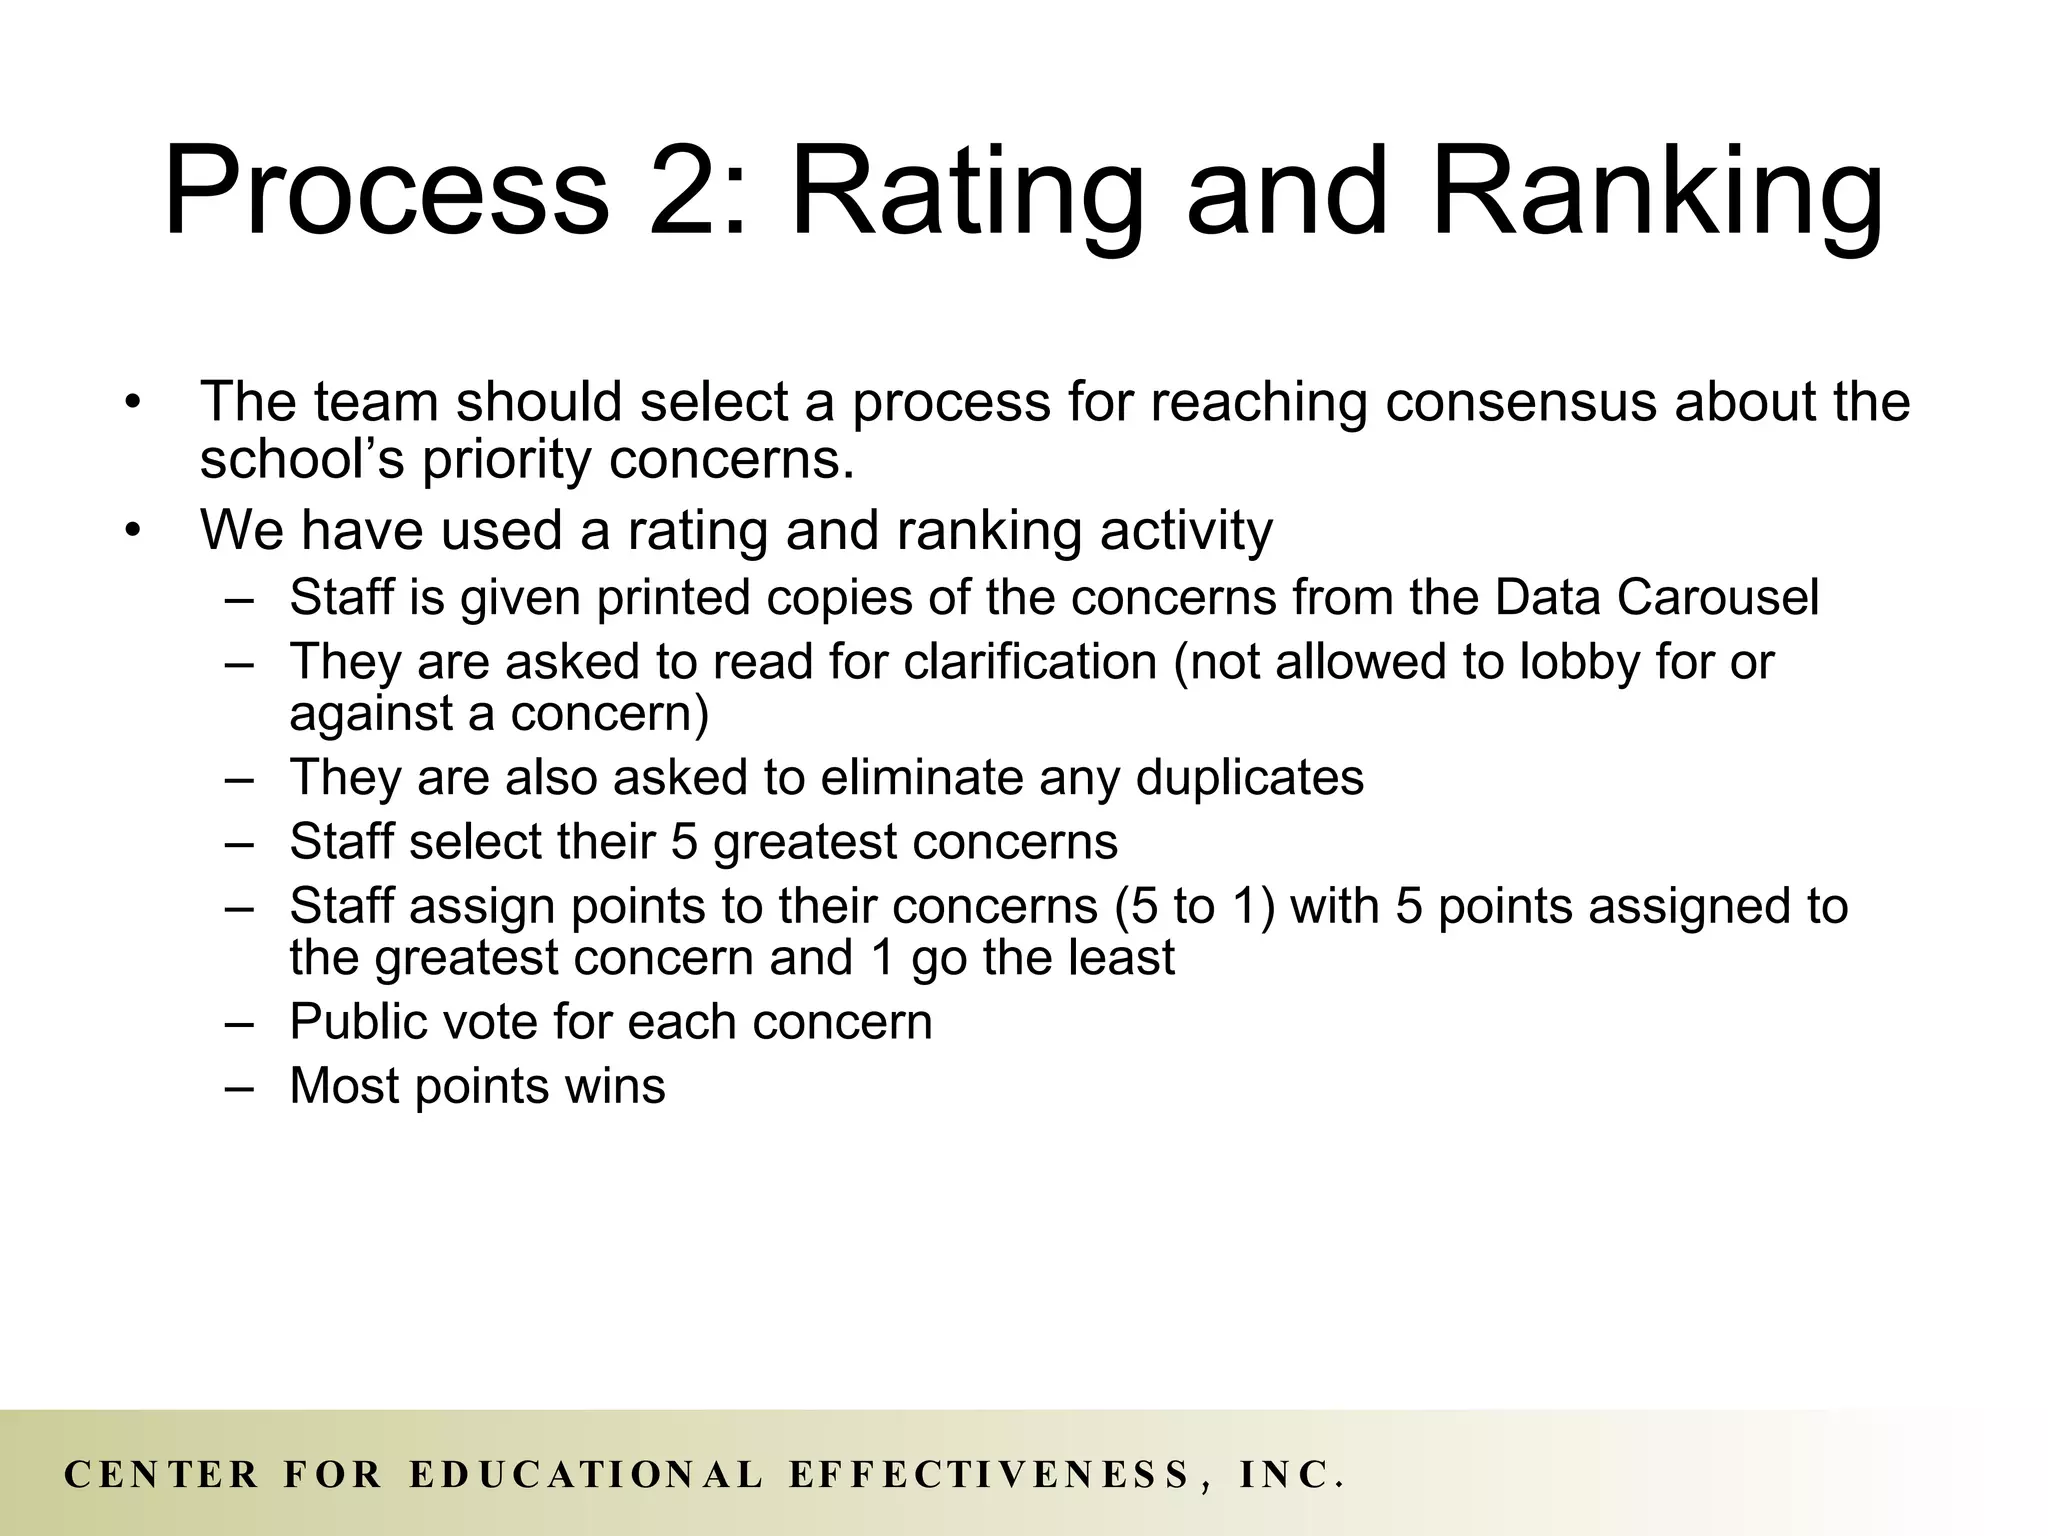
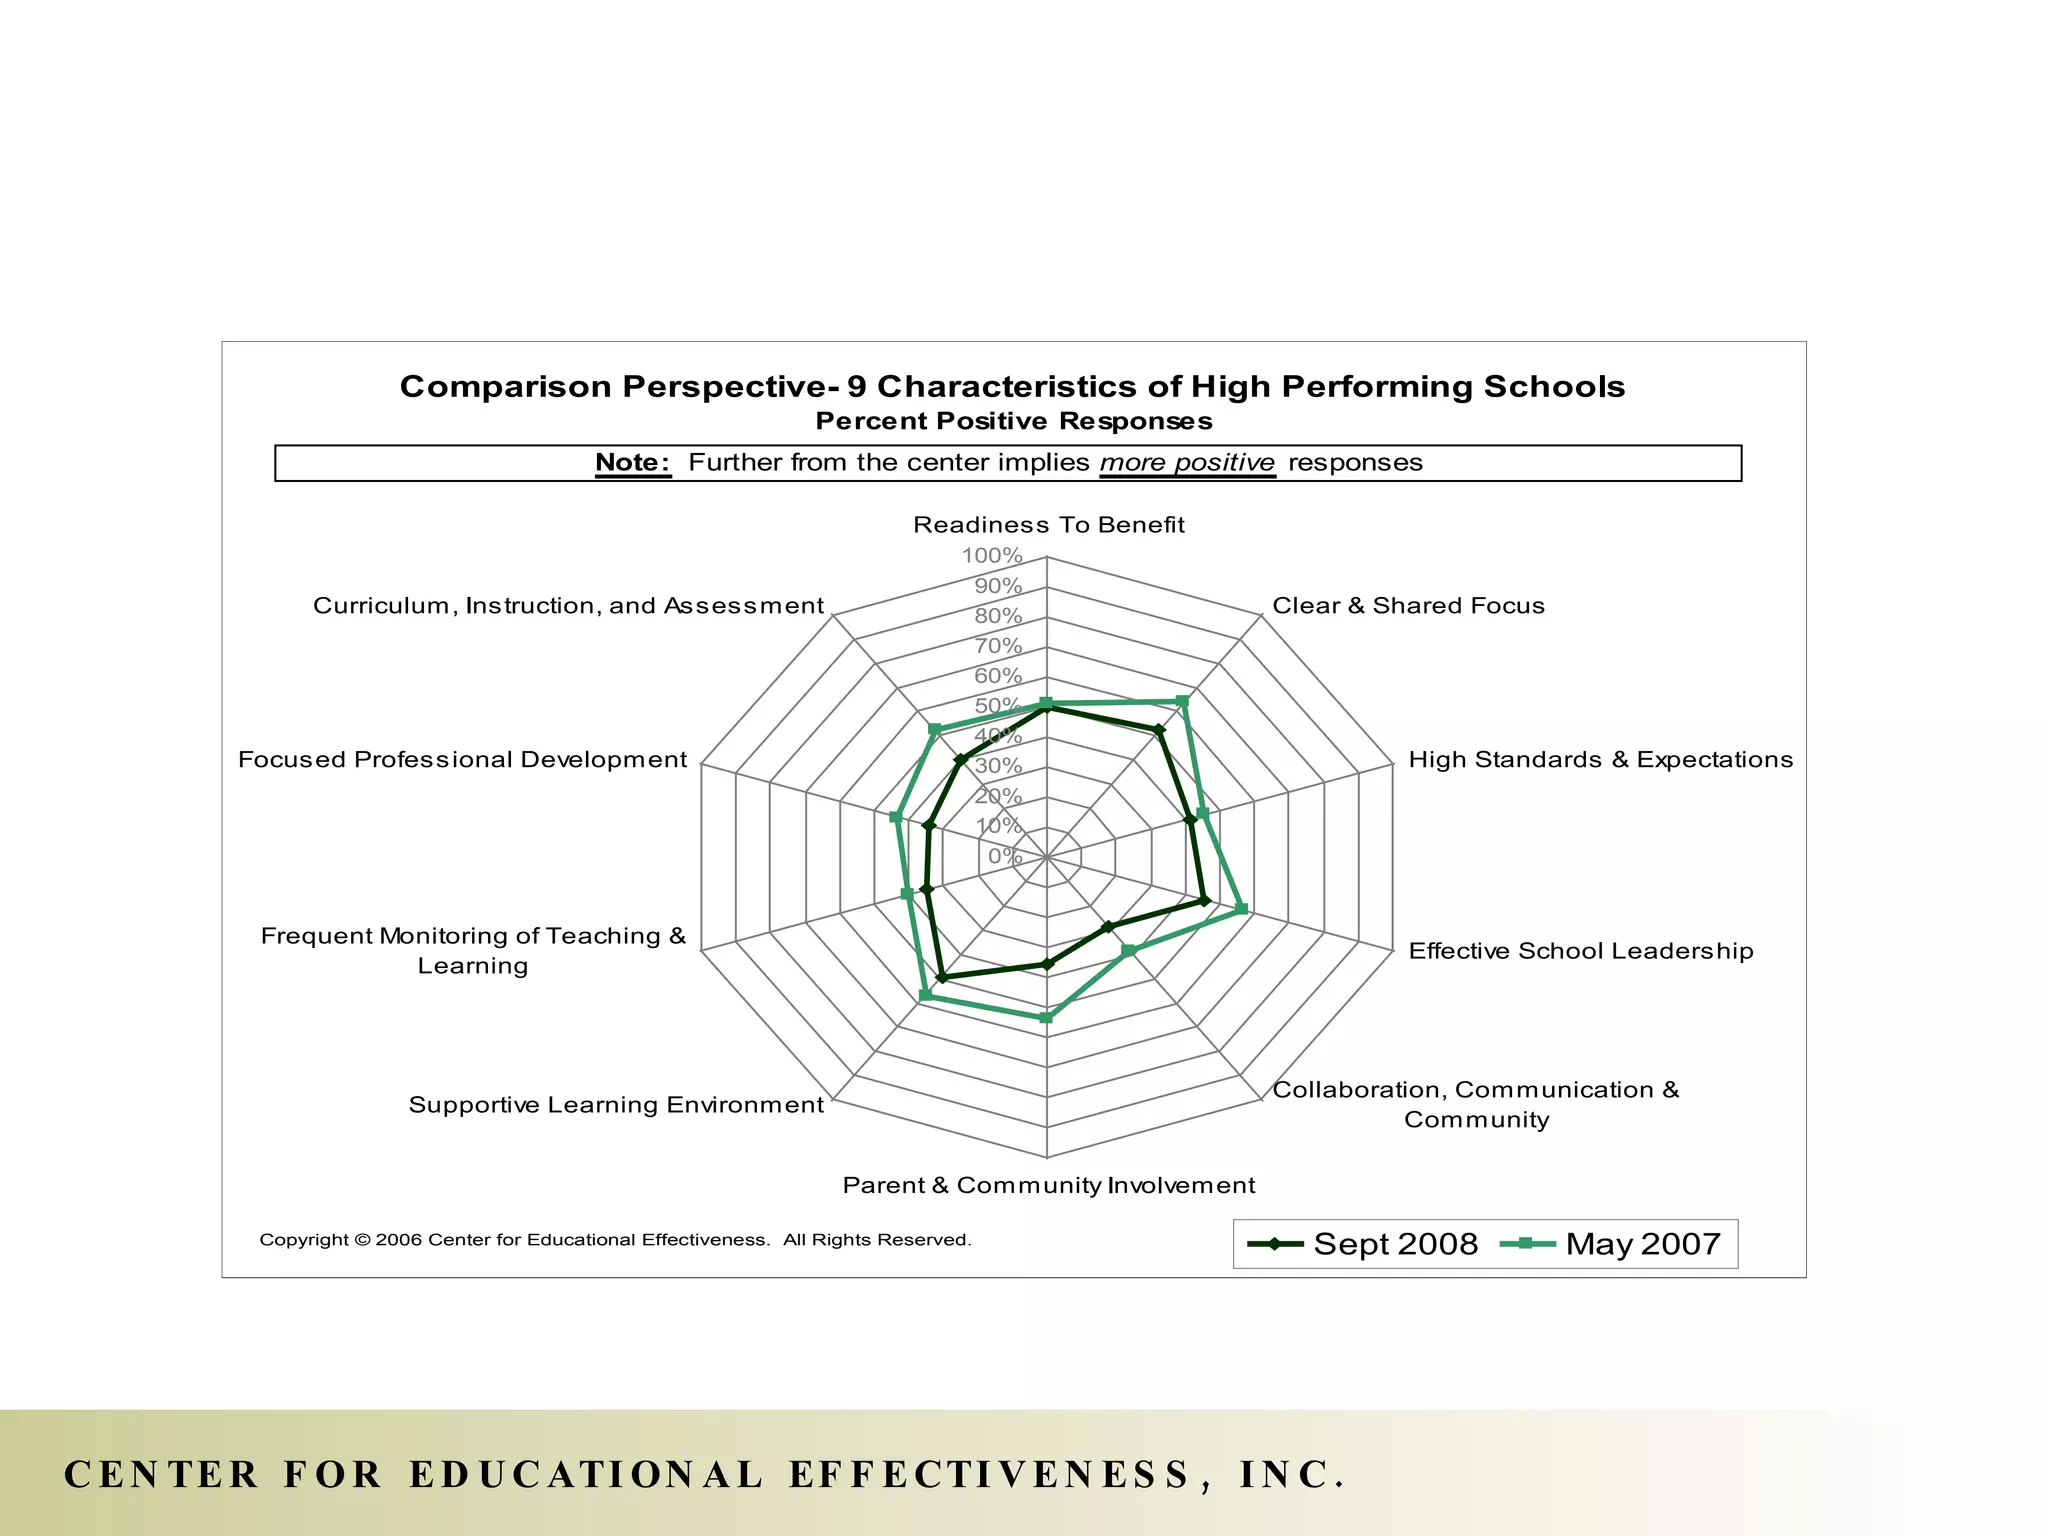
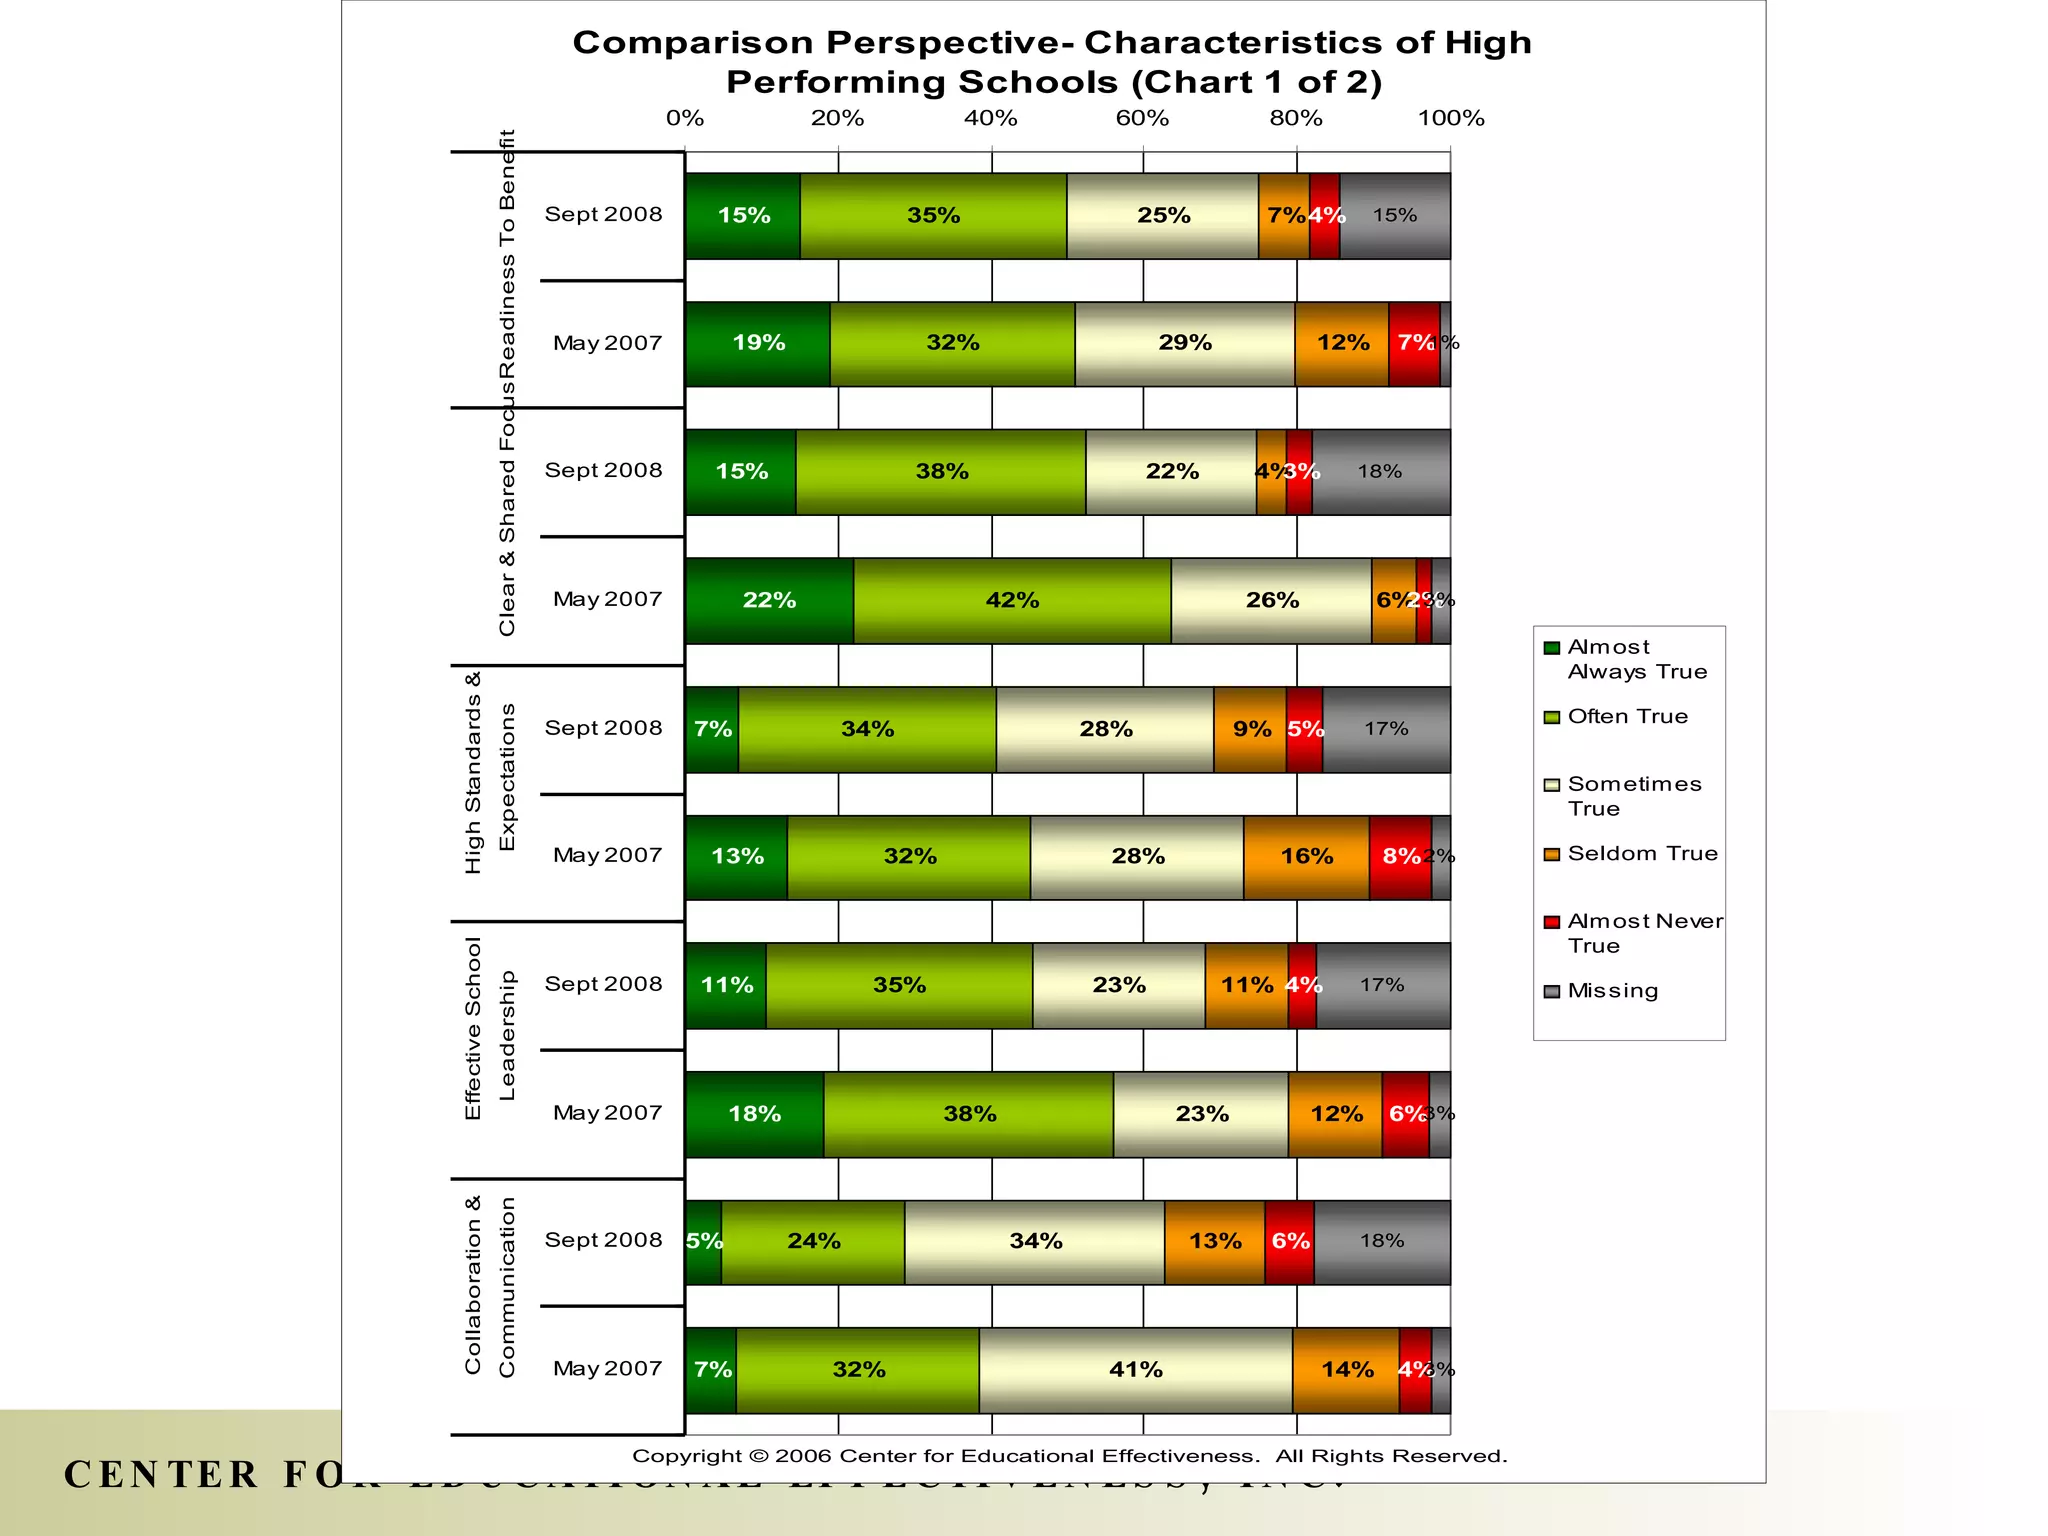
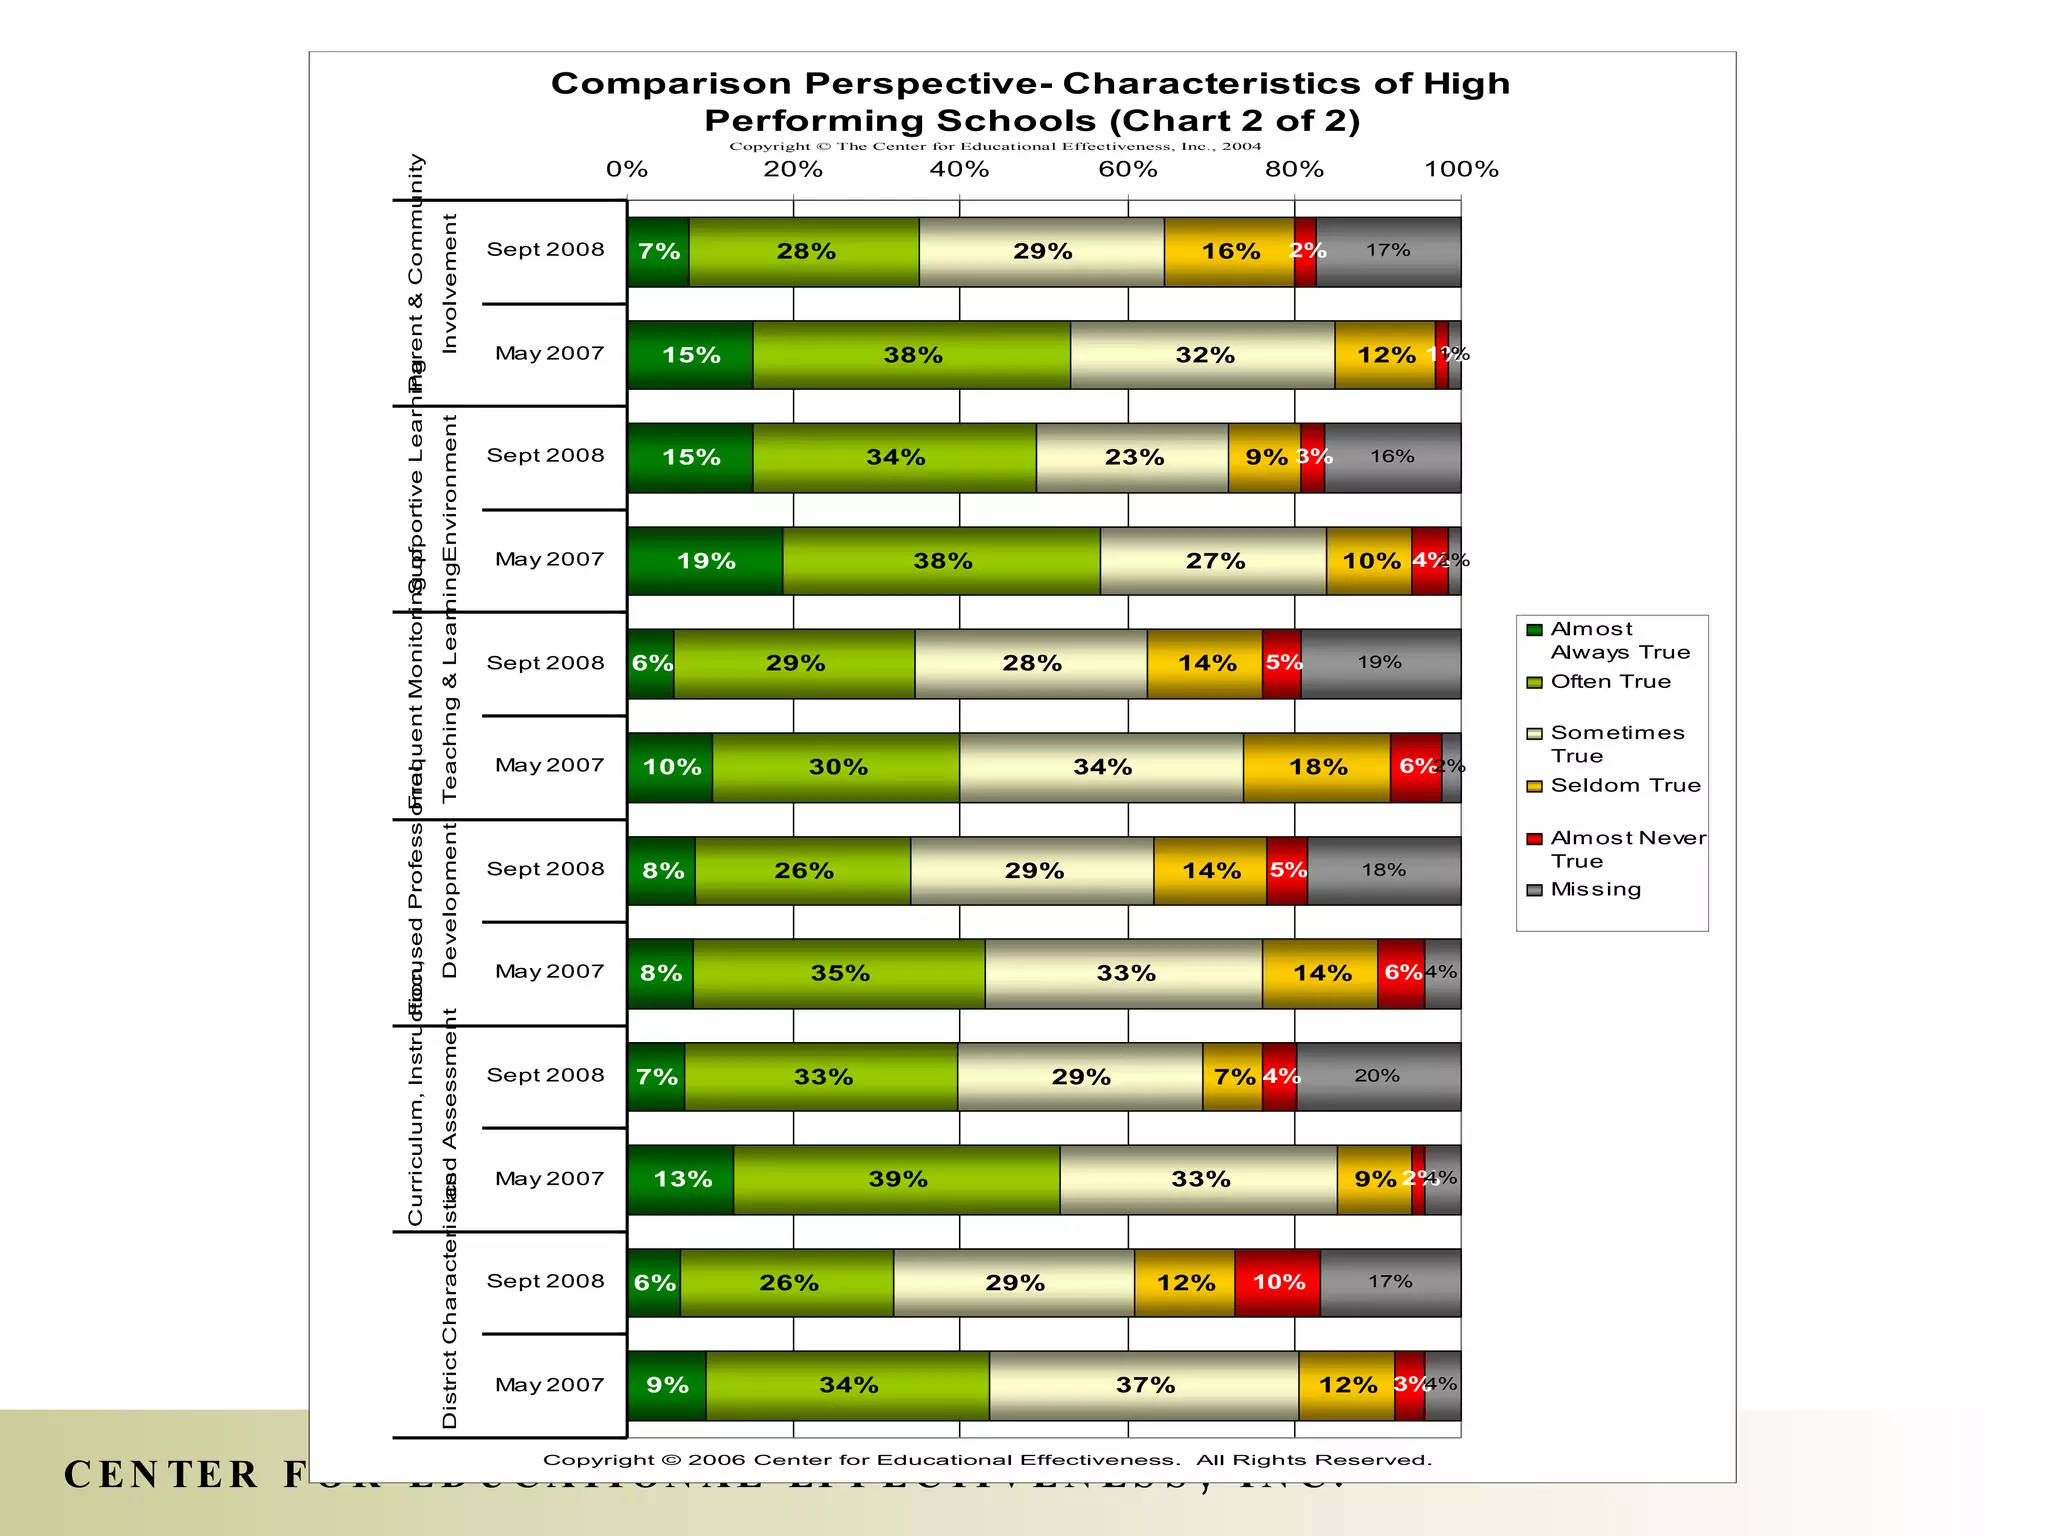
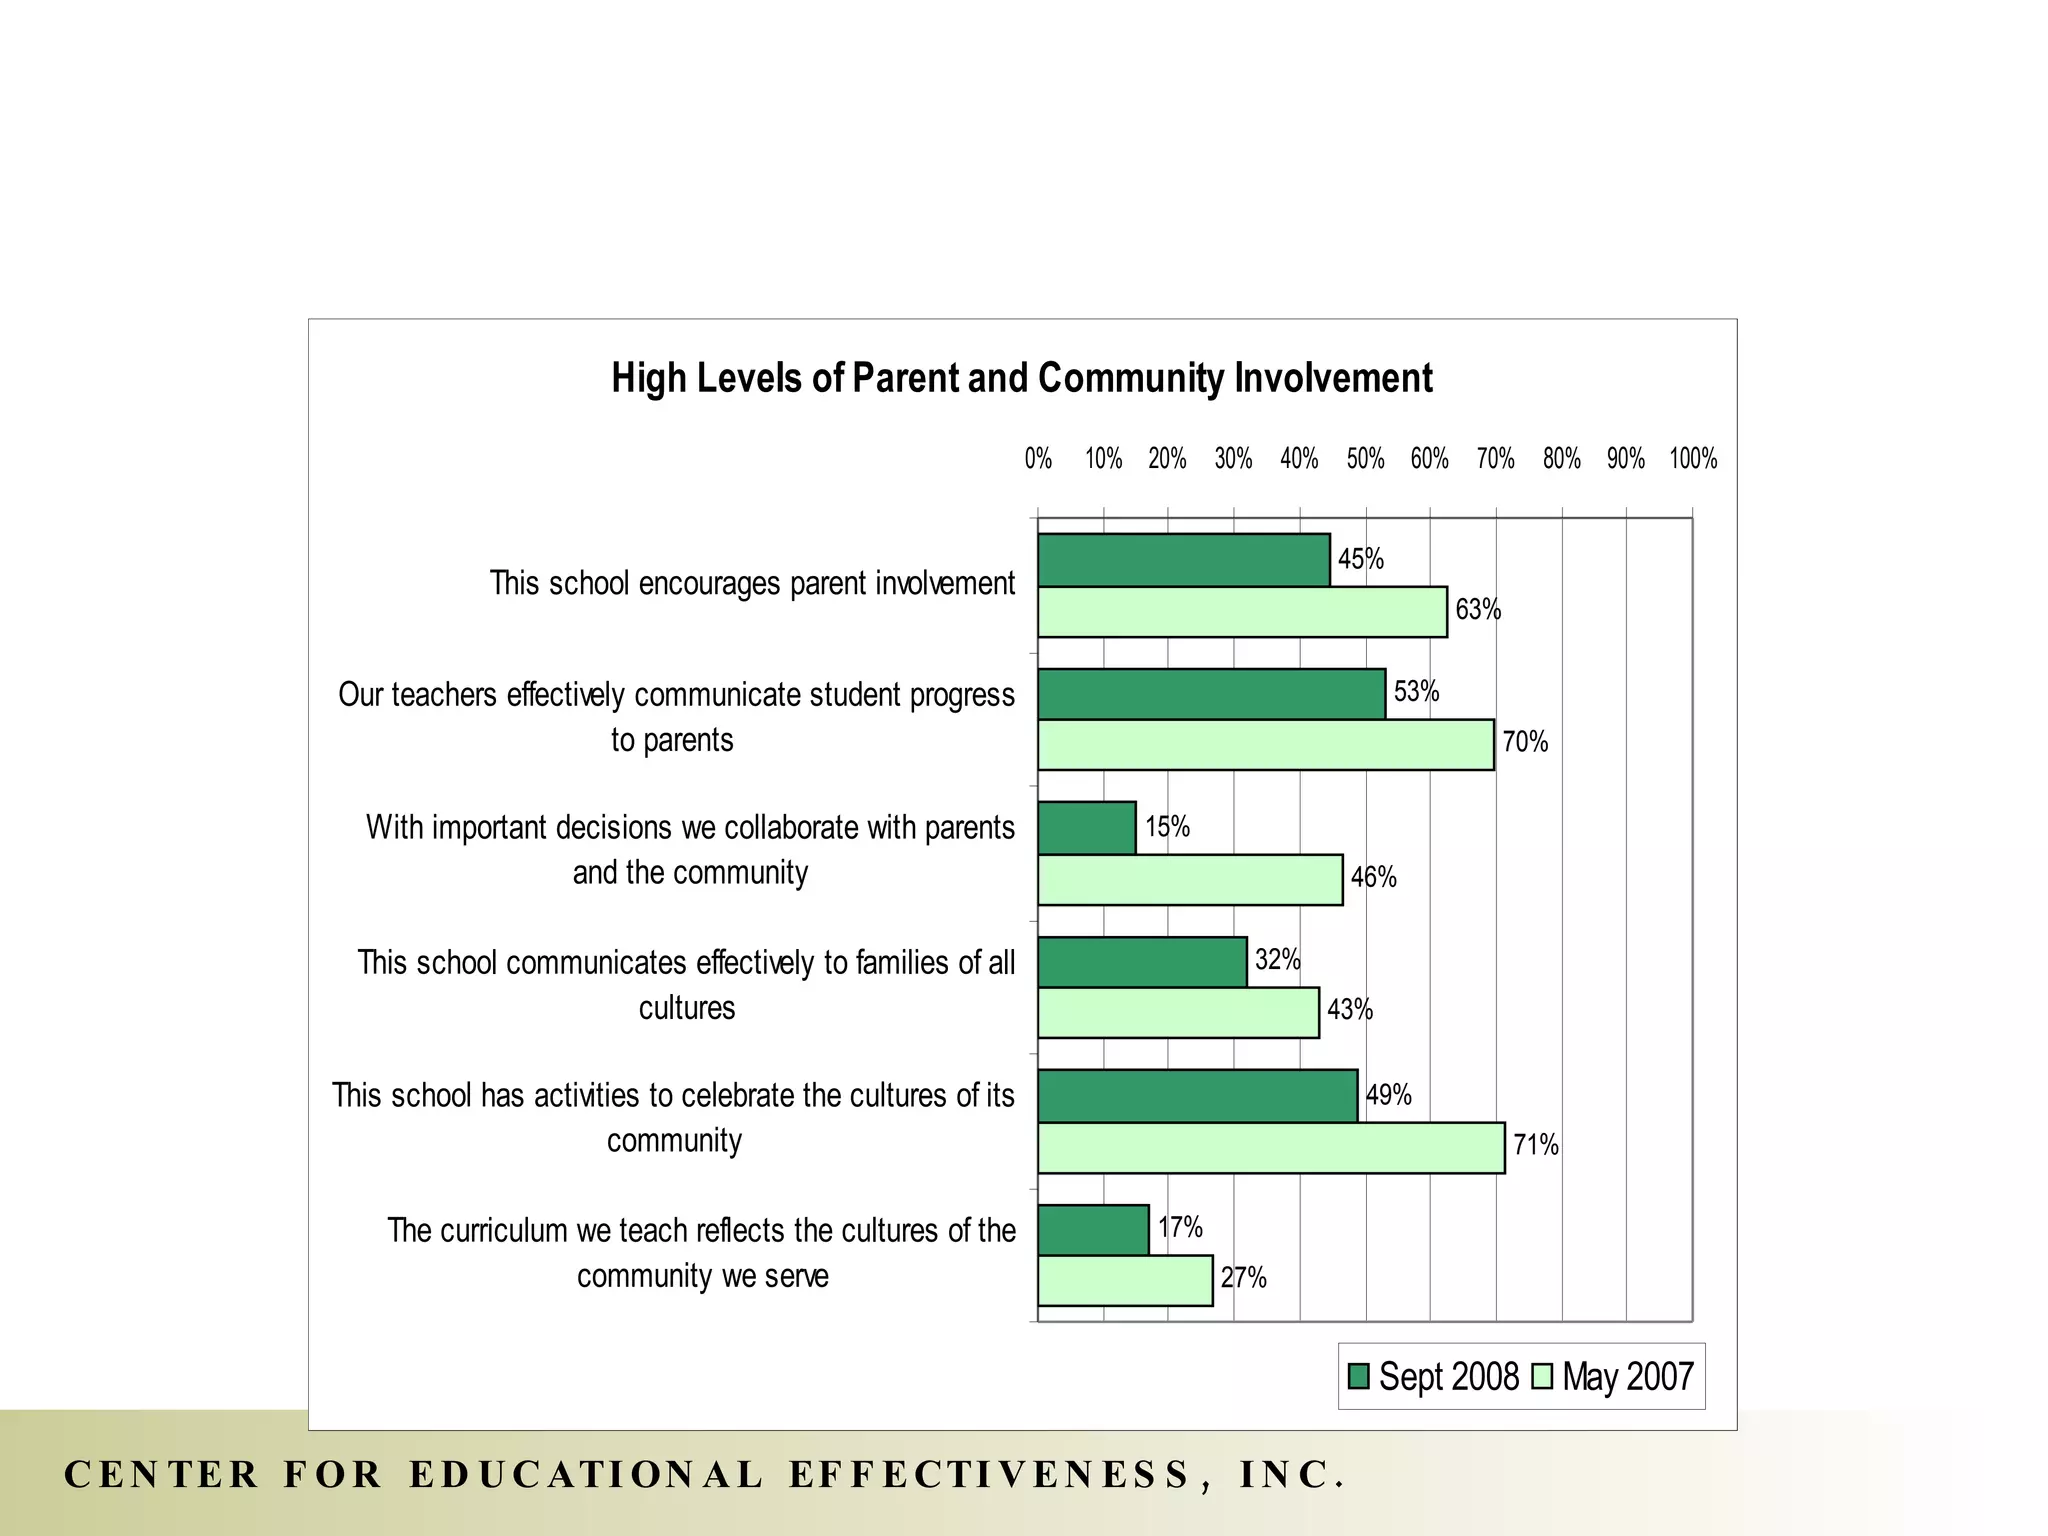
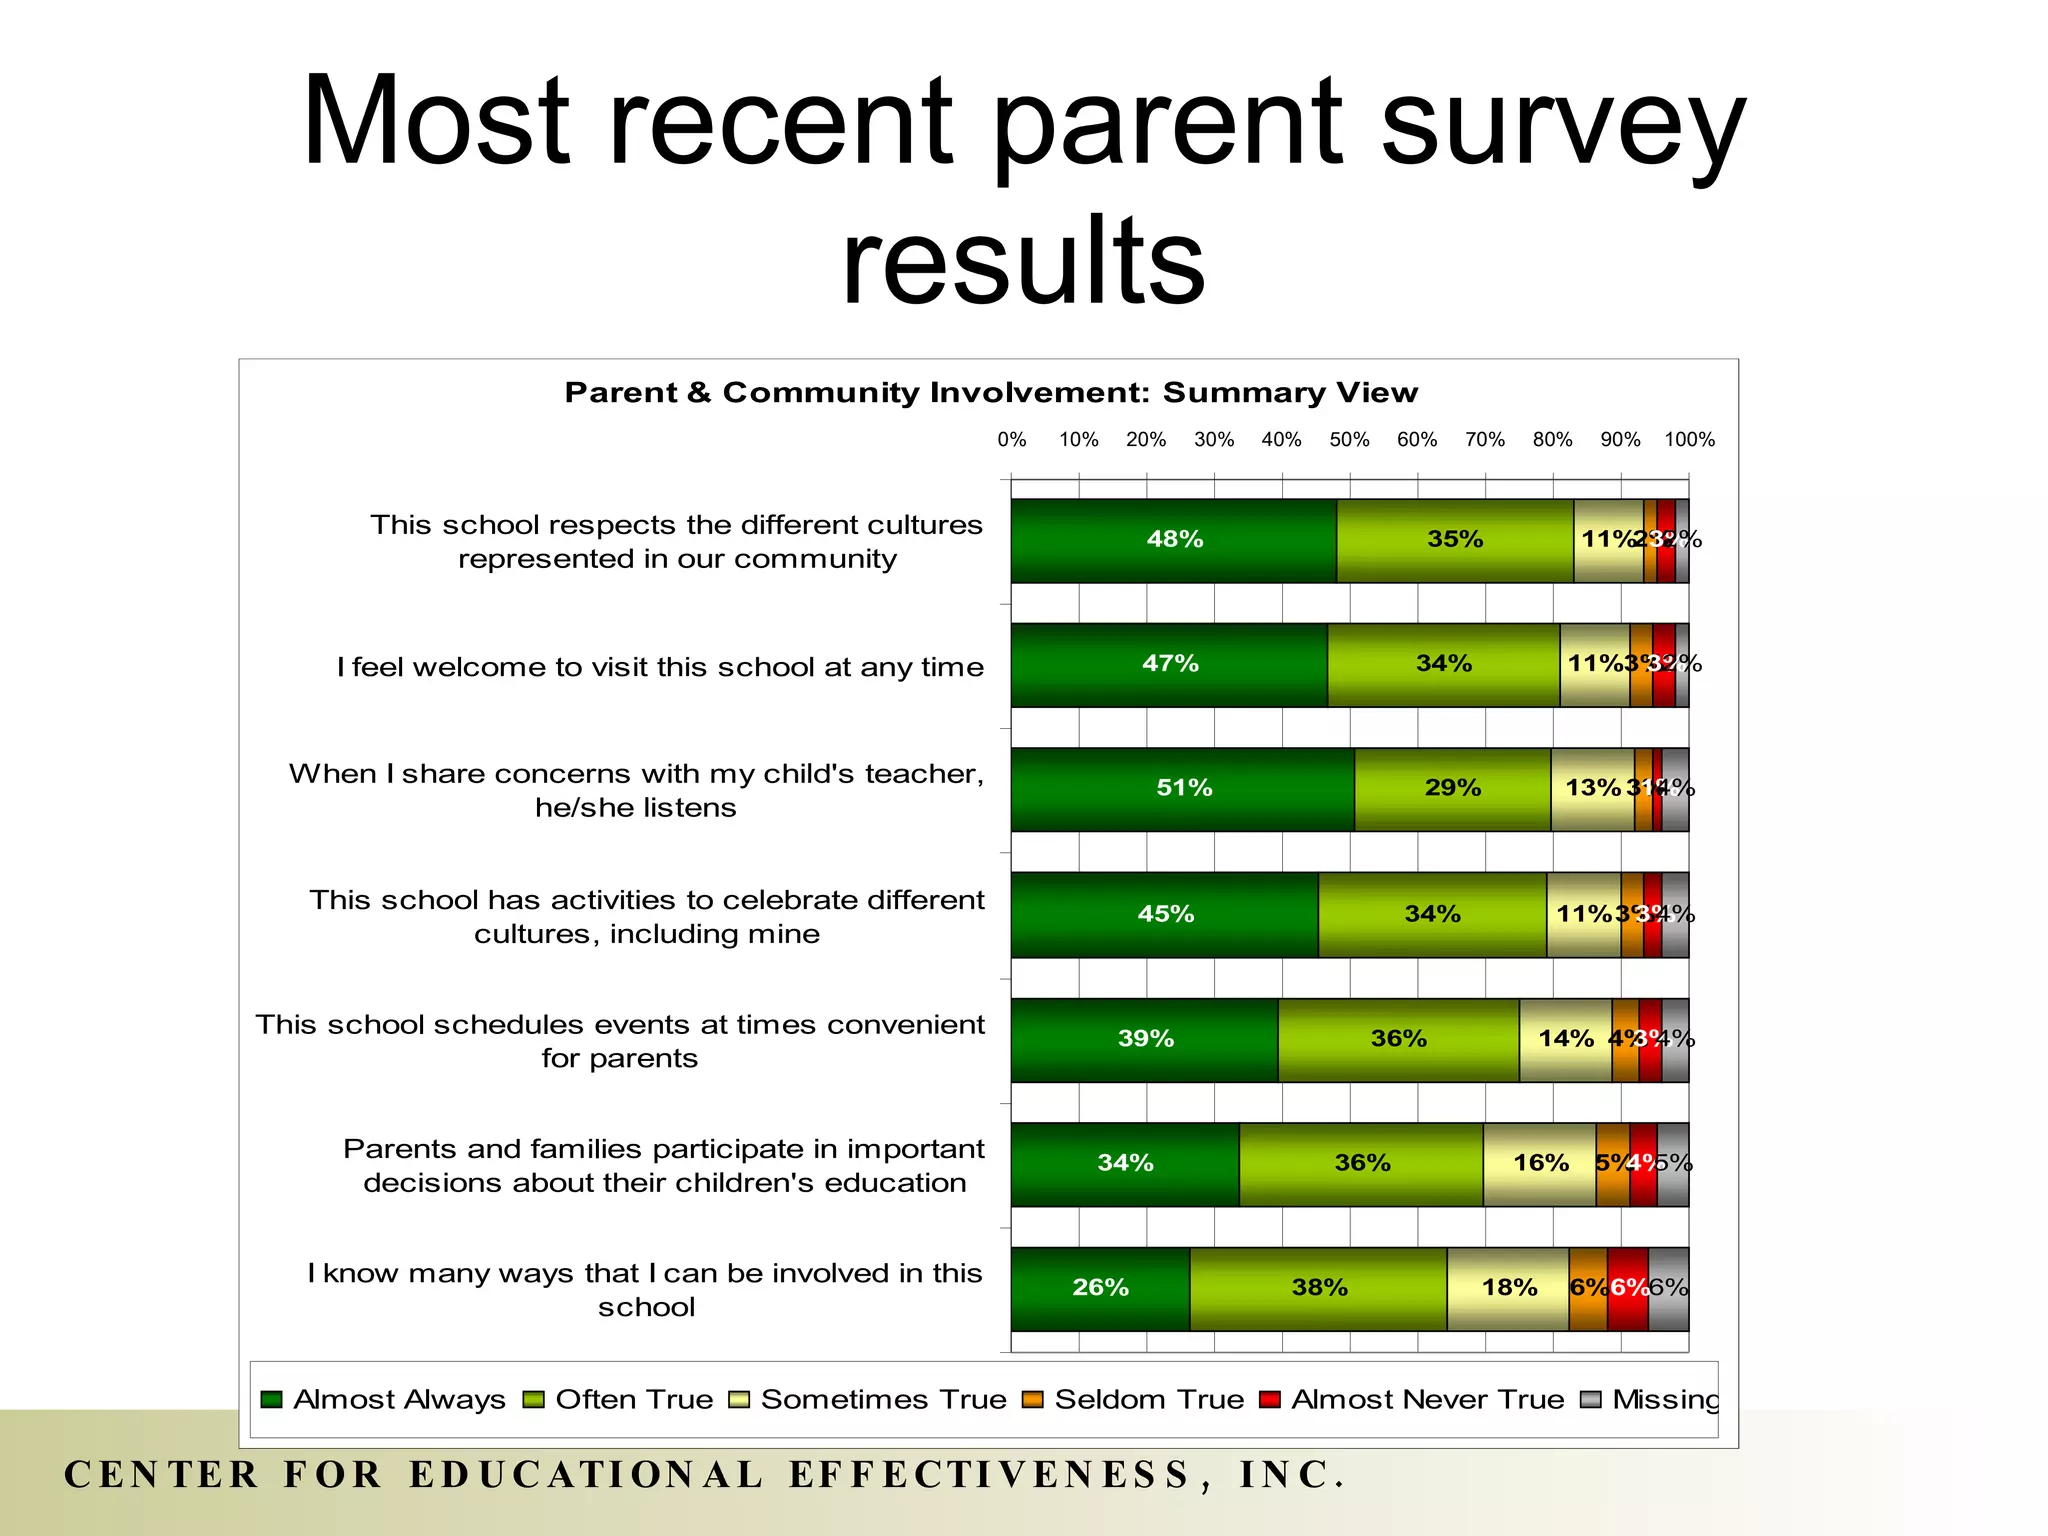
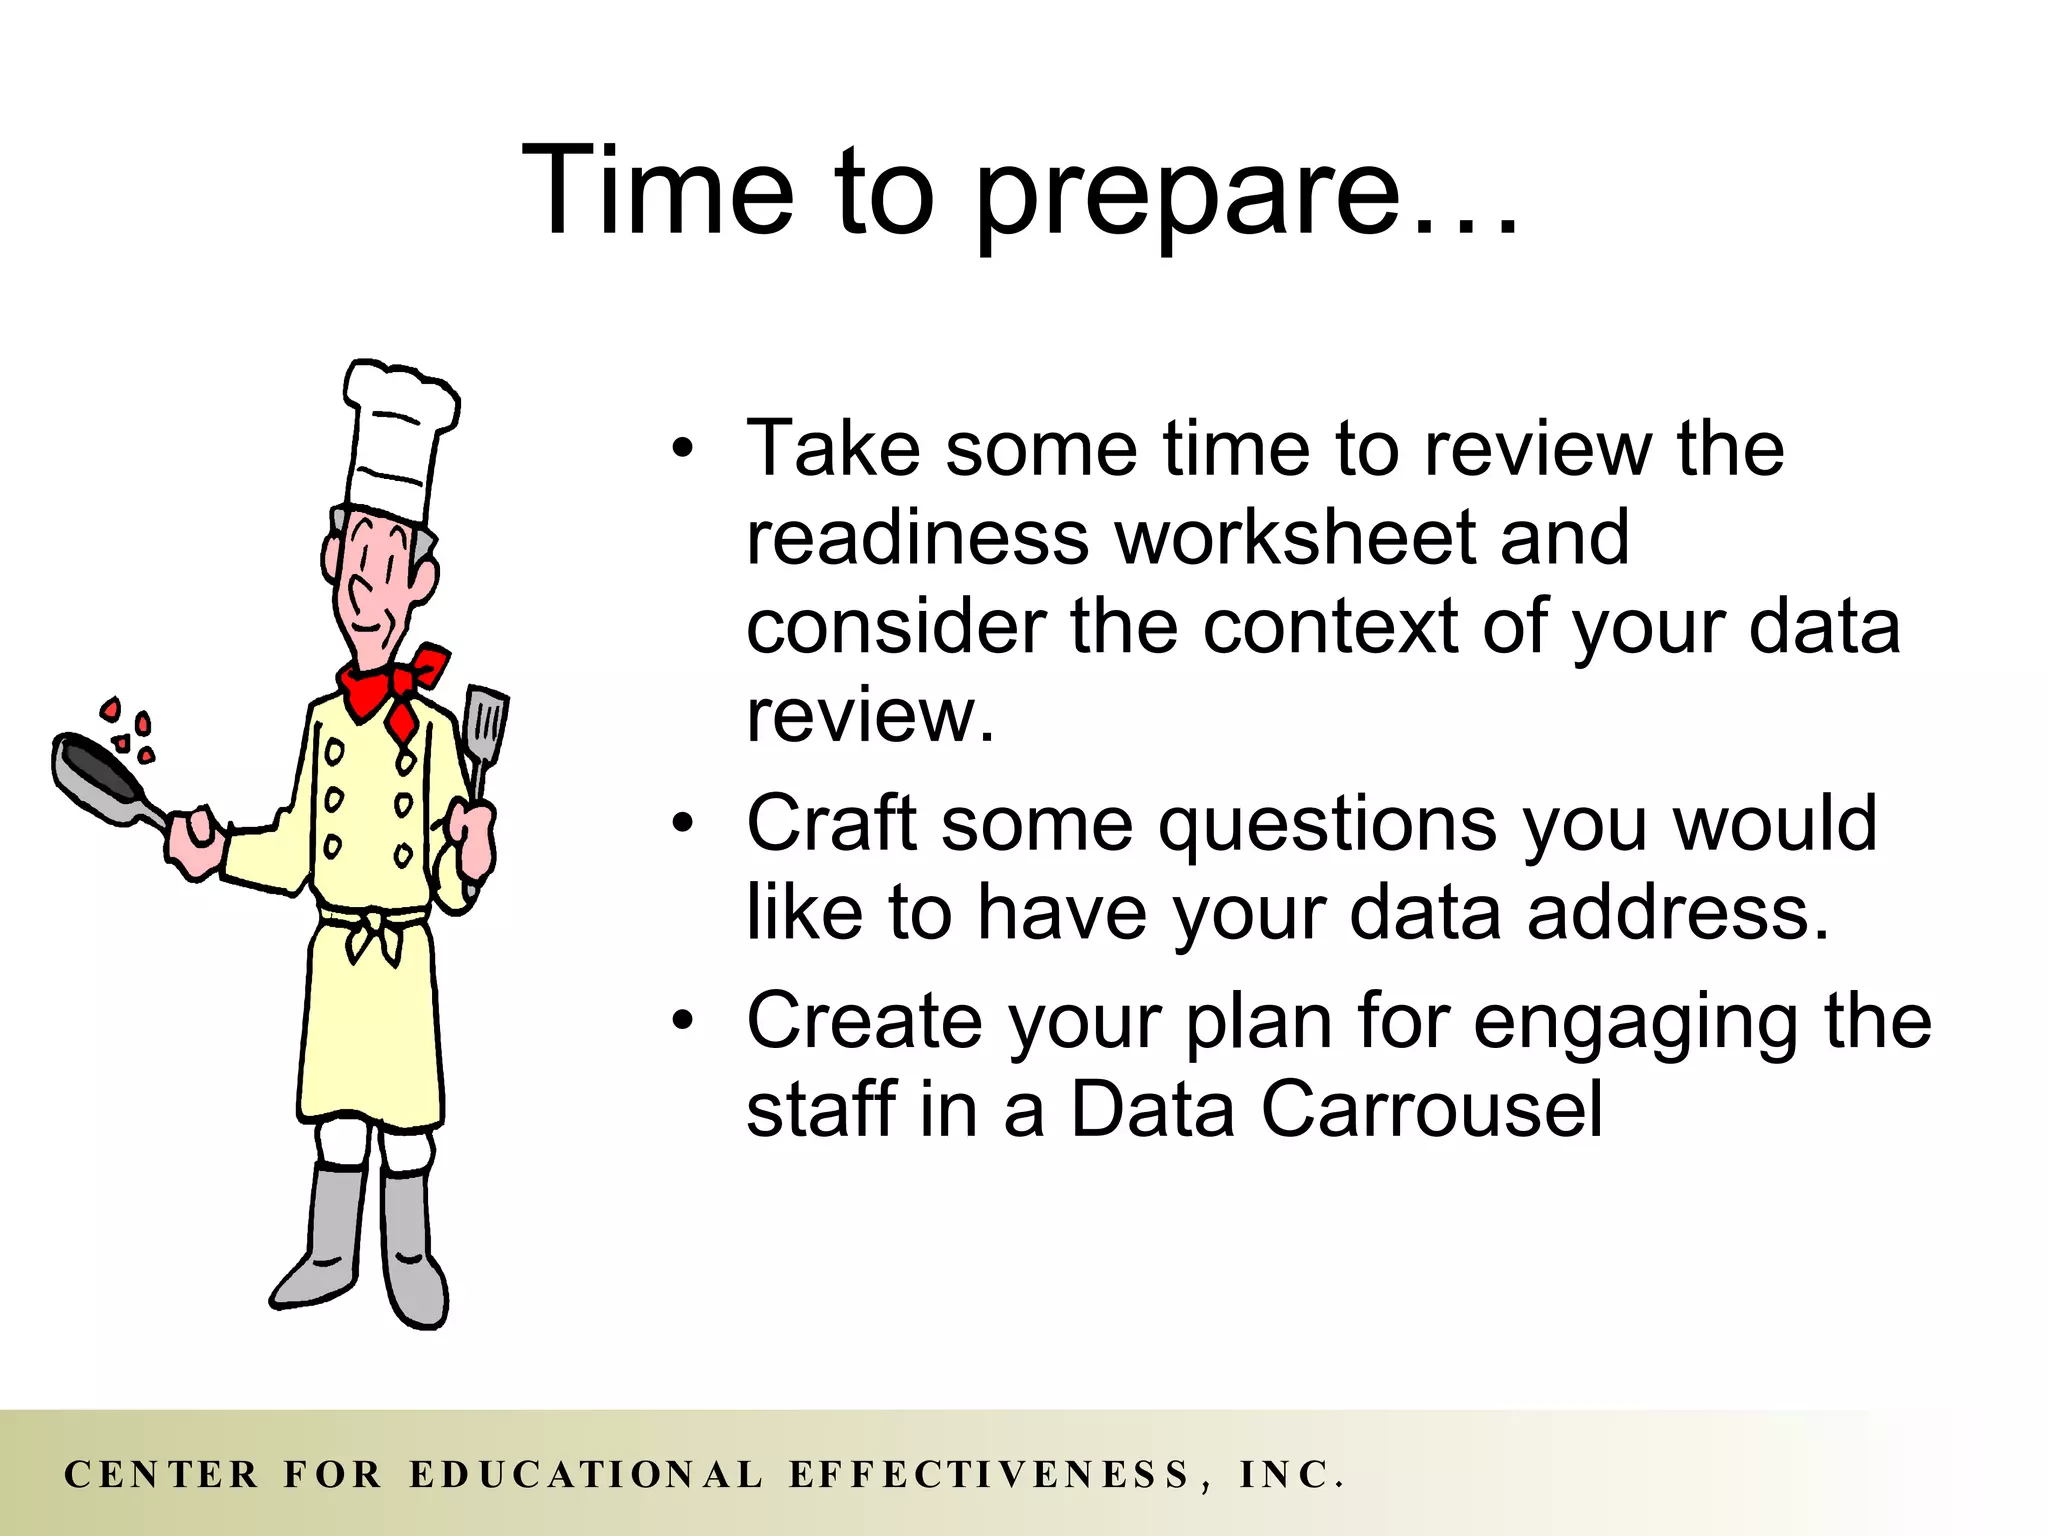
This document summarizes a meeting to plan a data carousel activity to analyze school performance data. It discusses selecting and preparing data, engaging staff to review the data, identifying concerns, prioritizing concerns, and next steps. Logistics of the carousel such as space, materials, roles and facilitation are also covered. The goal is for staff to gain a broad understanding of trends, strengths and areas for improvement to inform school planning.


![[Extended] Bottom-up growth of learning analytics at two Australian universit...](https://cdn.slidesharecdn.com/ss_thumbnails/bottom-upgrowthofla-160416081432-thumbnail.jpg?width=640&height=640&fit=bounds)


![Looking back and looking forward[1]](https://cdn.slidesharecdn.com/ss_thumbnails/lookingbackandlookingforward1-120318223505-phpapp02-thumbnail.jpg?width=640&height=640&fit=bounds)


![Wsu%20 superintendents%201.6.12[1]](https://cdn.slidesharecdn.com/ss_thumbnails/wsu20superintendents201-6-121-120107230534-phpapp02-thumbnail.jpg?width=640&height=640&fit=bounds)


