Download as PDF, PPTX


![13
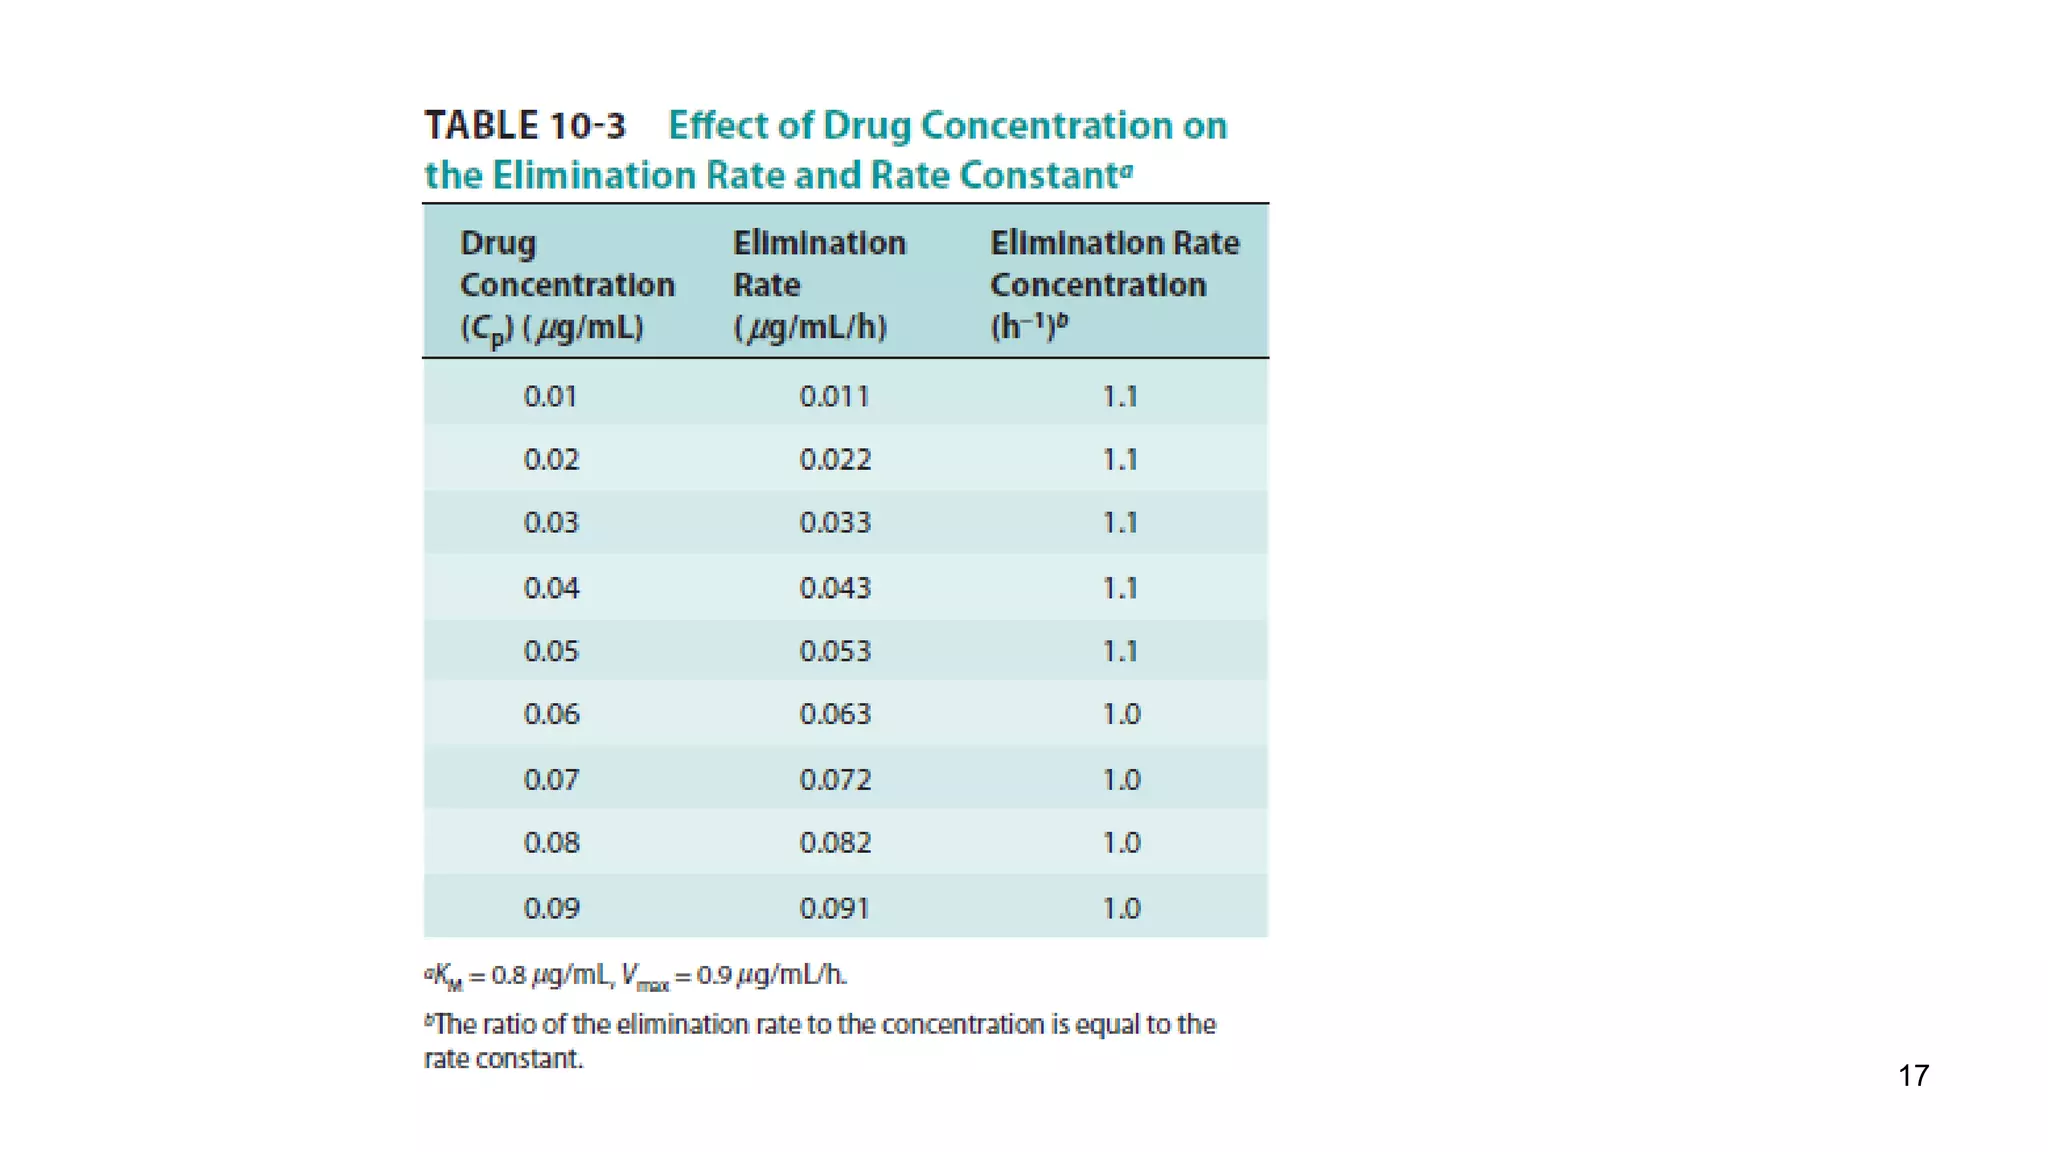
Enzymatic reactions are saturable.
Saturated hepatic metabolism decreases CLH.
Saturated first-pass metabolism increases F.
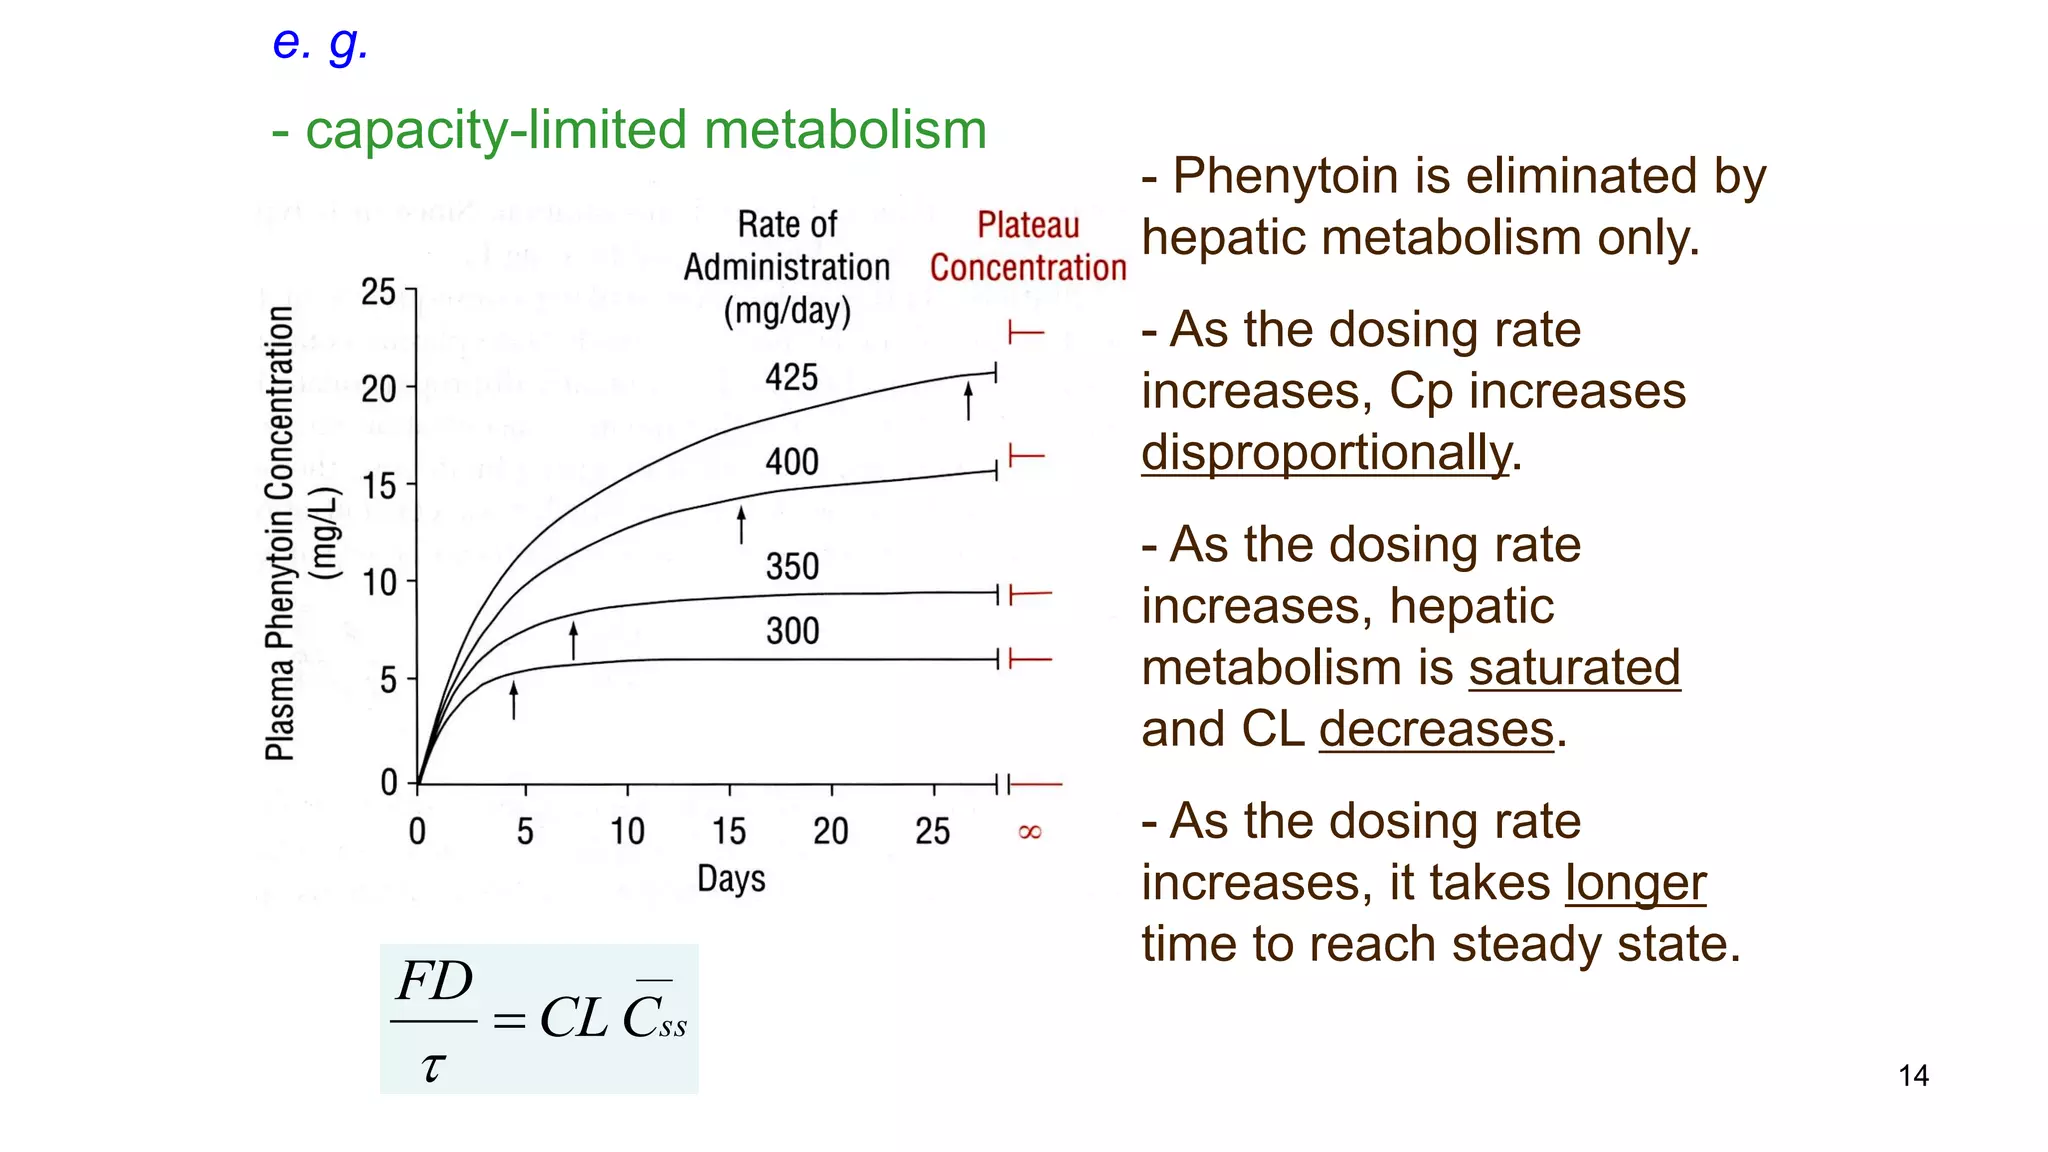
Capacity-Limited Metabolism (CLH ,F)
][
][max
SK
SV
v
m
](https://image.slidesharecdn.com/pknonlin2-180201171029/75/Non-linear-Pharmacokinetics-2-13-2048.jpg)


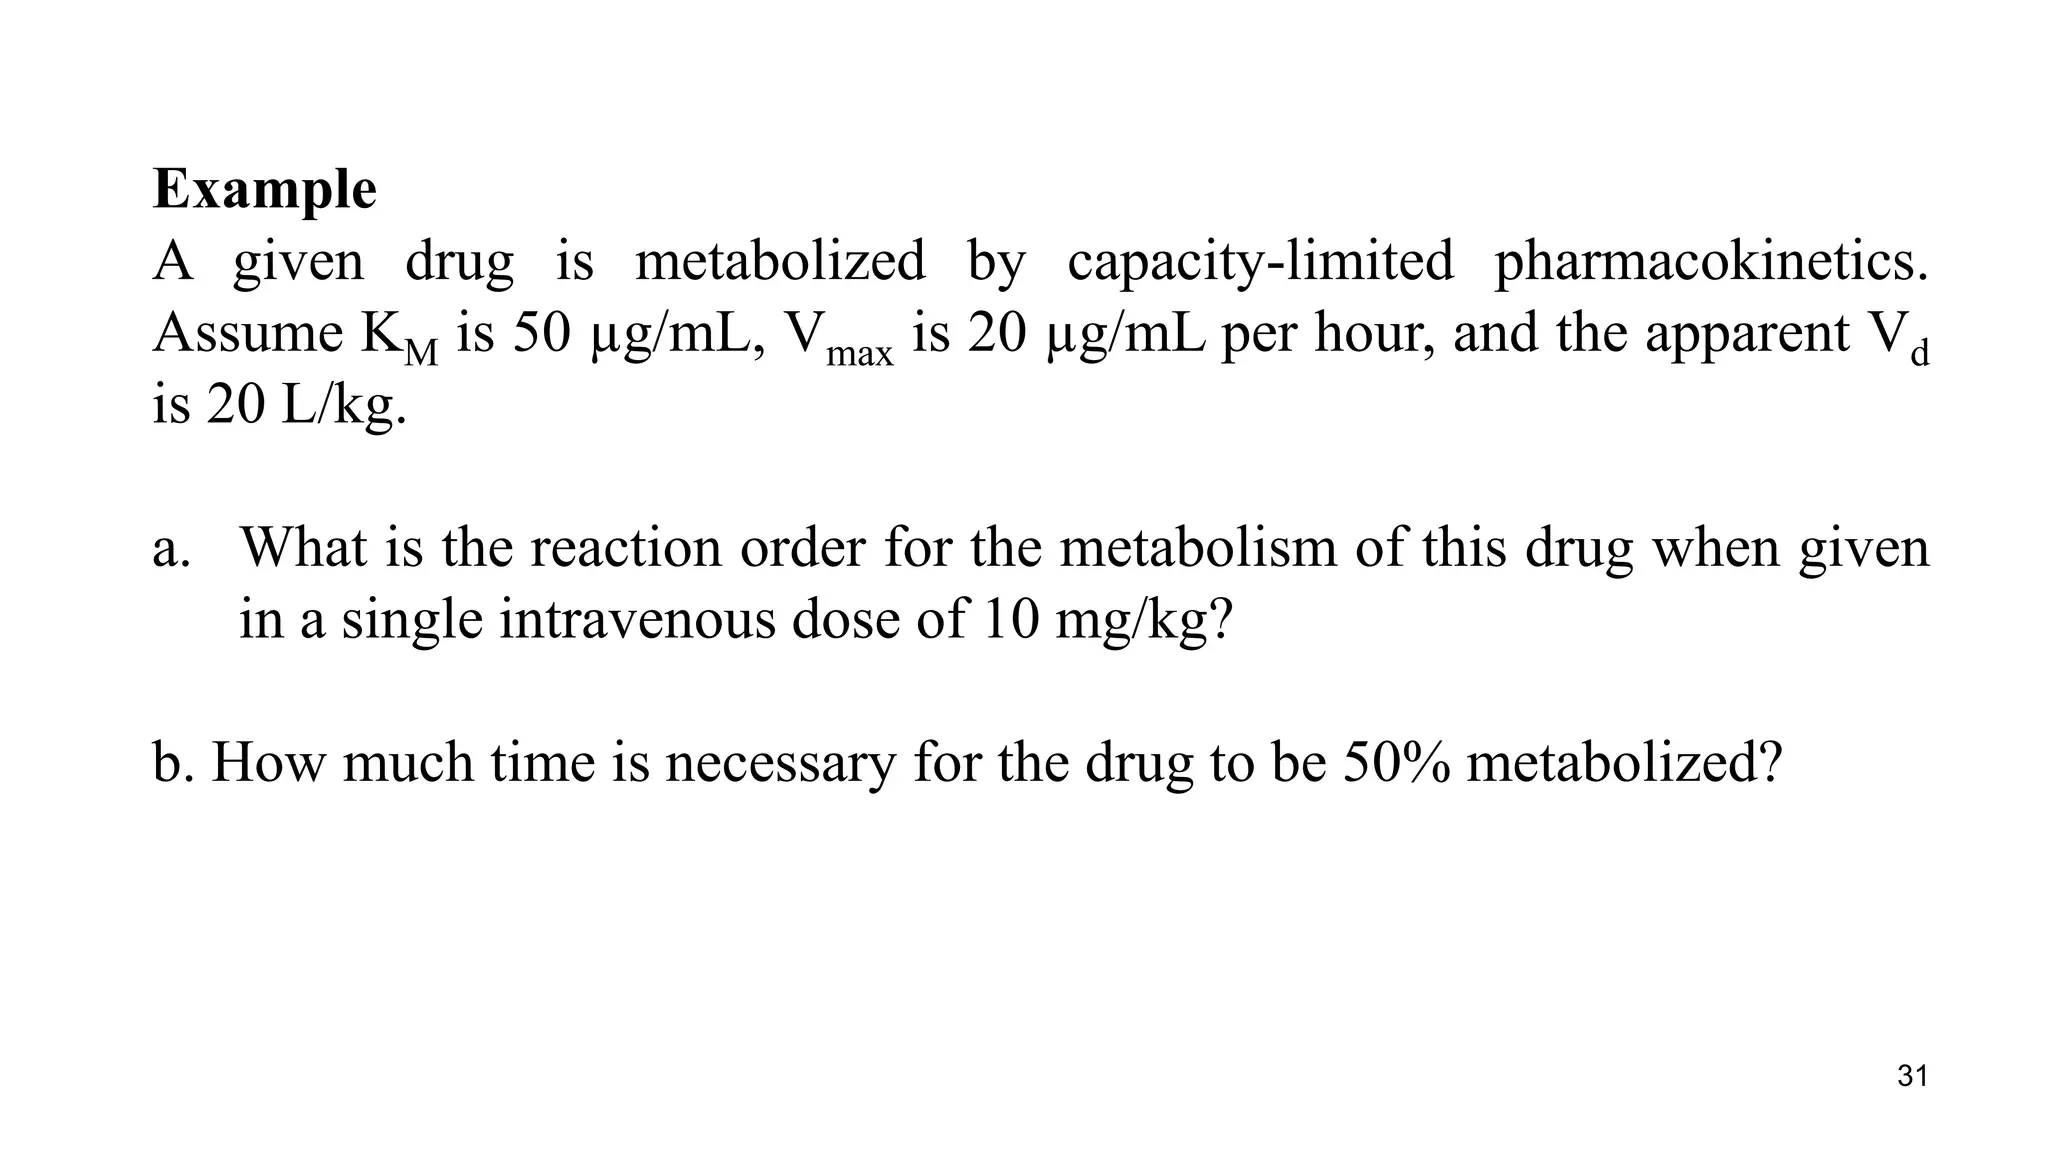

Here are the steps to solve this problem: a. At a dose of 10 mg/kg, the plasma concentration would be 10 mg/kg / 20 L/kg = 0.5 mg/L = 500 μg/mL. Since this concentration is greater than the KM value of 50 μg/mL, the reaction order for metabolism would be zero order. b. For zero order kinetics, the rate of elimination is equal to Vmax. So the time for 50% elimination is the dose (10 mg/kg) x 0.5 / Vmax. Vmax is given as 20 μg/mL/hr = 20 mg/kg/hr. Therefore, the time is 10 mg/kg x 0.5 / 20


