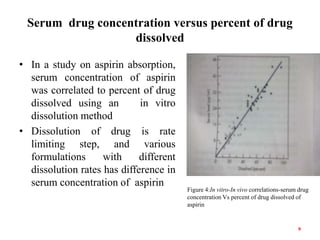
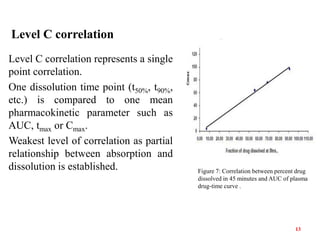
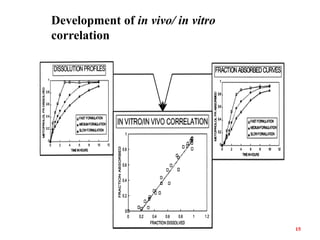
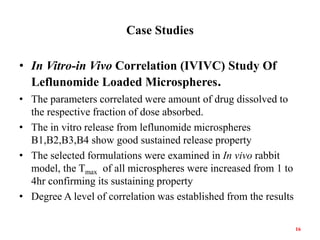
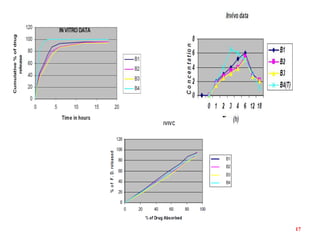
This document discusses in vitro-in vivo correlations (IVIVCs). It defines IVIVC as a predictive mathematical model relating an in vitro property (e.g. dissolution rate) to an in vivo response (e.g. absorption rate). The document outlines the significance of IVIVCs in reducing bioequivalence studies and supporting biowaivers. It describes different levels of IVIVC (A, B, C) and parameters that can be correlated (dissolution rate to absorption rate; percent dissolved to percent absorbed). The document provides examples of IVIVC case studies and concludes that current regulatory guidelines only apply to oral dosage forms, while further research is needed to develop IVIVCs for other drug products.
It is defined as “the predictive mathematical model that describes the relationship between in vitro property (such as rate & extent of dissolution) of a dosage form and in vivo response (such as plasma drug concentration or amount of drug absorbed)”.
United State Pharmacopoeia (USP)The establishment of a rational relationship between a biological property, or a parameter derived from a biological property produced by a dosage form, and a physicochemical property or characteristic of the same dosage form.
Food and Drug Administration (FDA) definitionIVIVC is a predictive mathematical model describing the relationship between an in vitro property of a dosage form and a relevant in vivo response. Generally, the in vitro property is the rate or extent of drug dissolution or release while the in vivo response is the plasma drug concentration or amount of drug absorbed.
An in-vitro in-vivo correlation (IVIVC) has been defined by the U.S. Food and Drug Administration (FDA) as "a predictive mathematical model describing the relationship between an in-vitro property of a dosage form and an in-vivo response".
1. Measurement of Bioavailability:
Direct and indirect methods may be used to assess drug bioavailability. The in-vivo bioavailability of a drug product is demonstrated by the rate and extent of drug absorption, as determined by comparison of measured parameters, e.g., concentration of the active drug ingredient in the blood, cumulative urinary excretion rates, or pharmacological effects.
For drug products that are not intended to be absorbed into the bloodstream, bioavailability may be assessed by measurements intended to reflect the rate and extent to which the active ingredient or active moiety becomes available at the site of action.
The design of the bioavailability study depends on the objectives of the study, the ability to analyze the drug (and metabolites) in biological fluids, the pharmacodynamics of the drug substance, the route of drug administration, and the nature of the drug product.
Pharmacokinetic and/or pharmacodynamic parameters as well as clinical observations and in-vitro studies may be used to determine drug bioavailability from a drug product.
1.1. Pharmacokinetic methods:
These are very widely used and based upon the assumption that the pharmacokinetic profile reflects the therapeutic effectiveness of a drug. Thus these are indirect methods. The two major pharmacokinetic methods are:
The major pharmacokinetic methods are:
Plasma / blood level time profile.
o Time for peak plasma (blood) concentration (t max)
o Peak plasma drug concentration (Cmax)
o Area under the plasma drug concentration–time curve (AUC)
Urinary excretion studies.
o Cumulative amount of drug excreted in the urine (Du)
o Rate of drug excretion in the urine (dDu/dt)
o Time for maximum urinary excretion (t)
C. Other biological fluids
1.2. Pharmacodynamic methods:
IT involves direct measurement of drug effect on a (patho) physiological process as a function of time. Disadvantages of it may be high variability, difficult to measure, limited choices, less reliable, more subjective, drug response influenced by several physiological & environmental factors.
They involve determination of bioavailability from:
Acute pharmacological response.
Therapeutic response.
1.3. In-vitro dissolution studies
Closed compartment apparatus
Open compartment apparatus
Dialysis systems.
1.4. Clinical observations
Well-controlled clinical trials
Methods of enhancing Dissolution and bioavailability of poorly soluble drugsRam Kanth
Greetings!
Good Day to all...
Topic: Methods of Enhancing Bioavailability
Several approaches discussed are
1. Micrnoization
2. Use of Surrfactants
3. Use of Salt forms
4. Alteration of pH of microenvironment
5. Use of metastable polymorphs
6. Solute-Solvent Complexation
7. Solvent Deposition
8. Selective Adsorption on Insoluble Carriers
9. Solid Solutions
10. Eutectic Mixtures
11. Solid Dispersions
12. Molecular Encapsulation with Cyclodextrins
Please do clarify for doubts if any....
Thank you all for watching this presentation.
United State Pharmacopoeia (USP)
The establishment of a rational relationship between a biological property, or a parameter derived from a biological property produced by a dosage form, and a physicochemical property or characteristic of the same dosage form.
Food and Drug Administration (FDA)
IVIVC is a predictive mathematical model describing the relationship between an in vitro property of a dosage form and a relevant in vivo response. Generally, the in vitro property is the rate or extent of drug dissolution or release while the in vivo response is the plasma drug concentration or amount of drug absorbed.
The main objective of developing and evaluating an IVIVC is to enable the
dissolution test to serve as a surrogate (alternate) for in vivo bioavailability studies in
human beings.
The applications of developing such an IVIVC are —
1. To ensure batch-to-batch consistency in the physiological performance of a drug
product by use of such in vitro values.
2. To serve as a tool in the development of a new dosage form with desired in vivo
performance.
3. To assist in validating or setting dissolution specifications (i.e. the dissolution
specifications are based on the performance of product in vivo).
There are two basic approaches by which a correlation between dissolution testing
and bioavailability can be developed:
1. By establishing a relationship, usually linear, between the in vitro dissolution and
the in vivo bioavailability parameters.
2. By using the data from previous bioavailability studies to modify the dissolution
methodology in order to arrive at meaningful in vitro-in vivo correlation.
Flu Vaccine Alert in Bangalore Karnatakaaddon Scans
As flu season approaches, health officials in Bangalore, Karnataka, are urging residents to get their flu vaccinations. The seasonal flu, while common, can lead to severe health complications, particularly for vulnerable populations such as young children, the elderly, and those with underlying health conditions.
Dr. Vidisha Kumari, a leading epidemiologist in Bangalore, emphasizes the importance of getting vaccinated. "The flu vaccine is our best defense against the influenza virus. It not only protects individuals but also helps prevent the spread of the virus in our communities," he says.
This year, the flu season is expected to coincide with a potential increase in other respiratory illnesses. The Karnataka Health Department has launched an awareness campaign highlighting the significance of flu vaccinations. They have set up multiple vaccination centers across Bangalore, making it convenient for residents to receive their shots.
To encourage widespread vaccination, the government is also collaborating with local schools, workplaces, and community centers to facilitate vaccination drives. Special attention is being given to ensuring that the vaccine is accessible to all, including marginalized communities who may have limited access to healthcare.
Residents are reminded that the flu vaccine is safe and effective. Common side effects are mild and may include soreness at the injection site, mild fever, or muscle aches. These side effects are generally short-lived and far less severe than the flu itself.
Healthcare providers are also stressing the importance of continuing COVID-19 precautions. Wearing masks, practicing good hand hygiene, and maintaining social distancing are still crucial, especially in crowded places.
Protect yourself and your loved ones by getting vaccinated. Together, we can help keep Bangalore healthy and safe this flu season. For more information on vaccination centers and schedules, residents can visit the Karnataka Health Department’s official website or follow their social media pages.
Stay informed, stay safe, and get your flu shot today!
MANAGEMENT OF ATRIOVENTRICULAR CONDUCTION BLOCK.pdfJim Jacob Roy
Cardiac conduction defects can occur due to various causes.
Atrioventricular conduction blocks ( AV blocks ) are classified into 3 types.
This document describes the acute management of AV block.
TEST BANK for Operations Management, 14th Edition by William J. Stevenson, Ve...kevinkariuki227
TEST BANK for Operations Management, 14th Edition by William J. Stevenson, Verified Chapters 1 - 19, Complete Newest Version.pdf
Lung Cancer: Artificial Intelligence, Synergetics, Complex System Analysis, S...Oleg Kshivets
RESULTS: Overall life span (LS) was 2252.1±1742.5 days and cumulative 5-year survival (5YS) reached 73.2%, 10 years – 64.8%, 20 years – 42.5%. 513 LCP lived more than 5 years (LS=3124.6±1525.6 days), 148 LCP – more than 10 years (LS=5054.4±1504.1 days).199 LCP died because of LC (LS=562.7±374.5 days). 5YS of LCP after bi/lobectomies was significantly superior in comparison with LCP after pneumonectomies (78.1% vs.63.7%, P=0.00001 by log-rank test). AT significantly improved 5YS (66.3% vs. 34.8%) (P=0.00000 by log-rank test) only for LCP with N1-2. Cox modeling displayed that 5YS of LCP significantly depended on: phase transition (PT) early-invasive LC in terms of synergetics, PT N0—N12, cell ratio factors (ratio between cancer cells- CC and blood cells subpopulations), G1-3, histology, glucose, AT, blood cell circuit, prothrombin index, heparin tolerance, recalcification time (P=0.000-0.038). Neural networks, genetic algorithm selection and bootstrap simulation revealed relationships between 5YS and PT early-invasive LC (rank=1), PT N0—N12 (rank=2), thrombocytes/CC (3), erythrocytes/CC (4), eosinophils/CC (5), healthy cells/CC (6), lymphocytes/CC (7), segmented neutrophils/CC (8), stick neutrophils/CC (9), monocytes/CC (10); leucocytes/CC (11). Correct prediction of 5YS was 100% by neural networks computing (area under ROC curve=1.0; error=0.0).
CONCLUSIONS: 5YS of LCP after radical procedures significantly depended on: 1) PT early-invasive cancer; 2) PT N0--N12; 3) cell ratio factors; 4) blood cell circuit; 5) biochemical factors; 6) hemostasis system; 7) AT; 8) LC characteristics; 9) LC cell dynamics; 10) surgery type: lobectomy/pneumonectomy; 11) anthropometric data. Optimal diagnosis and treatment strategies for LC are: 1) screening and early detection of LC; 2) availability of experienced thoracic surgeons because of complexity of radical procedures; 3) aggressive en block surgery and adequate lymph node dissection for completeness; 4) precise prediction; 5) adjuvant chemoimmunoradiotherapy for LCP with unfavorable prognosis.
The prostate is an exocrine gland of the male mammalian reproductive system
It is a walnut-sized gland that forms part of the male reproductive system and is located in front of the rectum and just below the urinary bladder
Function is to store and secrete a clear, slightly alkaline fluid that constitutes 10-30% of the volume of the seminal fluid that along with the spermatozoa, constitutes semen
A healthy human prostate measures (4cm-vertical, by 3cm-horizontal, 2cm ant-post ).
It surrounds the urethra just below the urinary bladder. It has anterior, median, posterior and two lateral lobes
It’s work is regulated by androgens which are responsible for male sex characteristics
Generalised disease of the prostate due to hormonal derangement which leads to non malignant enlargement of the gland (increase in the number of epithelial cells and stromal tissue)to cause compression of the urethra leading to symptoms (LUTS
Title: Sense of Smell
Presenter: Dr. Faiza, Assistant Professor of Physiology
Qualifications:
MBBS (Best Graduate, AIMC Lahore)
FCPS Physiology
ICMT, CHPE, DHPE (STMU)
MPH (GC University, Faisalabad)
MBA (Virtual University of Pakistan)
Learning Objectives:
Describe the primary categories of smells and the concept of odor blindness.
Explain the structure and location of the olfactory membrane and mucosa, including the types and roles of cells involved in olfaction.
Describe the pathway and mechanisms of olfactory signal transmission from the olfactory receptors to the brain.
Illustrate the biochemical cascade triggered by odorant binding to olfactory receptors, including the role of G-proteins and second messengers in generating an action potential.
Identify different types of olfactory disorders such as anosmia, hyposmia, hyperosmia, and dysosmia, including their potential causes.
Key Topics:
Olfactory Genes:
3% of the human genome accounts for olfactory genes.
400 genes for odorant receptors.
Olfactory Membrane:
Located in the superior part of the nasal cavity.
Medially: Folds downward along the superior septum.
Laterally: Folds over the superior turbinate and upper surface of the middle turbinate.
Total surface area: 5-10 square centimeters.
Olfactory Mucosa:
Olfactory Cells: Bipolar nerve cells derived from the CNS (100 million), with 4-25 olfactory cilia per cell.
Sustentacular Cells: Produce mucus and maintain ionic and molecular environment.
Basal Cells: Replace worn-out olfactory cells with an average lifespan of 1-2 months.
Bowman’s Gland: Secretes mucus.
Stimulation of Olfactory Cells:
Odorant dissolves in mucus and attaches to receptors on olfactory cilia.
Involves a cascade effect through G-proteins and second messengers, leading to depolarization and action potential generation in the olfactory nerve.
Quality of a Good Odorant:
Small (3-20 Carbon atoms), volatile, water-soluble, and lipid-soluble.
Facilitated by odorant-binding proteins in mucus.
Membrane Potential and Action Potential:
Resting membrane potential: -55mV.
Action potential frequency in the olfactory nerve increases with odorant strength.
Adaptation Towards the Sense of Smell:
Rapid adaptation within the first second, with further slow adaptation.
Psychological adaptation greater than receptor adaptation, involving feedback inhibition from the central nervous system.
Primary Sensations of Smell:
Camphoraceous, Musky, Floral, Pepperminty, Ethereal, Pungent, Putrid.
Odor Detection Threshold:
Examples: Hydrogen sulfide (0.0005 ppm), Methyl-mercaptan (0.002 ppm).
Some toxic substances are odorless at lethal concentrations.
Characteristics of Smell:
Odor blindness for single substances due to lack of appropriate receptor protein.
Behavioral and emotional influences of smell.
Transmission of Olfactory Signals:
From olfactory cells to glomeruli in the olfactory bulb, involving lateral inhibition.
Primitive, less old, and new olfactory systems with different path
Couples presenting to the infertility clinic- Do they really have infertility...Sujoy Dasgupta
Dr Sujoy Dasgupta presented the study on "Couples presenting to the infertility clinic- Do they really have infertility? – The unexplored stories of non-consummation" in the 13th Congress of the Asia Pacific Initiative on Reproduction (ASPIRE 2024) at Manila on 24 May, 2024.
Ethanol (CH3CH2OH), or beverage alcohol, is a two-carbon alcohol
that is rapidly distributed in the body and brain. Ethanol alters many
neurochemical systems and has rewarding and addictive properties. It
is the oldest recreational drug and likely contributes to more morbidity,
mortality, and public health costs than all illicit drugs combined. The
5th edition of the Diagnostic and Statistical Manual of Mental Disorders
(DSM-5) integrates alcohol abuse and alcohol dependence into a single
disorder called alcohol use disorder (AUD), with mild, moderate,
and severe subclassifications (American Psychiatric Association, 2013).
In the DSM-5, all types of substance abuse and dependence have been
combined into a single substance use disorder (SUD) on a continuum
from mild to severe. A diagnosis of AUD requires that at least two of
the 11 DSM-5 behaviors be present within a 12-month period (mild
AUD: 2–3 criteria; moderate AUD: 4–5 criteria; severe AUD: 6–11 criteria).
The four main behavioral effects of AUD are impaired control over
drinking, negative social consequences, risky use, and altered physiological
effects (tolerance, withdrawal). This chapter presents an overview
of the prevalence and harmful consequences of AUD in the U.S.,
the systemic nature of the disease, neurocircuitry and stages of AUD,
comorbidities, fetal alcohol spectrum disorders, genetic risk factors, and
pharmacotherapies for AUD.
- Video recording of this lecture in English language: https://youtu.be/lK81BzxMqdo
- Video recording of this lecture in Arabic language: https://youtu.be/Ve4P0COk9OI
- Link to download the book free: https://nephrotube.blogspot.com/p/nephrotube-nephrology-books.html
- Link to NephroTube website: www.NephroTube.com
- Link to NephroTube social media accounts: https://nephrotube.blogspot.com/p/join-nephrotube-on-social-media.html
Ozempic: Preoperative Management of Patients on GLP-1 Receptor Agonists Saeid Safari
Preoperative Management of Patients on GLP-1 Receptor Agonists like Ozempic and Semiglutide
ASA GUIDELINE
NYSORA Guideline
2 Case Reports of Gastric Ultrasound
ARTIFICIAL INTELLIGENCE IN HEALTHCARE.pdfAnujkumaranit
Artificial intelligence (AI) refers to the simulation of human intelligence processes by machines, especially computer systems. It encompasses tasks such as learning, reasoning, problem-solving, perception, and language understanding. AI technologies are revolutionizing various fields, from healthcare to finance, by enabling machines to perform tasks that typically require human intelligence.
Factory Supply Best Quality Pmk Oil CAS 28578–16–7 PMK Powder in Stockrebeccabio
Factory Supply Best Quality Pmk Oil CAS 28578–16–7 PMK Powder in Stock
Telegram: bmksupplier
signal: +85264872720
threema: TUD4A6YC
You can contact me on Telegram or Threema
Communicate promptly and reply
Free of customs clearance, Double Clearance 100% pass delivery to USA, Canada, Spain, Germany, Netherland, Poland, Italy, Sweden, UK, Czech Republic, Australia, Mexico, Russia, Ukraine, Kazakhstan.Door to door service
Hot Selling Organic intermediates
1. IN VITRO IN VIVO
CORRELATIONS
BY
T.Dilip Kumar
M.S.(pharm.) Pharmaceutics
2. CONTENTS
• Definitions
• Significance of ivivc
• Parameters for correlation
• Levels of correlation
• Development of correlation
• Case study
• Conclusions
• References
2
3. Definitions
• In vitro dissolution: It’s a process of release of drug from
dosage form as measured in an in vitro dissolution apparatus
• In vivo dissolution: process of dissolution of drug in the GI
tract.
• Correlation: relationship between in vitro dissolution rate and
in vivo absorption rate as used in bio-equivalence guidance
• IVIVC has been defined as “a predictive mathematical model
describing the relationship between an in-vitro property of a
dosage form and an in-vivo response”
3
4. Significance of ivivc
• The main objective of developing and evaluating an IVIVC is
to enable the dissolution test to serve as a surrogate. It reduces
the number of bio-equivalence required for approval as well as
during scale up and post approval changes (SUPAC).
• IVIVC shortens the drug development period, economizes the
resources and leads to improved product quality.
• A means of assuring the bioavailability of active ingredients
from a dosage form.
• Supports and or validates the use of dissolution methods and
specifications
• IVIVC assists in supporting biowaivers.
4
5. Parameters for correlations
SL. No. IN VITRO INVIVO
1. Dissolution rate Absorption rate (or
absorption time)
2. Percent drug dissolved Percent of drug absorbed
3. Percent drug dissolved Maximum plasma
concentration, Cmax
4. Percent drug dissolved Serum drug
concentration, Cp
5
6. Figure 1: In vitro-in vivo correlations-
Dissolution time Vs absorption time of
three sustained release products
If dissolution of drug is rate
limiting step, the faster the
dissolution rate, the faster is
the rate of appearance of drug
in the plasma. Therefore,
absorption time and
dissolution time may be
considered for correlation
Dissolution rate versus absorption rate
6
7. Percent of drug dissolved versus percent of drug
absorbed:
. Appropriate dissolution medium and a
slow stirring rate during dissolution
should be considered to mimic in vivo
dissolution.
. If the drug is absorbed completely after
dissolution, a linear correlation may be
obtained by comparing the percent drug
absorbed to the percent drug dissolved.
Figure 2: In vitro-in vivo correlations-
Percent of drug dissolved Vs percent of
drug absorbed of three sustained release
aspirin products
7
8. Percent of drug dissolved versus maximum plasma
concentration:
A poorly formulated drug may not
be completely dissolved and
released, resulting in lower plasma
drug concentration.
The percentage of drug released at
any time interval will be greater
for more bioavailable drug
product, the peak serum
concentration will be higher for the
drug that shows highest percent of
drug dissolved.
Figure 3: percent drug dissolved in 30 minutes Vs
Cmax of drug for nine products of phenytoin (100
mg).
8
9. Serum drug concentration versus percent of drug
dissolved
• In a study on aspirin absorption,
serum concentration of aspirin
was correlated to percent of drug
dissolved using an in vitro
dissolution method
• Dissolution of drug is rate
limiting step, and various
formulations with different
dissolution rates has difference in
serum concentration of aspirin
9
Figure 4:In vitro-In vivo correlations-serum drug
concentration Vs percent of drug dissolved of
aspirin
10. Levels of correlation
• Level A Correlation
• Level B Correlation
• Level C Correlation
• Multiple Level C Correlation
10
11. Level A correlation
It is estimated by two step method,
deconvolution followed by comparison
of fraction of drug absorbed to the
fraction of drug dissolved.
Defines a direct relationship between in
vivo data such that measurement of in
vitro dissolution rate alone is sufficient
to determine the biopharmaceutical rate
of the dosage form.
An in vitro dissolution curve can serve
as a surrogate for in vivo performance
Figure 5: Correlation between percent
theophylline dissolved in vitro and
percent theophylline absorbed after
administration of extended release
product
11
12. Level B correlation:
Level B correlation utilizes the
principles of statistical moment
analysis.
Mean in vitro dissolution time
(MDTvitro) of the product is compared
to mean in vivo residence time
(MRT).
MRT may be calculated as the ratio of
the area under the first moment curve
(AUMC) to the AUC, where AUMC
is the area under the curve observed
for the product of time and
concentration versus time.
Figure 6: Correlation of mean in vitro
dissolution time (MDT) and mean in vivo
absorption time (MAT)
12
13. Level C correlation
Level C correlation represents a single
point correlation.
One dissolution time point (t50%, t90%,
etc.) is compared to one mean
pharmacokinetic parameter such as
AUC, tmax or Cmax.
Weakest level of correlation as partial
relationship between absorption and
dissolution is established. Figure 7: Correlation between percent drug
dissolved in 45 minutes and AUC of plasma
drug-time curve .
13
14. Multiple level C correlations
• Multiple Level C correlation relates one or several
pharmacokinetic parameters of interest (Cmax, AUC, or any
other suitable parameters) to the amount of drug dissolved at
several time points of the dissolution profile.
• Its correlation is more meaningful than that of Level C as
several time points are considered.
14
16. Case Studies
• In Vitro-in Vivo Correlation (IVIVC) Study Of
Leflunomide Loaded Microspheres.
• The parameters correlated were amount of drug dissolved to
the respective fraction of dose absorbed.
• The in vitro release from leflunomide microspheres
B1,B2,B3,B4 show good sustained release property
• The selected formulations were examined in In vivo rabbit
model, the Tmax of all microspheres were increased from 1 to
4hr confirming its sustaining property
• Degree A level of correlation was established from the results
16
18. CONCLUSIONS
• The current IVIVC studies have focused more on the
development and validation of level A IVIVC which gives
more useful information on the relationship between in vitro
release and in vivo absorption from dosage form.
• Levels B and C IVIVCs have been evaluated for several
purposes in formulation development, for example, to select
the appropriate excipients and optimize the manufacturing
processes.
• Present regulatory guidelines for IVIVC is only applicable to
oral conventional and modified release dosage forms;
however, further research is necessary to develop IVIVCs for
non-oral products, inhaled medicines and dermatological
medicaments also.
18
19. References
• Leon Shargel, Susanna wu-pong, Andrew Yu. Applied
biopharmaceutics and pharmacokinetics. 6th edition, pg no- 380-
383.
• Sundaramoorthi Nainar, Kingston Rajiah, Santhosam Angamuthu,
D Prabakaran and Ravisekhar Kasibhatta. Biopharmaceutical
Classification System in In-vitro/In-vivo Correlation: Concept
and Development Strategies in Drug Delivery. Tropical Journal of
Pharmaceutical Research April 2012; 11 (2): 319-329
• Rabindranath pal, Manas Chakraborty, Rabindra Debnath and
Bijan K Gupta. In vitro-In vivo Correlation (IVIVC) study of
Leflunomide loaded microspheres. International Journal of
Pharmacy and Pharmaceutical Sciences, Vol. 1, Suppl 1, Nov.-
Dec. 2009
19
20. References
• Hitesh Jain , Kruti Joshi1, Shweta Gediya, Vishal Sutariya,
Hirak Shah, T. Y. Pasha. IN VITRO IN VIVO CORRELATION
(IVIVC): A REVIEW. Imperial Journal of Pharmaceutics &
Cosmetology.
20