Nestle reported strong 3QCY2010 results, beating estimates. Revenue grew 25.7% to Rs. 1,637 crore, driven by domestic volume growth. Earnings grew 19.6% despite margin contraction from rising input costs. While top-line growth was robust, cost pressures impacted margins. The analyst maintains a Neutral rating and revised fair value of Rs. 3,501 per share, awaiting better entry opportunities given rich valuations.
Colgate reported a modest 13% revenue growth for the quarter, which was 2% below estimates, driven by a 12% volume growth in toothpaste. Earnings growth of 11.8% missed estimates by 3% due to a spike in staff costs and higher tax rate. Operating margins expanded by 82 basis points to 20.3% due to higher gross margins and lower advertising spend. The report maintains a Reduce rating on Colgate, with a target price of Rs 820 based on 22x FY2012 EPS, citing expensive valuations and risks to earnings growth from higher taxes and competition.
Marico reported mixed financial results for the second quarter of fiscal year 2011. While overall volume growth was strong at 15%, price cuts taken in core brands constrained top-line growth to 12.5% year-over-year. Earnings grew 14.8% driven by lower taxes and other income, but operating profit rose only 4.5% as gross margins contracted sharply due to rising input costs. The company's international business and hair oils portfolio posted robust growth, but margins are expected to recover only gradually as further price hikes are implemented.
Motherson Sumi Systems reported a 19.4% year-over-year increase in net sales to Rs. 1,958 crore for the second quarter of fiscal year 2011, marginally above the analyst's expectation of 1.938 crore. Operating profit margin increased 411 basis points year-over-year to 10.6%, 79 basis points above expectations, driven by favorable foreign exchange movements. Net profit for the quarter came in at Rs. 86 crore, above the analyst's estimate of Rs. 67.6 crore due to better than expected operating margin performance. The analyst maintains an 'Accumulate' rating on the stock with a target price of Rs. 195, valuing the company at a 16
The document is a research report recommending a BUY rating for shares of Bel, a French dairy company, with a target price of €399, implying 33% upside potential. The report cites Bel's efficient business model, strong positioning for growth in healthy and on-the-go consuming trends, and ability to pursue acquisitions as reasons to believe the stock is undervalued compared to peers and offers attractive growth and dividend prospects despite some risks relating to currency exchange rates and commodity prices.
ACC reported a 77% year-on-year decline in net profit for the third quarter of 2010 due to a substantial fall in realizations coupled with higher operating expenses. Net sales declined 17% yoy while operating profit fell 69% yoy. The company expects demand and realizations to improve going forward following recent price hikes. While maintaining a neutral view, analysts forecast a 2% annual sales growth but declining profits as capacity additions offset falling margins.
【SEPTENI HOLDINGS CO.,LTD.】Business Results for the 3rd Quarter of Fiscal Yea...SEPTENI HOLDINGS CO.,LTD.
All estimates, opinions and plans provided in this document are based on the best information available at the time of the creation of this document on July 30, 2015 and we do not guarantee their accuracy. Therefore our actual results may differ due to various unforeseen risk factors and changes in global economies.
The document provides information about using a pitchbook template for creating presentation slides. It describes characteristics of pitchbook slides like small text sizes, dense layouts, and simple graphics. It also provides instructions for customizing the template, including replacing the generic logo and varying slide colors to distinguish sections. Sample slides are shown for an annual report, market risk analysis, market summary, business summary, and market share by division.
DS Smith, an international supplier of recycled packaging, announced strong financial results for 2010/11. Revenue increased 19.5% to £2.47 billion and adjusted operating profit grew 38.7% to £136.1 million. The company grew packaging volumes by 8% and improved margins despite a 26% rise in input costs. DS Smith exceeded its return on capital target of 12-15% and expects further progress in 2011/12.
Dover Corporation reported strong financial results for the second quarter of 2006, with revenue increasing 24% to $1.7 billion and earnings per share rising 44% to $0.77. All six of Dover's business segments saw increases in both revenue and earnings. Dover exceeded 4 out of 5 targeted metrics for the quarter, including earnings growth, operating margin, and return on investment. Management attributed the strong results to record earnings, organic revenue growth of 17%, and continued strength in most of the end markets served by Dover's businesses.
This strategic plan document provides an overview of Whole Foods Markets' performance from 2005-2009. It summarizes key financial metrics like sales, store count, and comparable store sales growth. It also analyzes the organic grocery industry including competitive positioning, market trends of slowing growth, and shifts in strategy from traditional grocers. An internal analysis examines Whole Foods' product lifecycle, value chain, promotional strategy, and a SWOT analysis identifying strengths in quality and brand reputation but also weaknesses in high prices and inventory costs.
- The company completed the acquisition of Eminence earlier than planned in July 2018. Eminence is expected to contribute $0.40-0.45 to profit per share in 2019.
- Q2 2018 sales were down 0.5% and gross margin was down 30 basis points compared to Q2 2017, however net income increased 2%.
- Several business segments saw sales increases and improved earnings compared to Q2 2017, while others faced challenges from currency fluctuations and other costs.
- For the first half of 2018, sales increased 3% while net income excluding one-time items increased 3% compared to the same period in 2017.
Ceat reported a 17.1% year-over-year increase in net sales for the second quarter of fiscal year 2011, reaching Rs. 843 crore. However, operating margins declined sharply to 5.2% from 14.8% due to a 54.6% rise in raw material costs from increased rubber prices. Net profit fell 75.2% year-over-year to Rs. 15.3 crore as margins contracted. Despite the decline in margins, the analyst maintains a "Buy" recommendation on Ceat due to attractive valuations and expectations that capacity additions will help support future revenue growth as demand increases.
Bank of India reported a 90.8% year-over-year increase in net profit for the second quarter of fiscal year 2011, though profit declined 14.9% sequentially. Net interest income grew 26.1% year-over-year driven by a 20.8% increase in advances and 21.3% growth in deposits. However, net interest margins declined sequentially due to higher cost of funds. Asset quality deteriorated with higher-than-expected loan slippages during the quarter. While profit is expected to increase in the coming quarters, the stock is trading at a valuation that reflects this expected improvement in fundamentals.
Ceat Q1FY15: Higher opex impact margins; Book profitsIndiaNotes.com
CEAT reported results which were below expectations. Sales were broadly in line with expectations but EBITDA margin declined by 160 bps QoQ. Book profits at current levels as there is no substantial upside from current levels.
Jagran Prakashan Q2FY15: Buy for a target of Rs165IndiaNotes.com
JAGP’s 2QFY15 EBITDA grew 16% YoY to INR1.06b (vs est of INR1.04b), supported by high single-digit growth in print advertising/circulation revenue and lower ‘other expenses’.
Dans sa dernière étude « PwC Golden Age Index : how well are OECD economies adapting to an older workforce ? », le cabinet d’audit et de conseil PwC compare l’emploi des seniors (travailleurs âgés de plus de 55 ans) dans 34 pays de l’OCDE.
FAG Bearings reported strong performance in 3QCY2010 with net sales growing 31.5% YoY to Rs. 272.4 crore, in line with estimates. EBITDA margin expanded 381bps YoY to 17.7% due to lower raw material costs. Net profit increased 90.1% YoY to Rs. 31.4 crore on robust sales growth and improved operating performance. The brokerage maintains its estimates and recommends buying the stock with a target price of Rs. 1,035, valuing it at 12x CY2012 EPS.
Dabur reported a modest 15% year-over-year growth in revenue to Rs. 972.8 crores driven by steady volume growth across segments. Earnings grew 15.4% to Rs. 160.4 crores, in line with estimates. Operating margins expanded slightly by 17 basis points despite a contraction in gross margins, helped by lower advertising spend. Segment-wise, consumer care grew 15.1% while consumer health and the international business grew at higher rates. The company maintained its guidance for steady volume growth and margins in the coming years.
JSW Steel reported a 26.5% year-over-year increase in consolidated net revenue to Rs. 5,908 crore for the second quarter of fiscal year 2011, driven by higher sales volume and improved product mix. However, earnings before interest, taxes, depreciation and amortization (EBITDA) margin declined by 617 basis points to 17.3% due to higher raw material costs. While interest expenses declined, other income from foreign exchange gains supported a 15.6% rise in net profit to Rs. 373 crore for the quarter. The company expects benefits from upcoming raw material assets and power plants to help lower costs going forward.
This document analyzes Procter & Gamble through a financial statement analysis. It examines liquidity, turnover, leverage, coverage, and profitability ratios from 2010-2014. Key findings include:
- Liquidity ratios are below industry averages, indicating P&G cannot pay short-term obligations.
- Turnover ratios decreased as assets increased, showing P&G may be over-invested in assets.
- Leverage and coverage ratios are stable but lower than competitors, suggesting underutilization of debt.
- Profitability ratios outperform averages but declines over time as expenses grow faster than sales.
- Malee Group Public Company Limited held an Opportunity Day on February 28, 2017 to present its Q4/2016 performance and business outlook.
- In Q4/2016, sales declined 2% YoY due to slower domestic consumption, while net profit grew 11% YoY through efficiency enhancements and cost reductions. For full-year 2016, sales increased 21% YoY to a record high on growth in both brands and contract manufacturing, while net profit increased 60% YoY.
- Looking forward, the company aims to further develop its brand portfolio and expand exports and contract manufacturing. It also established a new subsidiary, Malee Applied Sciences, to focus on innovation and new product development.
1) Tata Consultancy Services (TCS) reported strong results for the first quarter of fiscal year 2012, outperforming expectations with revenue growth of 6.3% over the previous quarter and 31.4% over the same quarter of the previous fiscal year.
2) A key highlight was 7.4% quarter-over-quarter growth in business volumes. While profit margins declined due to wage hikes, net profit remained flat due to foreign exchange gains.
3) Management maintained a positive outlook, highlighting strong demand environment and deal pipeline, and expects pricing increases later in the fiscal year.
Piaggio Group reported financial results for the first nine months of 2011. Net sales increased 2% overall and 4.5% excluding foreign exchange impacts. Growth was driven by strong performance in emerging markets like Asia Pacific (+31%) and India (+6.5%). Emerging markets now represent 46% of total sales, up 3 percentage points. EBITDA and net income were stable compared to the prior year despite one-time restructuring costs and negative foreign exchange effects. The net financial position improved by €20 million compared to the end of 2010 due to tight working capital controls and cash flow generation, despite higher capital expenditures to support growth in emerging countries.
Reliance Industries (RIL) reported a 1.5% increase in adjusted net profit for the second quarter of fiscal year 2011 compared to the previous quarter. Top-line and EBITDA were largely in line with estimates due to a 22.7% rise in revenues driven by growth in refining and oil & gas segments, although operating profit was 4.9% lower than expected because of lower production at oilfields and gas fields. Refining margins of $7.9/barrel were maintained through higher throughput despite lower outputs. While most segments grew revenues compared to previous periods, the company's profit was constrained by increased depreciation costs and lower than expected production volumes.
This document provides an analysis of The Hershey Company, including a business description, financial analysis, valuation, and conclusion. Key points include: Hershey has shown strong sales growth over the past 3 years. A DCF valuation estimates the company's fair value in the range of $100-106 per share, leading to a recommendation to hold the stock. Sensitivity analysis found Hershey's returns are correlated with market volatility but not raw material prices.
Overall demand environment remains soft in the Consumer Sector in Q4IndiaNotes.com
1) The document discusses quarterly financial projections for consumer goods companies in India. It expects 9.2% sales growth and 15.4% profit growth on average for covered companies in the fourth quarter of fiscal year 2015.
2) Demand has remained soft overall, though some companies may see improved results due to base effects or inventory buildup. Rural demand in particular has softened further due to weak wage growth and commodity prices.
3) Many consumer goods companies have enacted price cuts in order to maintain market share as input costs such as palm oil and titanium dioxide have declined substantially year-over-year, improving margins.
This document summarizes the 2013 results for Kepler Weber. It reported record net revenues of R$594.8 million, nearly doubling operational profit and net profit. EBITDA increased 73% to R$98.3 million with margins reaching 16.5%. Debt was reduced substantially. Strong results in the 4th quarter confirmed the successful strategy of investments, optimizations, diversification and expanding products. Kepler Weber is well positioned for continued growth in 2014.
- Sales for Q1/2017 decreased slightly by 1% YoY to THB 2.14 billion due to a slowdown in domestic sales, especially for canned fruits. However, export sales grew strongly by 22% YoY.
- Net profit increased 8% YoY to THB 118 million in Q1/2017, supported by efficiency improvements and cost reductions.
- The company launched a new product, Malee Coco, in the domestic market and its joint venture in the Philippines launched a second product, Jelly Vit, in March 2017.
- For the full year 2017, the company aims to further improve profitability through new product development, cost management, and expanding its export markets.
Petronet LNG reported lower than expected revenues for the second quarter of fiscal year 2011 due to lower processed volumes. However, earnings were better than expected due to higher regasification margins from lower costs and other income. While volumes declined year-over-year, margins expanded due to reduced expenses. The company reported an 8.7% increase in profit over the same period last year. Going forward, the analyst expects natural gas prices to remain stable due to increased global supply from shale gas, supporting Petronet LNG's business model.
The stock market indices in India slumped on May 5, 2010, extending losses for the second straight day as global stocks fell. The BSE Sensex and Nifty closed down 1.4% each. Several major Indian companies announced positive quarterly earnings or new deals, including cement companies reporting robust year-over-year growth in shipments in April 2010 due to capacity additions and demand. HCL Technologies also signed a new $500 million, 5-year outsourcing deal with pharmaceutical company MSD to provide various IT services.
The derivative report summarizes developments in the Indian derivatives market for August 30, 2010. Open interest for Nifty futures decreased by 21.86% while open interest for Minifity futures decreased by 27.20% as the market closed at 5408.70 levels. Implied volatility of at-the-money options increased from 15% to 17.5%. Some liquid stocks with positive cost of carry included ABIRLANUVO, WELCORP, GMRINFRA, GTLINFRA and PATELENG. The total open interest in the market was Rs. 1,42,825 crore with stock futures open interest at Rs. 42,437 crore.
The key points from the document are:
1. Indian stock markets opened on a positive note and gained strength throughout the day, closing near the high of the day with the Nifty up 1.53% and Sensex up 1.6%.
2. Certain sectors like IT and metal performed well, gaining over 3% and 1.7% respectively, while top gainers included RPower, RelCapital and Infosys.
3. The document provides analysis that the indices have confirmed a bullish pattern and further upside is likely in coming days if levels of 17351/5201 are sustained. Support levels of 17063-16974/5111-5083 are also mentioned.
The document provides a preview of the Reserve Bank of India's upcoming monetary policy. It summarizes that:
1) The RBI is expected to continue its process of gradual monetary tightening to combat stubbornly high inflation.
2) Specifically, the RBI is expected to hike its repo and reverse repo rates by 25 basis points each to 6.25% and 5.25% respectively.
3) However, the RBI may delay hiking the cash reserve ratio (CRR) due to the current liquidity situation in the banking system.
NMDC reported disappointing quarterly results, with revenues growing only 2.4% and net profit below estimates. EBITDA margins declined due to lower volumes impacted by Naxal activity and a damaged pipeline. While iron ore prices have increased, the analyst recommends reducing exposure due to risks to volume growth from Naxal attacks and prices appearing fully priced in.
Sesa Goa's 1QFY2011 results were in line with estimates at the top line, but bottom line was ahead due to a lower tax rate. Top line growth of 138.6% was driven by higher iron ore prices, while volume growth was only 14.9% due to permit issues. EBITDA margins expanded significantly due to strong operations leading to a 208.3% rise in net profit. While Chinese steel and iron ore production is growing, imports have declined recently due to rising domestic Chinese iron ore production, causing a 31.5% drop in iron ore prices since April. The company is trading at attractive valuations but the outlook for volume growth is uncertain due to delays in permits and infrastructure issues.
The derivative report summarizes developments in the Indian derivatives market on August 25, 2010. Open interest in Nifty futures increased by 1.64% while open interest in Minifity futures decreased by 8.09%. The Nifty August future closed at a premium while the September future closed at a higher premium. Key put-call ratios and historical volatilities are also mentioned. Some stocks that saw significant changes in open interest are highlighted.
The document discusses market performance and outlook for India on July 21, 2010. Key Indian indices closed down 0.3% as markets reversed early gains. The document provides technical analysis targets and support/resistance levels for the indices. It also summarizes recent quarterly results from Automotive Axles and Sesa Goa, and previews results for several other companies. Market volumes and FII flows are also summarized.
The document provides a derivative report on the Indian market from June 21, 2010. It summarizes that day's trading activity including noting a decrease in Nifty futures open interest. It also lists the top gainers and losers by open interest change and provides analysis on specific stocks. Historical volatility numbers and potential options strategies like spreads are mentioned. Prior recommended strategies are also summarized.
Bharat Forge (BFL) reported a 92.8% year-over-year growth in standalone net sales for the fourth quarter of fiscal year 2010, exceeding expectations. Operating margins improved substantially to 22.8% due to lower raw material costs and operating leverage. BFL recorded a net profit of Rs. 61.3 crore for the quarter, above estimates. At the consolidated level, BFL reported a 46.7% year-over-year increase in revenues for the fourth quarter and completed the process of restructuring its global subsidiaries.
The document summarizes key points from Reliance Industries' annual general meeting, including plans to expand refining, petrochemical, and retail operations. RIL announced capacity additions in polyester, new plants for paraxylene and other petrochemical products, and aims to grow retail sales to $10 billion within five years. RIL also discussed priorities in upstream oil and gas exploration and developing a shale gas business, as well as investing in coal, hydro, and nuclear power plants.
The key points from the document are:
1) The Sensex closed slightly lower while mid and small cap indices gained, and state-run banks and capital goods stocks rose while IT and metals declined.
2) The market is expected to continue its upward momentum if the Nifty trades above 6,024 but could see a correction if it falls below that level.
3) News briefs highlighted the government capping fuel subsidies, forecasts of higher GDP growth for India, and corporate news about Hind Copper's share issue.
Larsen and Toubro (L&T) reported much better than expected results for the fourth quarter of fiscal year 2010. Revenues grew 28.1% year-over-year to Rs. 13,858 crore, driven by increases in several business segments. Operating margins reached a historic high of 15.1% due to cost controls. The order backlog remained robust at Rs. 1,00,239 crore. Going forward, the analyst maintains a positive view on the company given its strong order backlog, operating cash flows, and return ratios above 20%.
Grasim Industries reported a 22.7% year-over-year decline in adjusted net profit for the first quarter of fiscal year 2011 to Rs575 crore. The results were impacted by a 27% decline in operating profit for the company's cement division to Rs1,089 crore due to excess supply in southern and western regions. However, the company's viscose staple fiber division continued to perform well with a 54% year-over-year growth in operating profit to Rs304 crore. Going forward, the company's 60.3% subsidiary Ultratech Cement will be the key driver of its cement interests following the merger of Ultratech and Samruddhi Cement effective August
The market indices closed slightly higher, with the Nifty up 1.13% and Sensex up 0.8%. IDFC and Siemens were the top gainers rising over 4%, while Tata Motors and ACC lost over 1.5%. The IT sector gained 2.49% while autos fell 0.24%. The report provides analysis that the indices may consolidate or see a small pullback, and notes potential resistance levels. Pivot levels are given for various stocks. Positive and negative biased stocks for the next 2-3 days are also highlighted.
The document provides a summary of derivative market activity in India for May 06, 2010. It notes that Nifty futures open interest increased by 1.79% while Minifity futures open interest decreased by 4.02%. The PCR-OI for Nifty increased from 1.12 to 1.17. Some liquid stocks with positive cost-of-carry include STERLINBIO, BHARTIARTL, MLL, NOIDATOLL and FINANTECH. Put options and calls near 5000 and 5100 levels added substantial open interest on expectations of further downside in the market.
ONGC reported higher than expected results for the fourth quarter of fiscal year 2010 driven by increased net realizations and other operating income. Earnings before interest, taxes, depreciation, and amortization were above estimates due to higher other income. Depreciation costs were also higher than expected. The company maintained an accumulate rating and target price of Rs1,233 based on the positive impact of increased gas prices and potential for further reforms in the oil and gas sector.
Bajaj Electricals reported a 19.3% year-over-year increase in quarterly revenue to Rs. 784 crore, slightly ahead of estimates. Revenue growth was driven primarily by the consumer durables division which saw 35.6% growth. However, net profit declined 21.1% to Rs. 37 crore due to additional taxes and a loan write-off. The company maintained a strong order backlog of Rs. 932 crore. While growth outlook remains positive, the analyst maintains a neutral rating given the recent run-up in stock price and expects the stock to trade around 10-12 times estimated earnings.
The document provides a summary of derivative market activity in India for July 23, 2010. It notes that open interest for Nifty futures decreased slightly while increasing for Mini Nifty futures. The Nifty July future traded at a premium. Put-call ratios increased. Top gainers and losers by open interest are listed. Analysis of specific stocks and strategies is also provided.
Dena Bank reported a 28.9% year-over-year increase in net profit for the second quarter of fiscal year 2011, ahead of estimates, driven by better-than-expected operating performance and healthy growth in low-cost deposits. Net interest income grew 93.5% year-over-year due to a substantial improvement in net interest margins from increased CASA deposits and core fee income rose 34.9% year-over-year. While gross NPAs rose slightly, slippages declined and provision coverage improved. The bank plans to receive capital infusions that will boost its capital adequacy ratio.
HT Media reported strong revenue growth of 23% YoY to Rs. 431 crore in 2QFY11, led by 20%+ growth in English and Hindi print segments. However, circulation revenue declined 12.7% YoY. Earnings grew robustly by 77.7% YoY to Rs. 42 crore due to a 520% increase in other income and cost rationalization measures, despite a rise in taxes. Operating margins expanded 45 bps YoY through cost controls, but gross margins contracted 298 bps YoY due to higher newsprint costs. The company's new businesses like radio and internet showed continued traction.
- Sun TV Network (STNL) reported strong revenue and earnings growth in 2QFY2011, with revenues up 32.6% year-over-year led by increases in advertising, broadcasting fees, and subscription revenues.
- Operating margins expanded by 221 basis points driven by revenue gains and cost rationalization. However, earnings growth of 28.2% was impacted by a 59% jump in depreciation expenses.
- The report revises STNL's FY2011 and FY2012 estimates and maintains an "Accumulate" recommendation on expectations of continued revenue growth from advertising, broadcasting fees, and subscription services.
HUL reported a 10.7% rise in revenue to Rs. 4,681 crore for the quarter, driven by a 14% increase in volume growth. However, operating profit declined 7.8% to Rs. 563.1 crore due to a 242 basis point drop in operating margin to 12%. Recurring profit fell 6.7% to Rs. 525.7 crore despite an 82% jump in other income, on account of margin contraction and a 790 basis point rise in taxes. Volume growth was strong across categories like soaps, detergents and personal care, though profitability was impacted by higher overheads and competitive intensity in detergents.
Bajaj Electricals reported a 21.5% quarter-over-quarter rise in net sales to Rs. 588 crore for Q2FY11, though margins fell. Operating margins declined to 7.6% from 10.7% in the prior year period due to lower margins in the engineering and projects division. Net profit fell 19.8% to Rs. 23.4 crore for the quarter as a result of lower margins and higher interest costs. While sales growth was strong in the consumer durables segment, overall results were impacted by flat revenues and margins in the engineering division where most projects were in completion stages with lower margins.
Jagran Prakashan reported mixed quarterly results, with top-line growth of 12% driven by a 13% rise in advertising revenue, while margins contracted due to higher newsprint costs. Earnings grew 10% aided by a spike in other income. While the company expects 17-18% advertising revenue growth for FY2011, analysts maintain a buy rating due to strong long term growth prospects and attractive valuations following the company's acquisition of Mid-Day's print business.
ITC reported strong revenue and earnings growth for the second quarter of fiscal year 2011. Revenue grew 16.3% to Rs. 5,061 crore, driven by double-digit sales growth in cigarettes and strong growth in agri-business and non-cigarette FMCG. Earnings grew 23.5% to Rs. 1,247 crore due to revenue growth, lower taxes, and a 74% jump in other income. Operating margins remained flat at 35.3% as cost savings were offset by higher expenses. The cigarette segment delivered 15% revenue growth and 16.5% EBIT growth through price hikes, while volumes declined an estimated 1-2%.
Consolidated Construction Consortium (CCCL) reported poor financial results for the second quarter of fiscal year 2011, with revenues growing only 8.5% year-over-year. Operating margins declined due to higher staff costs and a design change that increased costs. Net profit declined 21.9% due to a large increase in interest costs. The analyst is lowering earnings estimates and downgrading the stock to Neutral due to disappointing execution, rich valuations, and expectations that the company will underperform peers.
- The document analyzes Whole Foods Market (WFM) and rates its stock as UNDERWEIGHT. While sales and EPS are forecasted to grow, concerns include WFM trading at a high P/E compared to its industry and risks to its growth strategy based on new store openings.
- The intrinsic value of WFM according to the analysis is lower than its current stock price, and the stock is expected to fall to around $40 by the end of the fiscal year as its valuation realigns with industry levels.
TCS reported strong double-digit revenue growth of 13% quarter-over-quarter for the second quarter of fiscal year 2011. Revenue growth was broad-based across all verticals and services, with discretionary services and infrastructure management seeing particularly robust growth above 15%. Margins also expanded significantly by 86 basis points due to favorable currency movements, productivity gains, and SG&A efficiencies. Hiring continued at a rapid pace, though utilization rates remained high. The company's client base further strengthened with the addition of large clients.
The document discusses Mytilineos' FY23 results which beat estimates due to stronger than expected performance from its Energy division. EBITDA and net earnings increased significantly year-over-year. While capex also increased, net debt remained manageable. This strengthened the analyst's conviction in Mytilineos' ability to continue growing profitability due to its vertically and horizontally integrated business model. As a result, the analyst raised near-term earnings estimates.
United Phosphorus reported 8.6% year-over-year sales growth to Rs. 1,257 crore for the second quarter of fiscal year 2011, which was below analyst estimates. EBITDA margin was 18.5%, in line with the previous year. PAT grew 13.4% to Rs. 131 crore. Revenue growth was impacted by unfavorable exchange rates and lower sales in North America and Europe due to adverse weather. The company maintained its full-year revenue growth guidance of 8-10% and EBITDA margin expansion target. Analysts maintained an 'Accumulate' rating with a target price of Rs. 228.
Uco Bank reported a 54.2% quarter-on-quarter decline in net profit to Rs. 119 crore for 2QFY2011, below estimates due to higher provisioning expenses. However, net interest income and non-interest income were above expectations. Advances grew 21.9% year-on-year led by corporate and agricultural loans while deposits increased 19.8% year-on-year. Asset quality deteriorated with gross NPAs rising 6.7% quarter-on-quarter and restructured loans reaching 7.1% of advances. The bank maintained a healthy capital adequacy ratio of 13.6% and aims to improve its CASA ratio and profitability by increasing retail and SME lending
Corporation Bank reported a 20.6% rise in net profit to Rs 352 crore for 2QFY2011, above estimates. Strong loan growth of 32.7% year-on-year and stable asset quality were highlights, however non-interest income declined due to high base. Operating costs rose 7.2% sequentially and the cost-to-income ratio was 39.1%. While the bank has efficient operations and healthy asset quality, maintaining its growth rates will be challenging due to the high growth base in the previous fiscal year.
Westpac - profit result delivers - "bread and butter banking delivers the dou...George Gabriel
WBC has delivered the strongest 2H12 results in the banking sector due to its focus on the fundamentals of banking such as deposit accounts, product cross-selling, maintaining margins, and cost control. Underlying cash earnings growth was up 2.0% in 1H12 and 6.5% in 2H12, outperforming peers. WBC has gained deposit market share which provides opportunities for cross-selling other products. Its efficiency metrics such as revenue per staff and profit per staff are sector-leading. The document recommends retaining a Positive view on WBC with a target share price of $26.84.
Britannia Industries 1QFY15 results ahead of estimate; buy - Motilal OswalIndiaNotes.com
Britannia Industries reported stronger than expected results for the first quarter of fiscal year 2015, with net sales growth of 15.3% year-over-year to INR 16.2 billion, ahead of estimates. EBITDA grew 21.5% to INR 1.4 billion, with margins expanding 50 basis points to 8.8% despite a 230 basis point contraction in gross margins due to rising raw material costs. Operating expenses savings offset gross margin pressure and contributed to higher EBITDA. PAT grew 24.9% to INR 1.08 billion, also beating estimates. The brokerage maintains a "Buy" rating and revised target price of INR 1,320 per share based on expected margin expansion from premiumization and
- Finolex Cables reported a 21.2% year-over-year increase in net sales to Rs. 490.6 crore for the second quarter of FY2011, driven by strong growth in the electrical cables segment. However, operating margins remained under pressure at 8.5% due to high raw material costs.
- Going forward, the company expects continued robust demand from user industries and contribution from new high-tension and extra-high voltage plants. However, margins are forecasted to remain subdued in the near term before improving to around 9.3% in FY2011 and 9.9% in FY2012 as raw material costs stabilize.
- With major capital expenditures completed, strong
Federal Bank reported a 6.5% quarter-on-quarter and 38.9% year-on-year rise in net profit to 140 crore rupees, above estimates due to higher non-interest income. While advances and deposits growth was muted, the bank saw strong growth in low-cost CASA deposits. Gross and net NPAs increased substantially, though provisions remained high at 92% of gross NPAs. Slippages continued to be high at 3.8% of loans annually.
Motilal Oswal reiterate bullish long term view on United SpiritsIndiaNotes.com
- United Spirits is reinvigorating its premium brands through changes to packaging, brand architecture and increased investments in marketing. It is also shifting brand spending towards more effective above-the-line advertising.
- Several cost-cutting measures such as value engineering, packaging lightweighting and overhead reductions can boost margins. The industry is trending towards premiumization which should support United Spirits' profitability.
- The report maintains a buy rating for United Spirits, seeing the premiumization and cost management initiatives as driving margin expansion and making it a long-term consumer story.
Maruti Suzuki reported a 27% year-over-year increase in net sales to Rs. 9,147 crore for the second quarter of fiscal year 2011, which was 1.9% above estimates. Earnings before interest, taxes, depreciation, and amortization (EBITDA) margin declined 222 basis points year-over-year to 10.5% due to higher raw material costs and royalty charges. However, net profit grew 5% to Rs. 598 crore, beating estimates of Rs. 535 crore due to higher other operating and other income. While top-line growth was supported by a 27.4% increase in vehicle volumes, margins were impacted by rising costs.
The Indian markets are expected to open higher, tracking gains in most Asian markets. Spain has asked for a bailout of up to €100 billion for its banking system. Chinese exports grew more than expected in May. In India, shares extended gains for a fifth session despite weak global cues as major central banks held off on additional stimulus. The key support and resistance levels for the Nifty are 5,023 and 5,114 respectively. L&T has bagged orders worth Rs. 483 crore to build commercial vessels in Qatar. Vedanta Resources has acquired a 24.5% stake in Raykal Aluminium for Rs. 201 crore.
Axis Bank reported a 27.0% year-over-year increase in net profit to Rs. 942 crore for the first quarter of fiscal year 2012, in line with analyst estimates. Business growth momentum slowed as advances declined 7.4% quarter-over-quarter and deposits fell 3.0% quarter-over-quarter, moderating the bank's cash-deposit ratio to 40.5% from 41.1% last quarter. However, asset quality remained healthy with slippage ratio declining to 0.8% and gross and net NPA ratios stable.
1) For 1QFY2012, Electrosteel Castings reported 16.4% sales growth but margins declined due to higher raw material costs. EBITDA fell 18.2% and net profit declined 7.2%.
2) While sales volumes grew, costs increased more due to a rise in raw material costs as a percentage of sales.
3) The company maintains a buy recommendation due to initiatives in steelmaking and backward integration that should lower costs starting in FY2013 and valuation remains attractive.
1) For 1QFY2012, Persistent Systems reported revenues of ₹224 crore, up 5.2% over the previous quarter and 23.6% over the same period last year.
2) EBITDA was ₹40 crore, up 5.3% over the previous quarter but margins declined.
3) PAT was ₹28 crore, down 16.8% over the previous quarter due to higher taxes.
4) Management maintained revenue guidance of 29% growth for FY2012 and expects PAT to remain flat despite higher tax rates.
HT Media reported a 22.7% year-over-year increase in revenue to ₹494 crore for the first quarter of FY2012. Revenue was also up 5.8% quarter-over-quarter. Advertising revenue grew 17% year-over-year, with 18% growth in English and 15% growth in Hindi. Operating profit rose 11.8% year-over-year to ₹87.8 crore due to higher other income and lower tax rates, although operating margins contracted by 174 basis points. The company maintained its Accumulate rating based on expectations of continued revenue growth and margin expansion.
The summary is:
1) The derivative report analyzes the performance of the Nifty futures, options, and key stocks from the previous trading session on July 18, 2011.
2) It provides details on changes in open interest, premium levels, volatility, and turnover for various derivatives contracts.
3) Trading strategies and technical analysis is also given for some stocks along with risk-reward profiles of sample spreads trades for the Nifty.
The market ended lower, with the Sensex and Nifty closing down 0.3%. Mid- and small-cap indices closed higher. Select heavyweights like Hindalco Industries and BHEL gained 1-3%, while TCS and Tata Motors lost 1-2%. In corporate news, Motherson Sumi Systems agreed to acquire an 80% stake in Peguform for €141.5 million. HDFC Bank, Cadila Healthcare, Crompton Greaves, and Ashok Leyland are scheduled to announce their quarterly results. The trend for the day will be decided by whether Nifty trades above or below the levels of 18,533/5,572 in early trade.
- GSM subscriber additions in India continued their declining trend in June 2011, with net additions of 9.6 million, down 10% from the previous month.
- All major operators except BSNL reported a drop in subscriber additions. Bharti and Vodafone each added 2.1 million subscribers.
- The total GSM subscriber base reached 598.8 million in June 2011, with Bharti, Vodafone, Idea and BSNL maintaining their major market shares.
The document provides a technical analysis of the Indian stock market indices Sensex and Nifty for the week of July 16, 2011. It summarizes that the indices declined over 1.5% for the week and are currently trading in a range between 18,326/5496 on the downside and 19,132/5740 on the upside. It notes that a break above or below this range would dictate the direction of the upcoming trend. The analysis also lists pivot levels for 50 Nifty stocks to watch in the coming week.
The document provides a summary of derivative market activity in India for July 18, 2011. Key points include:
- Nifty futures open interest increased 0.67% while Mini Nifty increased 3.48% as the market closed at 5581.10
- Nifty July futures closed at a premium of 5.85 points and August futures at a premium of 22.60 points
- Implied volatility of at-the-money options decreased from 18% to 17.3%
- Total open interest in the market was Rs. 135,158 crore with stock futures open interest at Rs. 34,675 crore.
The indices opened flat but traded choppily throughout the day. Metal, auto and realty stocks declined while IT stocks gained. The indices are currently trading in a range between 18,326-18,810/5496-5653 on the downside and 19,132-19,094/5740-5700 on the upside. A break above these resistance levels could lead to further gains while a break below support could result in losses extending to 17,805-17,950/5350-5400. Pivot levels for 50 Nifty stocks are provided.
- The key Indian stock indices declined slightly, with the Sensex and Nifty closing down 0.3%.
- GSM subscriber additions in India continued their declining trend in June across most major operators such as Idea, Bharti Airtel, and Vodafone. Total GSM subscriber addition was 9.6 million, down 10% from the previous month.
- Tata Motors reported flat annual global sales growth in June 2011 compared to the previous year.
- South Indian Bank reported a 41.2% year-over-year increase in net profit to Rs. 82 crores for the first quarter of fiscal year 2012, slightly below analyst estimates.
- Business growth remained strong, with advances growth of 31.2% and deposits growth of 35.5% year-over-year. However, net interest margins compressed by 29 basis points sequentially to 2.8% due to a sharp rise in the bank's cost of deposits.
- Non-interest income was boosted by treasury gains, but fee income growth was modest. Asset quality was stable with gross and net NPAs rising marginally, and provision coverage at a comfortable 73.1%.
Bajaj Auto reported marginally lower-than-expected results for the first quarter of fiscal year 2012, with net sales growth of 22.8% year-over-year driven by a 17.7% increase in volumes. However, operating margins contracted by 145 basis points quarter-over-quarter to 19.1% due to a 150 basis point increase in raw material costs. As a result, net profit grew by 20.5% year-over-year to ₹711 crore, which was slightly below analyst estimates. Going forward, the analyst expects further margin pressure and has revised downward its earnings estimates for fiscal years 2012 and 2013 to factor in higher raw material costs and changes to export incentives.
The document summarizes the Indian stock market outlook and performance on July 15, 2011. It reports that domestic indices closed with modest gains of 0.1-0.4%, while global indices declined. Wholesale price inflation in India rose to 9.44% in June 2011, above estimates and persisting above 9% for seven months, driven by increases in primary articles and fuel costs. Key benchmark levels are identified for determining if the market may continue rallying or correct in the near term.
The summary is:
1) The derivative report analyzes the movement in Nifty futures, options, and individual stocks between July 14-15, 2011.
2) Nifty futures open interest decreased while mini Nifty open interest increased as the market closed at 5599.80.
3) Implied volatility of at-the-money options increased from 17.6% to 18%.
The Sensex and Nifty indices opened lower and traded with volatility, closing marginally lower. On the sectoral front, Realty, Banks and Healthcare gained while IT and FMCG fell. The advance-decline ratio favored advancing stocks. On the daily chart, prices tested but did not close above the downward gap area of 18,679-18,589/5,601-5,580 levels. Immediate resistance is seen at 18,735/5,633, while 18,449/5,541 is crucial support.
1) Infosys reported modest revenue growth of 3.2% qoq for 1QFY2012. EBITDA and margins declined due to wage hikes.
2) Guidance for 2QFY2012 revenue growth was lower than expected at 3.5-5% qoq. Annual revenue growth guidance was unchanged.
3) The analyst revised EPS estimates down and cut the target price to INR 3,200 due to macro concerns and muted guidance.
This document summarizes a derivative report from India Research dated July 13, 2011. Some key points:
- The Nifty futures open interest increased 0.51% while Minifty futures open interest rose 8.2% as the market closed at 5526.15.
- Implied volatility of at-the-money options increased from 18% to 19.75%. PCR-OI decreased from 1.20 to 1.15.
- Total open interest of the market is Rs. 125,816 crore and stock futures open interest is Rs. 33,500 crore.
- FII were net sellers of Rs. 969 crore in the cash market segment. Put-call
The daily technical report provides the following information:
1) The Sensex and Nifty indexes opened with a downside gap and remained negative throughout the day, with the realty, IT, and auto sectors among the major losers.
2) On the daily chart, the indexes tested the 20-day simple moving average for support and closed above it, while the RSI and ADX indicators show a negative crossover.
3) The report recommends selling REL. INFRA. futures with a stop loss of Rs. 579.05 and target of Rs. 552.00.
Explore the world of investments with an in-depth comparison of the stock market and real estate. Understand their fundamentals, risks, returns, and diversification strategies to make informed financial decisions that align with your goals.
Madhya Pradesh, the "Heart of India," boasts a rich tapestry of culture and heritage, from ancient dynasties to modern developments. Explore its land records, historical landmarks, and vibrant traditions. From agricultural expanses to urban growth, Madhya Pradesh offers a unique blend of the ancient and modern.
13 Jun 24 ILC Retirement Income Summit - slides.pptxILC- UK
ILC's Retirement Income Summit was hosted by M&G and supported by Canada Life. The event brought together key policymakers, influencers and experts to help identify policy priorities for the next Government and ensure more of us have access to a decent income in retirement.
Contributors included:
Jo Blanden, Professor in Economics, University of Surrey
Clive Bolton, CEO, Life Insurance M&G Plc
Jim Boyd, CEO, Equity Release Council
Molly Broome, Economist, Resolution Foundation
Nida Broughton, Co-Director of Economic Policy, Behavioural Insights Team
Jonathan Cribb, Associate Director and Head of Retirement, Savings, and Ageing, Institute for Fiscal Studies
Joanna Elson CBE, Chief Executive Officer, Independent Age
Tom Evans, Managing Director of Retirement, Canada Life
Steve Groves, Chair, Key Retirement Group
Tish Hanifan, Founder and Joint Chair of the Society of Later life Advisers
Sue Lewis, ILC Trustee
Siobhan Lough, Senior Consultant, Hymans Robertson
Mick McAteer, Co-Director, The Financial Inclusion Centre
Stuart McDonald MBE, Head of Longevity and Democratic Insights, LCP
Anusha Mittal, Managing Director, Individual Life and Pensions, M&G Life
Shelley Morris, Senior Project Manager, Living Pension, Living Wage Foundation
Sarah O'Grady, Journalist
Will Sherlock, Head of External Relations, M&G Plc
Daniela Silcock, Head of Policy Research, Pensions Policy Institute
David Sinclair, Chief Executive, ILC
Jordi Skilbeck, Senior Policy Advisor, Pensions and Lifetime Savings Association
Rt Hon Sir Stephen Timms, former Chair, Work & Pensions Committee
Nigel Waterson, ILC Trustee
Jackie Wells, Strategy and Policy Consultant, ILC Strategic Advisory Board
5 Compelling Reasons to Invest in Cryptocurrency NowDaniel
In recent years, cryptocurrencies have emerged as more than just a niche fascination; they have become a transformative force in global finance and technology. Initially propelled by the enigmatic Bitcoin, cryptocurrencies have evolved into a diverse ecosystem of digital assets with the potential to reshape how we perceive and interact with money.
Calculation of compliance cost: Veterinary and sanitary control of aquatic bi...Alexander Belyaev
Calculation of compliance cost in the fishing industry of Russia after extended SCM model (Veterinary and sanitary control of aquatic biological resources (ABR) - Preparation of documents, passing expertise)
Monthly Market Risk Update: June 2024 [SlideShare]Commonwealth
Markets rallied in May, with all three major U.S. equity indices up for the month, said Sam Millette, director of fixed income, in his latest Market Risk Update.
For more market updates, subscribe to The Independent Market Observer at https://blog.commonwealth.com/independent-market-observer.
In World Expo 2010 Shanghai – the most visited Expo in the World History
https://www.britannica.com/event/Expo-Shanghai-2010
China’s official organizer of the Expo, CCPIT (China Council for the Promotion of International Trade https://en.ccpit.org/) has chosen Dr. Alyce Su as the Cover Person with Cover Story, in the Expo’s official magazine distributed throughout the Expo, showcasing China’s New Generation of Leaders to the World.
KYC Compliance: A Cornerstone of Global Crypto Regulatory FrameworksAny kyc Account
This presentation explores the pivotal role of KYC compliance in shaping and enforcing global regulations within the dynamic landscape of cryptocurrencies. Dive into the intricate connection between KYC practices and the evolving legal frameworks governing the crypto industry.
How to Invest in Cryptocurrency for Beginners: A Complete GuideDaniel
Cryptocurrency is digital money that operates independently of a central authority, utilizing cryptography for security. Unlike traditional currencies issued by governments (fiat currencies), cryptocurrencies are decentralized and typically operate on a technology called blockchain. Each cryptocurrency transaction is recorded on a public ledger, ensuring transparency and security.
Cryptocurrencies can be used for various purposes, including online purchases, investment opportunities, and as a means of transferring value globally without the need for intermediaries like banks.
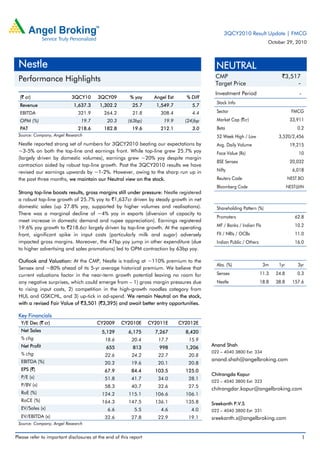
1. Please refer to important disclosures at the end of this report 1
(` cr) 3QCY10 3QCY09 % yoy Angel Est % Diff
Revenue 1,637.3 1,302.2 25.7 1,549.7 5.7
EBITDA 321.9 264.2 21.8 308.4 4.4
OPM (%) 19.7 20.3 (63bp) 19.9 (24)bp
PAT 218.6 182.8 19.6 212.1 3.0
Source: Company, Angel Research
Nestle reported strong set of numbers for 3QCY2010 beating our expectations by
~3-5% on both the top-line and earnings front. While top-line grew 25.7% yoy
(largely driven by domestic volumes), earnings grew ~20% yoy despite margin
contraction aided by robust top-line growth. Post the 3QCY2010 results we have
revised our earnings upwards by ~1-2%. However, owing to the sharp run up in
the past three months, we maintain our Neutral view on the stock.
Strong top-line boosts results, gross margins still under pressure: Nestle registered
a robust top-line growth of 25.7% yoy to `1,637cr driven by steady growth in net
domestic sales (up 27.8% yoy, supported by higher volumes and realisations).
There was a marginal decline of ~4% yoy in exports (diversion of capacity to
meet increase in domestic demand and rupee appreciation). Earnings registered
19.6% yoy growth to `218.6cr largely driven by top-line growth. At the operating
front, significant spike in input costs (particularly milk and sugar) adversely
impacted gross margins. Moreover, the 47bp yoy jump in other expenditure (due
to higher advertising and sales promotions) led to OPM contraction by 63bp yoy.
Outlook and Valuation: At the CMP, Nestle is trading at ~110% premium to the
Sensex and ~80% ahead of its 5-yr average historical premium. We believe that
current valuations factor in the near-term growth potential leaving no room for
any negative surprises, which could emerge from – 1) gross margin pressures due
to rising input costs, 2) competition in the high-growth noodles category from
HUL and GSKCHL, and 3) up-tick in ad-spend. We remain Neutral on the stock,
with a revised Fair Value of `3,501 (`3,395) and await better entry opportunities.
Key Financials
Y/E Dec (` cr) CY2009 CY2010E CY2011E CY2012E
Net Sales 5,129 6,175 7,267 8,420
% chg 18.6 20.4 17.7 15.9
Net Profit 655 813 998 1,206
% chg 22.6 24.2 22.7 20.8
EBITDA (%) 20.2 19.6 20.1 20.8
EPS (`) 67.9 84.4 103.5 125.0
P/E (x) 51.8 41.7 34.0 28.1
P/BV (x) 58.3 40.7 32.6 27.5
RoE (%) 124.2 115.1 106.6 106.1
RoCE (%) 164.3 147.5 136.1 135.8
EV/Sales (x) 6.6 5.5 4.6 4.0
EV/EBITDA (x) 32.6 27.8 22.9 19.1
Source: Company, Angel Research
Nestle
Performance Highlights
3QCY2010 Result Update | FMCG
October 29, 2010
NEUTRAL
CMP `3,517
Target Price -
Investment Period -
Stock Info
Sector FMCG
Market Cap (`cr) 33,911
Beta 0.2
52 Week High / Low 3,520/2,456
Avg. Daily Volume 19,215
Face Value (Rs) 10
BSE Sensex 20,032
Nifty 6,018
Reuters Code NEST.BO
Bloomberg Code NEST@IN
Shareholding Pattern (%)
Promoters 62.8
MF / Banks / Indian Fls 10.2
FII / NRIs / OCBs 11.0
Indian Public / Others 16.0
Abs. (%) 3m 1yr 3yr
Sensex 11.3 24.8 0.3
Nestle 18.8 38.8 157.6
Anand Shah
022 – 4040 3800 Ext: 334
anand.shah@angelbroking.com
Chitrangda Kapur
022 – 4040 3800 Ext: 323
chitrangdar.kapur@angelbroking.com
Sreekanth P.V.S
022 – 4040 3800 Ext: 331
sreekanth.s@angelbroking.com
2. Nestle|3QCY2010 Result Update
October 29, 2010 2
Exhibit 1: Quarterly Performance
Y/E Dec (` cr) 3QCY10 3QCY09 % yoy 9MCY10 9MCY09 % chg
Net Sales 1,637.3 1,302.2 25.7 4,583.8 3,777.6 21.3
Consumption of RM 803.4 622.3 29.1 2,260.0 1,796.2 25.8
(% of Sales) 49.1 47.8 49.3 47.5
Staff Costs 104.1 97.4 6.8 315.5 294.8 7.0
(% of Sales) 6.4 7.5 6.9 7.8
Other Expenses 407.9 318.3 28.2 1,088.4 850.4 28.0
(% of Sales) 24.9 24.4 23.7 22.5
Total Expenditure 1,315.4 1,038.0 26.7 3,663.9 2,941.3 24.6
Operating Profit 321.9 264.2 21.8 919.9 836.3 10.0
OPM (%) 19.7 20.3 20.1 22.1
Interest 0.1 0.2 1.0 0.9 6.6
Depreciation 30.6 28.6 6.9 92.0 80.6 14.1
Other Income 9.5 8.8 8.0 28.8 27.3 5.2
PBT (excl. Extr. Items) 300.8 244.3 23.1 855.7 782.1 9.4
Extr. Income/(Expense) 1.8 4.4 0.1 14.7
PBT (incl. Extr. Items) 302.6 248.7 21.7 855.8 796.8 7.4
(% of Sales) 18.5 19.1 18.7 21.1
Provision for Taxation 84.0 65.9 27.5 240.4 217.7 10.4
(% of PBT) 27.9 27.0 28.1 27.8
Recurring PAT 216.8 178.4 21.5 615.4 564.4 9.0
PATM 13.2 13.7 13.4 14.9
Reported PAT 218.6 182.8 19.6 615.5 579.1 6.3
Equity shares (cr) 9.6 9.6 9.6 9.6
EPS (`) 22.7 19.0 63.8 60.1
Source: Company, Angel Research
Top-line growth robust driven by volumes, exports decline
Nestle registered robust top-line growth of 25.7% yoy to `1,637.3cr (`1,302cr),
ahead of our estimates, driven by steady growth in its net domestic sales (up 27.8%
yoy to `1,555cr supported by steady volume growth across categories). However, a
~4% yoy decline in exports to `82cr (diverted capacity due to the uptick in domestic
demand and rupee appreciation) restricted the top-line growth.
Management continued to focus on innovations during the quarter – 1) launched
Multigrainz noodles nationally, 2) launched new variants in Romantic Capsica to the
Me&Meri Maggi range, and 3) launched the Nestle EXTRAFINO milk and dark
chocolates in the premium range and the Nestle Milk ‘Half Fat’ and Nestle KITKAT at
`10.
3. Nestle|3QCY2010 Result Update
October 29, 2010 3
Exhibit 2: Robust top-line growth driven by volumes
Source: Company, Angel Research
Cost pressure increases, earnings growth largely driven by top-line
Nestle’s earnings (on a reported basis) registered 19.6% yoy growth to `218.6cr
(`182.8cr) despite the contraction in margin largely driven by the robust top-line
growth. At the operating front, contraction in gross margins by 128bp yoy (inflation
in milk and sugar prices) coupled with higher advertising and sales promotion spend
(reflected in 47bp yoy jump in other expenses) impacted OPM, which contracted by
63bp yoy. However, reduction in staff costs by 113bp yoy helped arrest further
decline in margin. Hence, EBITDA registered healthy growth of 21.8% yoy to
`321.9cr (`264.2cr).
Exhibit 3: Earnings led by healthy top-line growth
Source: Company, Angel Research
Exhibit 4: Gross margins contract yoy, flat qoq
Source: Company, Angel Research
-
5.0
10.0
15.0
20.0
25.0
30.0
-
200
400
600
800
1,000
1,200
1,400
1,600
1,800
3Q08
4Q08
1Q09
2Q09
3Q09
4Q09
1Q10
2Q10
3Q10
(yoy%)
(`cr)
Top-line (LHS) YoY growth (RHS)
(10.0)
-
10.0
20.0
30.0
40.0
50.0
10
60
110
160
210
260
3Q08
4Q08
1Q09
2Q09
3Q09
4Q09
1Q10
2Q10
3Q10
(yoy%)
(`cr)
PAT (LHS) YoY growth (RHS)
18.7 19.5
24.5
21.6 20.3
14.7
20.5 20.0 19.7
49.8 52.8 52.8 52.4 52.2 51.8 50.2 51.0 50.9
-
10.0
20.0
30.0
40.0
50.0
60.0
3Q08
4Q08
1Q09
2Q09
3Q09
4Q09
1Q10
2Q10
3Q10
(%)
OPM Gross Margin
4. Nestle|3QCY2010 Result Update
October 29, 2010 4
Investment Rationale
Best play on emerging growth opportunity in foods: Nestle enjoys strong position
across categories in the food & beverage space through a diversified portfolio
of established brands like Maggi, Nescafe, Everyday, Kit Kat, Milkmaid, etc. We
are particularly bullish on under-penetrated categories like instant noodles,
value-added dairy products, chocolate and confectionery, which are witnessing
an uptrend in consumer demand.
Better distribution reach, focus on LUPs and new product launches to aid growth:
There is significant focus on improving distribution reach and various LUPs (low
unit packs, ~30% of sales) have been launched across product segments aiding
strong double-digit growth in the smaller towns. Moreover, new product
launches in existing categories, entry into new categories (like breakfast cereals)
and launches from the parent’s portfolio are likely to help Nestle maintain its
growth momentum.
Valuations at 110% premium to Sensex and factors in full potential: At the CMP,
Nestle is trading at ~110% premium to Sensex, which is ahead by a significant
~80% of its 5-yr average historical premium. While Nestle has been able to
maintain these premium valuations on account of strong parentage, dominant
brands, high RoEs and OPMs, we believe current valuations factor in the
near-term growth potential leaving no room for any negative surprises, which
could emerge from – 1) gross margin pressures due to rising input costs, 2)
competition in the high-growth noodles category from HUL (Knorr soupy
noodles) and GSKCHL (Horlicks Foodles), and 3) up-tick in ad-spend to battle
higher competitive intensity.
Outlook and Valuation
Post the 3QCY2010 result we have revised our earnings estimates for Nestle
marginally upwards by ~1-2% to factor in strong revenue traction.
Exhibit 5: Change in Estimates
Old Estimate New Estimate % chg
(` cr) CY11 CY12 CY11 CY12 CY11 CY12
Revenue 6,077 7,116 6,175 7,267 1.6 2.1
OPM (%) 19.7 20.1 19.6 20.1 (9) 7
EPS (`) 83.3 101.3 84.4 103.5 1.3 2.2
Source: Company, Angel Research
At the CMP of `3,517, the stock is trading at rich valuations of 28x CY2012E EPS of
`125. We maintain our Neutral view on the stock, with a revised Fair Value of
`3,501 (`3,395) and await better entry opportunities in the stock.
10. Nestle|3QCY2010 Result Update
October 29, 2010 10
Research Team Tel: 022 - 4040 3800 E-mail: Research@angeltrade.com Website: www.angeltrade.com
Disclaimer
This document is solely for the personal information of the recipient, and must not be singularly used as the basis of any investment
decision. Nothing in this document should be construed as investment or financial advice. Each recipient of this document should make
such investigations as they deem necessary to arrive at an independent evaluation of an investment in the securities of the companies
referred to in this document (including the merits and risks involved), and should consult their own advisors to determine the merits and
risks of such an investment.
Angel Broking Limited, its affiliates, directors, its proprietary trading and investment businesses may, from time to time, make
investment decisions that are inconsistent with or contradictory to the recommendations expressed herein. The views contained in this
document are those of the analyst, and the company may or may not subscribe to all the views expressed within.
Reports based on technical and derivative analysis center on studying charts of a stock's price movement, outstanding positions and
trading volume, as opposed to focusing on a company's fundamentals and, as such, may not match with a report on a company's
fundamentals.
The information in this document has been printed on the basis of publicly available information, internal data and other reliable
sources believed to be true, but we do not represent that it is accurate or complete and it should not be relied on as such, as this
document is for general guidance only. Angel Broking Limited or any of its affiliates/ group companies shall not be in any way
responsible for any loss or damage that may arise to any person from any inadvertent error in the information contained in this report.
Angel Broking Limited has not independently verified all the information contained within this document. Accordingly, we cannot testify,
nor make any representation or warranty, express or implied, to the accuracy, contents or data contained within this document. While
Angel Broking Limited endeavours to update on a reasonable basis the information discussed in this material, there may be regulatory,
compliance, or other reasons that prevent us from doing so.
This document is being supplied to you solely for your information, and its contents, information or data may not be reproduced,
redistributed or passed on, directly or indirectly.
Angel Broking Limited and its affiliates may seek to provide or have engaged in providing corporate finance, investment banking or
other advisory services in a merger or specific transaction to the companies referred to in this report, as on the date of this report or in
the past.
Neither Angel Broking Limited, nor its directors, employees or affiliates shall be liable for any loss or damage that may arise from or in
connection with the use of this information.
Note: Please refer to the important `Stock Holding Disclosure' report on the Angel website (Research Section). Also, please refer to the
latest update on respective stocks for the disclosure status in respect of those stocks. Angel Broking Limited and its affiliates may have
investment positions in the stocks recommended in this report.
Disclosure of Interest Statement Nestle
1. Analyst ownership of the stock No
2. Angel and its Group companies ownership of the stock No
3. Angel and its Group companies' Directors ownership of the stock No
4. Broking relationship with company covered No
Note: We have not considered any Exposure below Rs 1 lakh for Angel, its Group companies and Directors.
Ratings (Returns) : Buy (> 15%) Accumulate (5% to 15%) Neutral (-5 to 5%)
Reduce (-5% to 15%) Sell (< -15%)