Download to read offline
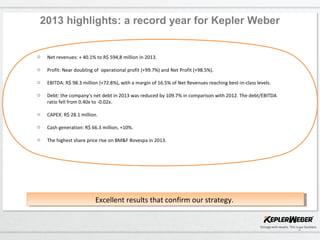
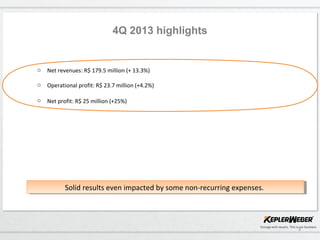

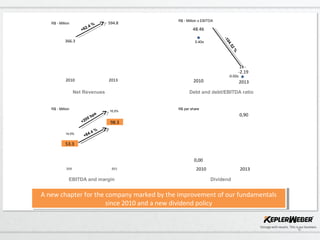
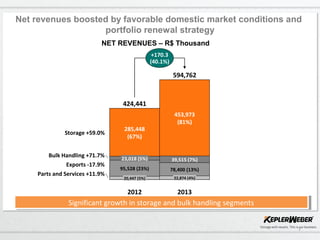
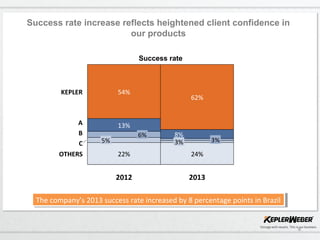
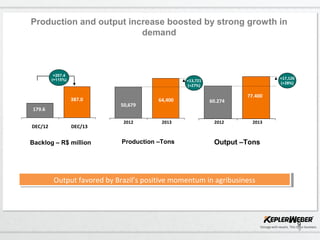
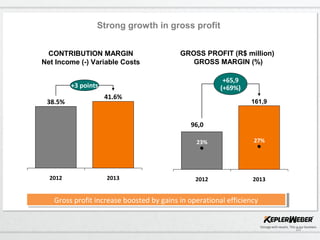
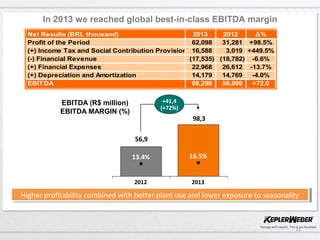
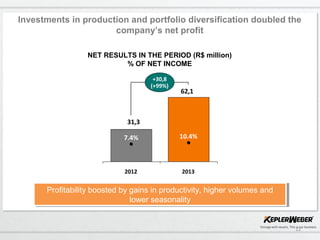
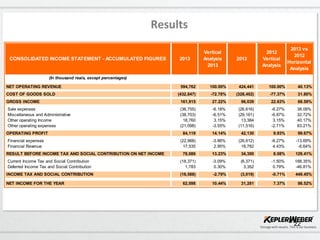
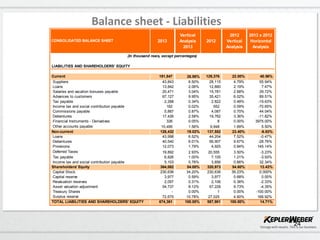


This document summarizes the 2013 results for Kepler Weber. It reported record net revenues of R$594.8 million, nearly doubling operational profit and net profit. EBITDA increased 73% to R$98.3 million with margins reaching 16.5%. Debt was reduced substantially. Strong results in the 4th quarter confirmed the successful strategy of investments, optimizations, diversification and expanding products. Kepler Weber is well positioned for continued growth in 2014.


