Download to read offline
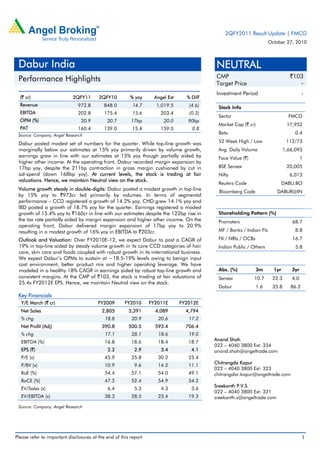
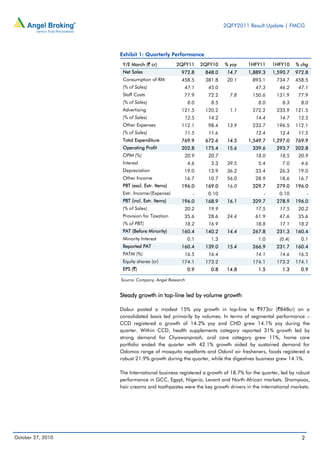
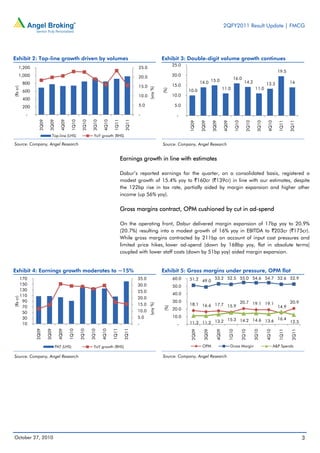
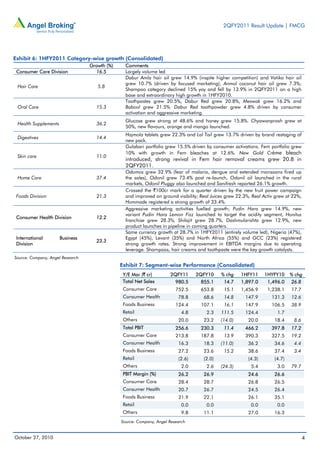
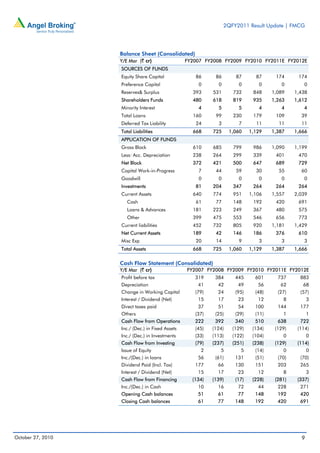

Dabur reported a modest 15% year-over-year growth in revenue to Rs. 972.8 crores driven by steady volume growth across segments. Earnings grew 15.4% to Rs. 160.4 crores, in line with estimates. Operating margins expanded slightly by 17 basis points despite a contraction in gross margins, helped by lower advertising spend. Segment-wise, consumer care grew 15.1% while consumer health and the international business grew at higher rates. The company maintained its guidance for steady volume growth and margins in the coming years.


