Download as PDF, PPTX

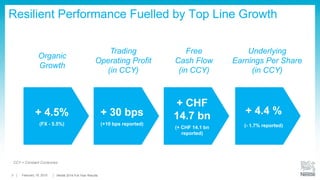
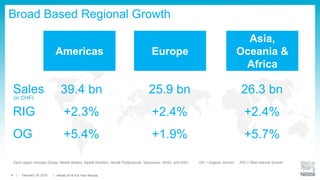
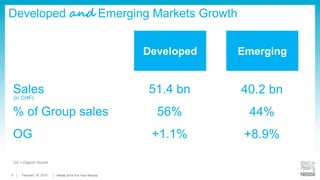
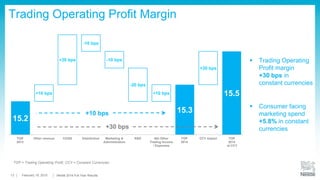
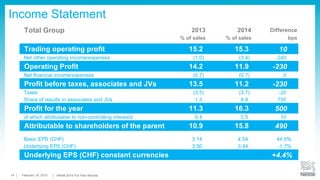

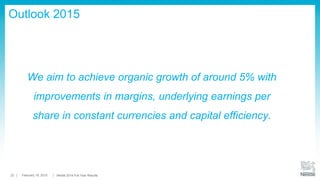


Nestlé's full-year results for 2014 revealed sales of CHF 91.6 billion, with an organic growth of 4.5% and a trading operating profit margin increase of 30 basis points. Despite facing risks and uncertainties, the company showed resilient performance across all regions, particularly in emerging markets, while maintaining focus on operational efficiency and innovation. For 2015, Nestlé aims for organic growth around 5%, improved margins, and enhanced capital efficiency.


