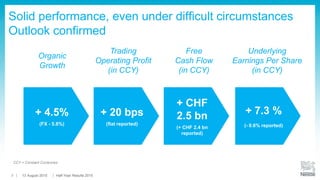
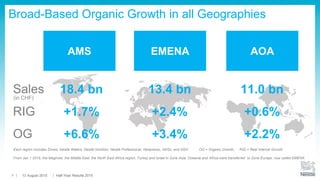
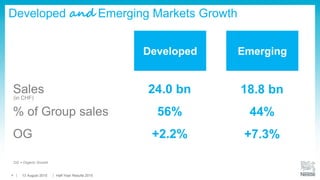
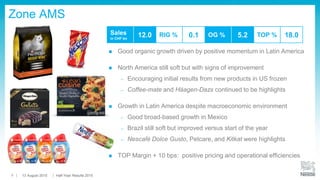
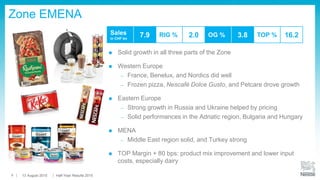
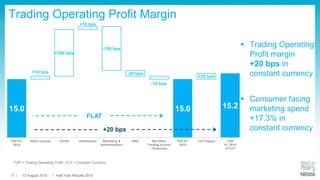
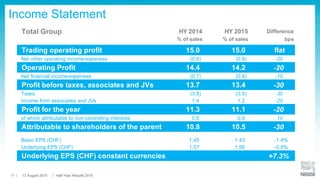
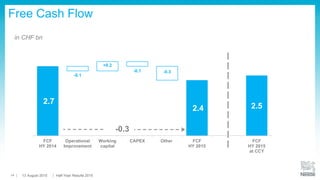
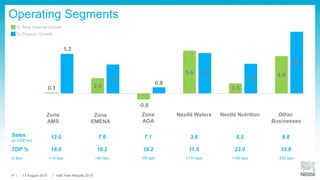
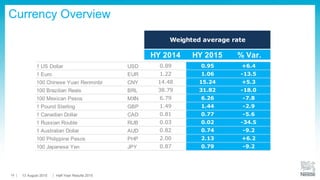
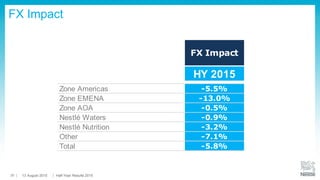
François-Xavier Roger
Chief Financial Officer
2015
Half-Year
Results
This presentation contains forward looking statements which
reflect Management’s current views and estimates. The
forward looking statements involve certain risks and
uncertainties that could cause actual results to differ
materially from those contained in the forward looking
statements. Potential risks and uncertainties include such
factors as general economic conditions, foreign exchange
fluctuations, competitive product and pricing pressures and
regulatory developments.
Disclaimer
13 August 2015 Half-Year Results 20151
+ CHF
2.5 bn
(+ CHF 2.4 bn
reported)
Free
Cash Flow
(in CCY)
Solid performance, even under difficult circumstances
Outlook confirmed
Organic
Growth
+ 4.5%
(FX - 5.8%)
+ 20 bps
(flat reported)
+ 7.3 %
(- 0.6% reported)
Trading
Operating Profit
(in CCY)
Underlying
Earnings Per Share
(in CCY)
CCY = Constant Currencies
13 August 2015 Half-Year Results 20152
Each region includes Zones, Nestlé Waters, Nestlé Nutrition, Nestlé Professional, Nespresso, NHSc, and NSH OG = Organic Growth, RIG = Real Internal Growth
From Jan 1 2015, the Maghreb, the Middle East, the North East Africa region, Turkey and Israel in Zone Asia, Oceania and Africa were transferred to Zone Europe, now called EMENA
Sales
RIG
OG
(in CHF)
Broad-Based Organic Growth in all Geographies
AOA
11.0 bn
+0.6%
+2.2%
AMS
18.4 bn
+1.7%
+6.6%
EMENA
13.4 bn
+2.4%
+3.4%
13 August 2015 Half-Year Results 20153
24.0 bn
56%
+2.2%
18.8 bn
44%
+7.3%
Developed and Emerging Markets Growth
EmergingDeveloped
Sales
% of Group sales
OG
(in CHF)
OG = Organic Growth
13 August 2015 Half-Year Results 20154
Zone AMS
 Good organic growth driven by positive momentum in Latin America
 North America still soft but with signs of improvement
– Encouraging initial results from new products in US frozen
– Coffee-mate and Häagen-Dazs continued to be highlights
 Growth in Latin America despite macroeconomic environment
– Good broad-based growth in Mexico
– Brazil still soft but improved versus start of the year
– Nescafé Dolce Gusto, Petcare, and Kitkat were highlights
 TOP Margin + 10 bps: positive pricing and operational efficiencies
Sales
in CHF bn
12.0 RIG % 0.1 OG % 5.2 TOP % 18.0
13 August 2015 Half-Year Results 20155
Zone EMENA
 Solid growth in all three parts of the Zone
 Western Europe
– France, Benelux, and Nordics did well
– Frozen pizza, Nescafé Dolce Gusto, and Petcare drove growth
 Eastern Europe
– Strong growth in Russia and Ukraine helped by pricing
– Solid performances in the Adriatic region, Bulgaria and Hungary
 MENA
– Middle East region solid, and Turkey strong
 TOP Margin + 80 bps: product mix improvement and lower input
costs, especially dairy
Sales
in CHF bn
7.9 RIG % 2.0 OG % 3.8 TOP % 16.2
13 August 2015 Half-Year Results 20156
 Strong results in developed markets and gradual improvement in
emerging markets overshadowed by India
 Emerging markets
– Actions underway in India to bring Maggi noodles back to market
– Process of turnaround in China on track – gradual improvement
in the course of 2015
– Central West Africa recovering quickly from challenging start to
year
 Developed markets
– Solid growth in Japan helped by innovations in Nescafé and
KitKat
– Oceania contributed positively despite challenging trading
environment
 TOP Margin -60 bps: driven by impact of India
Zone AOA
Sales
in CHF bn
7.1 RIG % -0.8 OG % 0.8 TOP % 18.2
13 August 2015 Half-Year Results 20157
 Solid broad-based growth across all geographies and brands
 Developed markets: mid single digit growth driven by North
America, the United Kingdom and several markets in Europe
 Emerging markets: double-digit growth led by Turkey, Middle East,
and Thailand
 Contribution from across the portfolio
– Nestlé Pure Life
– S. Pellegrino and Perrier
– Local brands: Poland Spring (US), Levissima (Italy), Erikli
(Turkey), Al Manhal (Saudi Arabia)
 TOP Margin +110 bps: organic growth, combined with lower input
costs and structural costs enabled re-investment in consumer-
facing marketing spend
Nestlé Waters
Sales
in CHF bn
3.8 RIG % 5.6 OG % 5.3 TOP % 11.5
13 August 2015 Half-Year Results 20158
 Broad based growth, comparatively lower than in past years
 Super premium Illuma drove growth and accelerated its
e-commerce presence and geographic expansion
 Improved performance in US, with Cereals strong and Meals &
Drinks positive, supported by innovations
 Difficult comparisons in Asia and volatile countries in Middle East
 TOP Margin +140 bps: portfolio improvement, structural costs
containment and lower input costs allowed for increased
investment in brands
Nestlé Nutrition
Sales
in CHF bn
5.3 RIG % 1.3 OG % 3.9 TOP % 23.0
13 August 2015 Half-Year Results 20159
Other Businesses
Nespresso
 Continued good growth and international expansion
 VertuoLine system in North America performed well
Nestlé Professional
 Increasing momentum with Food and Beverage solutions
 Emerging markets in Asia and Middle East continued to drive growth
Nestlé Health Science
 Good sales growth across all regions from all three business areas
 Innovations and product roll-outs supported performance
Nestlé Skin Health
 Strong broad-based growth helped by innovation
Sales
in CHF bn
6.8 RIG % 4.9 OG % 8.1 TOP % 15.8
Other Businesses TOP Margin
 -250 bps: higher coffee prices and strong Swiss Franc impacting
Nespresso, seasonality effect of Nestlé Skin Health
13 August 2015 Half-Year Results 201510
2.2
5.3 5.8 5.5
-0.7
0.8 3.5
7.3
-1.2
0.8 0.8
8.5
3.0
4.9
Products
Powdered
and Liquid
Beverages
Water Milk products
and
Ice cream
Nutrition
and
Health Science
Prepared dishes
and
cooking aids
Confectionery
% Organic Growth
% Real Internal Growth
Petcare
Sales
(in CHF bn)
9.4 3.5 7.2 7.3 6.1 3.9 5.5
TOP % 22.5 11.9 16.7 19.0 12.1 11.1 21.0
in bps -130 bps +70 bps +160 bps -160 bps -60 bps +50 bps +110 bps
13 August 2015 Half-Year Results 201511
 Trading Operating
Profit margin
+20 bps in
constant currency
 Consumer facing
marketing spend
+17.3% in
constant currency
TOP = Trading Operating Profit, CCY = Constant Currency
15.0 15.0 15.2
+10 bps
+160 bps
+10 bps
-150 bps
-20 bps
-10 bps
+20 bps
TOP H1
2014
Other revenue COGS Distribution Marketing &
Administration
R&D Net Other
Trading Income
/ Expenses
TOP H1
2015
CCY impact TOP
H1 2015
at CCY
FLAT
+20 bps
Trading Operating Profit Margin
13 August 2015 Half-Year Results 201512
Income Statement
Total Group HY 2014 HY 2015 Difference
% of sales % of sales bps
Trading operating profit 15.0 15.0 flat
Net other operating income/expenses (0.6) (0.8) -20
Operating Profit 14.4 14.2 -20
Net financial income/expenses (0.7) (0.8) -10
Profit before taxes, associates and JVs 13.7 13.4 -30
Taxes (3.8) (3.5) 30
Income from associates and JVs 1.4 1.2 -20
Profit for the year 11.3 11.1 -20
of which attributable to non-controlling interests 0.5 0.6 10
Attributable to shareholders of the parent 10.8 10.5 -30
Basic EPS (CHF) 1.45 1.43 -1.4%
Underlying EPS (CHF) 1.57 1.56 -0.6%
Underlying EPS (CHF) constant currencies +7.3%
13 August 2015 Half-Year Results 201513
in CHF bn
Free Cash Flow
2.7
2.4 2.5
-0.1
+0.2
-0.1 -0.3
FCF
HY 2014
Operational
Improvement
Working
capital
CAPEX Other FCF
HY 2015
FCF
HY 2015
at CCY
-0.3
13 August 2015 Half-Year Results 201514
Summary
• Broad based and solid Organic growth
• Improved operating performance and working capital
• Good performance in Zone EMENA, Waters, and Other
Businesses
• Continued efforts to restore momentum in Zone AOA and the US
Frozen business
• Full-Year Outlook confirmed:
We aim to achieve organic growth of around 5% with
improvements in margins and underlying earnings per
share in constant currencies, and capital efficiency.
13 August 2015 Half-Year Results 201515
2015
Half-Year
Results
Discussion
13 August 2015 Half-Year Results 201516
Appendix
13 August 2015 Half-Year Results 201517
Operating Segments
Zone
EMENA
Zone
AMS
Zone
AOA
Nestlé Waters Nestlé Nutrition Other
Businesses
% Organic Growth
% Real Internal Growth
Sales
(in CHF bn)
12.0 7.9 7.1 3.8 5.3 6.8
TOP % 18.0 16.2 18.2 11.5 23.0 15.8
in bps +10 bps +80 bps -60 bps +110 bps +140 bps -250 bps
0.1
5.2
2.0
3.8
-0.8
0.8
5.6 5.3
1.3
3.9
4.9
8.1
13 August 2015 Half-Year Results 201518
Currency Overview
Weighted average rate
HY 2014 HY 2015 % Var.
1 US Dollar USD 0.89 0.95 +6.4
1 Euro EUR 1.22 1.06 -13.5
100 Chinese Yuan Renminbi CNY 14.48 15.24 +5.3
100 Brazilian Reais BRL 38.79 31.82 -18.0
100 Mexican Pesos MXN 6.79 6.26 -7.8
1 Pound Sterling GBP 1.49 1.44 -2.9
1 Canadian Dollar CAD 0.81 0.77 -5.6
1 Russian Rouble RUB 0.03 0.02 -34.5
1 Australian Dollar AUD 0.82 0.74 -9.2
100 Philippine Pesos PHP 2.00 2.13 +6.2
100 Japanese Yen JPY 0.87 0.79 -9.2
13 August 2015 Half-Year Results 201519
FX Impact
FX Impact
HY 2015
Zone Americas -5.5%
Zone EMENA -13.0%
Zone AOA -0.5%
Nestlé Waters -0.9%
Nestlé Nutrition -3.2%
Other -7.1%
Total -5.8%
13 August 2015 Half-Year Results 201520

2015 Half-Year Results Presentation

  • 1.
    François-Xavier Roger Chief FinancialOfficer 2015 Half-Year Results
  • 2.
    This presentation containsforward looking statements which reflect Management’s current views and estimates. The forward looking statements involve certain risks and uncertainties that could cause actual results to differ materially from those contained in the forward looking statements. Potential risks and uncertainties include such factors as general economic conditions, foreign exchange fluctuations, competitive product and pricing pressures and regulatory developments. Disclaimer 13 August 2015 Half-Year Results 20151
  • 3.
    + CHF 2.5 bn (+CHF 2.4 bn reported) Free Cash Flow (in CCY) Solid performance, even under difficult circumstances Outlook confirmed Organic Growth + 4.5% (FX - 5.8%) + 20 bps (flat reported) + 7.3 % (- 0.6% reported) Trading Operating Profit (in CCY) Underlying Earnings Per Share (in CCY) CCY = Constant Currencies 13 August 2015 Half-Year Results 20152
  • 4.
    Each region includesZones, Nestlé Waters, Nestlé Nutrition, Nestlé Professional, Nespresso, NHSc, and NSH OG = Organic Growth, RIG = Real Internal Growth From Jan 1 2015, the Maghreb, the Middle East, the North East Africa region, Turkey and Israel in Zone Asia, Oceania and Africa were transferred to Zone Europe, now called EMENA Sales RIG OG (in CHF) Broad-Based Organic Growth in all Geographies AOA 11.0 bn +0.6% +2.2% AMS 18.4 bn +1.7% +6.6% EMENA 13.4 bn +2.4% +3.4% 13 August 2015 Half-Year Results 20153
  • 5.
    24.0 bn 56% +2.2% 18.8 bn 44% +7.3% Developedand Emerging Markets Growth EmergingDeveloped Sales % of Group sales OG (in CHF) OG = Organic Growth 13 August 2015 Half-Year Results 20154
  • 6.
    Zone AMS  Goodorganic growth driven by positive momentum in Latin America  North America still soft but with signs of improvement – Encouraging initial results from new products in US frozen – Coffee-mate and Häagen-Dazs continued to be highlights  Growth in Latin America despite macroeconomic environment – Good broad-based growth in Mexico – Brazil still soft but improved versus start of the year – Nescafé Dolce Gusto, Petcare, and Kitkat were highlights  TOP Margin + 10 bps: positive pricing and operational efficiencies Sales in CHF bn 12.0 RIG % 0.1 OG % 5.2 TOP % 18.0 13 August 2015 Half-Year Results 20155
  • 7.
    Zone EMENA  Solidgrowth in all three parts of the Zone  Western Europe – France, Benelux, and Nordics did well – Frozen pizza, Nescafé Dolce Gusto, and Petcare drove growth  Eastern Europe – Strong growth in Russia and Ukraine helped by pricing – Solid performances in the Adriatic region, Bulgaria and Hungary  MENA – Middle East region solid, and Turkey strong  TOP Margin + 80 bps: product mix improvement and lower input costs, especially dairy Sales in CHF bn 7.9 RIG % 2.0 OG % 3.8 TOP % 16.2 13 August 2015 Half-Year Results 20156
  • 8.
     Strong resultsin developed markets and gradual improvement in emerging markets overshadowed by India  Emerging markets – Actions underway in India to bring Maggi noodles back to market – Process of turnaround in China on track – gradual improvement in the course of 2015 – Central West Africa recovering quickly from challenging start to year  Developed markets – Solid growth in Japan helped by innovations in Nescafé and KitKat – Oceania contributed positively despite challenging trading environment  TOP Margin -60 bps: driven by impact of India Zone AOA Sales in CHF bn 7.1 RIG % -0.8 OG % 0.8 TOP % 18.2 13 August 2015 Half-Year Results 20157
  • 9.
     Solid broad-basedgrowth across all geographies and brands  Developed markets: mid single digit growth driven by North America, the United Kingdom and several markets in Europe  Emerging markets: double-digit growth led by Turkey, Middle East, and Thailand  Contribution from across the portfolio – Nestlé Pure Life – S. Pellegrino and Perrier – Local brands: Poland Spring (US), Levissima (Italy), Erikli (Turkey), Al Manhal (Saudi Arabia)  TOP Margin +110 bps: organic growth, combined with lower input costs and structural costs enabled re-investment in consumer- facing marketing spend Nestlé Waters Sales in CHF bn 3.8 RIG % 5.6 OG % 5.3 TOP % 11.5 13 August 2015 Half-Year Results 20158
  • 10.
     Broad basedgrowth, comparatively lower than in past years  Super premium Illuma drove growth and accelerated its e-commerce presence and geographic expansion  Improved performance in US, with Cereals strong and Meals & Drinks positive, supported by innovations  Difficult comparisons in Asia and volatile countries in Middle East  TOP Margin +140 bps: portfolio improvement, structural costs containment and lower input costs allowed for increased investment in brands Nestlé Nutrition Sales in CHF bn 5.3 RIG % 1.3 OG % 3.9 TOP % 23.0 13 August 2015 Half-Year Results 20159
  • 11.
    Other Businesses Nespresso  Continuedgood growth and international expansion  VertuoLine system in North America performed well Nestlé Professional  Increasing momentum with Food and Beverage solutions  Emerging markets in Asia and Middle East continued to drive growth Nestlé Health Science  Good sales growth across all regions from all three business areas  Innovations and product roll-outs supported performance Nestlé Skin Health  Strong broad-based growth helped by innovation Sales in CHF bn 6.8 RIG % 4.9 OG % 8.1 TOP % 15.8 Other Businesses TOP Margin  -250 bps: higher coffee prices and strong Swiss Franc impacting Nespresso, seasonality effect of Nestlé Skin Health 13 August 2015 Half-Year Results 201510
  • 12.
    2.2 5.3 5.8 5.5 -0.7 0.83.5 7.3 -1.2 0.8 0.8 8.5 3.0 4.9 Products Powdered and Liquid Beverages Water Milk products and Ice cream Nutrition and Health Science Prepared dishes and cooking aids Confectionery % Organic Growth % Real Internal Growth Petcare Sales (in CHF bn) 9.4 3.5 7.2 7.3 6.1 3.9 5.5 TOP % 22.5 11.9 16.7 19.0 12.1 11.1 21.0 in bps -130 bps +70 bps +160 bps -160 bps -60 bps +50 bps +110 bps 13 August 2015 Half-Year Results 201511
  • 13.
     Trading Operating Profitmargin +20 bps in constant currency  Consumer facing marketing spend +17.3% in constant currency TOP = Trading Operating Profit, CCY = Constant Currency 15.0 15.0 15.2 +10 bps +160 bps +10 bps -150 bps -20 bps -10 bps +20 bps TOP H1 2014 Other revenue COGS Distribution Marketing & Administration R&D Net Other Trading Income / Expenses TOP H1 2015 CCY impact TOP H1 2015 at CCY FLAT +20 bps Trading Operating Profit Margin 13 August 2015 Half-Year Results 201512
  • 14.
    Income Statement Total GroupHY 2014 HY 2015 Difference % of sales % of sales bps Trading operating profit 15.0 15.0 flat Net other operating income/expenses (0.6) (0.8) -20 Operating Profit 14.4 14.2 -20 Net financial income/expenses (0.7) (0.8) -10 Profit before taxes, associates and JVs 13.7 13.4 -30 Taxes (3.8) (3.5) 30 Income from associates and JVs 1.4 1.2 -20 Profit for the year 11.3 11.1 -20 of which attributable to non-controlling interests 0.5 0.6 10 Attributable to shareholders of the parent 10.8 10.5 -30 Basic EPS (CHF) 1.45 1.43 -1.4% Underlying EPS (CHF) 1.57 1.56 -0.6% Underlying EPS (CHF) constant currencies +7.3% 13 August 2015 Half-Year Results 201513
  • 15.
    in CHF bn FreeCash Flow 2.7 2.4 2.5 -0.1 +0.2 -0.1 -0.3 FCF HY 2014 Operational Improvement Working capital CAPEX Other FCF HY 2015 FCF HY 2015 at CCY -0.3 13 August 2015 Half-Year Results 201514
  • 16.
    Summary • Broad basedand solid Organic growth • Improved operating performance and working capital • Good performance in Zone EMENA, Waters, and Other Businesses • Continued efforts to restore momentum in Zone AOA and the US Frozen business • Full-Year Outlook confirmed: We aim to achieve organic growth of around 5% with improvements in margins and underlying earnings per share in constant currencies, and capital efficiency. 13 August 2015 Half-Year Results 201515
  • 17.
  • 18.
    Appendix 13 August 2015Half-Year Results 201517
  • 19.
    Operating Segments Zone EMENA Zone AMS Zone AOA Nestlé WatersNestlé Nutrition Other Businesses % Organic Growth % Real Internal Growth Sales (in CHF bn) 12.0 7.9 7.1 3.8 5.3 6.8 TOP % 18.0 16.2 18.2 11.5 23.0 15.8 in bps +10 bps +80 bps -60 bps +110 bps +140 bps -250 bps 0.1 5.2 2.0 3.8 -0.8 0.8 5.6 5.3 1.3 3.9 4.9 8.1 13 August 2015 Half-Year Results 201518
  • 20.
    Currency Overview Weighted averagerate HY 2014 HY 2015 % Var. 1 US Dollar USD 0.89 0.95 +6.4 1 Euro EUR 1.22 1.06 -13.5 100 Chinese Yuan Renminbi CNY 14.48 15.24 +5.3 100 Brazilian Reais BRL 38.79 31.82 -18.0 100 Mexican Pesos MXN 6.79 6.26 -7.8 1 Pound Sterling GBP 1.49 1.44 -2.9 1 Canadian Dollar CAD 0.81 0.77 -5.6 1 Russian Rouble RUB 0.03 0.02 -34.5 1 Australian Dollar AUD 0.82 0.74 -9.2 100 Philippine Pesos PHP 2.00 2.13 +6.2 100 Japanese Yen JPY 0.87 0.79 -9.2 13 August 2015 Half-Year Results 201519
  • 21.
    FX Impact FX Impact HY2015 Zone Americas -5.5% Zone EMENA -13.0% Zone AOA -0.5% Nestlé Waters -0.9% Nestlé Nutrition -3.2% Other -7.1% Total -5.8% 13 August 2015 Half-Year Results 201520