Download as PDF, PPTX

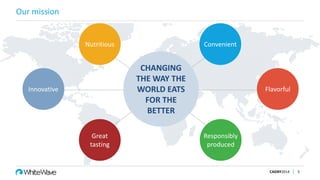
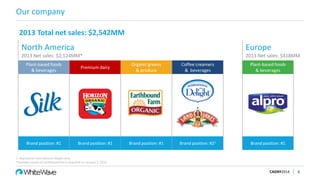
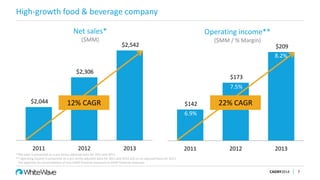
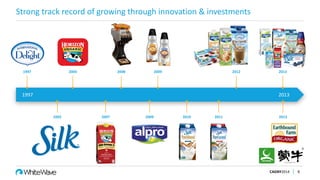
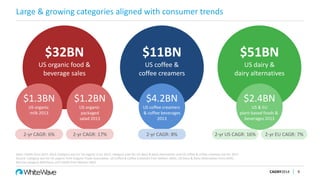
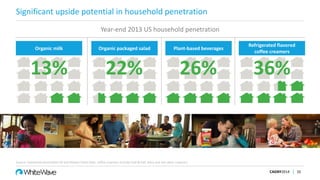
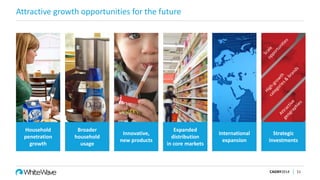
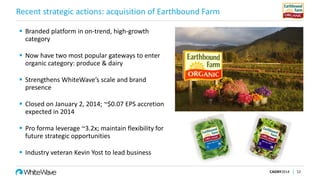
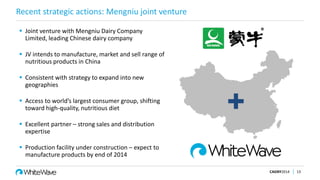


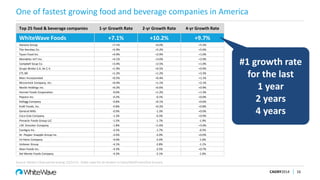
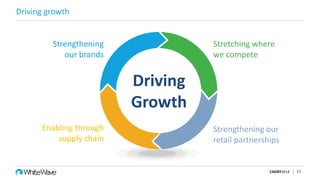

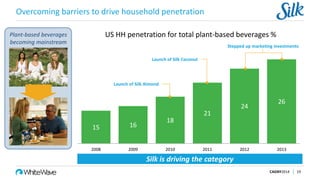


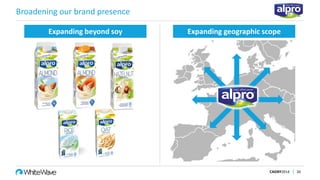
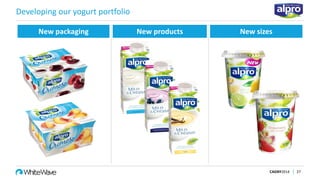


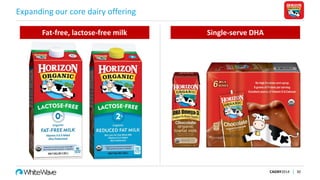
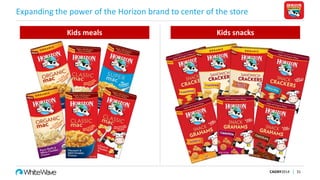


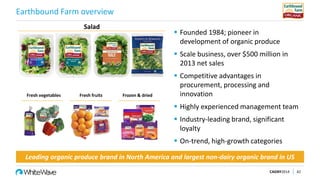
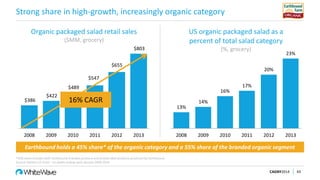
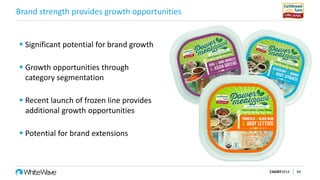
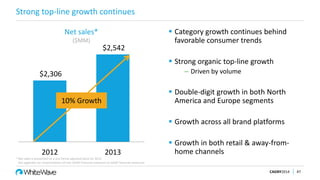
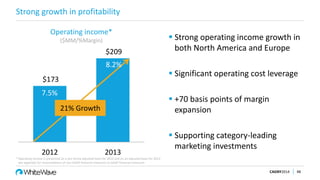
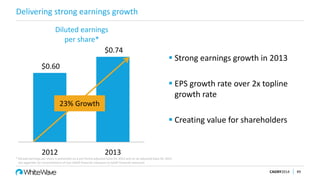
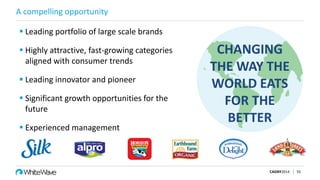


Gregg Engles, Chairman and CEO of WhiteWave Foods, presented at the CAGNY2014 conference. He discussed WhiteWave's mission of changing the way the world eats for the better through convenient, flavorful, nutritious, and responsibly produced food and beverage options. Engles provided an overview of WhiteWave's financial performance, brands, growth strategies, and recent acquisitions. He highlighted the company's focus on innovation, brand building, and expanding into new categories and geographies.


![[Mobidays]KM Report 2016年10月](https://cdn.slidesharecdn.com/ss_thumbnails/mreport10china-161006040713-thumbnail.jpg?width=640&height=640&fit=bounds)


![[mobidays] Km report7月《移动游戏市场的老千》](https://cdn.slidesharecdn.com/ss_thumbnails/km-report7-150716000528-lva1-app6892-thumbnail.jpg?width=640&height=640&fit=bounds)


![2022 Beverage Forum Non-Alcoholic Workshop[87].pdf](https://cdn.slidesharecdn.com/ss_thumbnails/2022beverageforumnon-alcoholicworkshop87-230227152104-daa6433a-thumbnail.jpg?width=640&height=640&fit=bounds)


