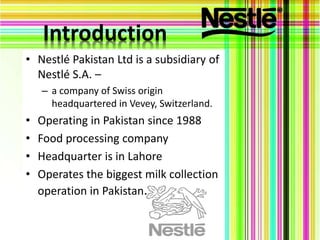
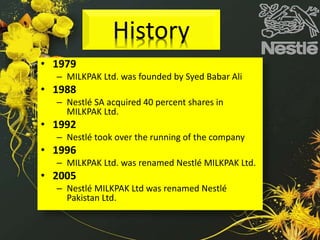
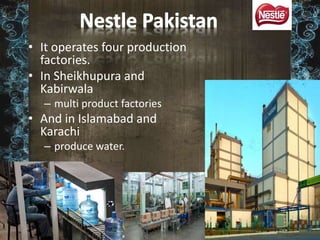
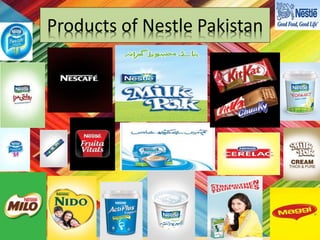
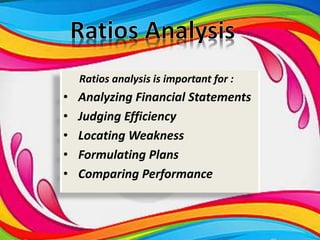
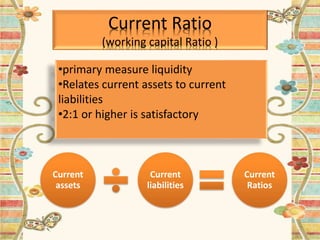
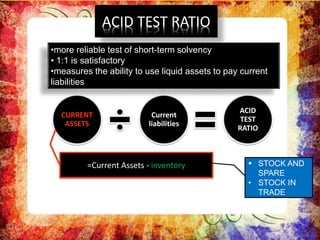
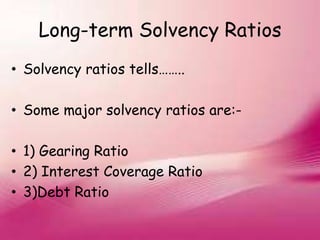
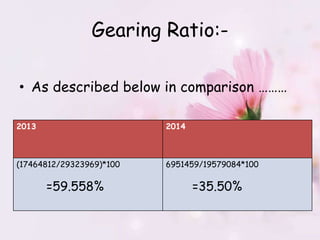
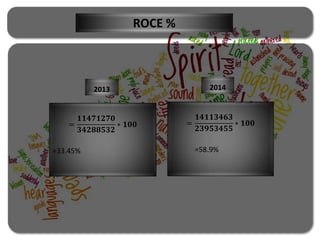
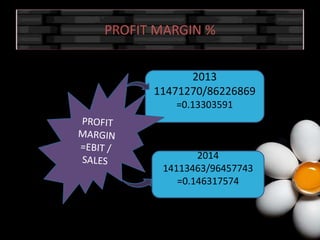
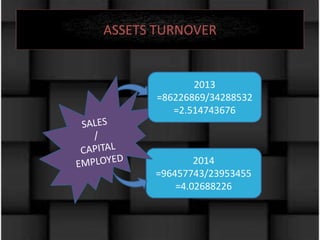
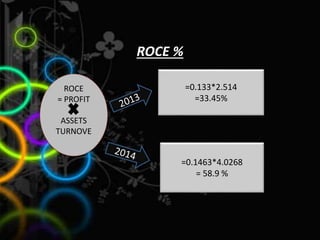
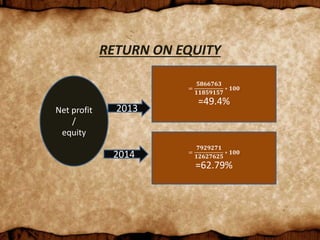
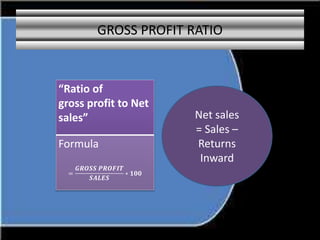
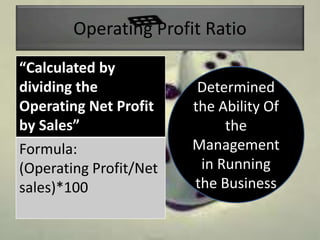
RATIO ANALYSIS OFNESTLE PAKISTAM
UVAS BUSINESS SCHOOL
PRESENTED TO
SIR SHAHID MEHMOOD
PRESENTED BY
ALI RAZA
FAIZA GULAM RASOOL
IQRA IHSAN
RAMEELA SHAFIQUE
NAILA JAMEEL
SHAHRYAR AKRAM
ATTIYA SHOUKAT
Introduction
• Nestlé Pakistan Ltd is a subsidiary of
Nestlé S.A. –
– a company of Swiss origin
headquartered in Vevey, Switzerland.
• Operating in Pakistan since 1988
• Food processing company
• Headquarter is in Lahore
• Operates the biggest milk collection
operation in Pakistan.
NESTLÉ’S FOUNDER, GERMAN-BORN PHARMACIST
HENRI NESTLÉ, LAUNCHES HIS ‘FARINE LACTÉE’
(‘FLOUR WITH MILK’) IN VEVEY, SWITZERLAND. IT
COMBINES COW’S MILK, WHEAT FLOUR AND
SUGAR, AND NESTLÉ DEVELOPS IT FOR
CONSUMPTION BY INFANTS WHO CANNOT BE
BREASTFED, TO TACKLE HIGH MORTALITY RATES.
AROUND THIS TIME HE STARTS USING THE NOW
ICONIC ‘NEST’ LOGO.
HISTORY
In
1867
History
• 1979
– MILKPAK Ltd. was founded by Syed Babar Ali
• 1988
– Nestlé SA acquired 40 percent shares in
MILKPAK Ltd.
• 1992
– Nestlé took over the running of the company
• 1996
– MILKPAK Ltd. was renamed Nestlé MILKPAK Ltd.
• 2005
– Nestlé MILKPAK Ltd was renamed Nestlé
Pakistan Ltd.
• It operates four production
factories.
• In Sheikhupura and
Kabirwala
– multi product factories
• And in Islamabad and
Karachi
– produce water.
Products of Nestle Pakistan
•
Ratios analysis is important for :
• Analyzing Financial Statements
• Judging Efficiency
• Locating Weakness
• Formulating Plans
• Comparing Performance
Current Ratio
(working capital Ratio )
Current
assets
Current
liabilities
Current
Ratios
•primary measure liquidity
•Relates current assets to current
liabilities
•2:1 or higher is satisfactory
Current Ratio
=
𝑪𝑼𝑹𝑹𝑬𝑵𝑻 𝑨𝑺𝑺𝑬𝑻𝑺
𝑪𝑼𝑹𝑹𝑬𝑵𝑻 𝑳𝑰𝑨𝑩𝑰𝑳𝑰𝑻𝑰𝑬𝑺
=
𝟏𝟖𝟒𝟎𝟓𝟕𝟖𝟎
𝟐𝟕𝟕𝟕𝟕𝟐𝟒𝟎
=0.66 : 1
=
𝑪𝑼𝑹𝑹𝑬𝑵𝑻 𝑨𝑺𝑺𝑬𝑻𝑺
𝑪𝑼𝑹𝑹𝑬𝑵𝑻 𝑳𝑰𝑨𝑩𝑰𝑳𝑰𝑻𝑰𝑬𝑺
=
𝟏𝟕𝟗𝟑𝟔𝟒𝟖𝟑
𝟏𝟖𝟎𝟎𝟎𝟗𝟖𝟗
=0.99 : 1
ACID TEST RATIO
CURRENT
ASSETS
Current
liabilities
ACID
TEST
RATIO
=Current Assets - inventory
•more reliable test of short-term solvency
• 1:1 is satisfactory
•measures the ability to use liquid assets to pay current
liabilities
 STOCK AND
SPARE
• STOCK IN
TRADE
2014
=
𝑪𝑼𝑹𝑹𝑬𝑵𝑻 𝑨𝑺𝑺𝑬𝑻𝑺 𝑳𝑬𝑺𝑺 𝑰𝑵𝑽𝑬𝑵𝑻𝑶𝑹𝒀
𝑪𝑼𝑹𝑹𝑬𝑵𝑻 𝑳𝑰𝑨𝑩𝑰𝑳𝑰𝑻𝑰𝑬𝑺
=
𝟏𝟖𝟒𝟎𝟓𝟕𝟖𝟎 − 𝟏𝟎𝟗𝟕𝟐𝟓𝟑𝟒
𝟐𝟕𝟕𝟕𝟕𝟐𝟒𝟎
= 0.26 : 1
2013
=
𝑪𝑼𝑹𝑹𝑬𝑵𝑻 𝑨𝑺𝑺𝑬𝑻𝑺 𝑳𝑬𝑺𝑺 𝑰𝑵𝑽𝑬𝑵𝑻𝑶𝑹𝒀
𝑪𝑼𝑹𝑹𝑬𝑵𝑻 𝑳𝑰𝑨𝑩𝑰𝑳𝑰𝑻𝑰𝑬𝑺
=
𝟏𝟕𝟗𝟑𝟔𝟒𝟖𝟑 − 𝟗𝟏𝟗𝟖𝟔𝟕𝟎
𝟏𝟖𝟎𝟎𝟎𝟗𝟖𝟗
=0.48 : 1
Long-term Solvency Ratios
• Solvency ratios tells……..
• Some major solvency ratios are:-
• 1) Gearing Ratio
• 2) Interest Coverage Ratio
• 3)Debt Ratio
1)Gearing Ratio:-
The gearing ratio is a general term describing
a financial ratio that compares some form of
owner's equity (or capital) to borrowed
funds.
Gearing Ratio:-
• Description……
Long
term
debt
Total
capital
Employed
GEARING
ratio
Equity + LTD
Gearing Ratio:-
• As described below in comparison ………
2013 2014
(17464812/29323969)*100
=59.558%
6951459/19579084*100
=35.50%
2) Interest coverage ratio:-
• This ratio tells us about the ability of
company to meet its interest
payments……
• If it is increasing then it is good for
business ,
• If it is decreasing then it is not good
for business
Interest coverage ratio:--
PBFC & TAX
FINANCIAL
CHARGES
Interest
coverage ratio
Interest coverage ratio:-
• Comparison over 2 years:-
2013: 2014:
11471270/2113096 =
5.4286 TIMES
14113463/2155637 =
6.547 TIMES
3) DEBT Ratio:-
• Debt ratio measures a firm’s total
liabilities as a percentage of its total
assets.
• The higher percentage indicates more
leverage and more risk.
DEBT Ratio:-
TOTAL LIABILITIES
Total ASSETS
DEBT Ratio:-
• Comparison over 2 years:-
2013: 2014:
(40430364/52289521 )*100=
77.3%
(39103070/52289521)*100=
75.58%
EFFICIENCY
The comparison of what is actually PRODUCED or
performed with what can be achieved with the
same CONSUMPTION of RESOURCES (MONEY,
time, LABOUR etc.). IT is an important FACTOR in
determination of PRODUCTIVITY.
“Measures the Efficiency of the Business”
TRADE RECEIVABLE COLLECTION PERIOD.
TRADE PAYABLE PAYMENT PERIOD.
INVENTORY PERIOD.
TRADE RECEIVABLE COLLECTION PERIOD
TRADE
RECEIVABLES
2013
=
𝟑𝟐𝟖𝟏𝟏𝟎
𝟖𝟔𝟐𝟐𝟔𝟖𝟔𝟗
∗ 𝟑𝟔𝟓
=1.38 days
2014
=
𝟐𝟕𝟐𝟑𝟐𝟏
𝟗𝟔𝟒𝟓𝟕𝟕𝟒𝟑
∗ 𝟑𝟔𝟓
= 1.03 days
365 (DAYS)
SALES
(CREDIT)
TRADE PAYABLES PAYMENT PERIOD
The trade payables payment period
ratio represents the time lag between a credit
purchase and making payment to the supplier.
As trade payables relate to credit purchases so
credit purchases figure should be used in
calculating this ratio. However as the amount
of credit purchase is usually not separately
available in the income statement so in that
case total purchases could be used.
=
𝑻𝑹𝑨𝑫𝑬 𝑷𝑨𝒀𝑨𝑩𝑳𝑬
𝑪𝑶𝑺𝑻 𝑶𝑭 𝑺𝑨𝑳𝑬𝑺
∗ 𝟑𝟔𝟓 𝑫𝑨𝒀𝑺
TRADE PAYABLE PAYMENT PERIOD
2013 2014
=
𝟗𝟑𝟔𝟔𝟖𝟎𝟓
𝟔𝟐𝟎𝟔𝟔𝟎𝟕𝟐
∗ 𝟑𝟔𝟓
= 55 days
2014
=
𝟏𝟒𝟑𝟔𝟏𝟗𝟏𝟑
𝟔𝟗𝟏𝟑𝟑𝟕𝟓𝟑
∗ 𝟑𝟔𝟓
= 75 days
INVENTORY PERIOD
In accounting, inventory period is a
measure of the average number of
days inventory is held, calculated by
dividing the inventory by the average
daily cost of goods sold. It is also called
days in inventory.
=
𝑰𝑵𝑽𝑬𝑵𝑻𝑶𝑹𝒀
𝑪𝑶𝑺𝑻 𝑶𝑭 𝑺𝑨𝑳𝑬𝑺
∗ 𝟑𝟔𝟓 𝑫𝑨𝒀𝑺
Inventory Conversion Period
INVENTORY COST OF
SALES
2013
=
𝟕𝟗𝟐𝟓𝟏𝟑𝟐
𝟔𝟐𝟎𝟔𝟔𝟎𝟕𝟐
∗ 𝟑𝟔𝟓
= 46 days
2014
=
𝟗𝟕𝟔𝟑𝟗𝟖𝟕
𝟔𝟗𝟏𝟑𝟑𝟕𝟓𝟑
∗ 𝟑𝟔𝟓
= 51days
365
INVESTMENT RATIOS
• DIVIDEND YIELD (%)
• DIVIDEND PAYOUT(%)
• EARNING PER SHARE
• PRICE / EARNING RATIO
• TOTAL SHARE HOLDER RETURN
DIVIDEND YIELD (%)
ANNUAL
DIVIDEND
PAID PER
SHARE
MARKET
PRICE PER
SHARE
DIVIDEND
YIELD
The dividend yield is a financial ratio that
measures the amount of cash dividends
distributed to common shareholders relative to
the market value per share.
DIVIDEND PAYMENT F
TOTAL NUMBER OF
SHARE OUTSTANDING
CALCULATION
2014
78/1700
=0.111*100
=11.1%
2013
=75/1700
=0.0441*100
=4.41%
DIVIDEND PAYOUT (%)
TOTAL
DIVIDEND
PAID
PROFIT
AFTER TAX &
PRFERENCE
DIVEDEND
DIVIDEND
PAYOUT
The dividend payout ratio measures the
percentage of net income that is distributed to
shareholders in the form of dividends during the
year.
CALCULATION
TOTAL
DIVIDEND
PAID
PROFIT AFTER
TAX &
PRFERENCE
DIVEDEND
2014
=
𝟕𝟎𝟑𝟐𝟓𝟖𝟏
𝟕𝟗𝟐𝟗𝟐𝟕𝟏
=0.89
=89%
2013
=
𝟓𝟒𝟑𝟗𝟕𝟖𝟗
𝟓𝟖𝟔𝟔𝟕𝟔𝟑
= 0 .92
=92%
EARNING PER SHARE
Definition:
“This ratio tells us
about earning on “1”
share”.
EARNING PER SHARE
=5866763000 / 45349584
= 129.36
=7929271000 / 45349584
= 174.8
=Profit
after tax /
no. of
share
outstandi
ng
Definition of 'Price / Earnings Ratio - P/E
Ratio'
A valuation ratio of a
company's current share
price compared to its
per-share earnings.
PRICE EARNING RATIO
=Market
price per
share
earning
per
share
=1700/127.36
=13.34 TIMES
=1700/174.8
=9.7 TIMES
TOTAL SHARE HOLDER RETURN
• The internal rate of return of all cash flows to
an investor during the holding period of an
investment.
•
𝑪𝑨𝑷𝑰𝑻𝑨𝑳 𝑮𝑨𝑰𝑵 𝑶𝑹 𝑳𝑶𝑺𝑺 𝑰𝑵 𝑷𝑬𝑹𝑰𝑶𝑫+𝑫𝑰𝑽𝑰𝑫𝑬𝑵𝑫
𝑺𝑯𝑨𝑹𝑬 𝑷𝑹𝑰𝑪𝑬 𝑨𝑻 𝑩𝑬𝑮𝑰𝑵𝑰𝑵𝑮 𝑶𝑭 𝑷𝑬𝑹𝑰𝑶𝑫
TOTAL SHAREHOLDER RETURN
• Comparison over 2 years:-
2013: 2014:
=5439789+249527/10
= 5464741
=7032581+249527/10
=7057533.7
Return on total capital employed (ROCE) %
A ratio that indicates the efficiency and
profitability of a company's capital
investments.
=
𝑷𝑹𝑶𝑭𝑰𝑻 𝑩𝑬𝑭𝑶𝑹𝑬 𝑭𝑰𝑵𝑨𝑵𝑪𝑬 & 𝑇𝐴𝑋
𝑻𝑶𝑻𝑨𝑳 𝑪𝑨𝑷𝑰𝑻𝑨𝑳 𝑬𝑴𝑷𝑳𝑶𝒀𝑬𝑫
∗ 𝟏𝟎𝟎
Ways to calculate
=
𝑷𝑹𝑶𝑭𝑰𝑻 𝑩𝑬𝑭𝑶𝑹𝑬 𝑭𝑰𝑵𝑨𝑵𝑪𝑬 & 𝑇𝐴𝑋
𝑻𝑶𝑻𝑨𝑳 𝑪𝑨𝑷𝑰𝑻𝑨𝑳 𝑬𝑴𝑷𝑳𝑶𝒀𝑬𝑫
∗ 𝟏𝟎𝟎
OR
= 𝑷𝑹𝑶𝑭𝑰𝑻 𝑴𝑨𝑹𝑮𝑰𝑵 ∗ 𝑨𝑺𝑺𝑬𝑻𝑺 𝑻𝑼𝑹𝑵 𝑶𝑽𝑬𝑹
PROFIT MARGIN
=
𝑷𝑹𝑶𝑭𝑰𝑻 𝑩𝑬𝑭𝑶𝑹𝑬 𝑭𝑰𝑵𝑨𝑵𝑪𝑬 & 𝑻𝑨𝑿
𝑺𝑨𝑳𝑬𝑺
ASSETS TURN OVER
=
𝑹𝑬𝑽𝑬𝑵𝑼𝑬
𝑻𝑶𝑻𝑨𝑳 𝑪𝑨𝑷𝑰𝑻𝑨𝑳 𝑬𝑴𝑷𝑳𝑶𝒀𝑬𝑫
Capital employed
EQUITY
+
LONG TERM
DEBTS OF
COMPANY
=11859157+22429375
=34288532
=11325830+12627625
=23953455
ROCE %
2014
=
𝟏𝟒𝟏𝟏𝟑𝟒𝟔𝟑
𝟐𝟑𝟗𝟓𝟑𝟒𝟓𝟓
∗ 𝟏𝟎𝟎
=58.9%
2013
=
𝟏𝟏𝟒𝟕𝟏𝟐𝟕𝟎
𝟑𝟒𝟐𝟖𝟖𝟓𝟑𝟐
∗ 𝟏𝟎𝟎
=33.45%
ROCE
Profit margin
= EBIT / SLAES
Assets turn over
=sales / capital
employed
ROCE
= profit
assets turn
over
PROFIT MARGIN %
2013
11471270/86226869
=0.13303591
2014
14113463/96457743
=0.146317574
ASSETS TURNOVER
2014
=96457743/23953455
=4.02688226
2013
=86226869/34288532
=2.514743676
ROCE %
ROCE
= PROFIT
ASSETS
TURNOVE
=0.133*2.514
=33.45%
=0.1463*4.0268
= 58.9 %
Return On Equity
“Desired to work out the
profitability of the company”
Formula:
=
𝑷𝑹𝑶𝑭𝑰𝑻 𝑨𝑭𝑻𝑬𝑹 𝑭𝑰𝑵𝑨𝑵𝑪𝑬 𝑪𝑯𝑨𝑹𝑮𝑬𝑺 & 𝑻𝑨𝑿
𝑬𝑸𝑼𝑰𝑻𝒀
∗ 𝟏𝟎𝟎
RETURN ON EQUITY
Net profit
/
equity
=
𝟓𝟖𝟔𝟔𝟕𝟔𝟑
𝟏𝟏𝟖𝟓𝟗𝟏𝟓𝟕
∗ 𝟏𝟎𝟎
=49.4%
2013
2014 =
𝟕𝟗𝟐𝟗𝟐𝟕𝟏
𝟏𝟐𝟔𝟐𝟕𝟔𝟐𝟓
∗ 𝟏𝟎𝟎
=62.79%
GROSS PROFIT RATIO
“Ratio of
gross profit to Net
sales”
Formula
=
𝑮𝑹𝑶𝑺𝑺 𝑷𝑹𝑶𝑭𝑰𝑻
𝑺𝑨𝑳𝑬𝑺
∗ 𝟏𝟎𝟎
Net sales
= Sales –
Returns
Inward
Gross profit margin %
2014
=
𝟐𝟕𝟑𝟐𝟑𝟗𝟗𝟎
𝟗𝟔𝟒𝟓𝟕𝟕𝟒𝟑
∗ 𝟏𝟎𝟎
=62.79%
2013
=
𝟐𝟒𝟏𝟔𝟎𝟕𝟗𝟕
𝟖𝟔𝟐𝟐𝟔𝟖𝟔𝟗
∗ 𝟏𝟎𝟎
=49.4%
Operating expense %
100sales
Operating
expense
Operating
expense
ratio
Operating expense
=
𝟏𝟑𝟐𝟏𝟎𝟓𝟐𝟕
𝟗𝟔𝟒𝟓𝟕𝟕𝟒𝟑
∗ 𝟏𝟎𝟎
=13.69%
=
𝟏𝟐𝟔𝟖𝟗𝟓𝟐𝟕
𝟖𝟔𝟐𝟐𝟔𝟖𝟔𝟗
∗ 𝟏𝟎𝟎
=14.71%
Operating Profit Ratio
“Calculated by
dividing the
Operating Net Profit
by Sales”
Formula:
(Operating Profit/Net
sales)*100
Determined
the Ability Of
the
Management
in Running
the Business
Operating Profit Ratio
2013
=11471270/86226869*100
=13%
2014
14113463/96457743
=14%
CONCLUSION
The company performance not bad
and still nestle is the market leader in
Pakistan . But the company have
more chance to increase its growth
and market share.
So we can say company performance
is satisfactory.
Nestle financial report analysis 2013 & 2014

Nestle financial report analysis 2013 & 2014