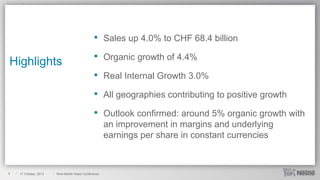
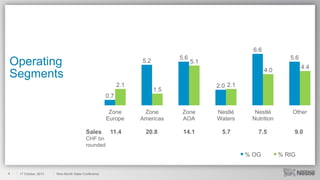
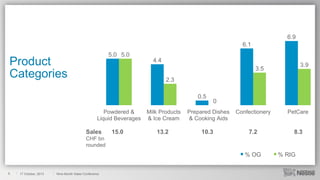
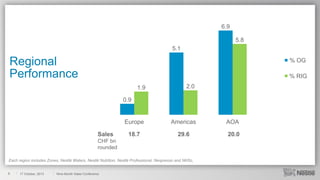
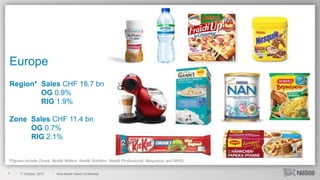
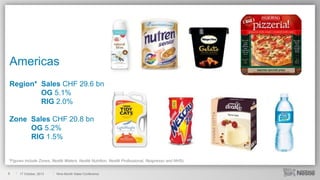
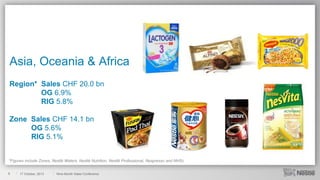
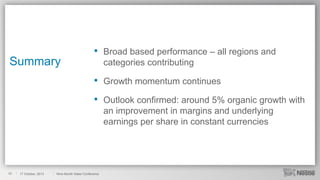
Nine-Month Sales
Conference
Wan Ling Martello
Chief Financial Officer
Disclaimer

2

17 October, 2013

This presentation contains forward looking
statements which reflect Management’s current
views and estimates. The forward looking
statements involve certain risks and
uncertainties that could cause actual results to
differ materially from those contained in the
forward looking statements. Potential risks and
uncertainties include such factors as general
economic conditions, foreign exchange
fluctuations, competitive product and pricing
pressures and regulatory developments.

Nine-Month Sales Conference
•

Real Internal Growth 3.0%

All geographies contributing to positive growth

•

17 October, 2013

Organic growth of 4.4%

•

3

•
•

Highlights

Sales up 4.0% to CHF 68.4 billion

Outlook confirmed: around 5% organic growth with
an improvement in margins and underlying
earnings per share in constant currencies

Nine-Month Sales Conference
6.6

Operating
Segments

5.6

5.2

5.6

5.1

4.4

4.0
2.1

2.0 2.1

1.5

0.7
Zone
Europe

Sales

Zone
Americas

Zone
AOA

Nestlé
Waters

Nestlé
Nutrition

Other

11.4

20.8

14.1

5.7

7.5

9.0

CHF bn
rounded

% OG
4

17 October, 2013

Nine-Month Sales Conference

% RIG
6.9
6.1
5.0 5.0

Product
Categories

4.4

3.9

3.5
2.3

0.5
Powdered &
Liquid Beverages

Sales

15.0

0

Milk Products
& Ice Cream

Prepared Dishes
& Cooking Aids

Confectionery

PetCare

13.2

10.3

7.2

8.3

CHF bn
rounded

% OG
5

17 October, 2013

Nine-Month Sales Conference

% RIG
6.9
5.8
5.1

Regional
Performance

% OG
% RIG
1.9

2.0

Europe

Americas

AOA

18.7

29.6

20.0

0.9

Sales
CHF bn
rounded

Each region includes Zones, Nestlé Waters, Nestlé Nutrition, Nestlé Professional, Nespresso and NHSc,
6

17 October, 2013

Nine-Month Sales Conference
Europe
Region* Sales CHF 18.7 bn
OG 0.9%
RIG 1.9%
Zone Sales CHF 11.4 bn
OG 0.7%
RIG 2.1%

*Figures include Zones, Nestlé Waters, Nestlé Nutrition, Nestlé Professional, Nespresso and NHSc
7

17 October, 2013

Nine-Month Sales Conference
Americas
Region* Sales CHF 29.6 bn
OG 5.1%
RIG 2.0%
Zone Sales CHF 20.8 bn
OG 5.2%
RIG 1.5%

*Figures include Zones, Nestlé Waters, Nestlé Nutrition, Nestlé Professional, Nespresso and NHSc
8

17 October, 2013

Nine-Month Sales Conference
Asia, Oceania & Africa
Region* Sales CHF 20.0 bn
OG 6.9%
RIG 5.8%
Zone Sales CHF 14.1 bn
OG 5.6%
RIG 5.1%

*Figures include Zones, Nestlé Waters, Nestlé Nutrition, Nestlé Professional, Nespresso and NHSc
9

17 October, 2013

Nine-Month Sales Conference
17 October, 2013

Growth momentum continues

•

10

Broad based performance – all regions and
categories contributing

•

Summary

•

Outlook confirmed: around 5% organic growth with
an improvement in margins and underlying
earnings per share in constant currencies

Nine-Month Sales Conference
Appendix

11

17 October, 2013

Nine-Month Sales Conference
CHF per

Nine-Month Sales Conference

0.94

-0.5

Euro (1)

1.20

1.23

+2.3

£ Sterling (1)

1.48

1.45

-2.6

49.06

44.29

-9.7

7.11

7.38

+3.8

Yen (100)

17 October, 2013

0.94

Mex. Peso (100)

12

(%)*

Real (100)

* % rounded

9m 2013

US Dollar (1)

Weighted
Average
Exchange Rates

9m 2012

1.18

0.97

-18.1
(%)

-2.6

-2.4

-4.4

Zone Europe

+1.2

+1.3

+0.9

Zone AOA

-1.0

-1.4

-3.7

-1.9

-1.8

-3.9

Nestlé Waters

+0.9

+0.8

-0.4

Other

+0.2

+0.3

-1.0

Total

17 October, 2013

9m 2013

Nestlé Nutrition

13

HY 2013

Zone Americas

FX Impact on
All Businesses

1Q 2013

-0.9

-0.9

-2.5

Nine-Month Sales Conference

Nestlé 2013 9-Month sales conference slides, CFO presentation