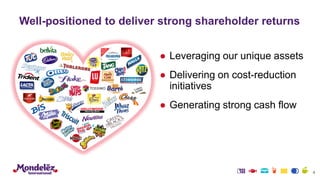
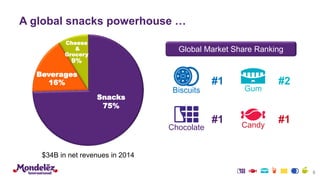
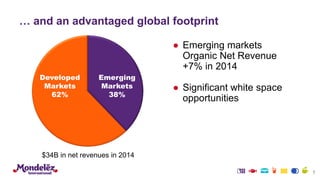
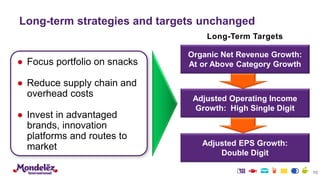
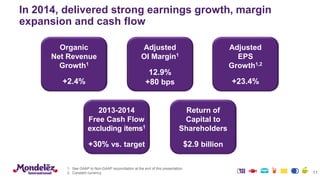
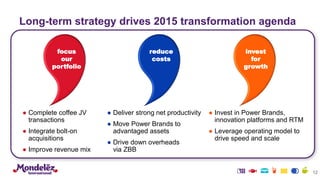
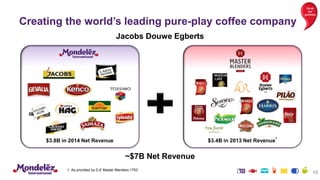
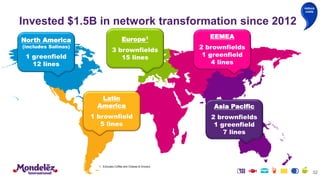
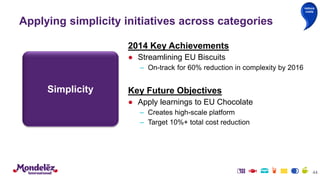
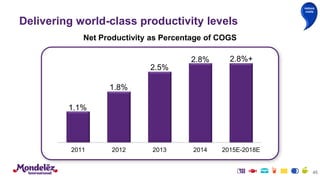
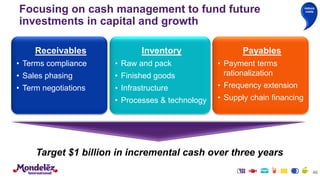
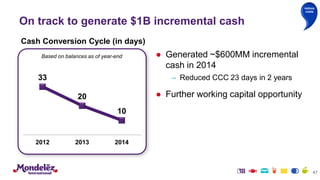
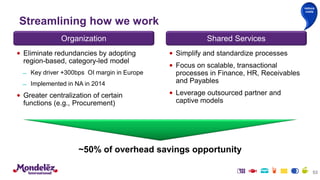
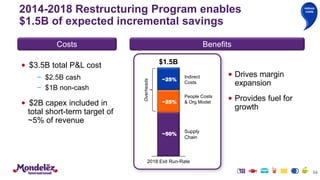
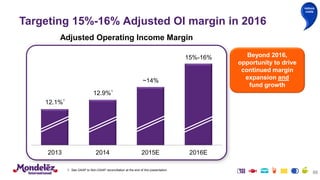
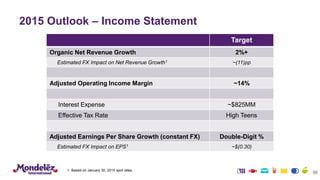
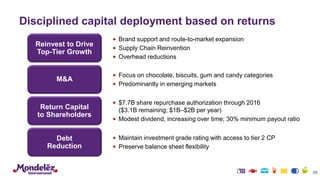
Mondelēz International is focused on delivering strong shareholder returns through leveraging unique assets, cost reduction initiatives, and generating strong cash flow. The company is a global snacks powerhouse with leading brands in biscuits, chocolate, gum, and candy. It has an advantaged global footprint, with emerging markets representing 38% of revenues. Mondelēz will continue to focus on snacks, reduce supply chain and overhead costs, and invest in brands, innovation, and routes to market.
Ducati has built its brand image as the sports bike manufacturer. Ducati has captured a huge portion of the market in all four categories of the sports bike. They concentrate on dominating a niche Performance-driven motorcycles, lighter frame, forward-leaning eat position, significant handling capabilities, on the other hand, luxury of comfort is sacrificed. However, in the current business situation, Ducati is facing a high competition from its rival bike manufacturers in heavy and cursing bike categories. Customer’s perception regarding repeat acquiring a bike from the same manufacturer has changed since 2000. “Exhibit 16” shows that customers of Harley-Davidson and BMW are more interested in buying bikes from them repeatedly, which is increasing the competition for Ducati to retain its current customers. Ducati is showing a steady growth and profits in its relevant market, but it is not enough to sustain in the industry for a longer period. Hence, the main issues are potential stagnant growth for the company. Should Ducati enter the cruiser market? Will entering the cruiser segment, and broadening Ducati's traditional niche, help them sustain the profitable growth of the organization?
Dear connections,
this is a very interesting report of Marks and Spencer financial progress during 2013-15, elaborated by myself and two more peers (Alhassane Diallo and Zahoro Msallam) and I have taken the freedom (with their permission) to share it with you all.
I invite everyone (regardless of your background) to give a read, leave comments, questions and messages.
Strategic Case Analysis of Domino's PizzaAtacan Garip
In this paper, Company Information, Corporate Governance, Internal-External Environment, Strategic Factor's Analysis and Strategy Formulation for Domino's Pizza are available.
The project describes the sales and distribution network adopted by coca cola beverages in india. It mentions the problems which are faced by the company.
STARBUCKS: DELIVERING CUSTOMER EXPERIENCE.
This report consists of various analysis frameworks / models used to analyse the customer experience at Starbucks.
Report on supply chain management of coca cola.Rizwan Khan
A supply chain is a network of manufacturers, suppliers, di
stributors, transporters, storage facilities & retailers that perform functions like procurement & acquisition of material, processing &transformation of the material into intermediate & finished tangible goods, & finally, the physical
distribution of the finished goods to intermediate or final customers.
The Coca-Cola Company is the world's largest beverage company, largest manufacturer, distributor and marketer of non-alcoholic beverage concentrates and syrups in the world and is one of the largest corporations in the United States. The company is best known for its flagship product Coca-Cola, invented by pharmacist John Stith Pemberton in 1886. The Coca-Cola formula and brand was bought in 1889 by Asa Candler who incorporated The Coca-Cola Company in 1892. Besides its namesake Coca-Cola beverage, Coca-Cola currently offers nearly 400 brands in over 200 countries or territories and serves 1.5 billion servings each day.
Coca-Cola is a carbonated soft drink sold in stores, restaurants and vending machines internationally
The company operates a franchised distribution system dating from 1889 where The Coca-Cola Company only produces syrup concentrate which is then sold to various bottlers throughout the world who hold an exclusive territory.
The Coca-Cola Company is headquartered in Atlanta, Georgia. Its stock is listed on the NYSE and is part of DJIA and S&P 500. Its current president and CEO is Muhtar Kent
MBA Final project on Carrefore store chain which they had entered into Pakistan Markets in developing cities
This project has following objectives: To meet the specific needs of customers and offering these products at competitive, reasonable prices that will still yield profits. To Increase Customer Loyalty and brand image. To understand the customer need and make a connection between customer and Carrefour with direct marketing.
Mondelez State of Snacking and Future Trends 2023Neil Kimberley
Presentation from Mondelez on the demographics of Snacking and the global trends impacting the growth of snacking around the world. Rich in graphics and data, its a trove of useful information about snacks, snackers and snacking.
2024 Numerator Consumer Study of Cannabis UsageNeil Kimberley
Numerator is a unique quantative research company that creates consumer behavior insights from retail purchases. This study explores the consumer behavior of consumers who purchase Cannabis and CBD in the USA.
Trian White Paper on Creating Value at Disney April 2024Neil Kimberley
Nelson Peltz owns and operates Trian Capital. Trian's strategy is to identify underperforming public companies, then intervene as an activist investor to enact aggressive value creating strategies. This white paper outlines an approach for DIS (Disney, who owns TV Stations, film studios and theme parks to change strategy and create more value for their shareholders. Peltz has a past in many CPG businesses like Snapple, Kraft Heinz and Wendy's...
Kraft Heinz Presentation at the 2024 CAGNY.pdfNeil Kimberley
Senior management of Kraft Heinz presents to the Consumer Analyst Group of New York in February 2024. This presentations are also available at the Krafyt Heinz website, along with a webcast of the commentary.
Miller Coors Presentation at CAGNY Feb 2024Neil Kimberley
Presentation by Miller Coors Senior Management at the Feb 2024 Consumer Analyst Group of New York, Feb 2024. Over of strategy for Miller Coors to become a total beverage company.
3.0 Project 2_ Developing My Brand Identity Kit.pptxtanyjahb
A personal brand exploration presentation summarizes an individual's unique qualities and goals, covering strengths, values, passions, and target audience. It helps individuals understand what makes them stand out, their desired image, and how they aim to achieve it.
Premium MEAN Stack Development Solutions for Modern BusinessesSynapseIndia
Stay ahead of the curve with our premium MEAN Stack Development Solutions. Our expert developers utilize MongoDB, Express.js, AngularJS, and Node.js to create modern and responsive web applications. Trust us for cutting-edge solutions that drive your business growth and success.
Know more: https://www.synapseindia.com/technology/mean-stack-development-company.html
"𝑩𝑬𝑮𝑼𝑵 𝑾𝑰𝑻𝑯 𝑻𝑱 𝑰𝑺 𝑯𝑨𝑳𝑭 𝑫𝑶𝑵𝑬"
𝐓𝐉 𝐂𝐨𝐦𝐬 (𝐓𝐉 𝐂𝐨𝐦𝐦𝐮𝐧𝐢𝐜𝐚𝐭𝐢𝐨𝐧𝐬) is a professional event agency that includes experts in the event-organizing market in Vietnam, Korea, and ASEAN countries. We provide unlimited types of events from Music concerts, Fan meetings, and Culture festivals to Corporate events, Internal company events, Golf tournaments, MICE events, and Exhibitions.
𝐓𝐉 𝐂𝐨𝐦𝐬 provides unlimited package services including such as Event organizing, Event planning, Event production, Manpower, PR marketing, Design 2D/3D, VIP protocols, Interpreter agency, etc.
Sports events - Golf competitions/billiards competitions/company sports events: dynamic and challenging
⭐ 𝐅𝐞𝐚𝐭𝐮𝐫𝐞𝐝 𝐩𝐫𝐨𝐣𝐞𝐜𝐭𝐬:
➢ 2024 BAEKHYUN [Lonsdaleite] IN HO CHI MINH
➢ SUPER JUNIOR-L.S.S. THE SHOW : Th3ee Guys in HO CHI MINH
➢FreenBecky 1st Fan Meeting in Vietnam
➢CHILDREN ART EXHIBITION 2024: BEYOND BARRIERS
➢ WOW K-Music Festival 2023
➢ Winner [CROSS] Tour in HCM
➢ Super Show 9 in HCM with Super Junior
➢ HCMC - Gyeongsangbuk-do Culture and Tourism Festival
➢ Korean Vietnam Partnership - Fair with LG
➢ Korean President visits Samsung Electronics R&D Center
➢ Vietnam Food Expo with Lotte Wellfood
"𝐄𝐯𝐞𝐫𝐲 𝐞𝐯𝐞𝐧𝐭 𝐢𝐬 𝐚 𝐬𝐭𝐨𝐫𝐲, 𝐚 𝐬𝐩𝐞𝐜𝐢𝐚𝐥 𝐣𝐨𝐮𝐫𝐧𝐞𝐲. 𝐖𝐞 𝐚𝐥𝐰𝐚𝐲𝐬 𝐛𝐞𝐥𝐢𝐞𝐯𝐞 𝐭𝐡𝐚𝐭 𝐬𝐡𝐨𝐫𝐭𝐥𝐲 𝐲𝐨𝐮 𝐰𝐢𝐥𝐥 𝐛𝐞 𝐚 𝐩𝐚𝐫𝐭 𝐨𝐟 𝐨𝐮𝐫 𝐬𝐭𝐨𝐫𝐢𝐞𝐬."
Cracking the Workplace Discipline Code Main.pptxWorkforce Group
Cultivating and maintaining discipline within teams is a critical differentiator for successful organisations.
Forward-thinking leaders and business managers understand the impact that discipline has on organisational success. A disciplined workforce operates with clarity, focus, and a shared understanding of expectations, ultimately driving better results, optimising productivity, and facilitating seamless collaboration.
Although discipline is not a one-size-fits-all approach, it can help create a work environment that encourages personal growth and accountability rather than solely relying on punitive measures.
In this deck, you will learn the significance of workplace discipline for organisational success. You’ll also learn
• Four (4) workplace discipline methods you should consider
• The best and most practical approach to implementing workplace discipline.
• Three (3) key tips to maintain a disciplined workplace.
Business Valuation Principles for EntrepreneursBen Wann
This insightful presentation is designed to equip entrepreneurs with the essential knowledge and tools needed to accurately value their businesses. Understanding business valuation is crucial for making informed decisions, whether you're seeking investment, planning to sell, or simply want to gauge your company's worth.
Affordable Stationery Printing Services in Jaipur | Navpack n PrintNavpack & Print
Looking for professional printing services in Jaipur? Navpack n Print offers high-quality and affordable stationery printing for all your business needs. Stand out with custom stationery designs and fast turnaround times. Contact us today for a quote!
Personal Brand Statement:
As an Army veteran dedicated to lifelong learning, I bring a disciplined, strategic mindset to my pursuits. I am constantly expanding my knowledge to innovate and lead effectively. My journey is driven by a commitment to excellence, and to make a meaningful impact in the world.
India Orthopedic Devices Market: Unlocking Growth Secrets, Trends and Develop...Kumar Satyam
According to TechSci Research report, “India Orthopedic Devices Market -Industry Size, Share, Trends, Competition Forecast & Opportunities, 2030”, the India Orthopedic Devices Market stood at USD 1,280.54 Million in 2024 and is anticipated to grow with a CAGR of 7.84% in the forecast period, 2026-2030F. The India Orthopedic Devices Market is being driven by several factors. The most prominent ones include an increase in the elderly population, who are more prone to orthopedic conditions such as osteoporosis and arthritis. Moreover, the rise in sports injuries and road accidents are also contributing to the demand for orthopedic devices. Advances in technology and the introduction of innovative implants and prosthetics have further propelled the market growth. Additionally, government initiatives aimed at improving healthcare infrastructure and the increasing prevalence of lifestyle diseases have led to an upward trend in orthopedic surgeries, thereby fueling the market demand for these devices.
The world of search engine optimization (SEO) is buzzing with discussions after Google confirmed that around 2,500 leaked internal documents related to its Search feature are indeed authentic. The revelation has sparked significant concerns within the SEO community. The leaked documents were initially reported by SEO experts Rand Fishkin and Mike King, igniting widespread analysis and discourse. For More Info:- https://news.arihantwebtech.com/search-disrupted-googles-leaked-documents-rock-the-seo-world/
Memorandum Of Association Constitution of Company.pptseri bangash
www.seribangash.com
A Memorandum of Association (MOA) is a legal document that outlines the fundamental principles and objectives upon which a company operates. It serves as the company's charter or constitution and defines the scope of its activities. Here's a detailed note on the MOA:
Contents of Memorandum of Association:
Name Clause: This clause states the name of the company, which should end with words like "Limited" or "Ltd." for a public limited company and "Private Limited" or "Pvt. Ltd." for a private limited company.
https://seribangash.com/article-of-association-is-legal-doc-of-company/
Registered Office Clause: It specifies the location where the company's registered office is situated. This office is where all official communications and notices are sent.
Objective Clause: This clause delineates the main objectives for which the company is formed. It's important to define these objectives clearly, as the company cannot undertake activities beyond those mentioned in this clause.
www.seribangash.com
Liability Clause: It outlines the extent of liability of the company's members. In the case of companies limited by shares, the liability of members is limited to the amount unpaid on their shares. For companies limited by guarantee, members' liability is limited to the amount they undertake to contribute if the company is wound up.
https://seribangash.com/promotors-is-person-conceived-formation-company/
Capital Clause: This clause specifies the authorized capital of the company, i.e., the maximum amount of share capital the company is authorized to issue. It also mentions the division of this capital into shares and their respective nominal value.
Association Clause: It simply states that the subscribers wish to form a company and agree to become members of it, in accordance with the terms of the MOA.
Importance of Memorandum of Association:
Legal Requirement: The MOA is a legal requirement for the formation of a company. It must be filed with the Registrar of Companies during the incorporation process.
Constitutional Document: It serves as the company's constitutional document, defining its scope, powers, and limitations.
Protection of Members: It protects the interests of the company's members by clearly defining the objectives and limiting their liability.
External Communication: It provides clarity to external parties, such as investors, creditors, and regulatory authorities, regarding the company's objectives and powers.
https://seribangash.com/difference-public-and-private-company-law/
Binding Authority: The company and its members are bound by the provisions of the MOA. Any action taken beyond its scope may be considered ultra vires (beyond the powers) of the company and therefore void.
Amendment of MOA:
While the MOA lays down the company's fundamental principles, it is not entirely immutable. It can be amended, but only under specific circumstances and in compliance with legal procedures. Amendments typically require shareholder
Attending a job Interview for B1 and B2 Englsih learnersErika906060
It is a sample of an interview for a business english class for pre-intermediate and intermediate english students with emphasis on the speking ability.
Enterprise Excellence is Inclusive Excellence.pdfKaiNexus
Enterprise excellence and inclusive excellence are closely linked, and real-world challenges have shown that both are essential to the success of any organization. To achieve enterprise excellence, organizations must focus on improving their operations and processes while creating an inclusive environment that engages everyone. In this interactive session, the facilitator will highlight commonly established business practices and how they limit our ability to engage everyone every day. More importantly, though, participants will likely gain increased awareness of what we can do differently to maximize enterprise excellence through deliberate inclusion.
What is Enterprise Excellence?
Enterprise Excellence is a holistic approach that's aimed at achieving world-class performance across all aspects of the organization.
What might I learn?
A way to engage all in creating Inclusive Excellence. Lessons from the US military and their parallels to the story of Harry Potter. How belt systems and CI teams can destroy inclusive practices. How leadership language invites people to the party. There are three things leaders can do to engage everyone every day: maximizing psychological safety to create environments where folks learn, contribute, and challenge the status quo.
Who might benefit? Anyone and everyone leading folks from the shop floor to top floor.
Dr. William Harvey is a seasoned Operations Leader with extensive experience in chemical processing, manufacturing, and operations management. At Michelman, he currently oversees multiple sites, leading teams in strategic planning and coaching/practicing continuous improvement. William is set to start his eighth year of teaching at the University of Cincinnati where he teaches marketing, finance, and management. William holds various certifications in change management, quality, leadership, operational excellence, team building, and DiSC, among others.
3. 3
This presentation contains a number of forward-looking statements. Words, and variations of words, such as “will,” “expect,”
“would,” “plan,” “likely,” “estimate,” “believe,” “hope,” “anticipate,” “look to,” “drive,” “positioned,” “target,” “commitment,” “objective,”
“outlook” and similar expressions are intended to identify our forward-looking statements, including, but not limited to, statements
about: our future performance, including our future revenue growth, operating income growth, earnings per share, margins,
interest expense, taxes and cash flow; category growth; growth in emerging markets; focusing our portfolio; consumer demand
and consumption; cost-reduction actions; productivity and productivity savings and improvement; supply chain and overhead
costs; our transformation agenda; innovation; our investments and the results of those investments; our operating model; currency
and the effect of foreign exchange translation on our results of operations; the costs of, cost savings generated by, timing of
expenditures under and completion of our restructuring program; the cash proceeds and ownership interest to be received in and
timeframe for completing the coffee transactions; acquisitions; achievement of our strategic objectives; capital expenditures;
share repurchases; dividends; shareholder value and returns to shareholders; and our Outlook, including 2015 Organic Net
Revenue growth, Adjusted Operating Income margin, Adjusted EPS and Free Cash Flow. These forward-looking statements are
subject to a number of risks and uncertainties, many of which are beyond our control, which could cause our actual results to
differ materially from those indicated in our forward-looking statements. Such factors include, but are not limited to, risks from
operating globally and in emerging markets, changes in currency exchange rates, continued volatility of commodity and other
input costs, pricing actions, weakness in economic conditions, weakness in consumer spending, unanticipated disruptions to our
business, competition, the restructuring program and our other transformation initiatives not yielding the anticipated benefits,
changes in the assumptions on which the restructuring program is based, failing to successfully complete the coffee transactions
or other acquisitions on the anticipated time frames and tax law changes. Please also see our risk factors, as they may be
amended from time to time, set forth in our filings with the SEC, including our most recently filed Annual Report on Form 10-K.
Mondelēz International disclaims and does not undertake any obligation to update or revise any forward-looking statement in this
presentation, except as required by applicable law or regulation.
.
Forward-looking statements
7. … and an advantaged global footprint
7
● Emerging markets
Organic Net Revenue
+7% in 2014
● Significant white space
opportunities
Emerging
Markets
38%
Developed
Markets
62%
$34B in net revenues in 2014
8. Why we like snacks
● $1.2 trillion global snacking market1
● Well-aligned with consumer trends
● High margin
● Expandable consumption
● Grows with GDP in emerging
markets
8
1. Source: Euromonitor
9. Global snack category growth well-above
other food categories
Category 2011 2012 2013 2014
Biscuits 7.3% 7.4% 5.5% 5.1%
Chocolate 5.9% 6.0% 5.3% 3.7%
Gum 2.0% 0.1% 0.7% 0.4%
Candy 6.4% 6.2% 4.5% 2.9%
Total Snacks 6.1% 5.9% 4.7% 3.9%
Powdered Beverages 9.7% 11.5% 10.6% 13.1%
Coffee 12.3% 7.2% (1.9)% 0.5%
Total Global Category Growth1
6.8% 6.1% 3.8% 3.6%
9
1. Total Global Category Growth includes biscuits, chocolate, gum, candy, coffee, powdered beverages and cream cheese categories in key markets. Global Category Growth based on available
Nielsen Global Data through December 2014 for measured channels in key markets where the company competes. The company has adjusted the 2014 Global Category Growth calculation to reflect
current rather than average 2013 currency rates for the hyperinflationary markets of Venezuela and Argentina in order to better represent underlying category growth for the Total Portfolio. Absent the
adjustment in the calculation, 2014 Global Category Growth would have been 4.7% for Total Snacks and 4.3% for the Total Portfolio.
10. Long-term strategies and targets unchanged
Organic Net Revenue Growth:
At or Above Category Growth
Adjusted Operating Income
Growth: High Single Digit
Adjusted EPS Growth:
Double Digit
Long-Term Targets
10
● Focus portfolio on snacks
● Reduce supply chain and
overhead costs
● Invest in advantaged
brands, innovation
platforms and routes to
market
11. In 2014, delivered strong earnings growth, margin
expansion and cash flow
11
1. See GAAP to Non-GAAP reconciliation at the end of this presentation.
2. Constant currency.
Organic
Net Revenue
Growth1
+2.4%
Adjusted
OI Margin1
12.9%
+80 bps
Adjusted
EPS
Growth1,2
+23.4%
2013-2014
Free Cash Flow
excluding items1
+30% vs. target
Return of
Capital to
Shareholders
$2.9 billion
12. Long-term strategy drives 2015 transformation agenda
focus
our
portfolio
● Complete coffee JV
transactions
● Integrate bolt-on
acquisitions
● Improve revenue mix
reduce
costs
● Deliver strong net productivity
● Move Power Brands to
advantaged assets
● Drive down overheads
via ZBB
invest
for
growth
● Invest in Power Brands,
innovation platforms and RTM
● Leverage operating model to
drive speed and scale
12
13. Creating the world’s leading pure-play coffee company
13
focus
our
portfolio
$3.4B in 2013 Net Revenue
1
Jacobs Douwe Egberts
$3.8B in 2014 Net Revenue
~$7B Net Revenue
1. As provided by D.E Master Blenders 1753
14. 84% of revenue from snacks after JV formed
● Optimizes capital allocation to core
snacks
● JV structure enables MDLZ to participate
in future coffee growth
● €4B expected cash proceeds
14
focus
our
portfolio
Reported Excluding
Coffee
Snacks
Beverages
Cheese &
Grocery
75%
16%
9%
84%
6%
10%
Based on 2014 Revenue
15. Kinh Do strengthens portfolio in Vietnam
● Advantaged Portfolio: Biscuits
and mooncakes leader
● Local Scale: ~$175MM in sales
● Growing Market: 90MM people,
50%+ under 30 years old
● Distribution Platform: Network
covers 130,000 outlets
15
focus
our
portfolio
16. Capture rapid growth of “free-from,” better-for-you
snacks with Enjoy Life
● U.S. allergen-free segment
growing 30%+1
● ~$40MM in revenue with good
expansion potential
● To be operated on a stand-alone
basis
16
focus
our
portfolio
1. Based on AC Nielsen data
17. Strategic decisions to improve revenue mix in 2015
17
focus
our
portfolio
~1 pp headwind to Organic Net Revenue growth in 2015
Discontinue
low-margin,
customer-
specific
product lines
Exit
low-margin
products from
spin-off
Ongoing
SKU
simplification
18. Power Brands and innovation platforms driving growth
18
● Grow ~2x company rate
● Carry significantly higher
margins
● ~80% of A&C support
● Accounts for nearly all
incremental A&C spending
in 2015
Power
Brands
62%
Other
Brands
38%
Power Brands
$34B in net revenues in 2014
Invest
for
Growth
19. Driving growth by expanding innovation platforms
● Created new biscuit occasion
● Sold in 54 countries
● Organic Net Revenue CAGR
+35% since 2011
19
● Drove category expansion and
growth of core tablets
● Sold in 54 countries
● Offered under multiple brands
$200MM
Platform
$650MM
Platform
~13% of net revenues from innovation
Invest
for
Growth
20. Expanding Marvellous Creations platform globally
20
2014
2015
& beyond20132012
$40MM
Revenue
$500MM
Platform
by 2018
Invest
for
Growth
21. Investing in routes to market, especially traditional
trade
21
MDLZ Coverage of Traditional Trade Outlets
2015E
Increase
’15E vs. ’13
% Outlets
Covered ’15E
Increase
’15E vs. ’13
347,000 +37,000 36% +3 pp
1,250,000 +233,000 16% +2 pp
507,000 +24,000 23% +1 pp
Invest
for
Growth
22. Leverage operating model to drive focus,
scale and speed
● Consistent region-based, category-led operating model
– Improves ability to accelerate growth platforms and best practices
– Simplifies and standardizes processes to drive speed/reduce costs
● Chief Growth Officer at center of new operating model
22
Invest
for
Growth
23. Long-term strategies and targets unchanged
Organic Net Revenue Growth:
At or Above Category Growth
Adjusted Operating Income
Growth: High Single Digit
Adjusted EPS Growth:
Double Digit
Long-Term Targets
23
● Focus portfolio on snacks
● Reduce supply chain and
overhead costs
● Invest in advantaged
brands, innovation
platforms and routes to
market
25. Priorities Three Year
Financial Goals
$3B Gross Productivity
Cost Savings
(~$1B/per year; ~4.5% of COGS)
$1.5B Net Productivity
Cost Savings
(~$0.5B/per year; ~2.3% of COGS)
$1B Cash Flow
• Step change leadership talent
& capabilities
• Transform global manufacturing
platforms
• Redesign the supply chain
network
• Drive productivity programs to
fuel growth
• Improve cash management
25
Supply Chain Reinvention on track
reduce
costs
26. Acquisitions drove supply chain complexity
● Significant number of SKUs, formats and formulas
● Fragmented supplier base
● Sub-scale plants with low efficiency assets
1990 2000 2010
26
reduce
costs
27. 27
● Upgraded talent in 45%
of critical roles
● Changed 75% of senior
leadership team
Step changed leadership talent & capabilities
reduce
costs
28. Global platform transformation process
Document
best
practices
Develop
modular
design
Develop
break-
through
processes
Leverage
low-cost
suppliers
Pilot new
integrated
design
Qualify
and
roll out
globally
28
reduce
costs
29. 30%+ cost savings
2x output of current
North American assets
20%+ cost savings
Flexibility to produce wide
range of package sizes
20%+ cost savings
Significantly reduced
manufacturing time
Lines of the Future driving savings
● Development process results in reduced engineering, installation
and start-up costs
● Drives conversion cost savings through increased throughput,
less waste and lower headcount per line
29
reduce
costs
30. New Brownfield &
Greenfield Sites
11 5
Power Brands on
Advantaged
Assets
~15% ~25% ~70% by ’18
Advantaged Lines
Installed
40+ 35
Net Revenue
per Plant
~$200MM ~$230MM > $300MM by ’18
2012 2013 – 2015E 2016E – 2018E
30
Redesigning supply chain to deliver world-class
efficiency
reduce
costs
31. ● Support growth volume in
the Americas
● Repatriate co-man volume
● 2 LOF on-line Q4’14;
2 additional lines in Q1’15
31
Salinas, Mexico biscuit facility now on-stream
reduce
costs
32. North America
(includes Salinas)
1 greenfield
12 lines
Europe1
3 brownfields
15 lines
EEMEA
2 brownfields
1 greenfield
4 lines
Latin
America
1 brownfield
5 lines
Asia Pacific
2 brownfields
1 greenfield
7 lines
1. Excludes Coffee and Cheese & Grocery
32
Invested $1.5B in network transformation since 2012
reduce
costs
44. 44
Simplicity
2014 Key Achievements
● Streamlining EU Biscuits
– On-track for 60% reduction in complexity by 2016
Key Future Objectives
● Apply learnings to EU Chocolate
– Creates high-scale platform
– Target 10%+ total cost reduction
Applying simplicity initiatives across categories
reduce
costs
45. 45
2011 2012 2013 2014 2015E-2018E
1.1%
1.8%
2.5%
2.8% 2.8%+
Net Productivity as Percentage of COGS
Delivering world-class productivity levels
reduce
costs
46. 46
Receivables
• Terms compliance
• Sales phasing
• Term negotiations
Inventory
• Raw and pack
• Finished goods
• Infrastructure
• Processes & technology
Payables
• Payment terms
rationalization
• Frequency extension
• Supply chain financing
Target $1 billion in incremental cash over three years
Focusing on cash management to fund future
investments in capital and growth
reduce
costs
47. 47
33
20
10
2012 2013 2014
Cash Conversion Cycle (in days)
● Generated ~$600MM incremental
cash in 2014
– Reduced CCC 23 days in 2 years
● Further working capital opportunity
Based on balances as of year-end
On track to generate $1B incremental cash
reduce
costs
48. Successfully executing on SCR initiative
48
Talent & Capabilities
Upgraded talent and core
leadership
Delivered 2.8% net productivity
in 2014
Targeting 2.8%+ net productivity
with strong project pipeline
Productivity
Generated incremental
$600 million of cash in 2014
Further working capital opportunity
Cash Management
Manufacturing Platforms
Qualified biscuit, chocolate and
gum Lines of the Future
Installing lines to drive conversion
cost savings
Network Redesign
Opened Salinas, Mexico
greenfield facility in Q4’14
Greenfield and brownfield sites
under construction
reduce
costs
50. Overheads as % of Net Revenue
2013 2016E
Significantly reducing overhead costs
● Identify and capture sustainable cost
reductions with zero-based approach (ZBB)
● Three key initiatives:
– Indirect Costs
– People Costs & Org Model
– Shared Services
● Savings driving margin improvement
and fueling growth investments
reduce
costs
50
51. Early success with ZBB approach to indirect costs
51
1. Information Systems
2. Travel
3. Facilities
4. Contractors & Consultants
5. Perquisites
6. Company Vehicles
7. Events & Sponsorships
8. Recruitment & Development
9. Legal Services
10. Financial Services
11. Outsourced Business Support
12. Sales Support
13. Marketing Support
~50% of overhead savings opportunity
● Benchmarking best-in-class spending levels / policies
● All categories over benchmark spending levels
● New policies introduced during 2014
● Bottoms-up budgets locked for 2015
● Executive ownership for each cost package
reduce
costs
52. Adopted new policies for indirect spending
Opportunity
Target
Savings Select Drivers
Travel ~45%
• Reduce travel consumption by ~35%
• Implement industry standard travel policies
• Globally negotiate provider contracts
Information
Systems
~35%
• Reduce application portfolio by ~50%
• Rationalize and virtualize IT infrastructure
• Consolidate voice, data service & application vendors
Contractors &
Consultants
~25%
• Centralize pre-approval to curb consumption of services
• Eliminate/minimize temporary services
• Lever global scale for recurring third-party providers
52
reduce
costs
53. Streamlining how we work
53
Organization Shared Services
• Eliminate redundancies by adopting
region-based, category-led model
̶ Key driver +300bps OI margin in Europe
̶ Implemented in NA in 2014
• Greater centralization of certain
functions (e.g., Procurement)
• Simplify and standardize processes
• Focus on scalable, transactional
processes in Finance, HR, Receivables
and Payables
• Leverage outsourced partner and
captive models
~50% of overhead savings opportunity
reduce
costs
54. 2014-2018 Restructuring Program enables
$1.5B of expected incremental savings
• $3.5B total P&L cost
− $2.5B cash
− $1B non-cash
• $2B capex included in
total short-term target of
~5% of revenue
Costs Benefits
• Drives margin
expansion
• Provides fuel for
growth
Indirect
Costs
Supply
Chain
People Costs
& Org Model
$1.5B
~25%
~25%
~50%
2018 Exit Run-Rate
Overheads
54
reduce
costs
55. Targeting 15%-16% Adjusted OI margin in 2016
55
2013 2014 2015E 2016E
12.1%1
12.9%1
~14%
15%-16% Beyond 2016,
opportunity to drive
continued margin
expansion and
fund growth
Adjusted Operating Income Margin
1. See GAAP to Non-GAAP reconciliation at the end of this presentation.
reduce
costs
56. 2015 Outlook – Income Statement
56
Target
Organic Net Revenue Growth 2%+
Estimated FX Impact on Net Revenue Growth1 ~(11)pp
Adjusted Operating Income Margin ~14%
Interest Expense ~$825MM
Effective Tax Rate High Teens
Adjusted Earnings Per Share Growth (constant FX) Double-Digit %
Estimated FX Impact on EPS1 ~$(0.30)
1. Based on January 30, 2015 spot rates.
57. Strong cash flow generation
57
($ in billions)
Net Cash Provided by Operating Activities
excluding items and Restructuring Program
1
$4.1 $4.3 $4.0
Capital Expenditures (including Restructuring) (1.6) (1.6) (1.8)
2012-14 and 2014-18 Restructuring Programs (0.2) (0.2) (1.0)
Free Cash Flow excluding items
1
$2.3 $2.5 $1.2
FY 13 FY 14 FY 15E
Free Cash Flow
Includes
~$0.5B
FX headwind
1. See GAAP to Non-GAAP reconciliation at the end of this presentation.
58. Disciplined capital deployment based on returns
58
Reinvest to Drive
Top-Tier Growth
M&A
Return Capital
to Shareholders
Debt
Reduction
• Focus on chocolate, biscuits, gum and candy categories
• Predominantly in emerging markets
• Brand support and route-to-market expansion
• Supply Chain Reinvention
• Overhead reductions
• $7.7B share repurchase authorization through 2016
($3.1B remaining; $1B–$2B per year)
• Modest dividend, increasing over time; 30% minimum payout ratio
• Maintain investment grade rating with access to tier 2 CP
• Preserve balance sheet flexibility
59. Long-term strategies and targets unchanged
Organic Net Revenue Growth:
At or Above Category Growth
Adjusted Operating Income
Growth: High Single Digit
Adjusted EPS Growth:
Double Digit
Long-Term Targets
59
● Focus portfolio on snacks
● Reduce supply chain and
overhead costs
● Invest in advantaged
brands, innovation
platforms and routes to
market
61. DEFINITIONS OF THE COMPANY’S NON-GAAP FINANCIAL MEASURES
The company’s non-GAAP financial measures and corresponding metrics reflect how the company evaluates its operating results currently and provide
improved comparability of operating results. As new events or circumstances arise, these definitions could change over time:
● “Organic Net Revenue” is defined as net revenues excluding the impact of acquisitions, divestitures (including businesses under sales agreements
and exits of major product lines under a sale or licensing agreement), Integration Program costs, accounting calendar changes and currency rate
fluctuations.
● “Adjusted Gross Profit” is defined as gross profit excluding the impacts of pension costs related to obligations transferred in the Spin-Off, the 2012-
2014 Restructuring Program, the Integration Program and other acquisition integration costs and the operating results of divestitures (including
businesses under sales agreements and exits of major product lines under a sale or licensing agreement). The company also evaluates growth in
the company’s Adjusted Gross Profit on a constant currency basis.
● “Adjusted Operating Income” and “Adjusted Segment Operating Income” are defined as operating income (or segment operating income) excluding
the impacts of Spin-Off Costs, pension costs related to the obligations transferred in the Spin-Off, the 2012-2014 Restructuring Program, the 2014-
2018 Restructuring Program, the Integration Program and other acquisition integration costs, the remeasurement of net monetary assets in
Venezuela, the benefit from the Cadbury acquisition-related indemnification resolution, incremental costs associated with the JDE coffee
transactions, impairment charges related to goodwill and intangible assets, gains / losses from divestitures or acquisitions, acquisition-related costs
and the operating results of divestitures (including businesses under sales agreements and exits of major product lines under a sale or licensing
agreement). The company also evaluates growth in the company’s Adjusted Operating Income and Adjusted Segment Operating Income on a
constant currency basis.
● “Adjusted EPS” is defined as diluted EPS attributable to Mondelēz International from continuing operations excluding the impacts of Spin-Off Costs,
pension costs related to the obligations transferred in the Spin-Off, the 2012-2014 Restructuring Program, the 2014-2018 Restructuring Program, the
Integration Program and other acquisition integration costs, the remeasurement of net monetary assets in Venezuela, the net benefit from the
Cadbury acquisition-related indemnification resolution, the loss on debt extinguishment and related expenses, the residual tax benefit impact from the
resolution of the Starbucks arbitration, hedging gains / losses and incremental costs associated with the JDE coffee transactions, impairment charges
related to goodwill and intangible assets, gains / losses from divestitures or acquisitions, acquisition-related costs and net earnings from divestitures
(including businesses under sales agreements and exits of major product lines under a sale or licensing agreement), and including an interest
expense adjustment related to the Spin-Off transaction. The company also evaluates growth in the company’s Adjusted EPS on a constant currency
basis.
● “Free Cash Flow excluding items” is defined as Free Cash Flow (net cash provided by operating activities less capital expenditures) excluding taxes
paid on the Starbucks arbitration award and cash payments associated with accrued interest and other related fees due to the company’s completion
of a $1.6 billion cash tender offer on February 6, 2014 and a $3.4 billion cash tender offer on December 18, 2013 for some of its outstanding high-
coupon long-term debt.
62. Net Revenues to Organic Net Revenues
Mondelēz
International
For the Twelve Months Ended December 31, 2014
Reported (GAAP) 34,244$
Divestitures -
Acquisitions (14)
Currency 1,806
Organic (Non-GAAP) 36,036$
For the Twelve Months Ended December 31, 2013
Reported (GAAP) 35,299$
Divestitures (70)
Accounting calendar change (38)
Organic (Non-GAAP) 35,191$
% Change
Reported (GAAP) (3.0)%
Divestitures 0.2 pp
Acquisitions -
Accounting calendar change 0.1
Currency 5.1
Organic (Non-GAAP) 2.4 %
(in millions of U.S. dollars) (Unaudited)
GAAP to Non-GAAP Reconciliation
63. GAAP to Non-GAAP Reconciliation
63
Net
Revenues
Operating
Income
Operating
Income
margin
Net
Revenues
Operating
Income
Operating
Income
margin
Reported (GAAP) 34,244$ 3,242$ 9.5% 35,299$ 3,971$ 11.2%
Integration Program and other acquisition integration costs - (4) - 220
Spin-Off Costs - 35 - 62
2012-2014 Restructuring Program - 459 - 330
Acquisition-related costs - 2 - 2
Net Benefit from Indemnification Resolution - - - (336)
Remeasurement of net monetary assets in Venezuela - 167 - 54
Gains on acquisition and divestitures, net - - - (30)
Divestitures - - (70) (6)
2014-2018 Restructuring Program - 381 - -
Costs associated with the JDE coffee transactions - 77 - -
Intangible asset impairment - 57 - -
Adjusted (Non-GAAP) 34,244$ 4,416$ 12.9% 35,229$ 4,267$ 12.1%
For the Twelve Months Ended
December 31, 2014
For the Twelve Months Ended
December 31, 2013
Operating Income To Adjusted Operating Income
(in millions of U.S. dollars) (Unaudited)
64. Diluted EPS % Growth
2013 Diluted EPS Attributable to Mondelēz International (GAAP) 2.19$
Discontinued Operations 0.90
2013 Diluted EPS Attributable to Mondelēz International from
Continuing Operations 1.29
Integration Program and other acquisition integration costs 0.10
Spin-Off Costs 0.02
2012-2014 Restructuring Program costs 0.14
Net benefit from indemnification resolution (0.20)
Loss on debt extinguishment and related expenses 0.22
Residual tax impact associated with starbucks arbitration resolution (0.02)
Remeasurement of net monetary assets in Venezuela 0.03
Gains on acquisition and divestitures, net (0.04)
2013 Adjusted EPS (Non-GAAP) 1.54
Increase in operations 0.25
Gain on sale of property in 2013 (0.03)
VAT related benefits 0.04
Unrealized gains/(losses) on hedging activities (0.07)
Lower interest and other expense, net 0.08
Changes in shares outstanding 0.08
Changes in income taxes 0.01
2014 Adjusted EPS (Constant Currency) (Non-GAAP) 1.90 23.4%
Unfavorable foreign currency - translation (0.14)
2014 Adjusted EPS (Non-GAAP) 1.76 14.3%
Spin-Off Costs (0.01)
2012-2014 Restructuring Program costs (0.21)
Remeasurement of net monetary assets in Venezuela (0.09)
Loss on debt extinguishment and related expenses (0.18)
Intangible asset impairment charges (0.02)
2014-2018 Restructuring Program costs (0.16)
Income / (costs) associated with the JDE coffee transactions 0.19
2014 Diluted EPS Attributable to Mondelēz International (GAAP) 1.28$ (41.6)%
Diluted EPS to Adjusted EPS
(Unaudited)
For the Twelve Months
Ended December 31,
GAAP to Non-GAAP Reconciliation
65. GAAP to Non-GAAP Reconciliation
2013 2014
Net Cash Provided by Operating Activities (GAAP) 6,410$ 3,562$
Capital Expenditures (1,622) (1,642)
Free Cash Flow (Non-GAAP) 4,788$ 1,920$
Items
Cash impact of the resolution of the Starbucks arbitration (1)
(2,616) 498
Cash payments for accrued interest and other related fees associated with debt tendered as of December 18, 2013 (2)
81 -
Cash payments for accrued interest and other related fees associated with debt tendered as of February 6, 2014 (3)
- 47
Free Cash Flow excluding items (Non-GAAP) 2,253$ 2,465$
(1)
(2)
(3)
On December 18, 2013, the company completed a $3.4 billion cash tender offer for some of its outstanding high coupon long-term debt. The amount
above reflects the cash payments associated with accrued interest and other related fees.
On February 6, 2014, the company completed a $1.6 billion cash tender offer for some of its outstanding high coupon long-term debt. The amount
above reflects the cash payments associated with accrued interest and other related fees.
Net Cash Provided by Operating Activities
to Free Cash Flow excluding items
(in millions of U.S. dollars) (Unaudited)
For the year ended
December 31,
During the fourth quarter of 2013, the dispute with Starbucks Coffee Company was resolved. The amount for 2013 noted above reflects the cash
received from Starbucks of $2,764 million net of $148 million attorney's fees paid. The amount noted above for 2014 reflects the taxes paid associated
with the net cash received and additional attorney's fees paid in 2014.
66. 66
GAAP to Non-GAAP Reconciliation
2013 2014
Net Cash Provided by Operating Activities (GAAP) 6,410$ 3,562$
Items
Cash impact of the resolution of the Starbucks arbitration (1)
(2,616) 498
Cash payments for accrued interest and other related fees associated with debt tendered as of December 18, 2013 (2)
81 -
Cash payments for accrued interest and other related fees associated with debt tendered as of February 6, 2014 (3)
- 47
Restructuring Programs
Cash payments for the 2012-2014 and 2014-2018 Restructuring Programs related to expenses 221 191
Net Cash Provided by Operating Activities excluding items and Restructuring Programs (Non-GAAP)
4,096$ 4,298$
(1)
(2)
(3)
On December 18, 2013, the company completed a $3.4 billion cash tender offer for some of its outstanding high coupon long-term debt. The amount above reflects the
cash payments associated with accrued interest and other related fees.
On February 6, 2014, the company completed a $1.6 billion cash tender offer for some of its outstanding high coupon long-term debt. The amount above reflects the
cash payments associated with accrued interest and other related fees.
Net Cash Provided by Operating Activities
(in millions of U.S. dollars) (Unaudited)
For the year ended
December 31,
During the fourth quarter of 2013, the dispute with Starbucks Coffee Company was resolved. The amount for 2013 noted above reflects the cash received from
Starbucks of $2,764 million net of $148 million attorney's fees paid. The taxes associated with net cash received was paid in 2014.