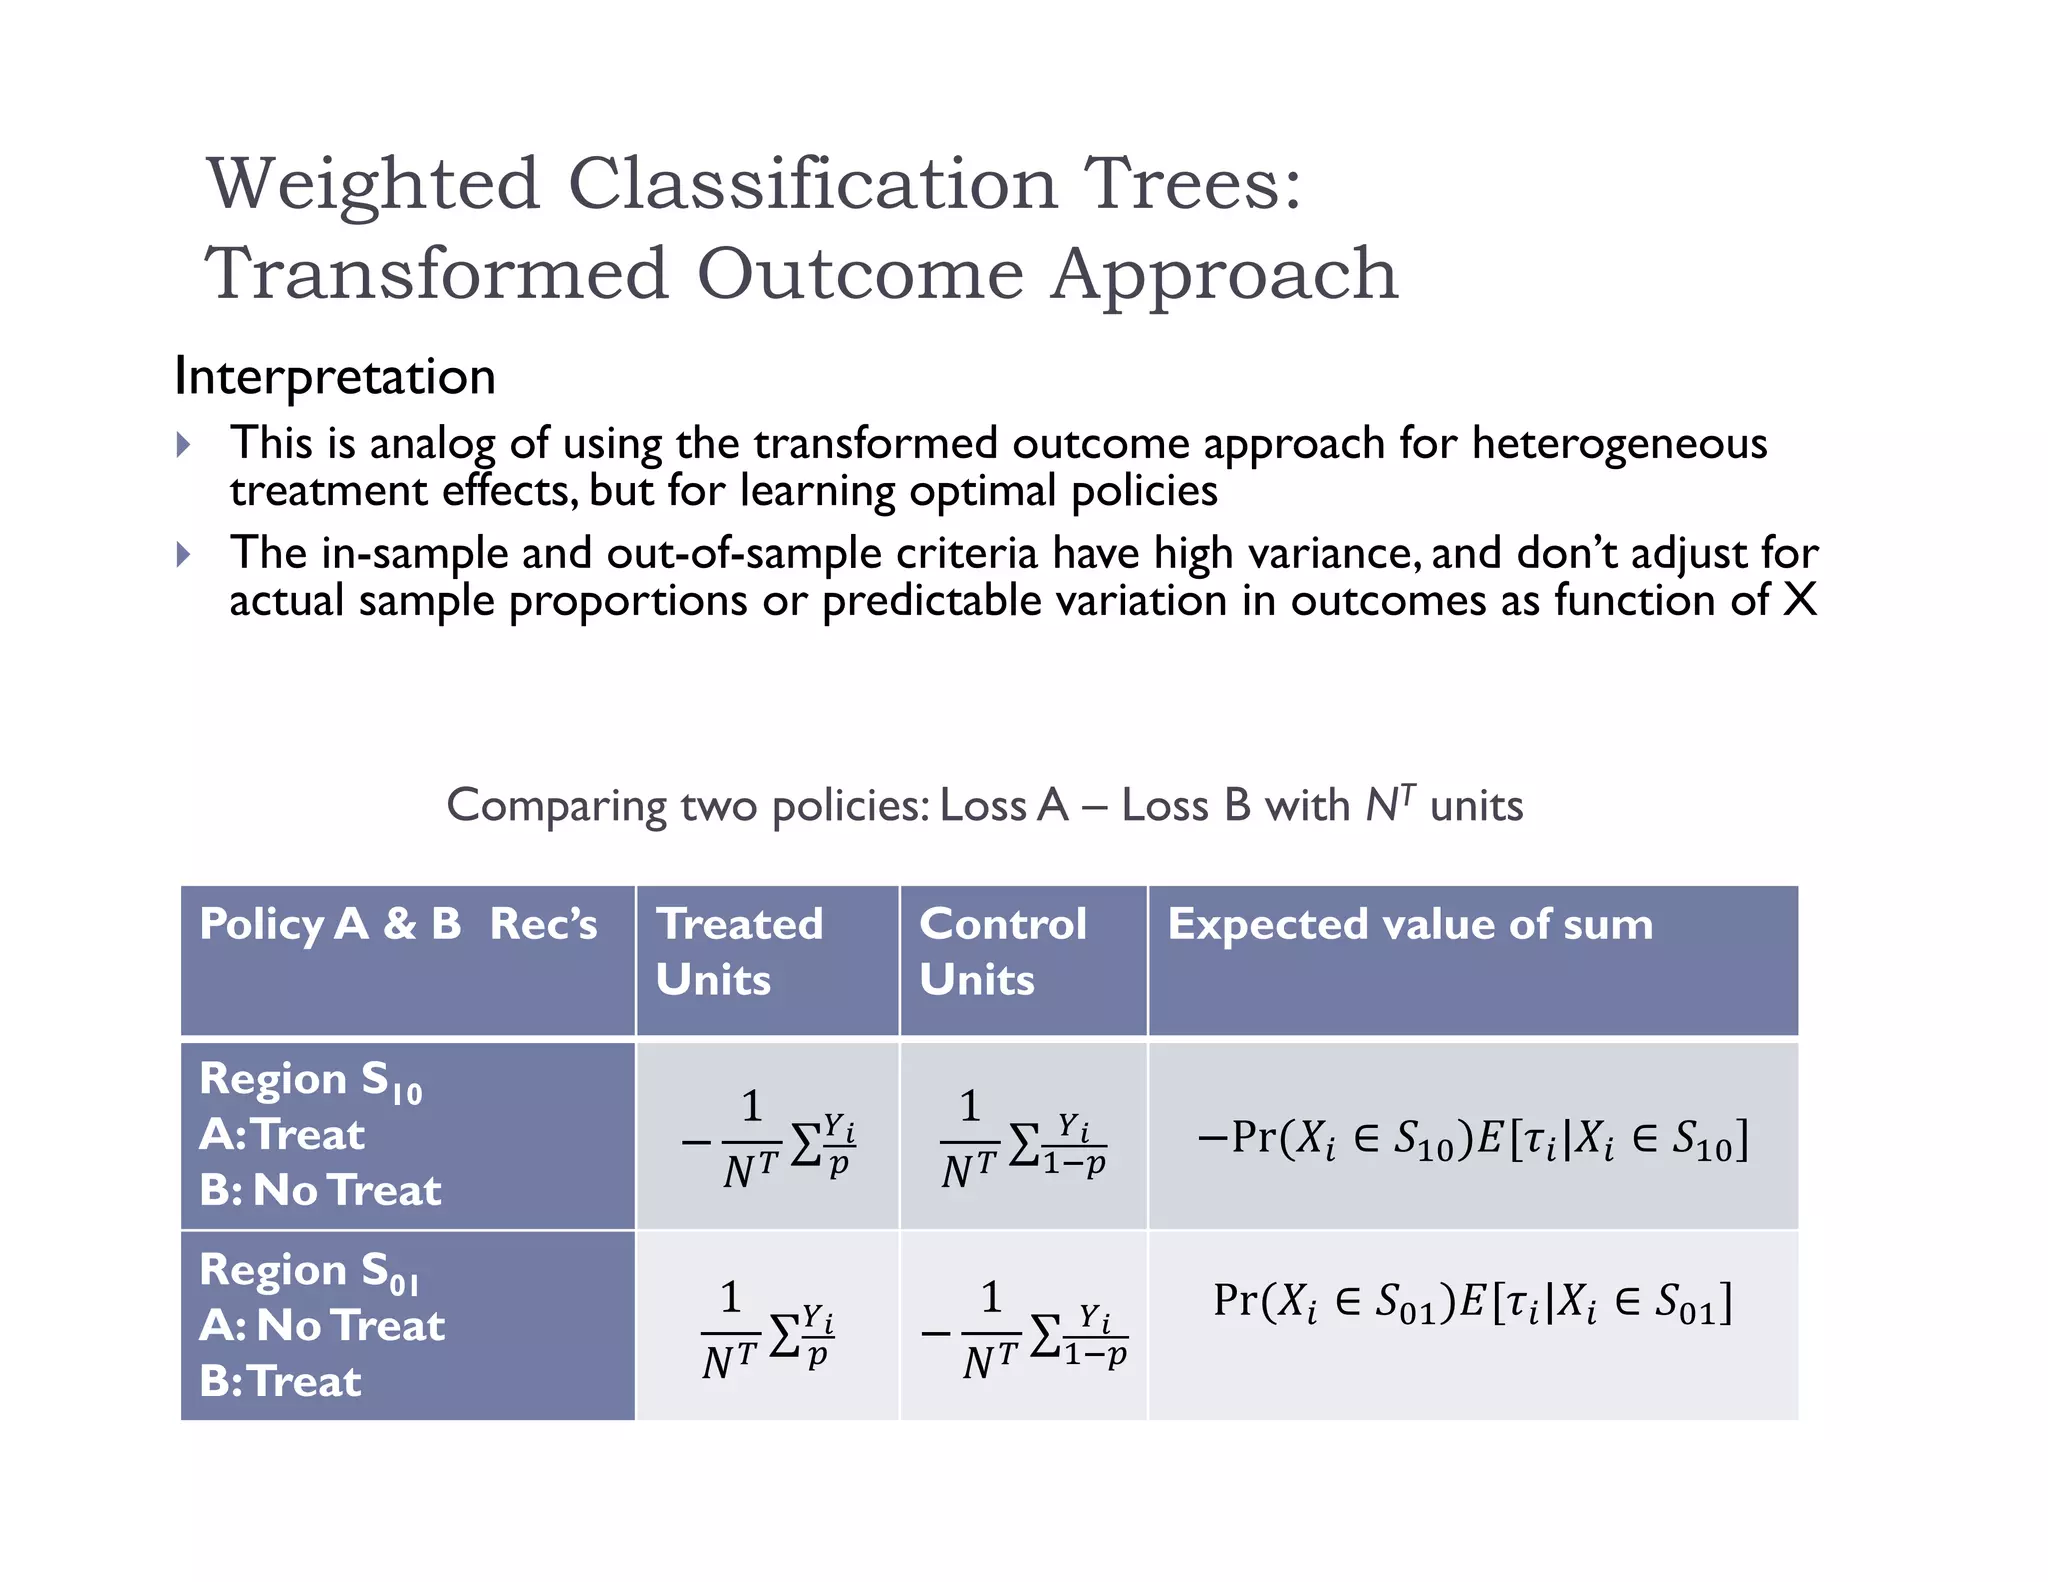
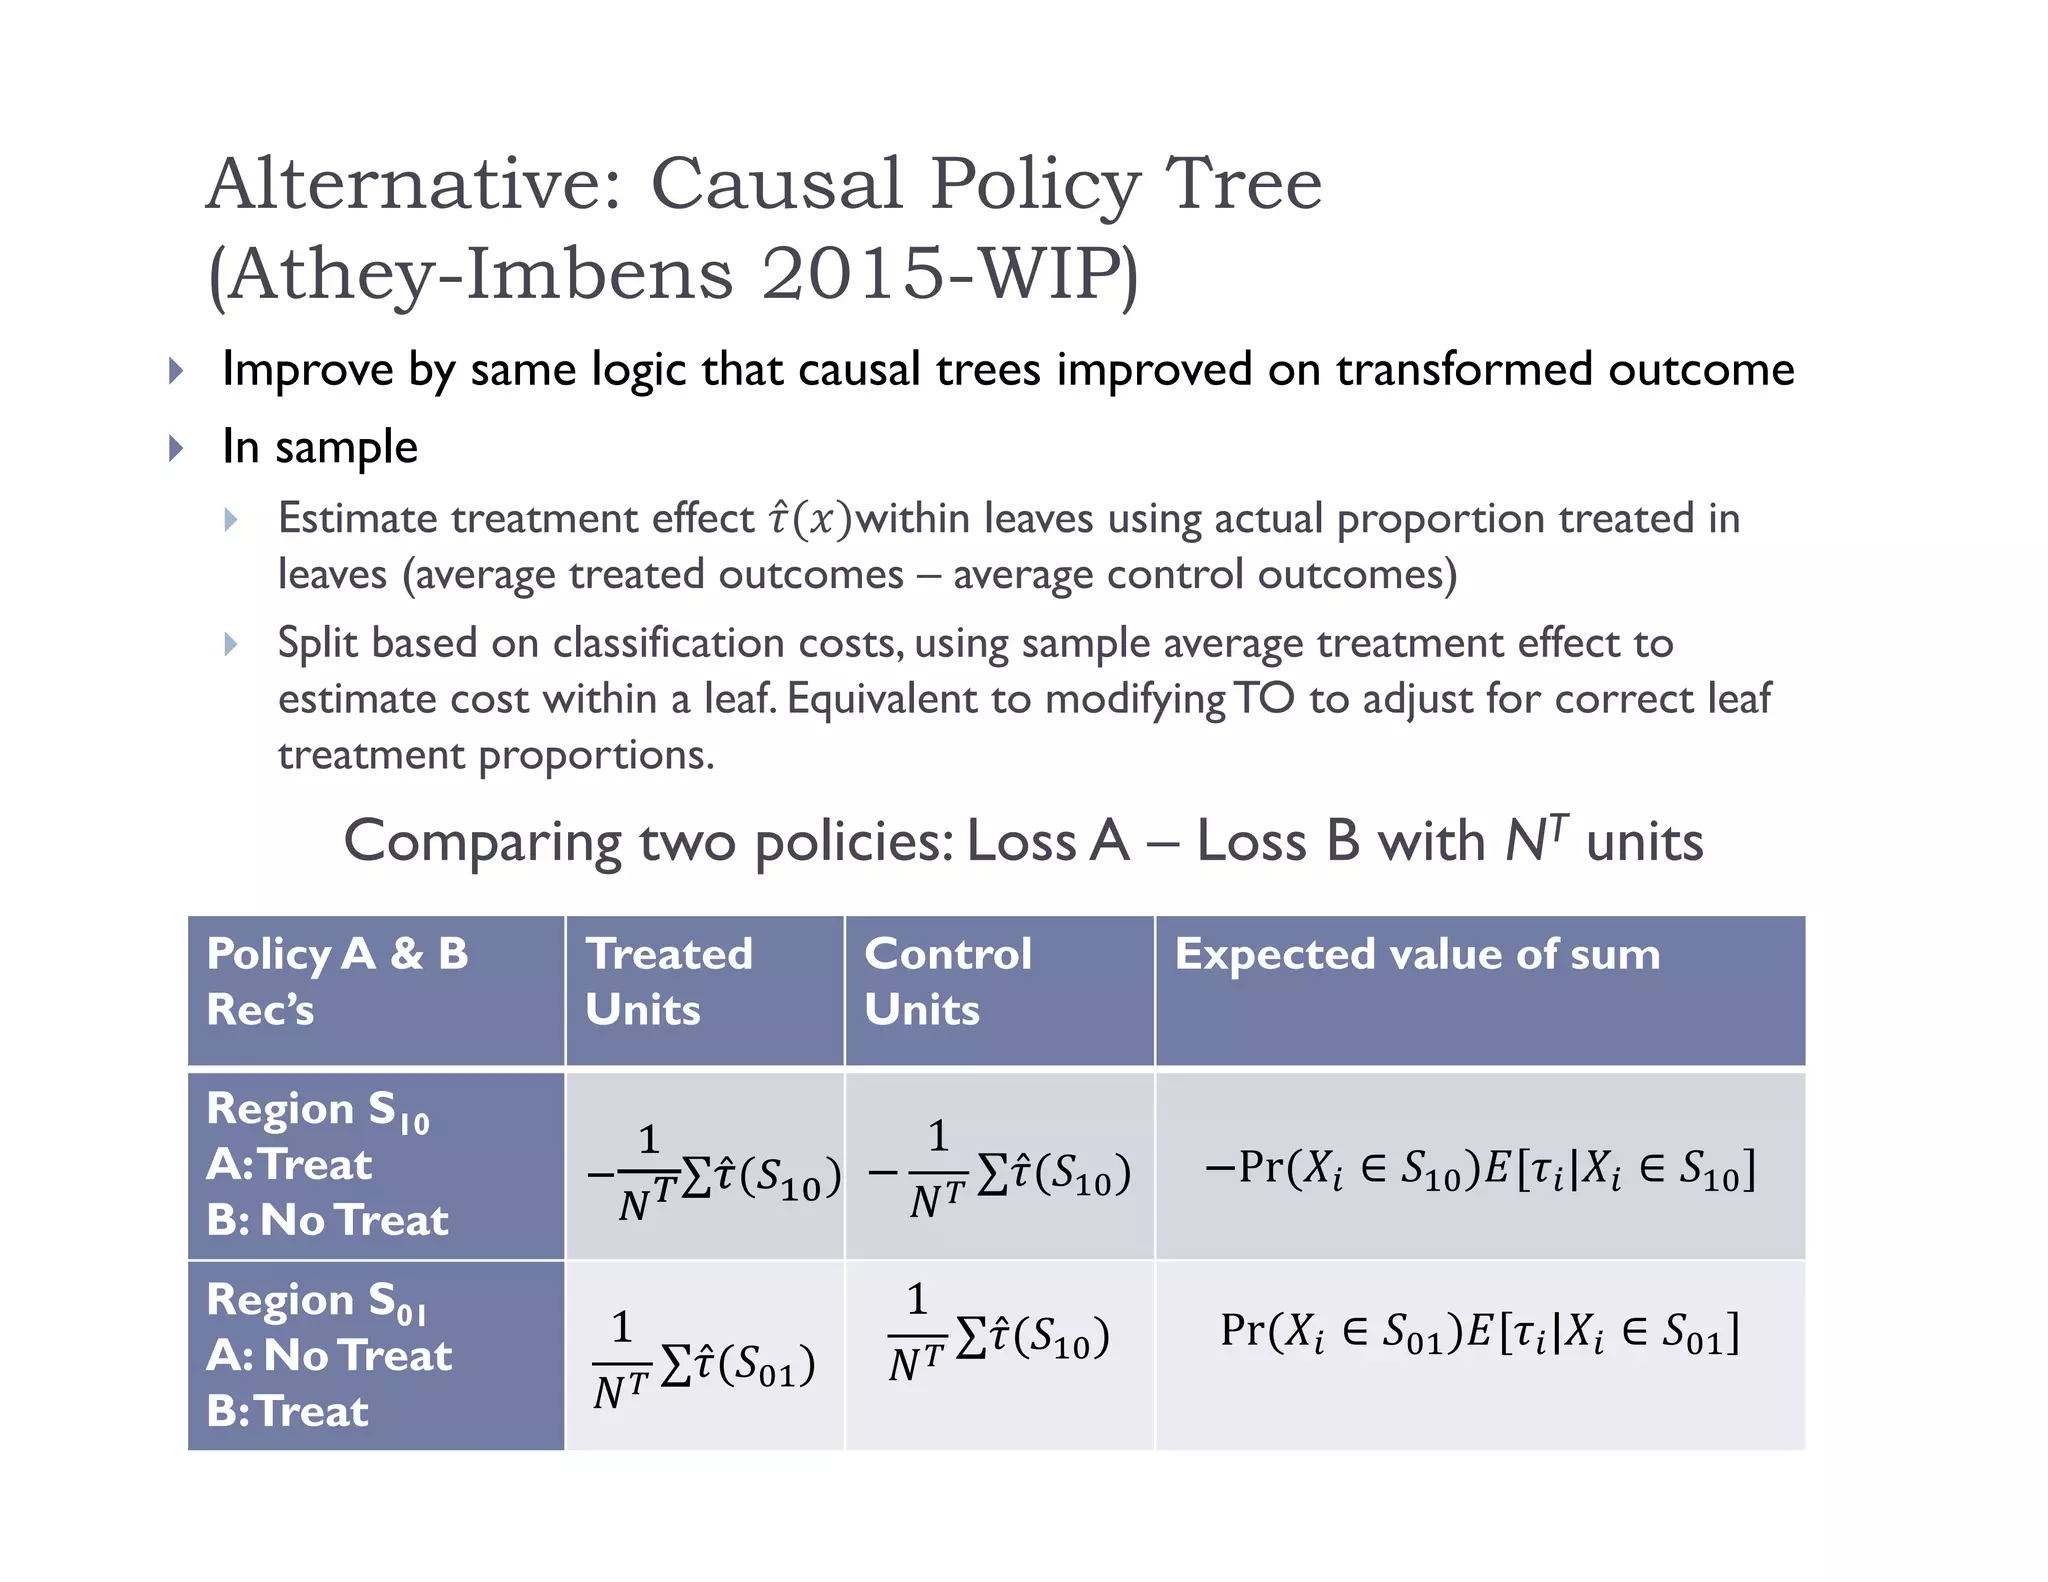
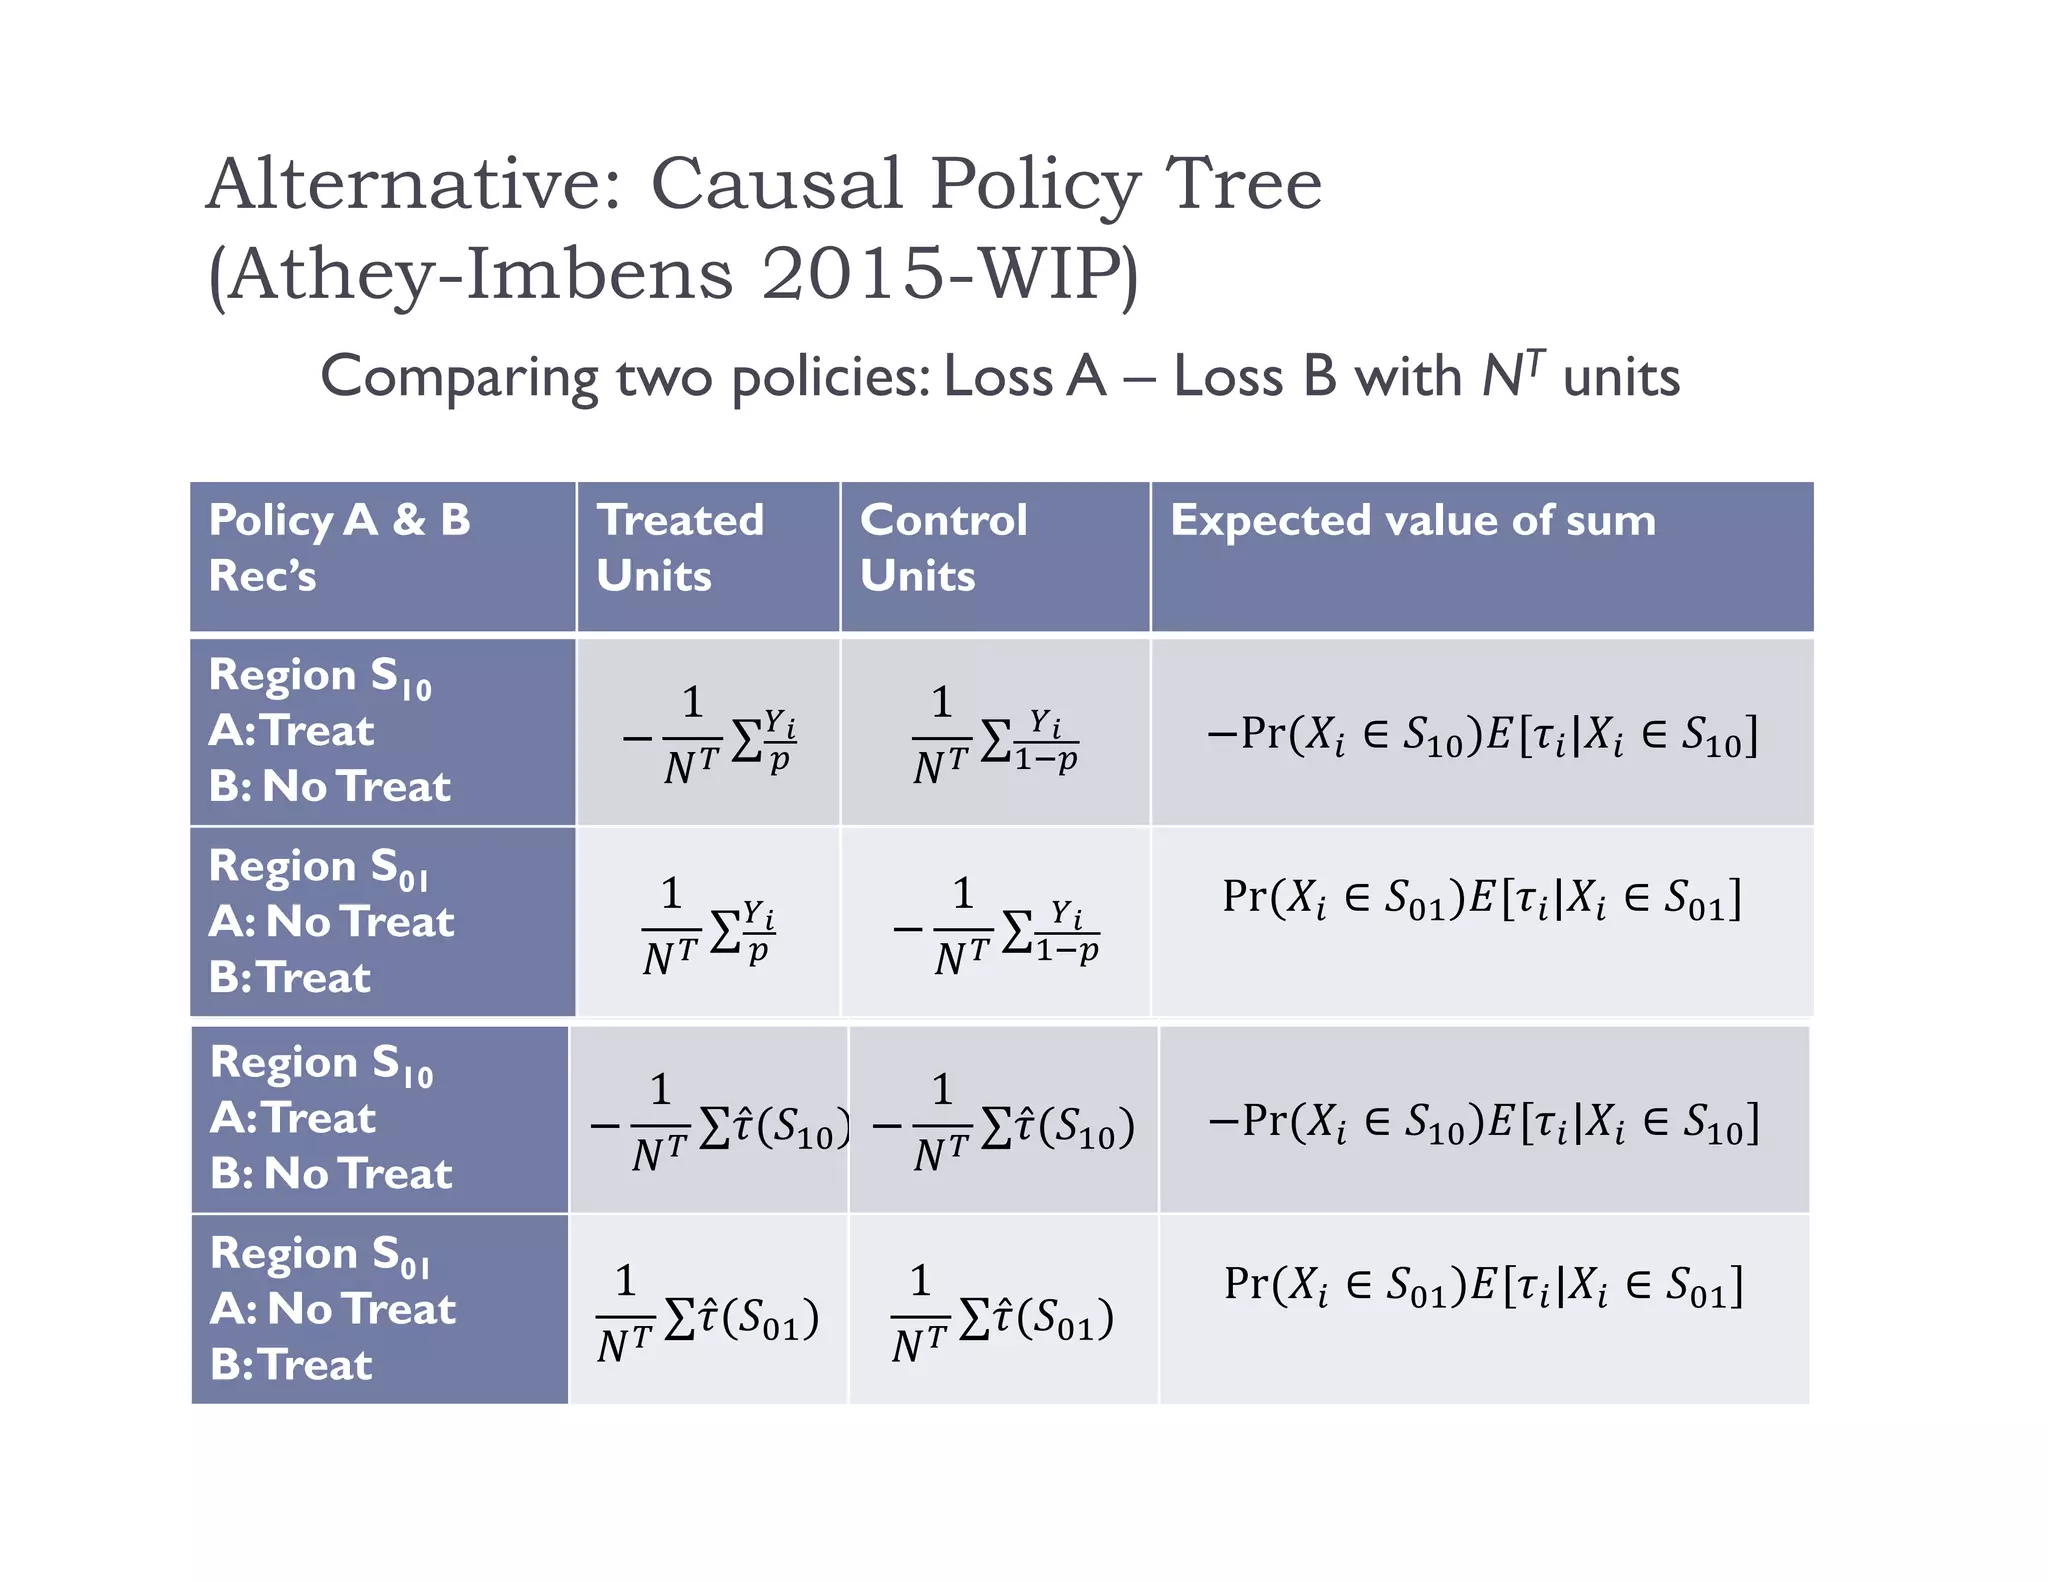
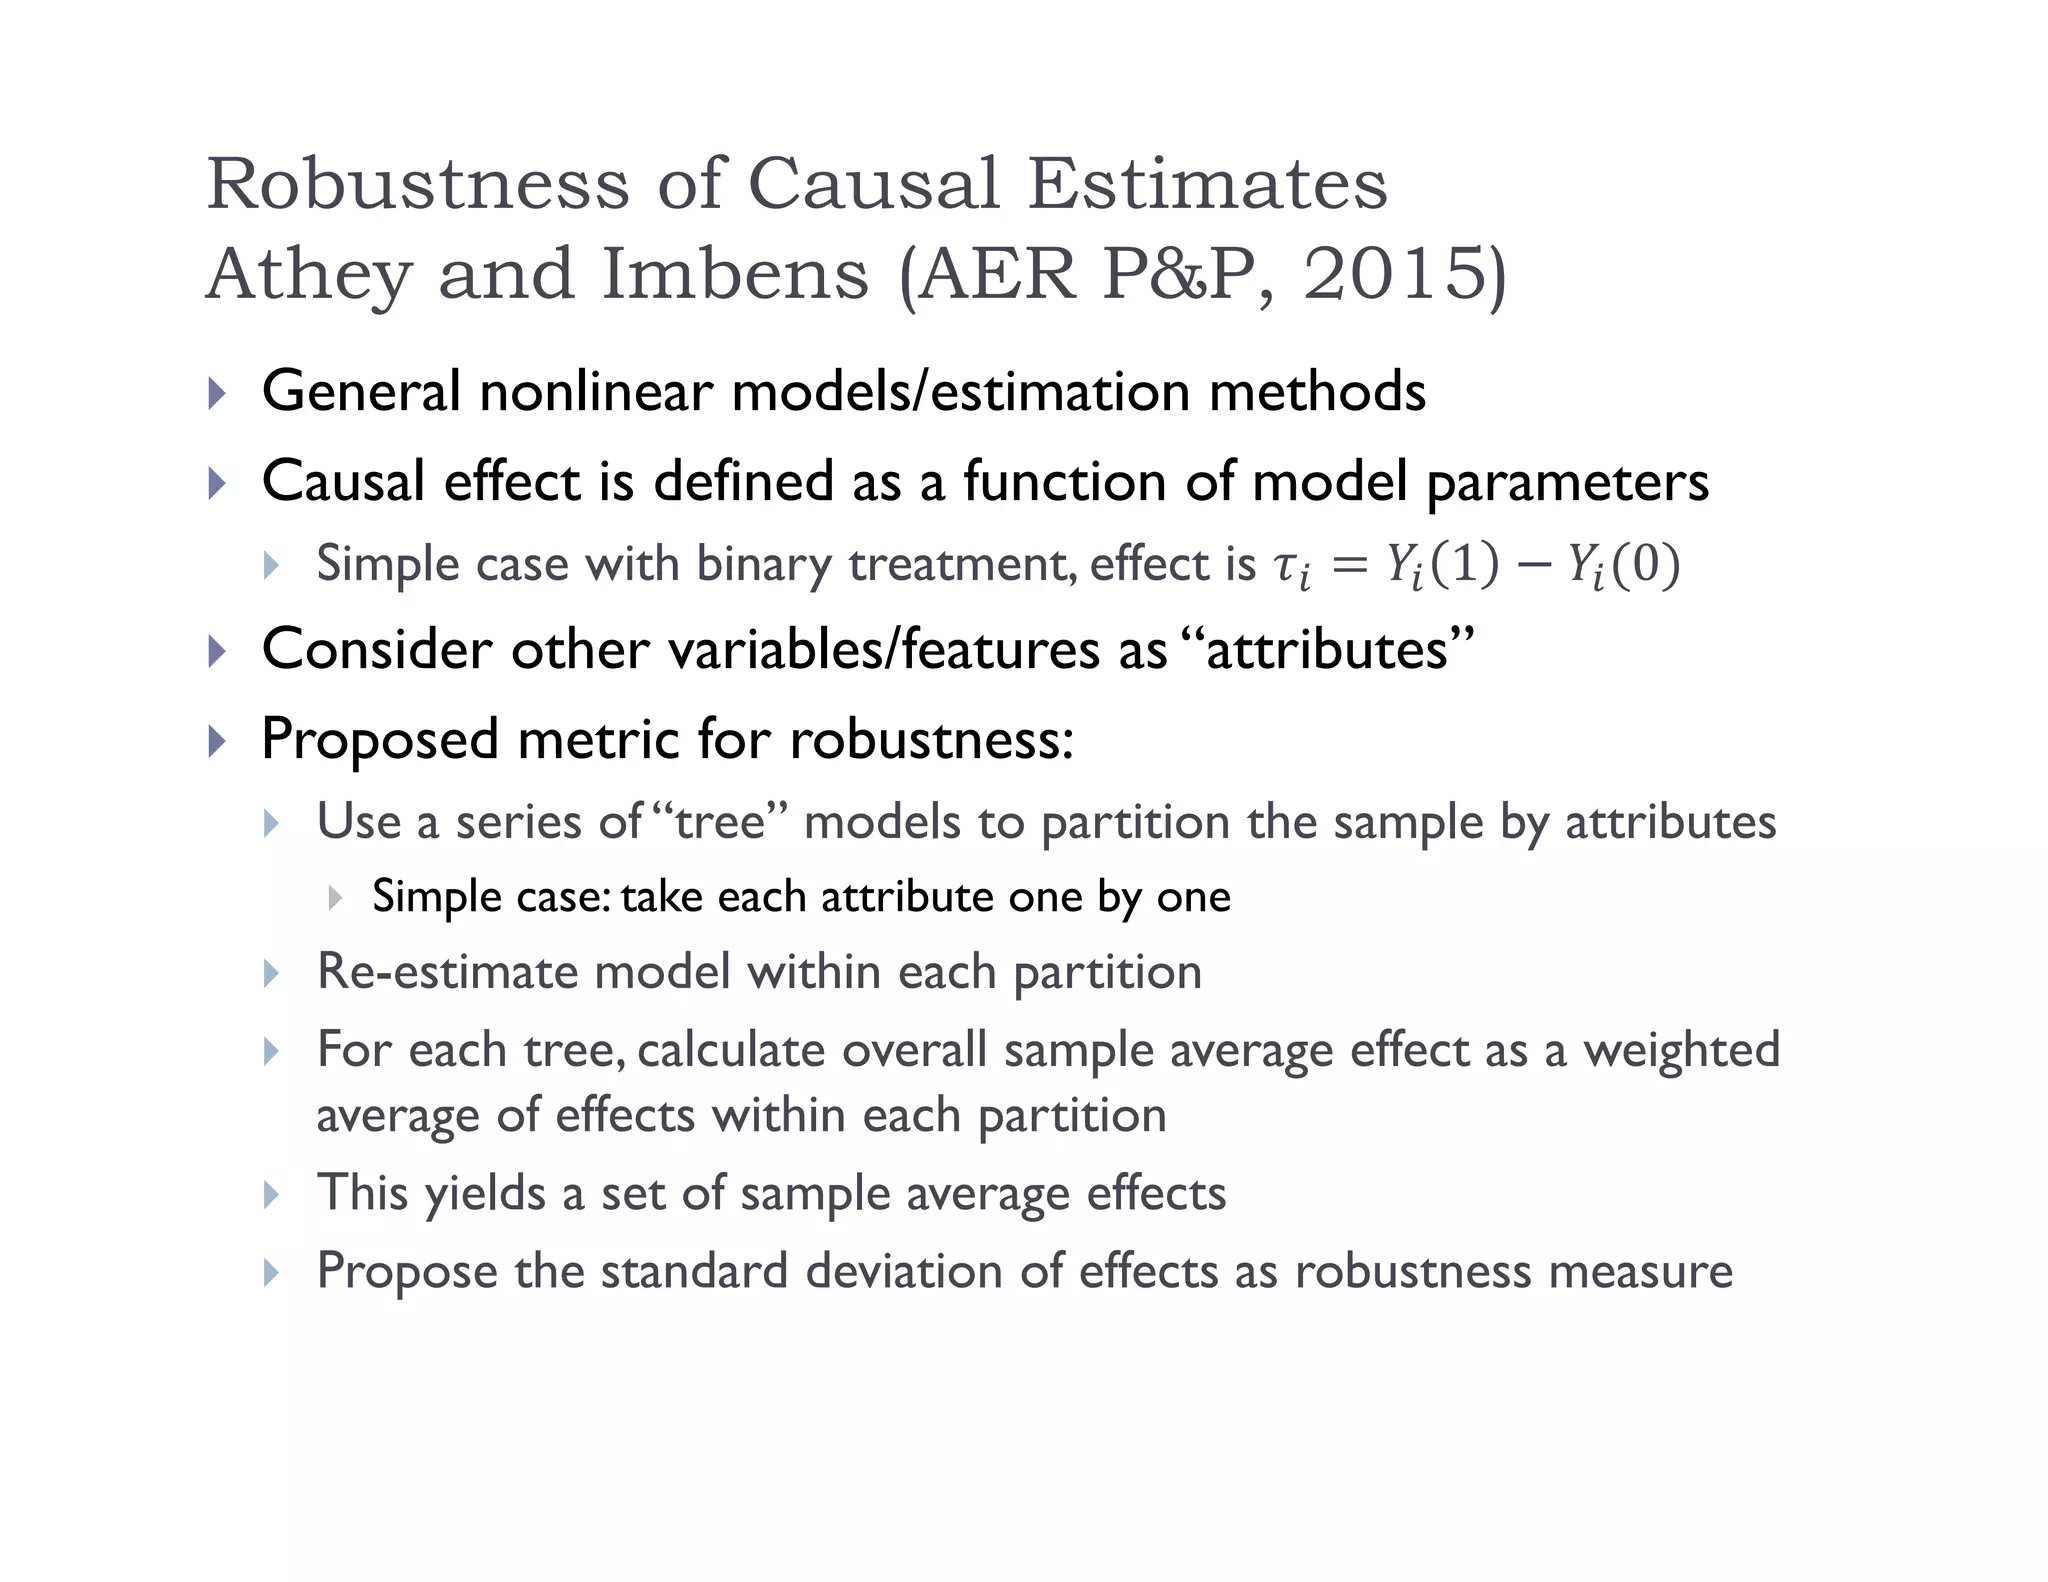
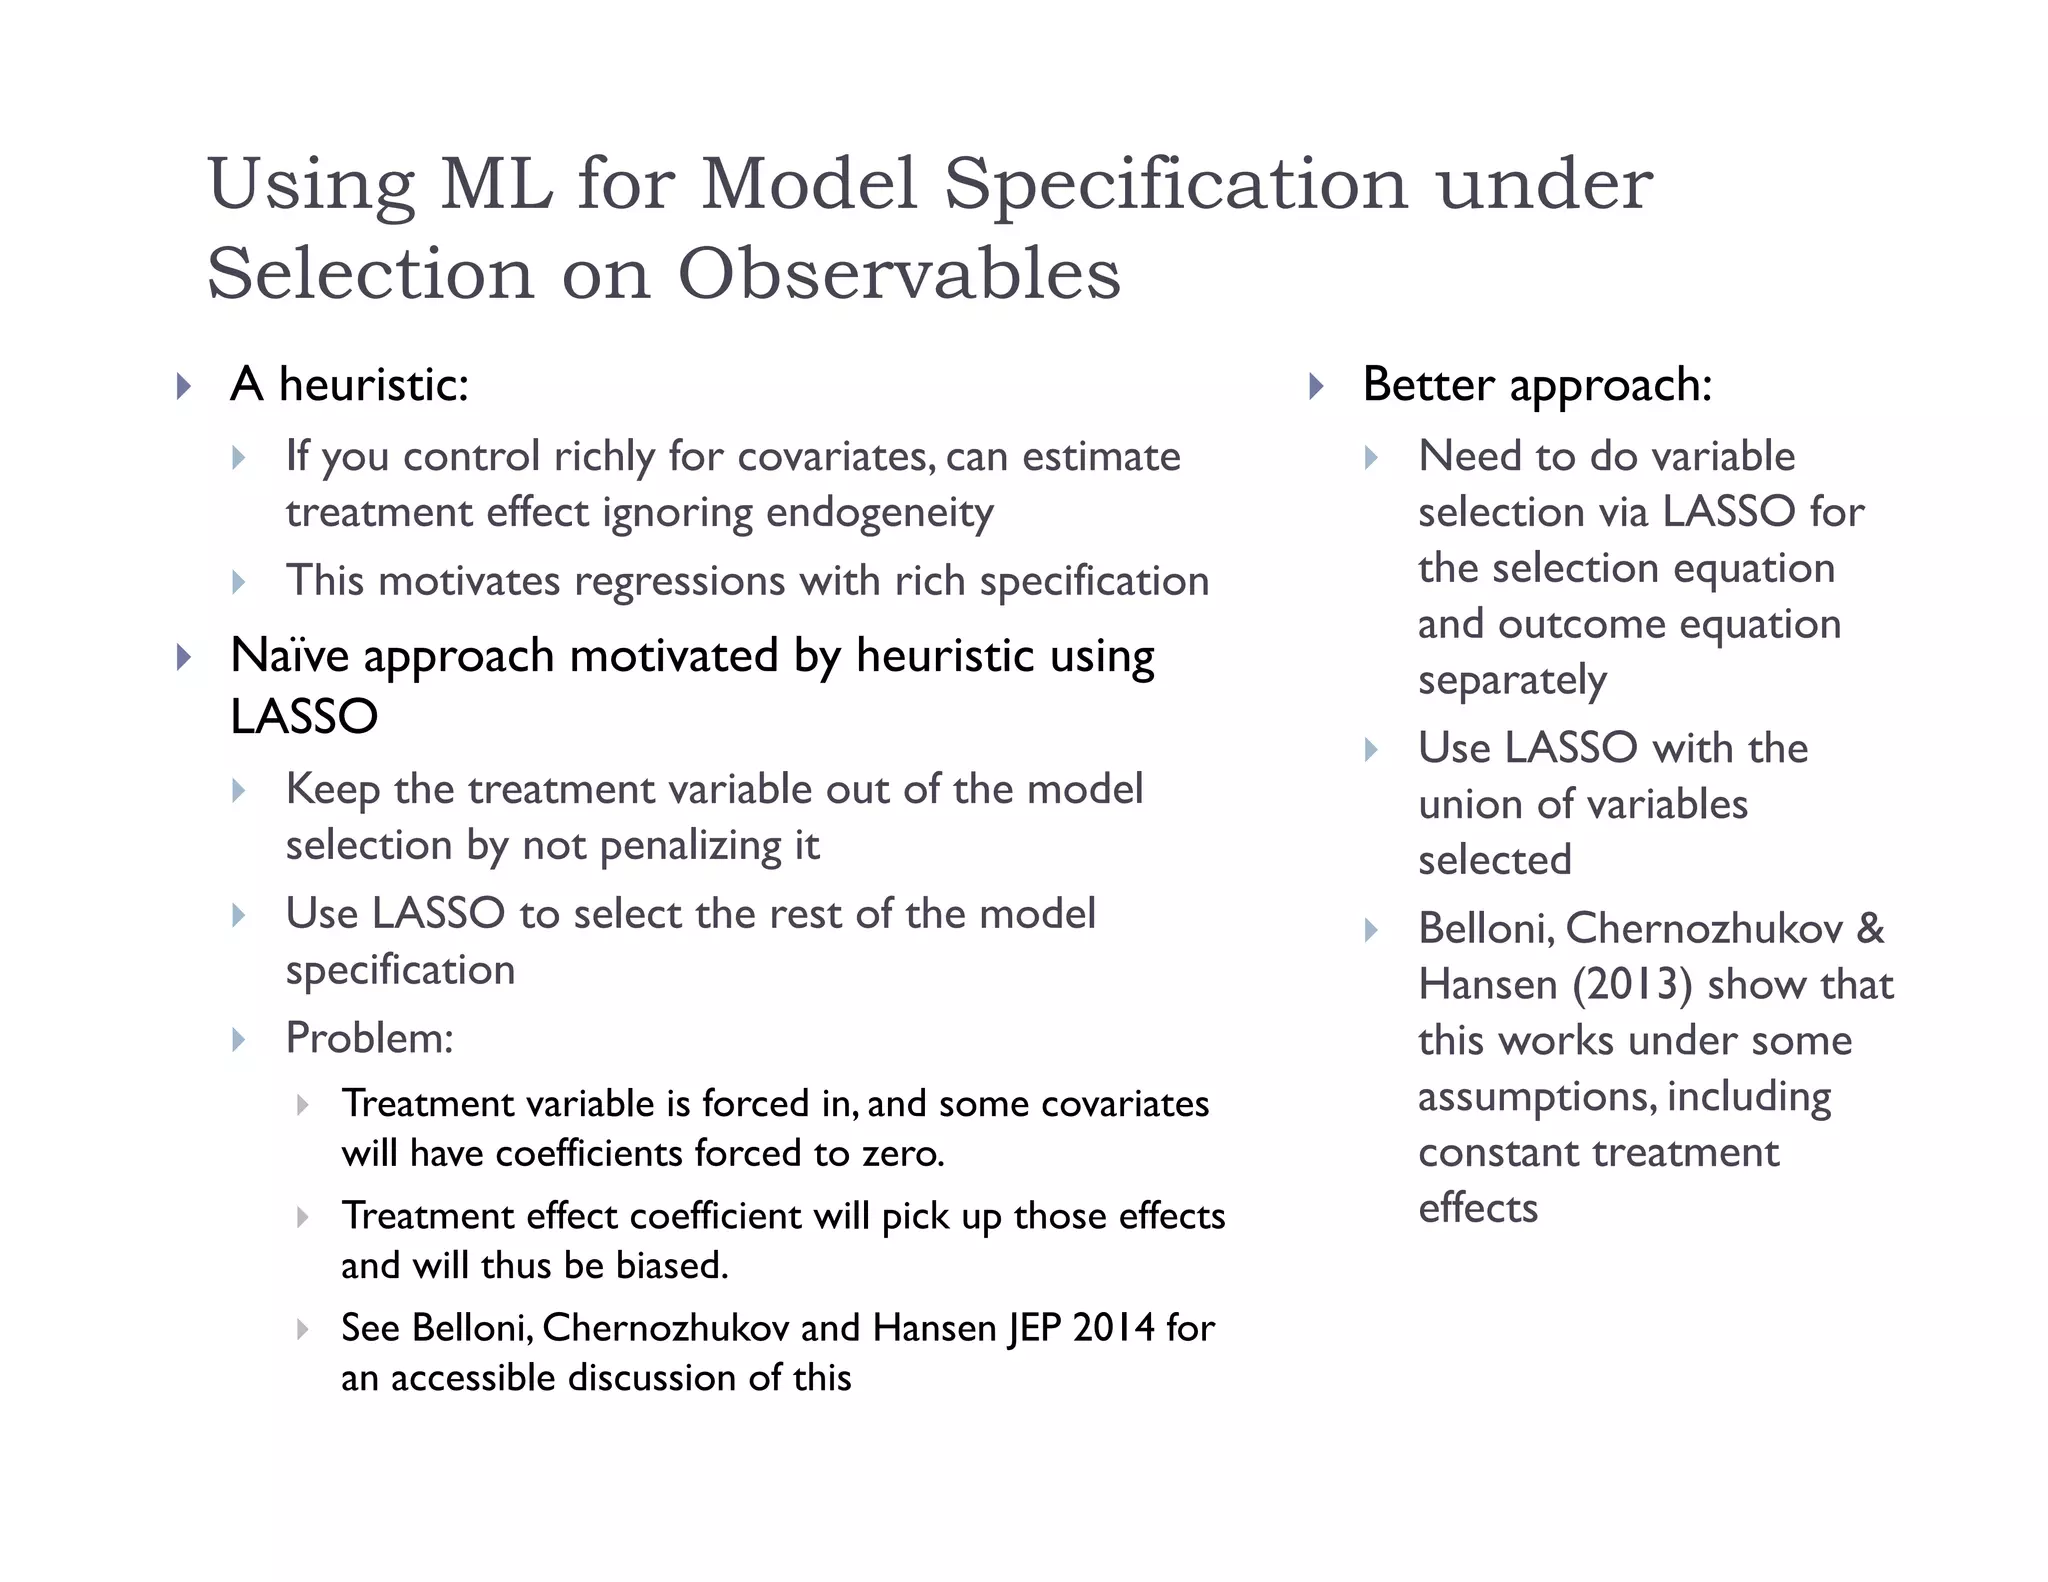
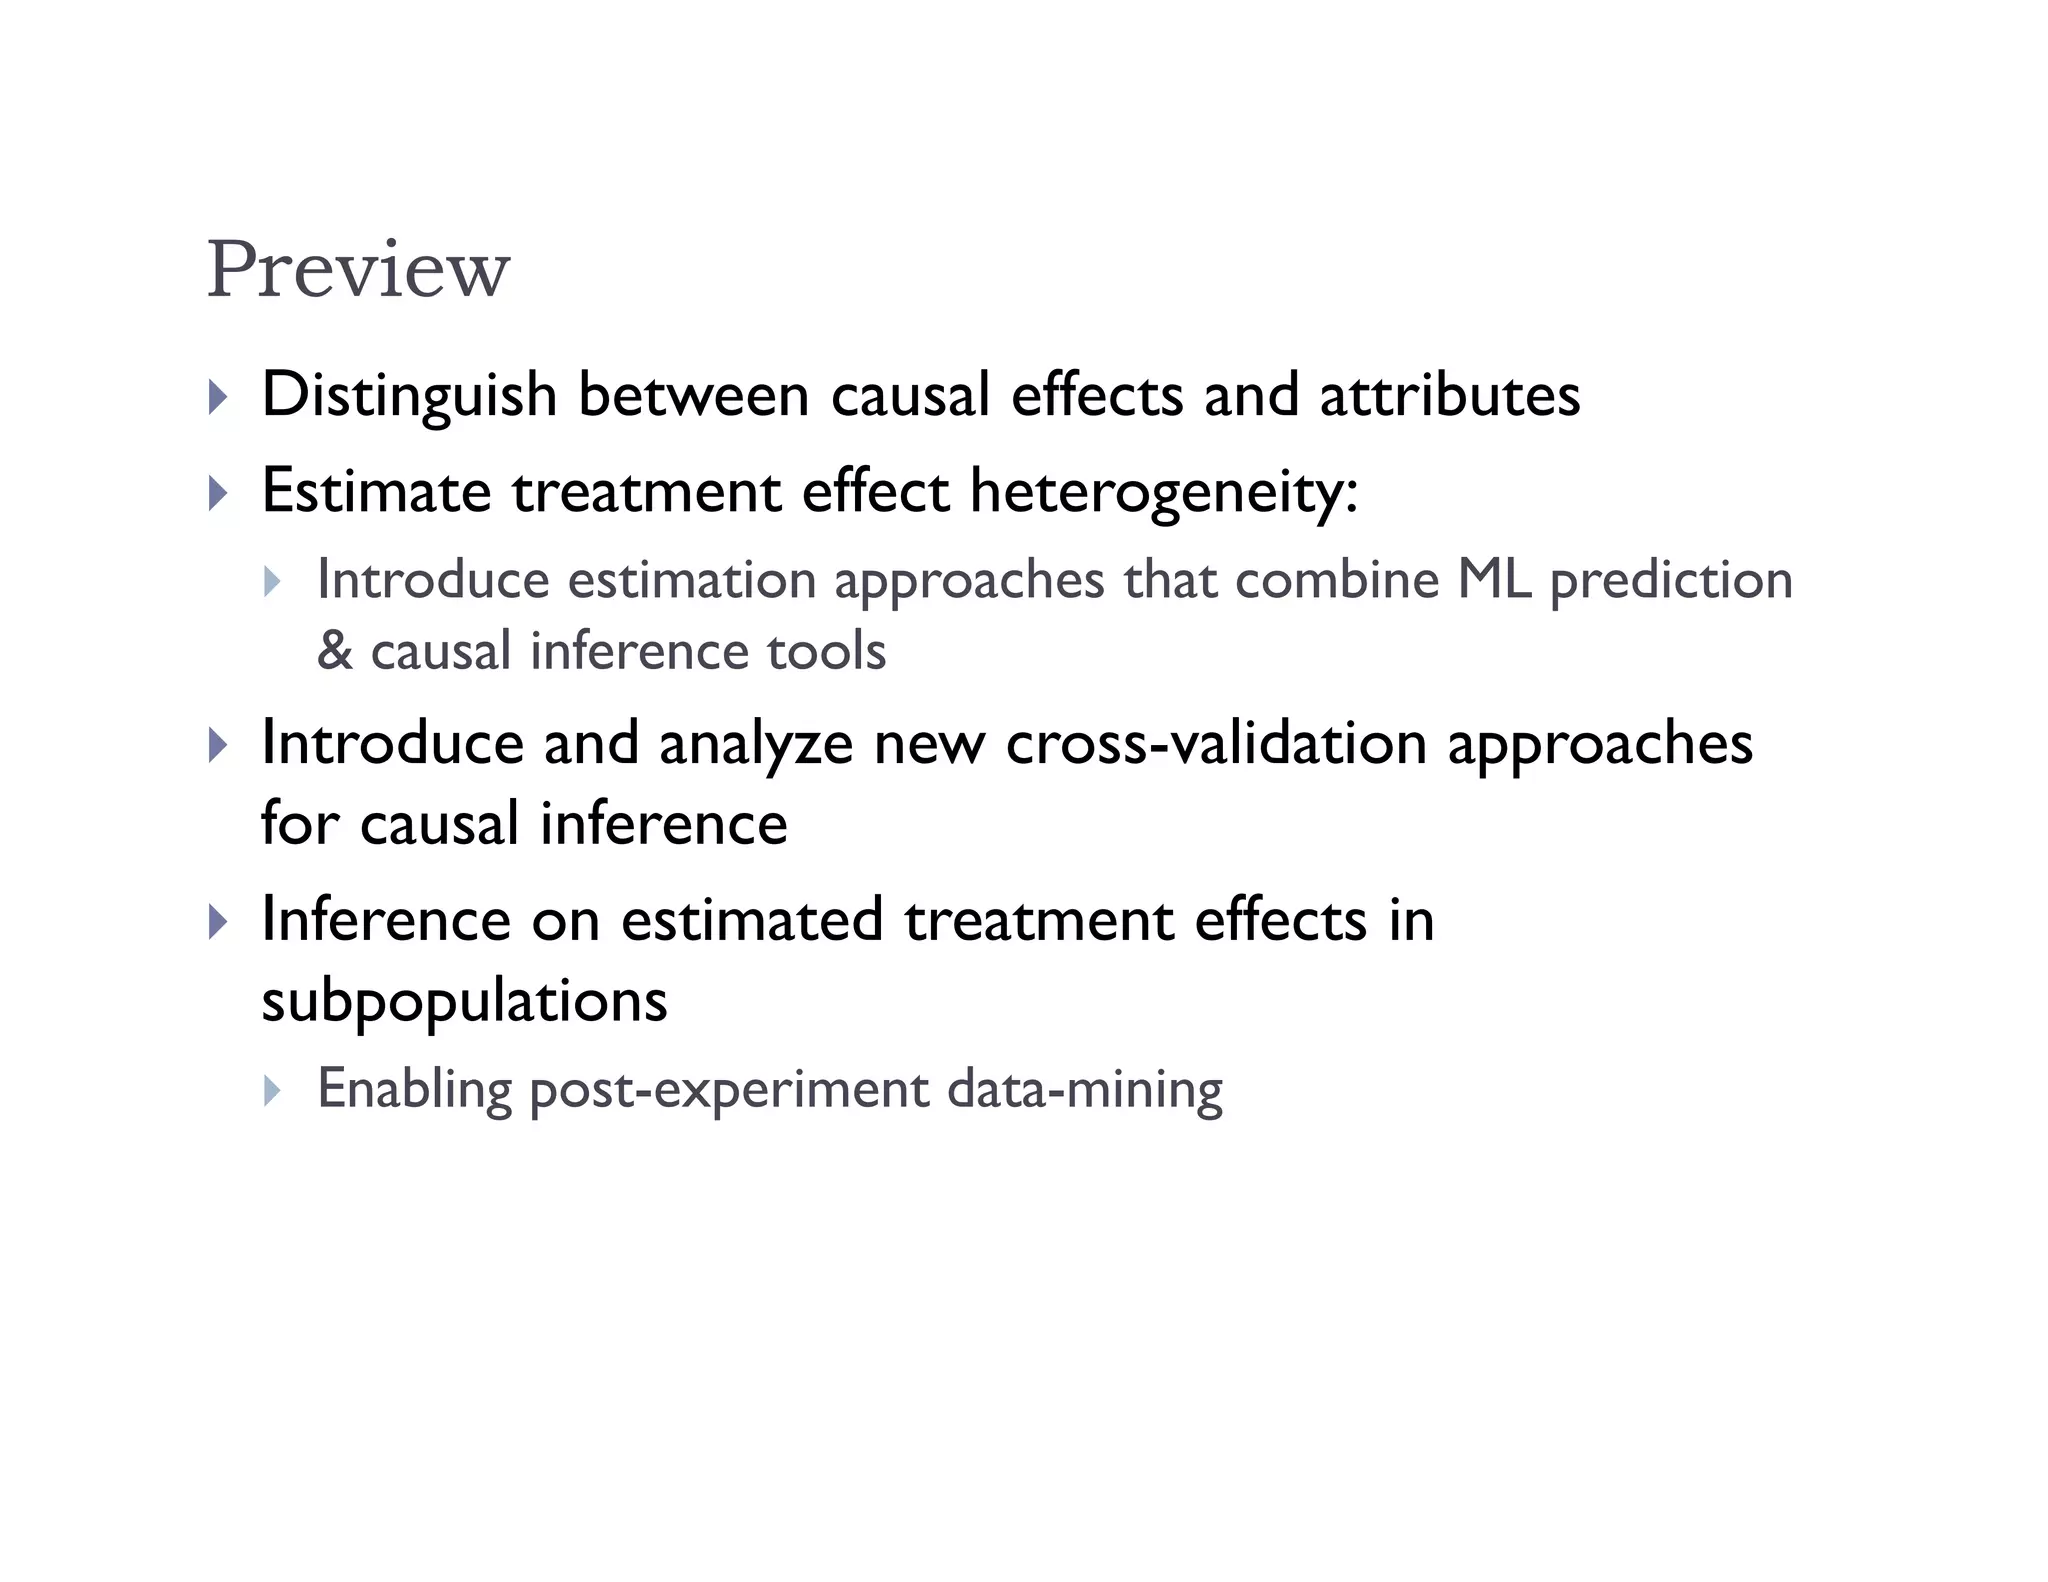
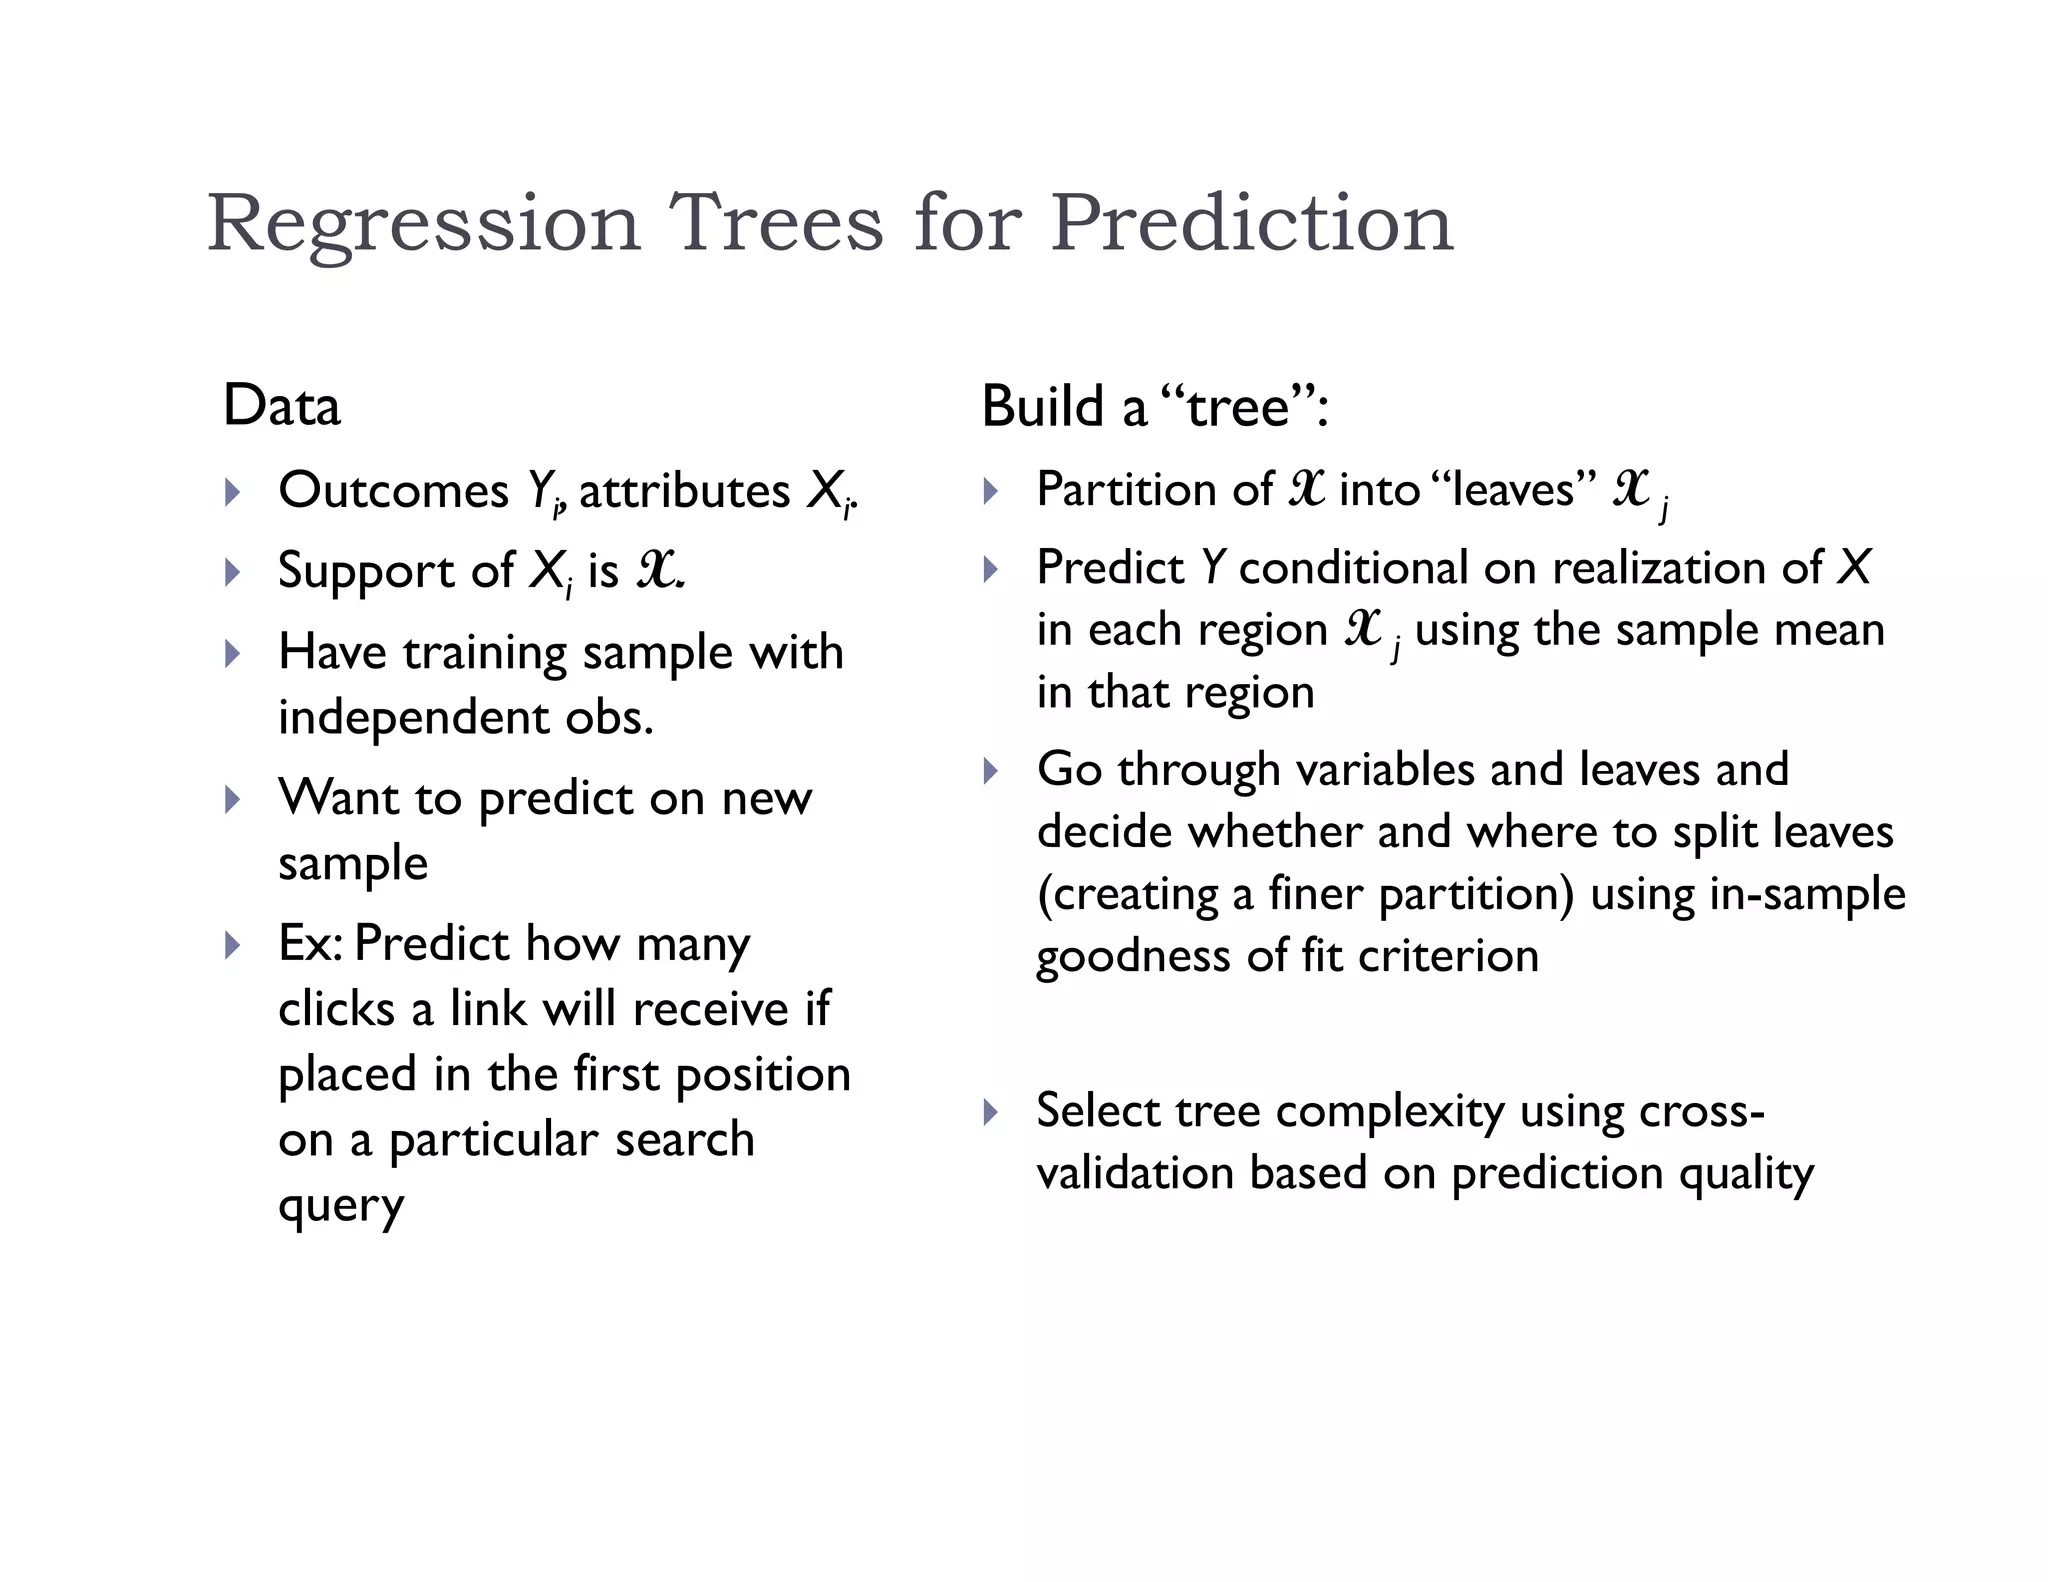
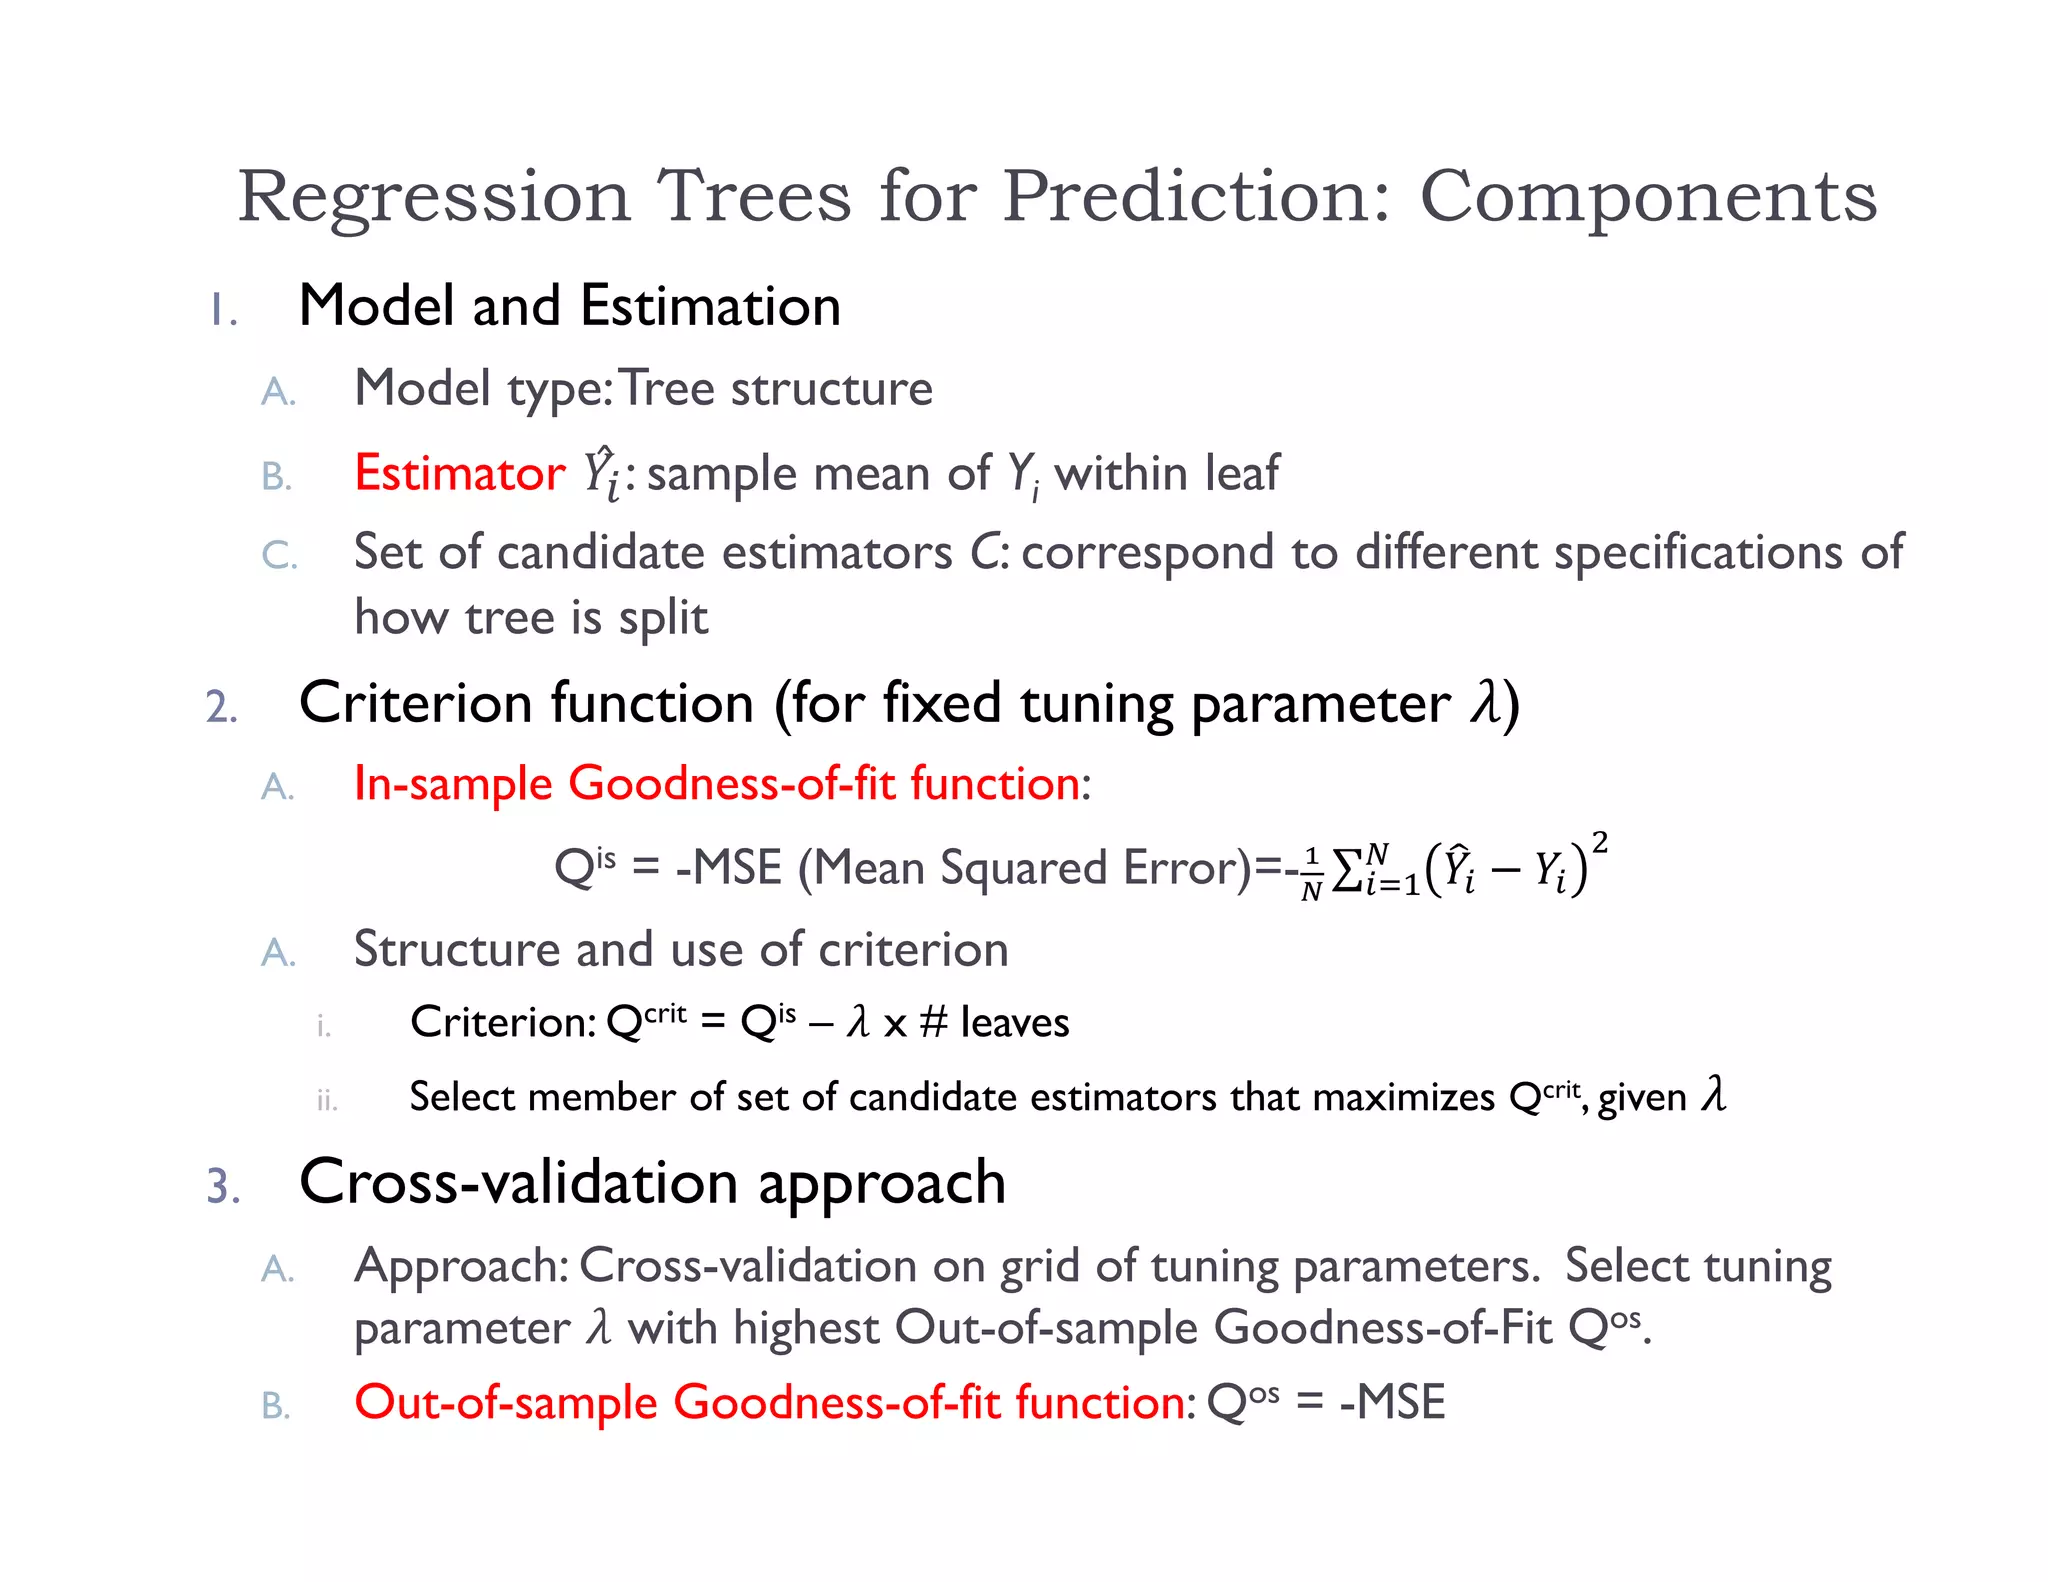
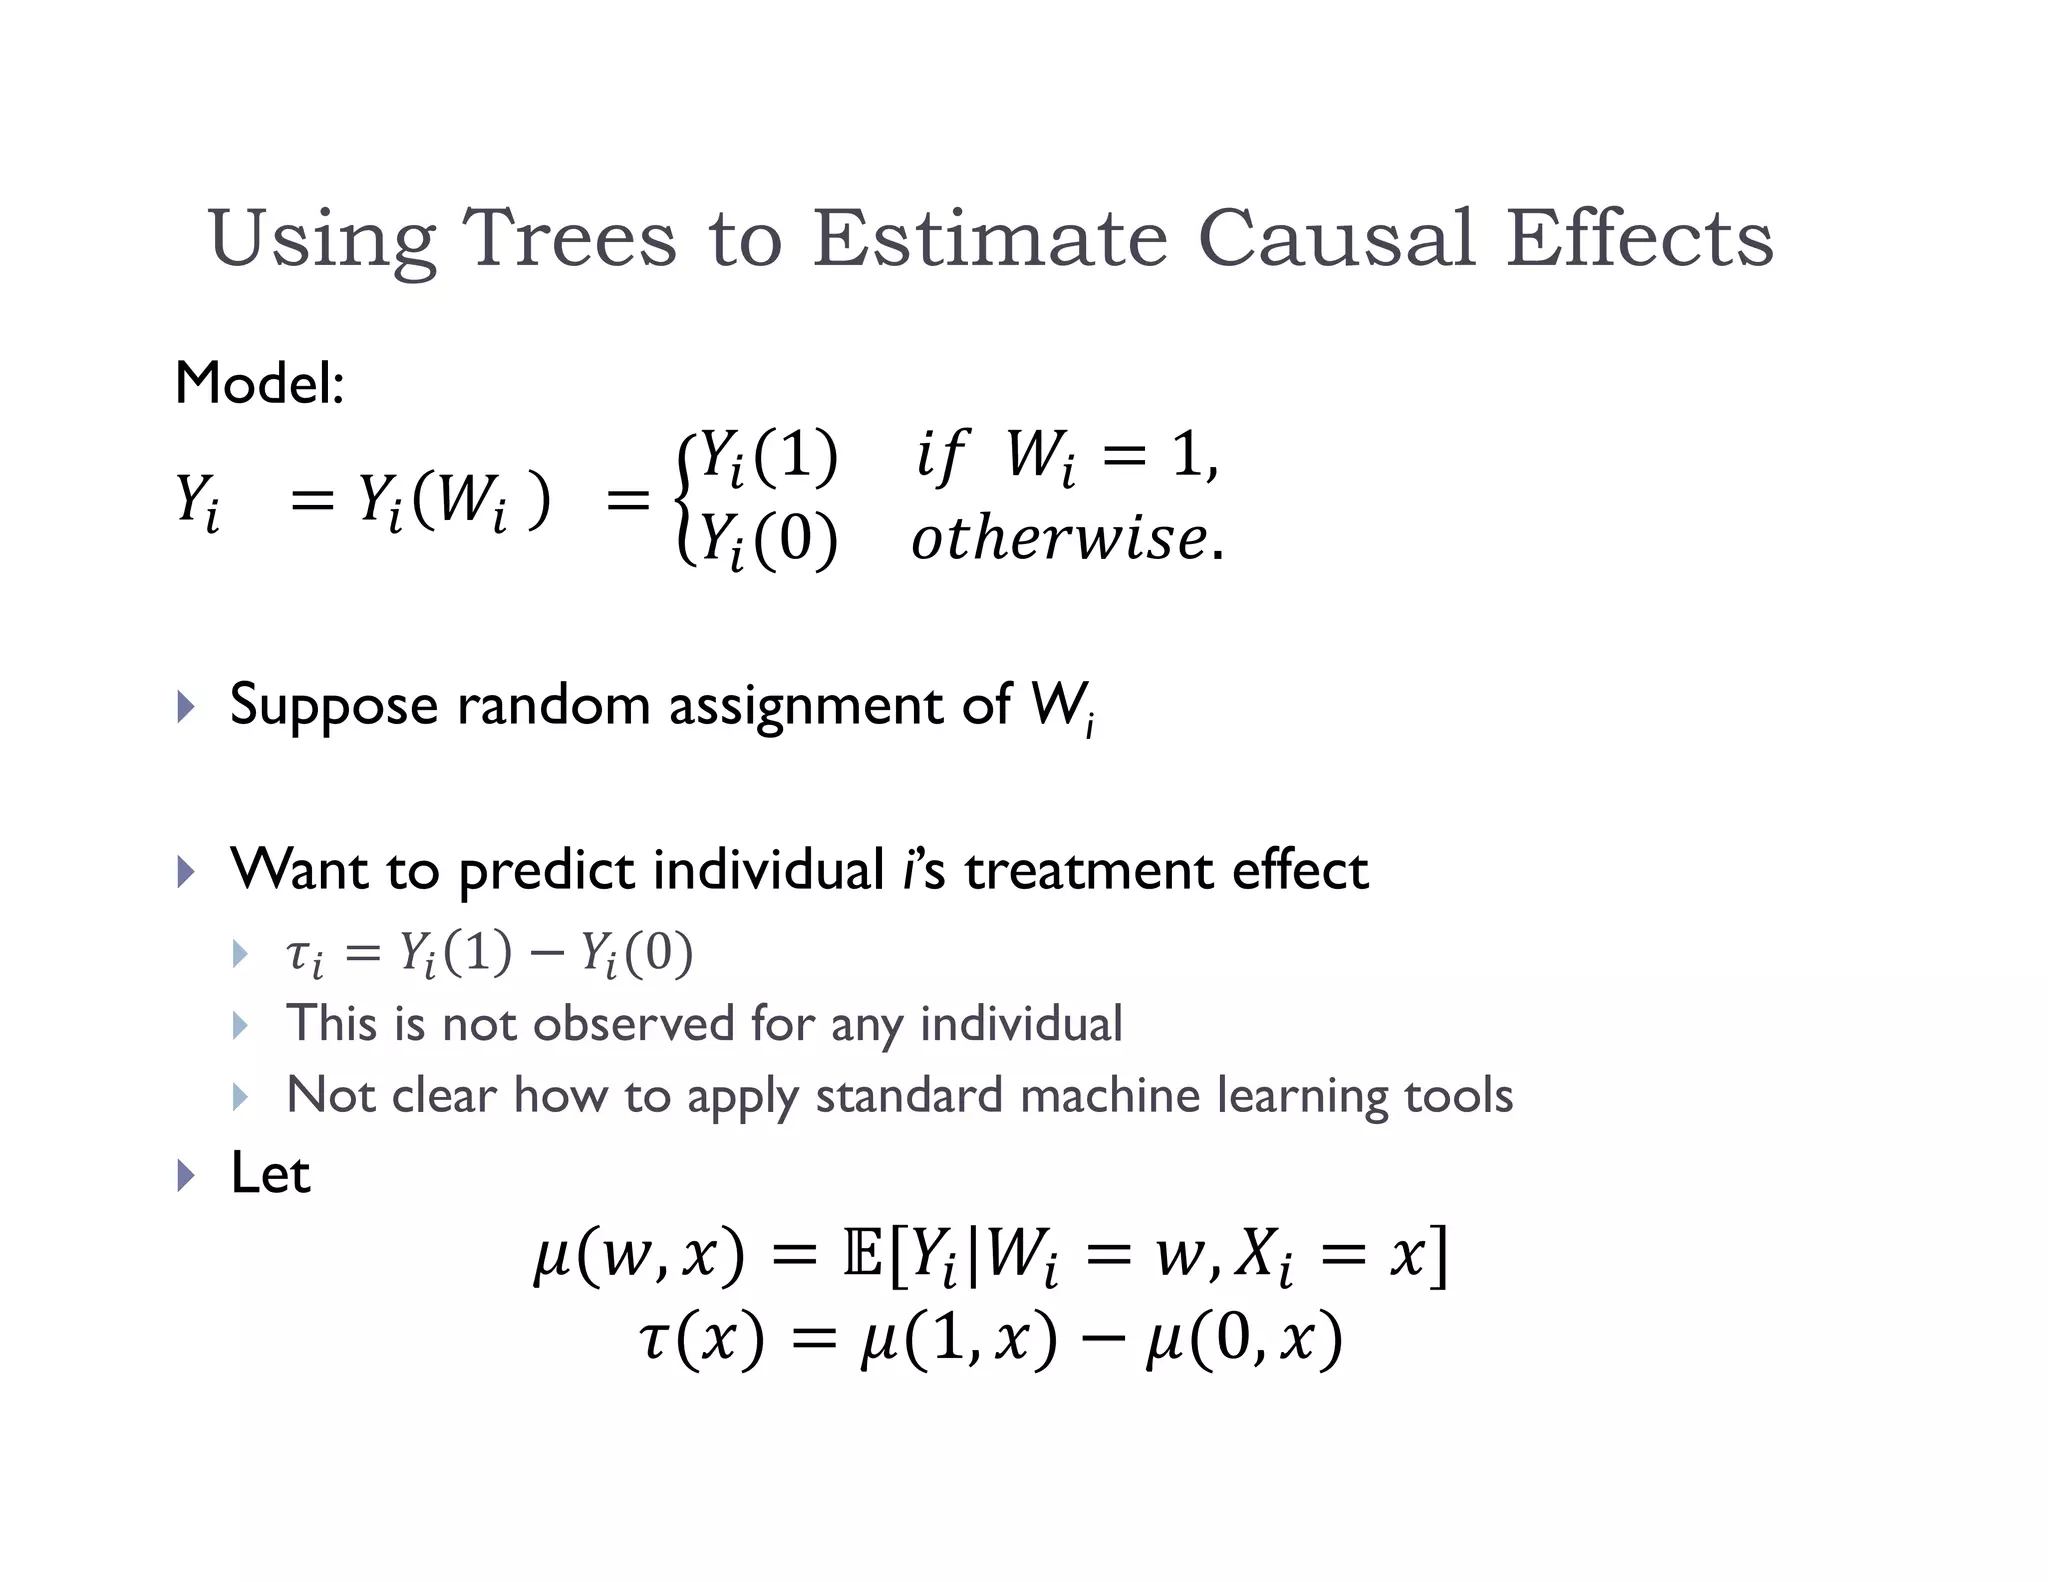
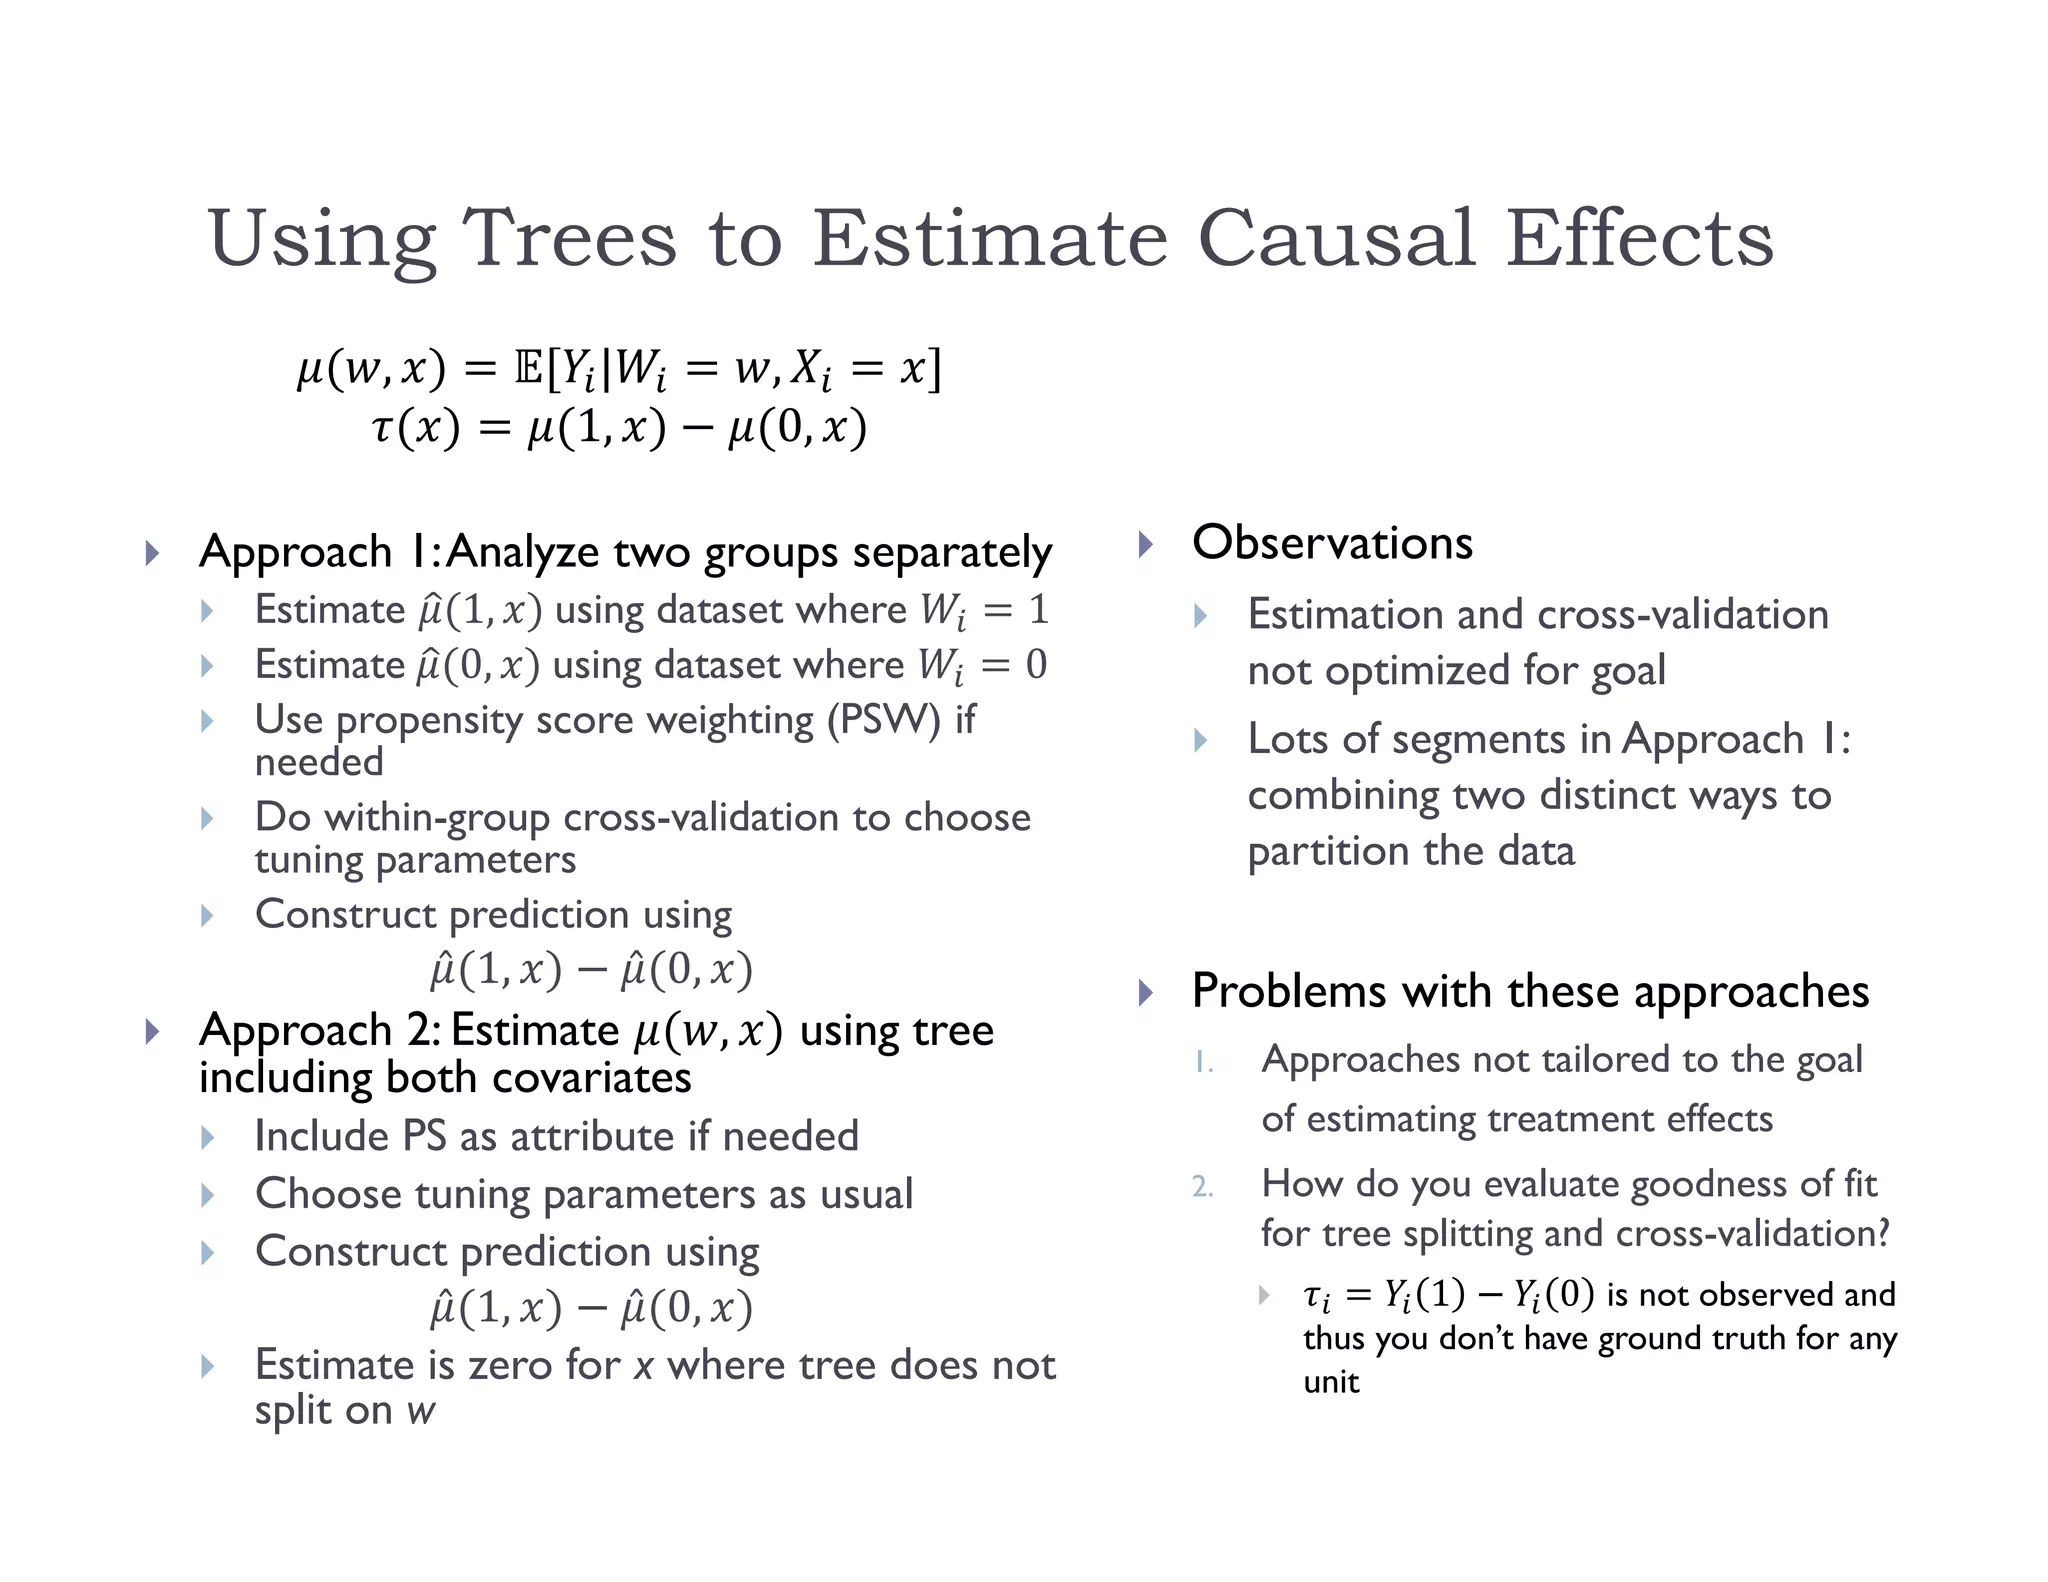
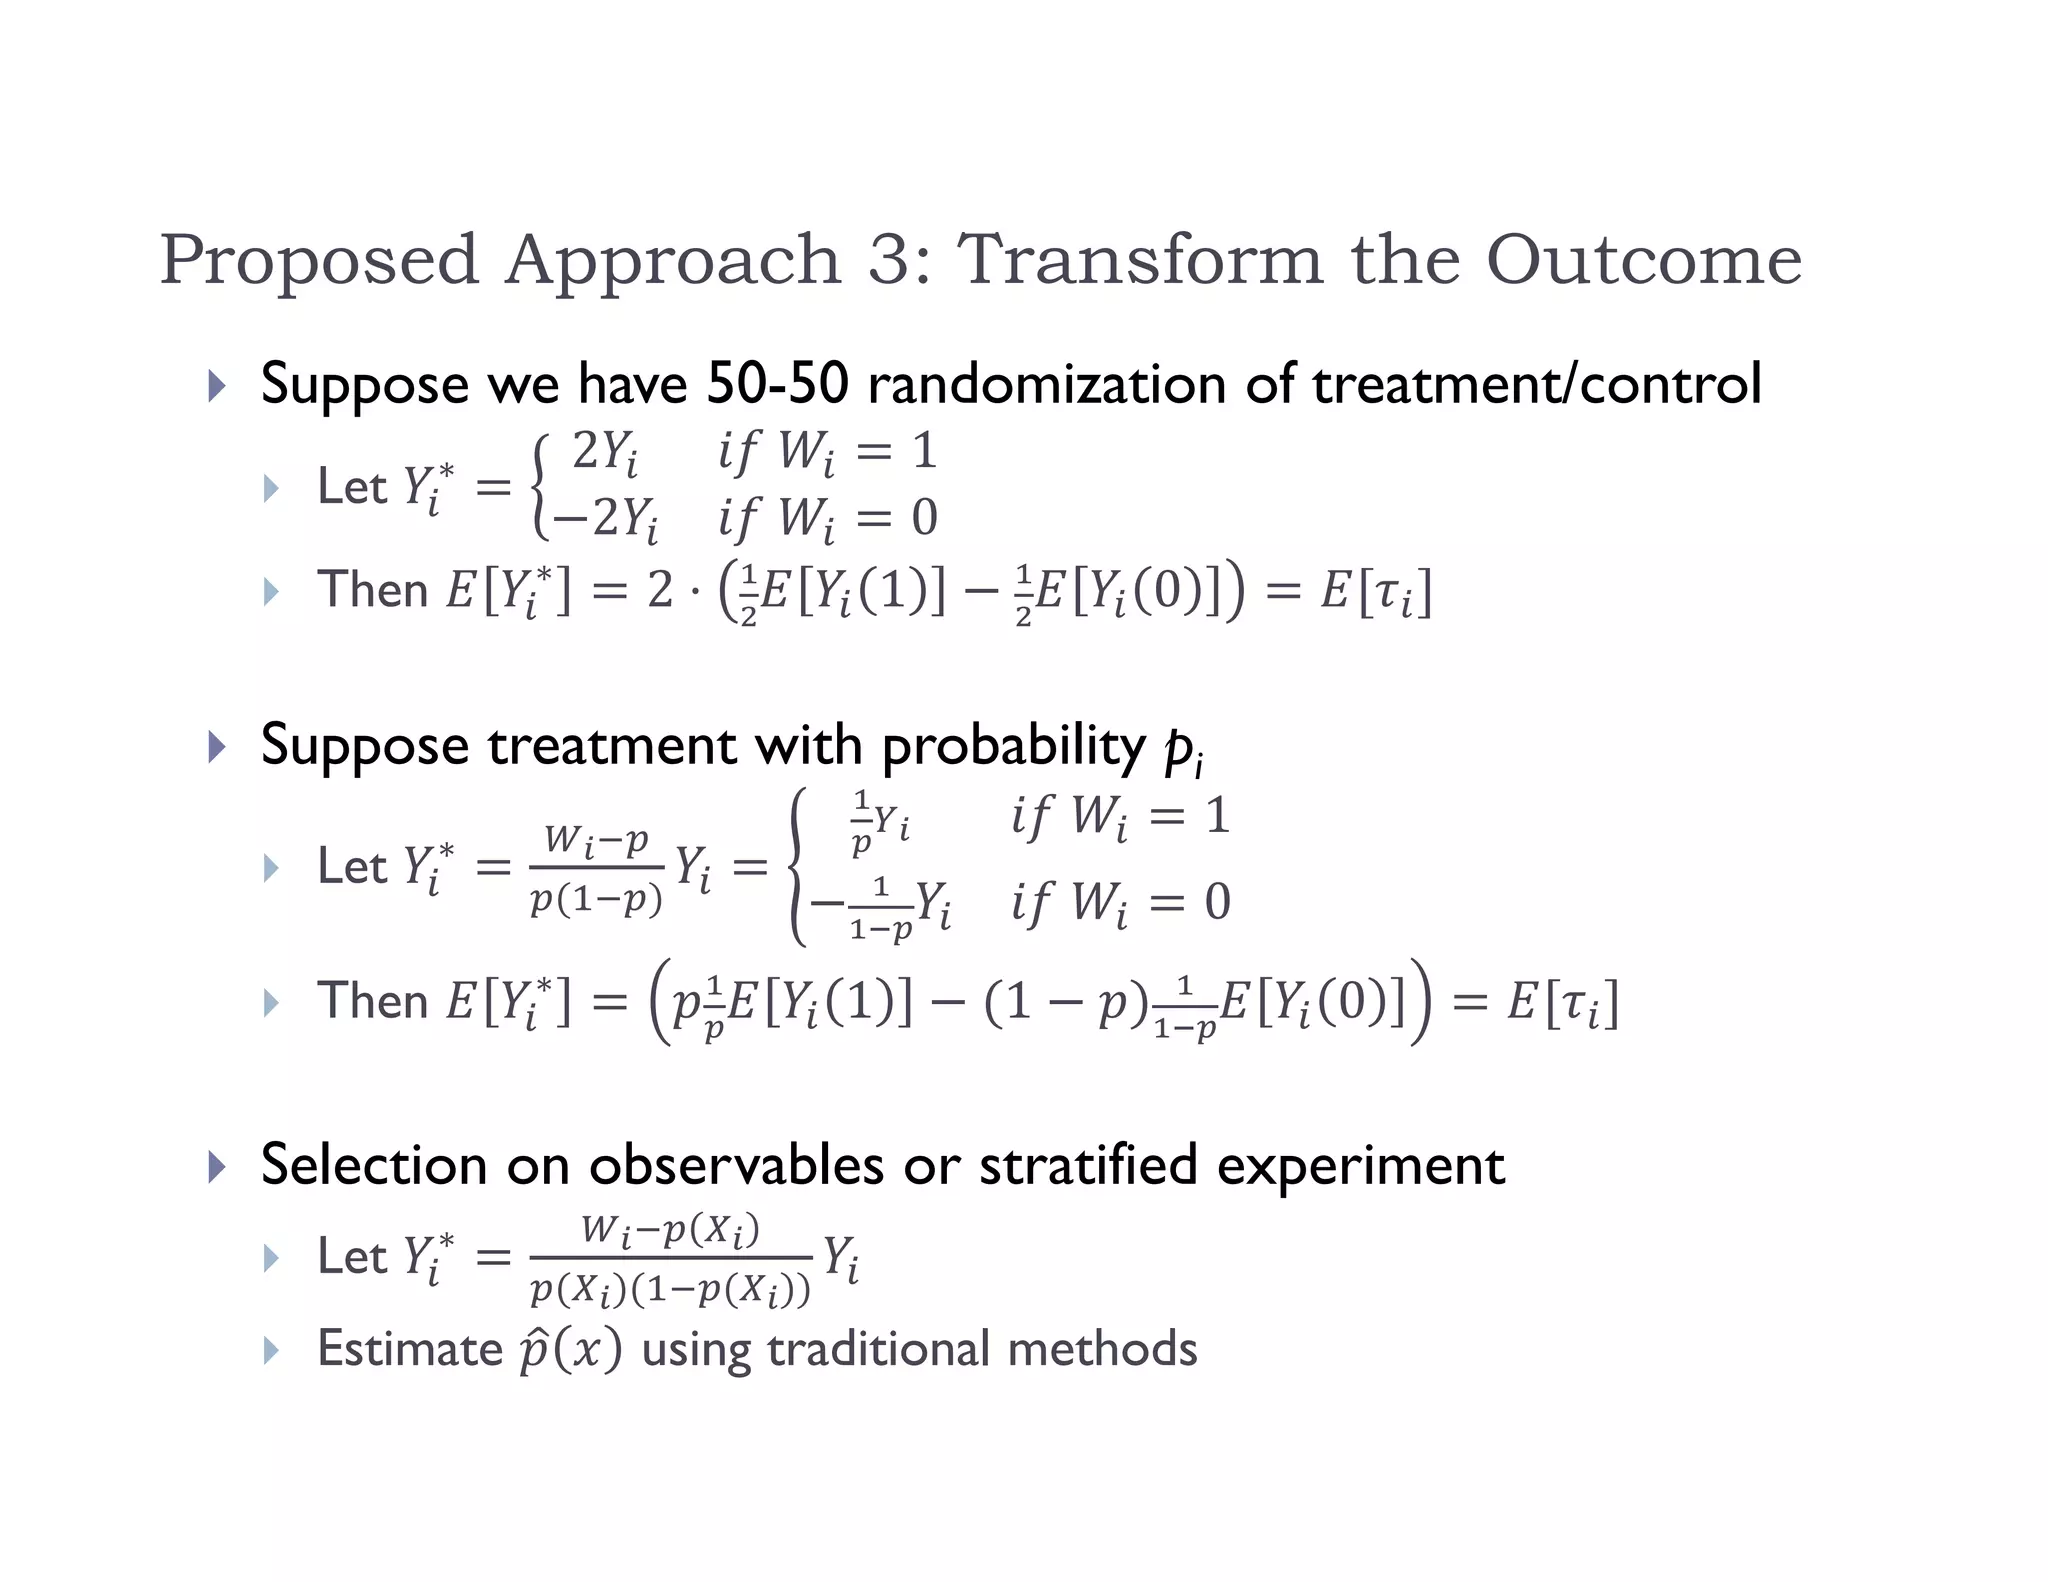
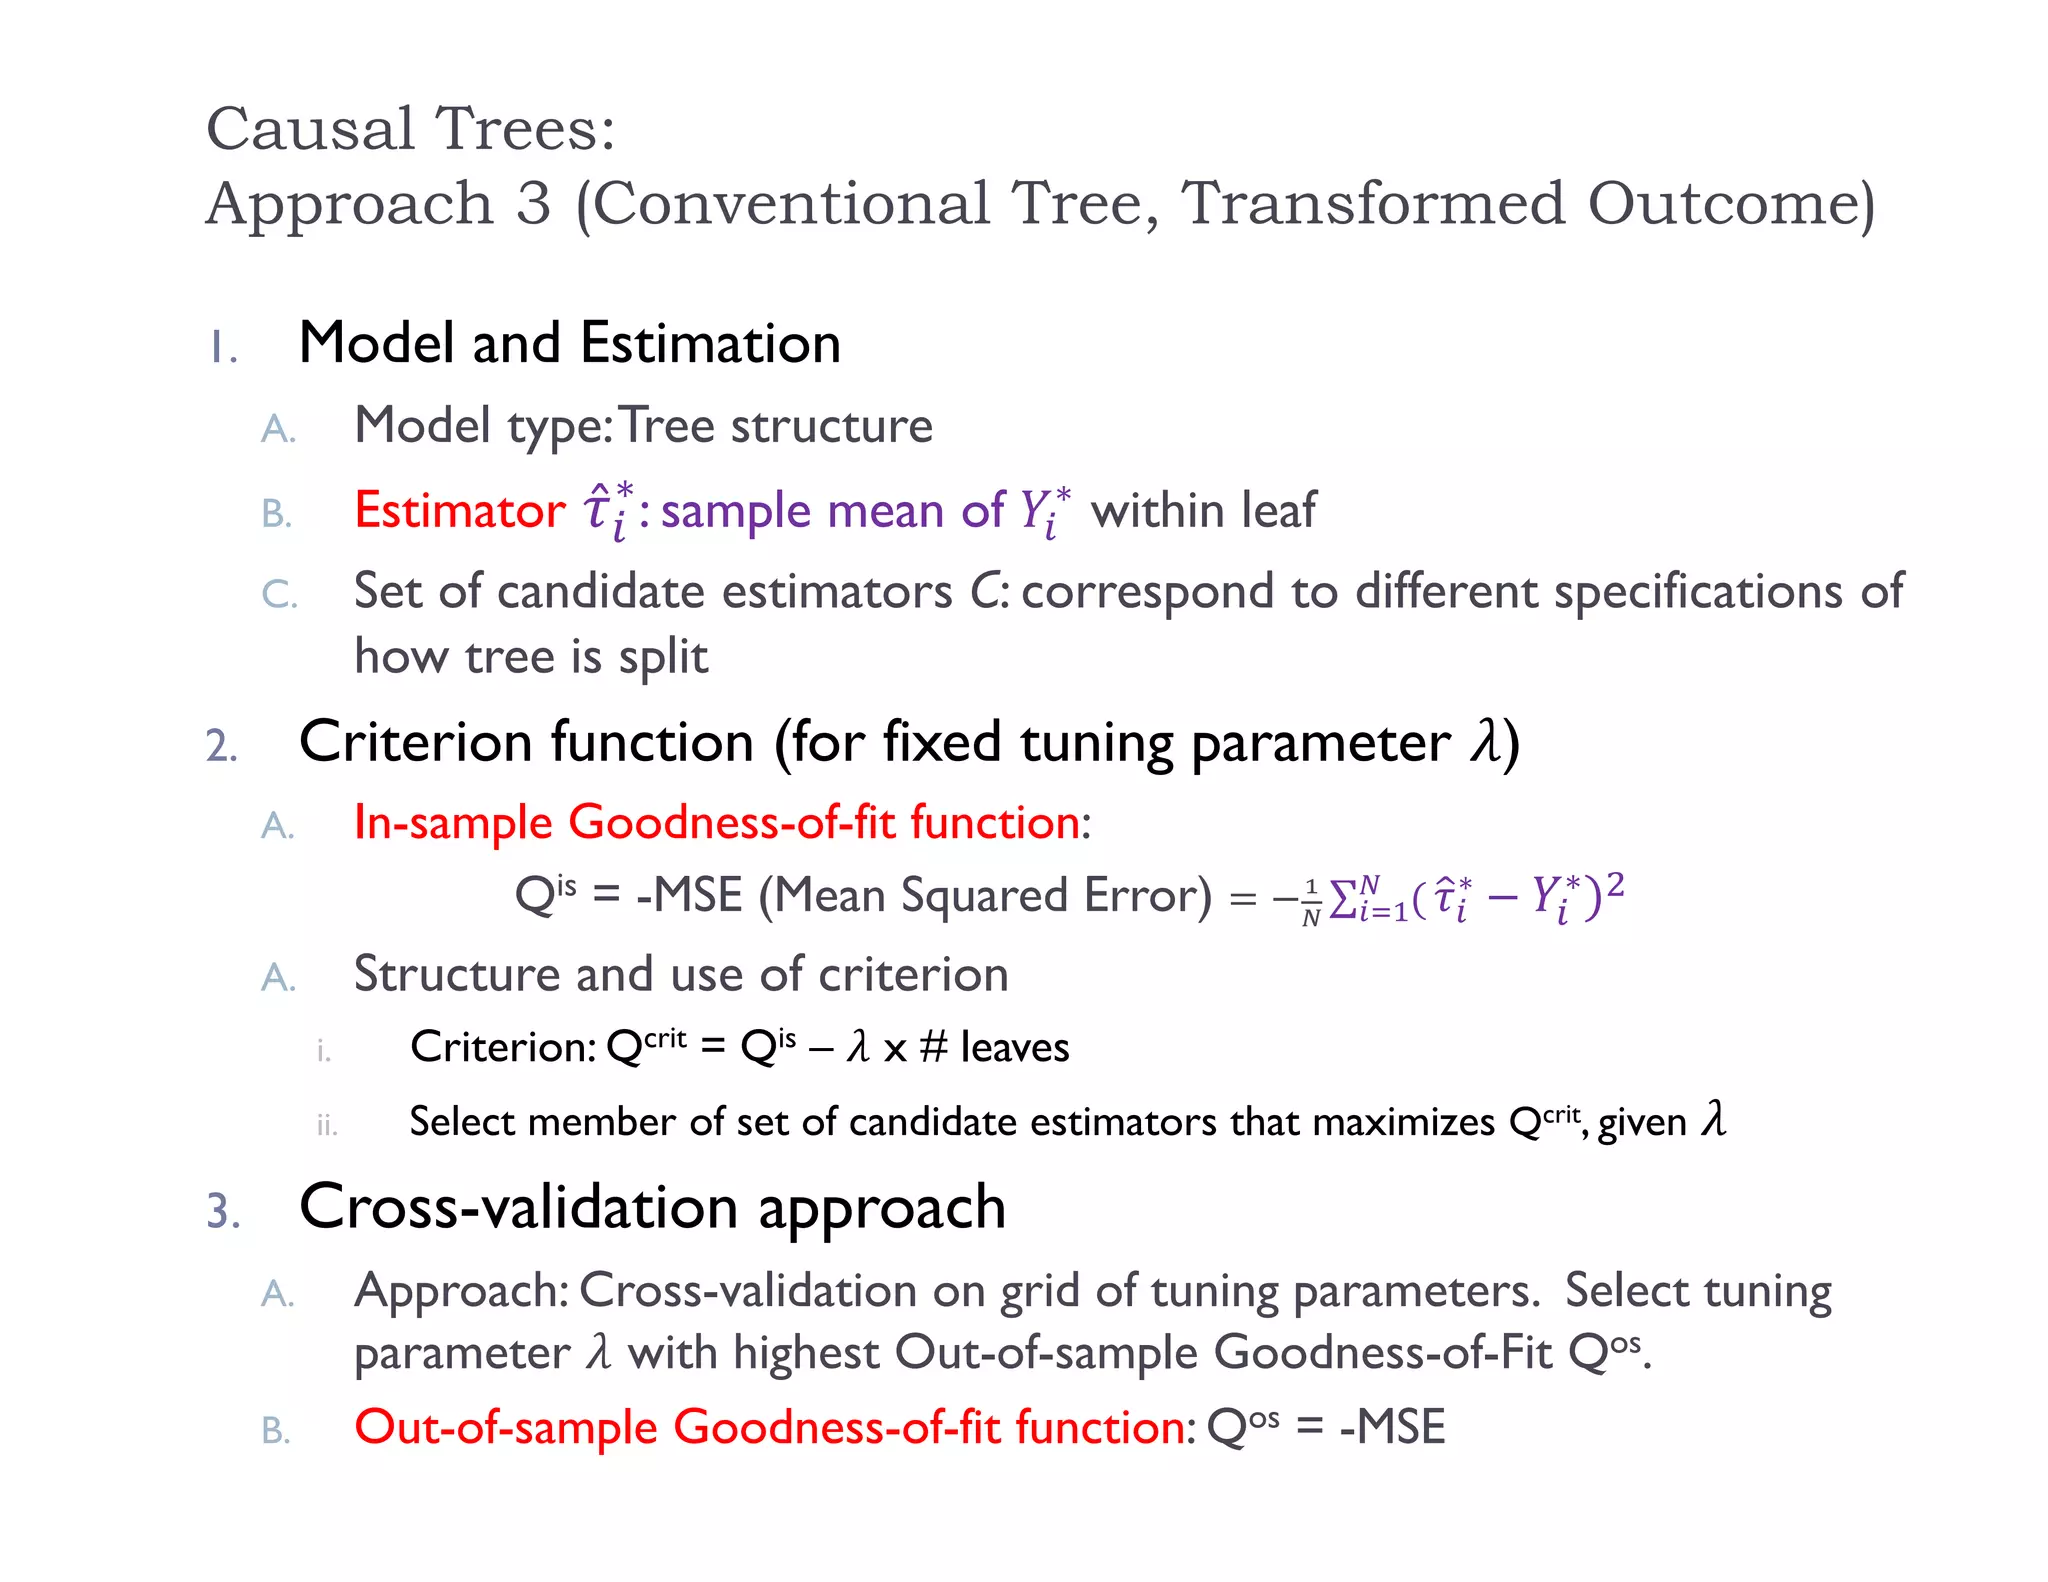
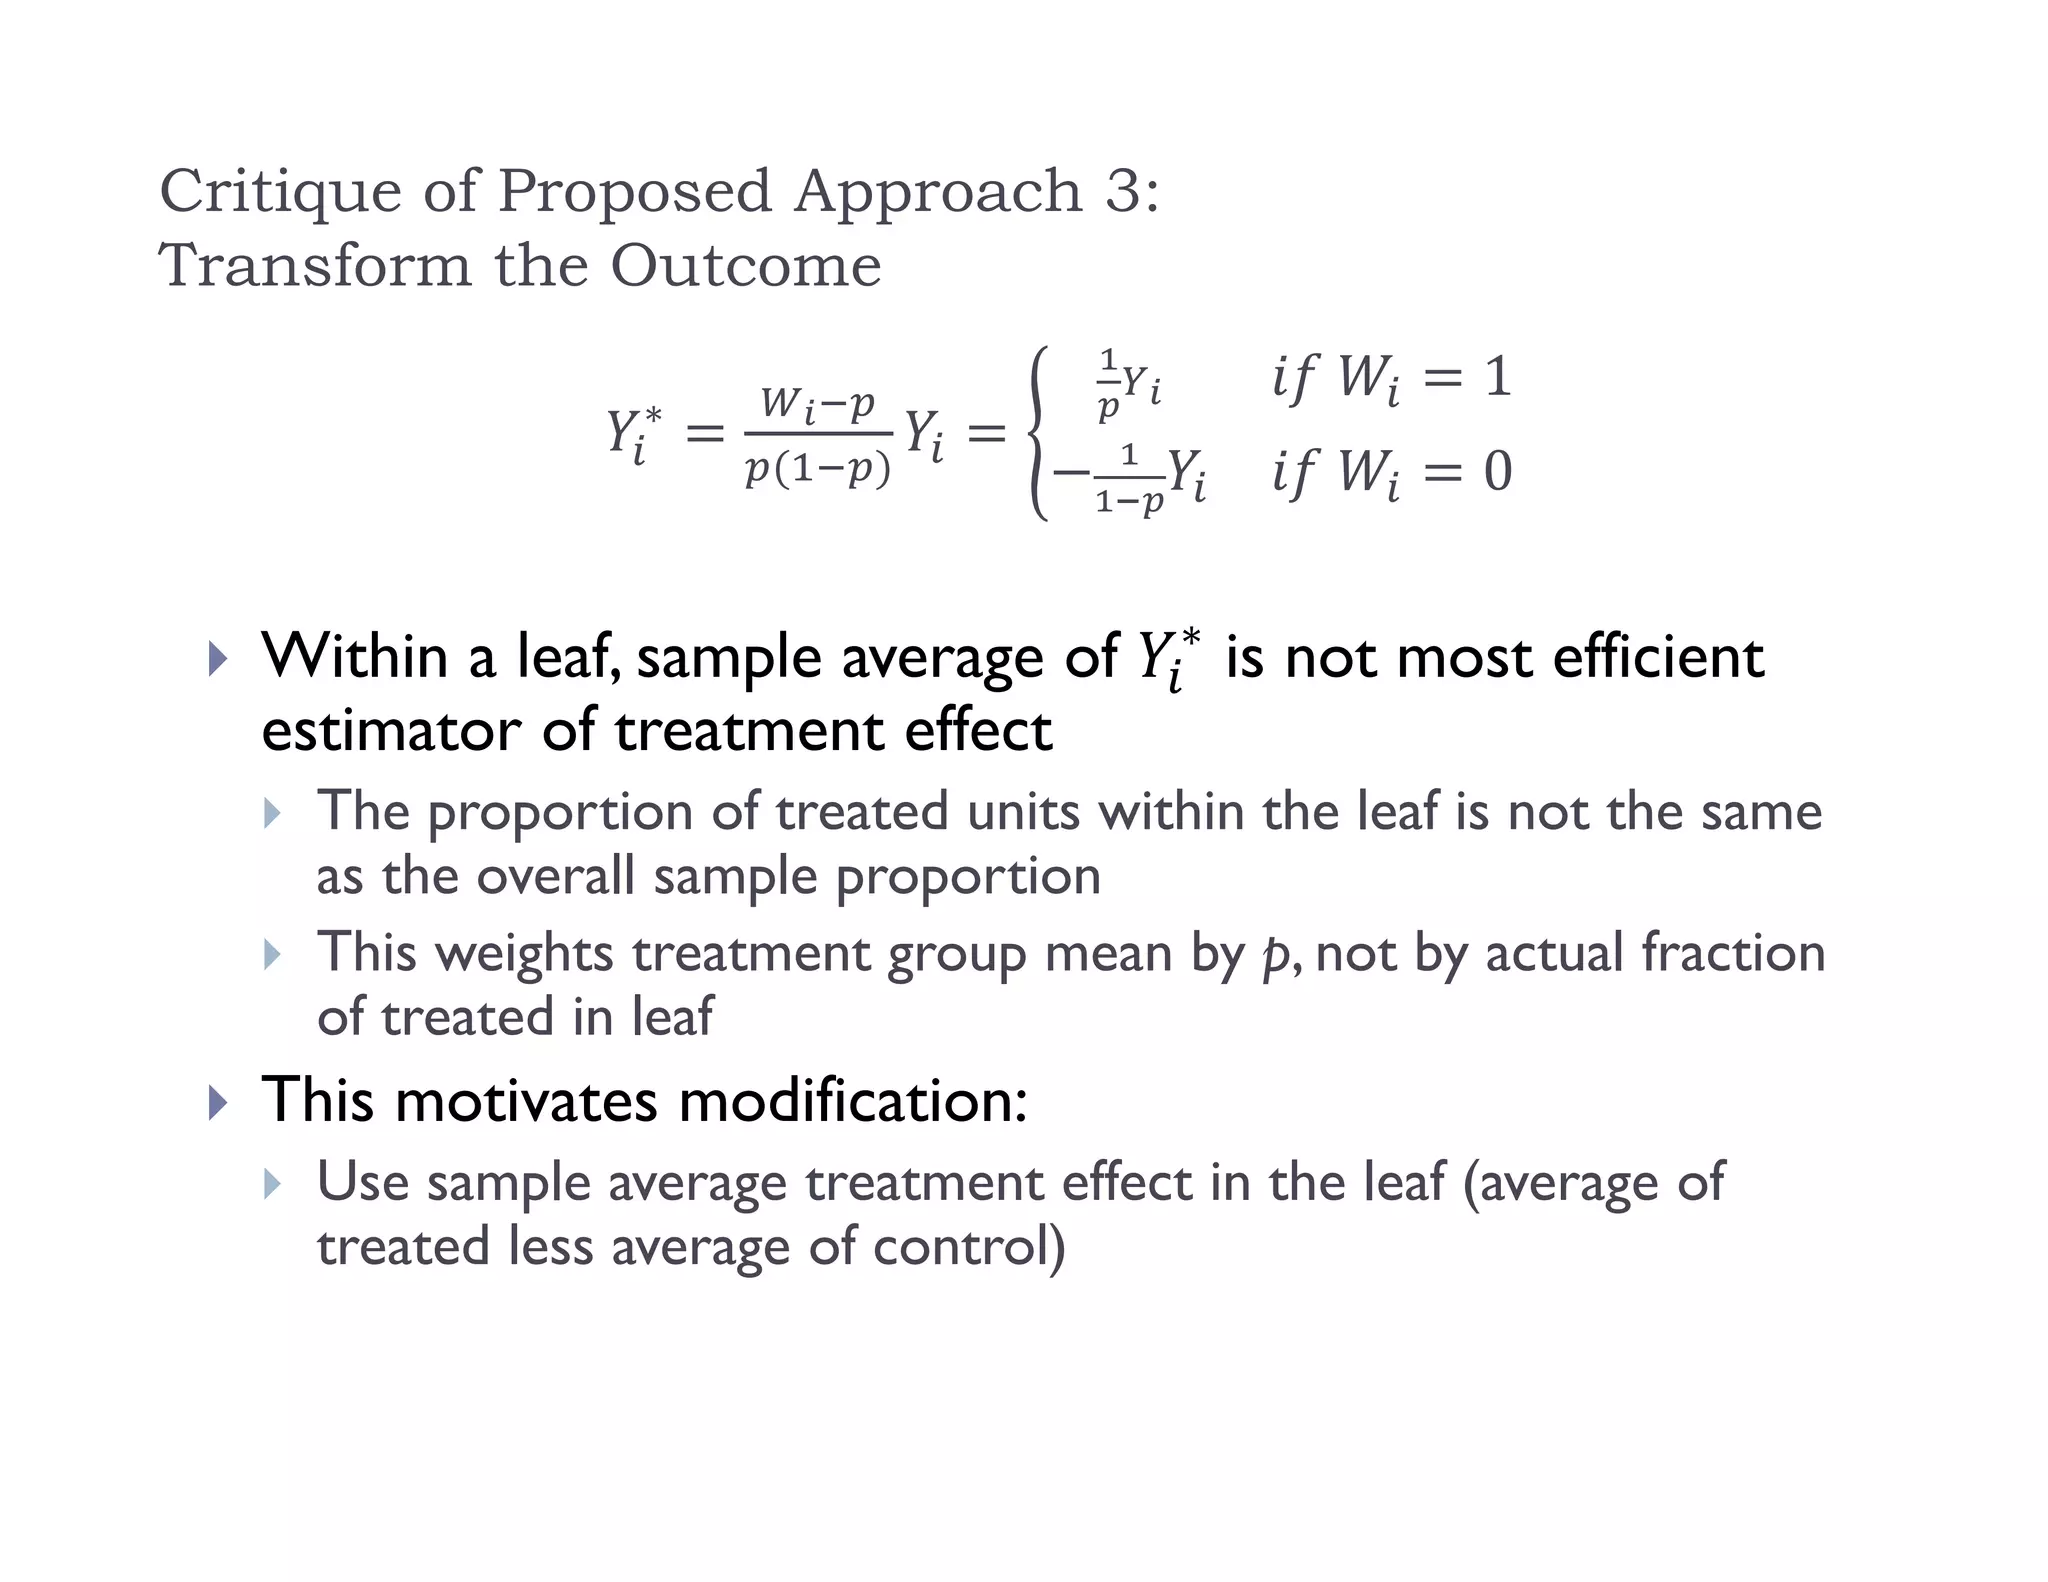
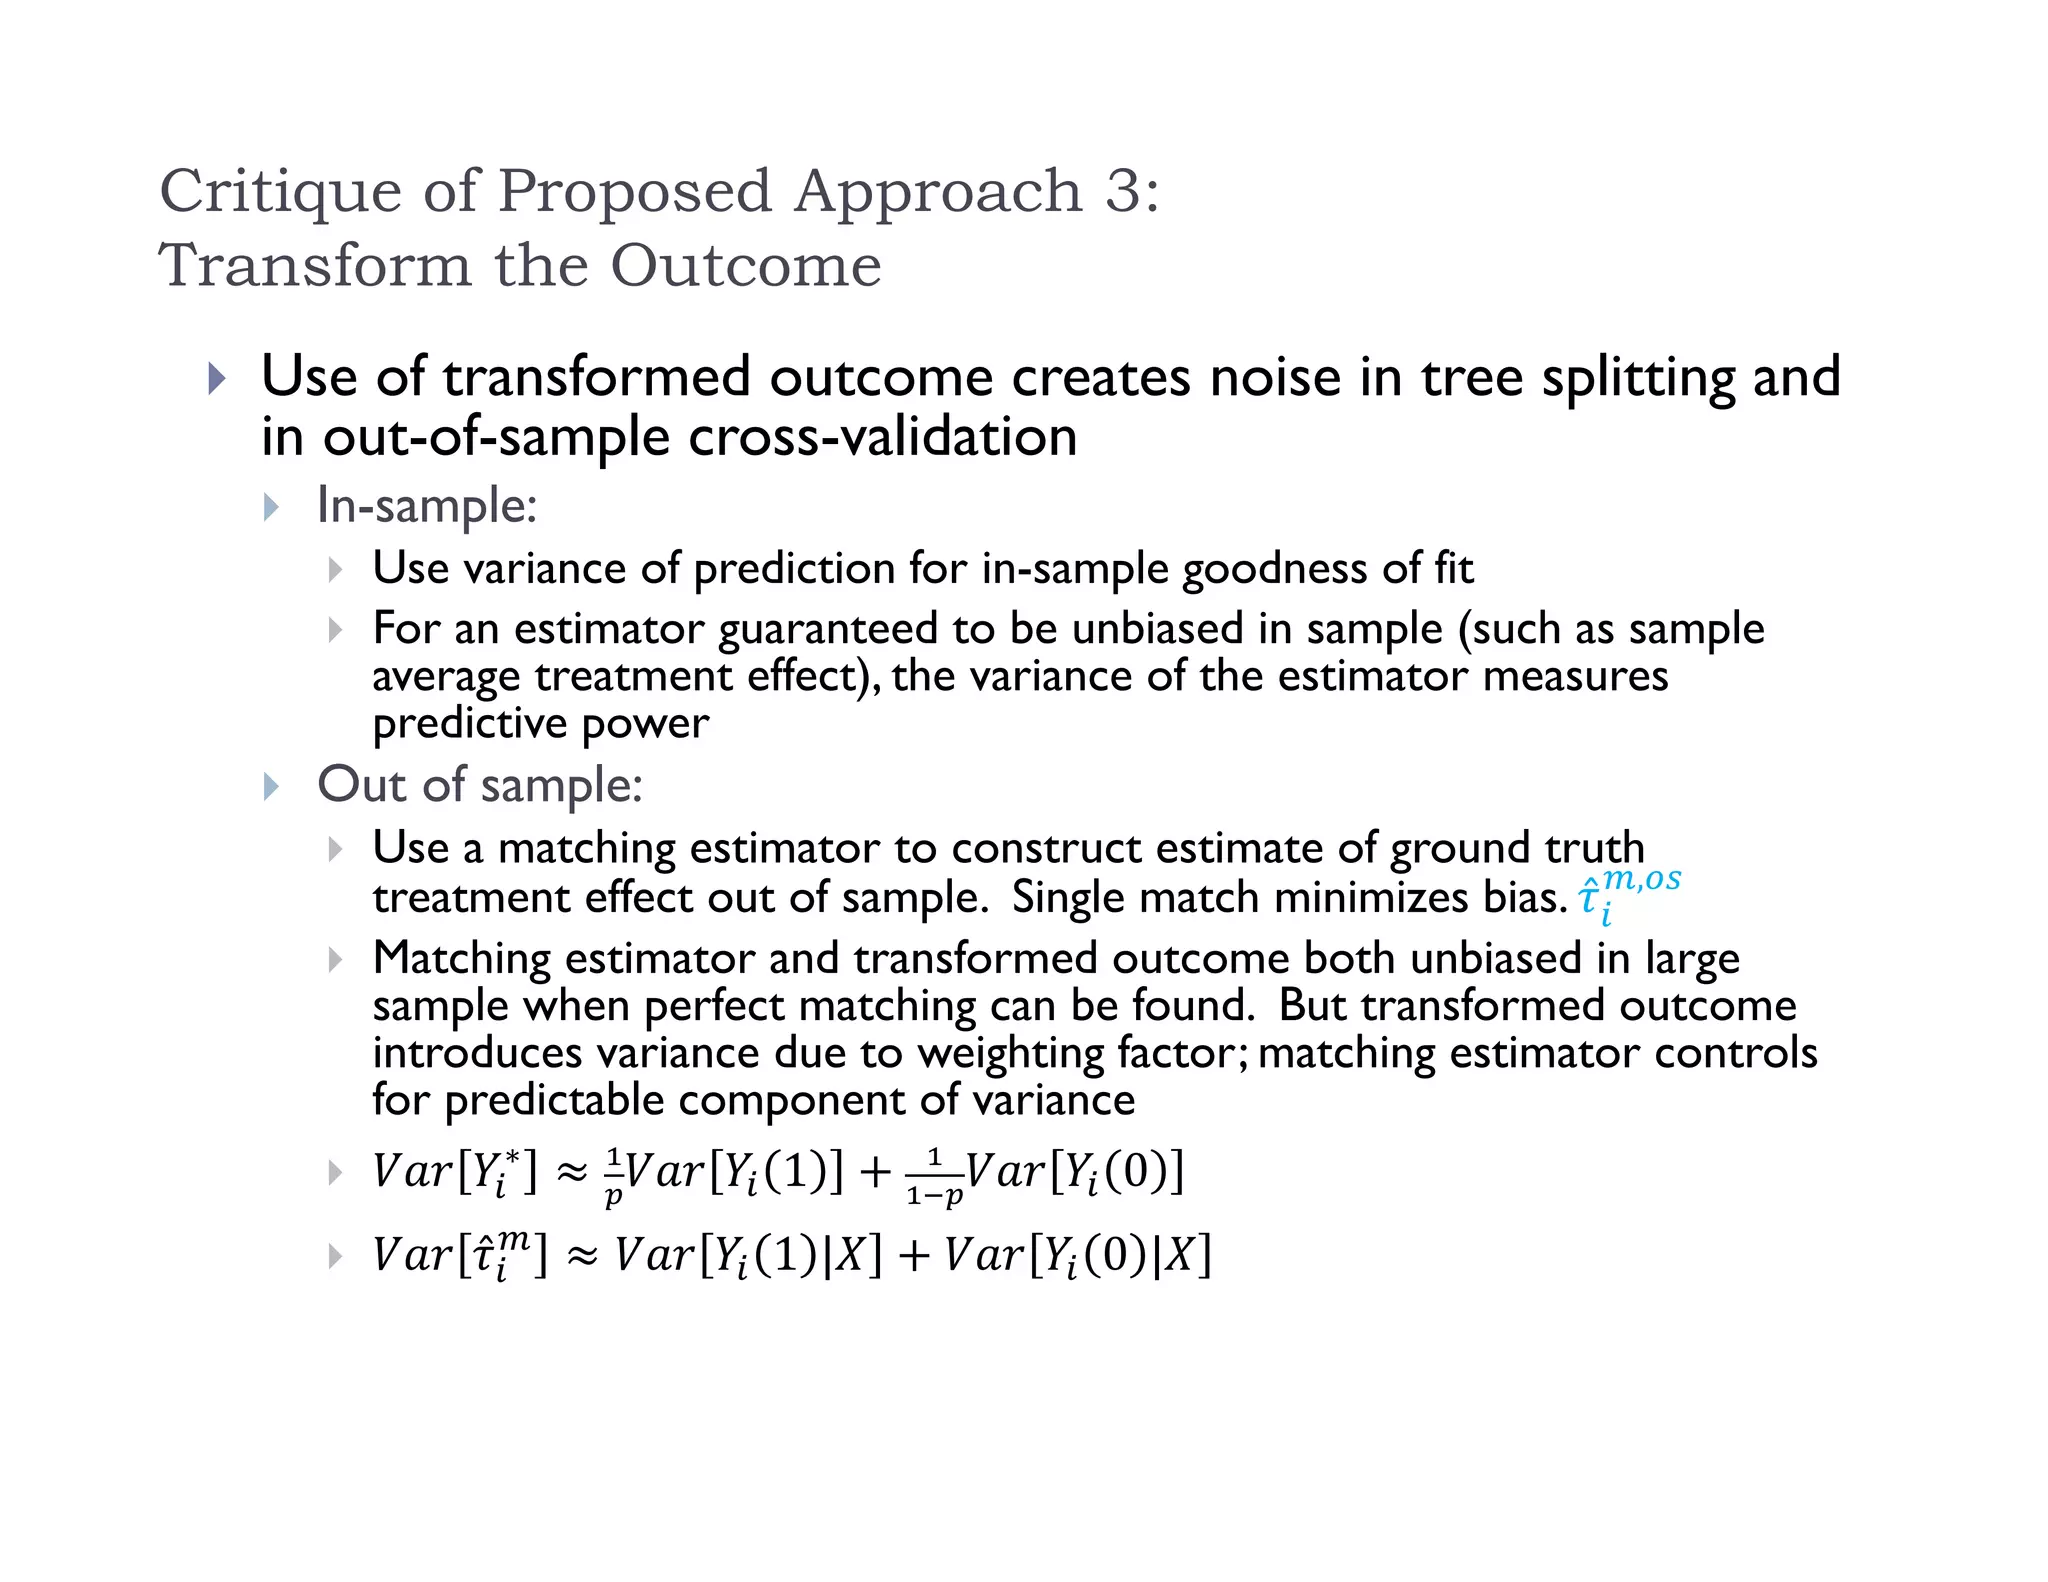
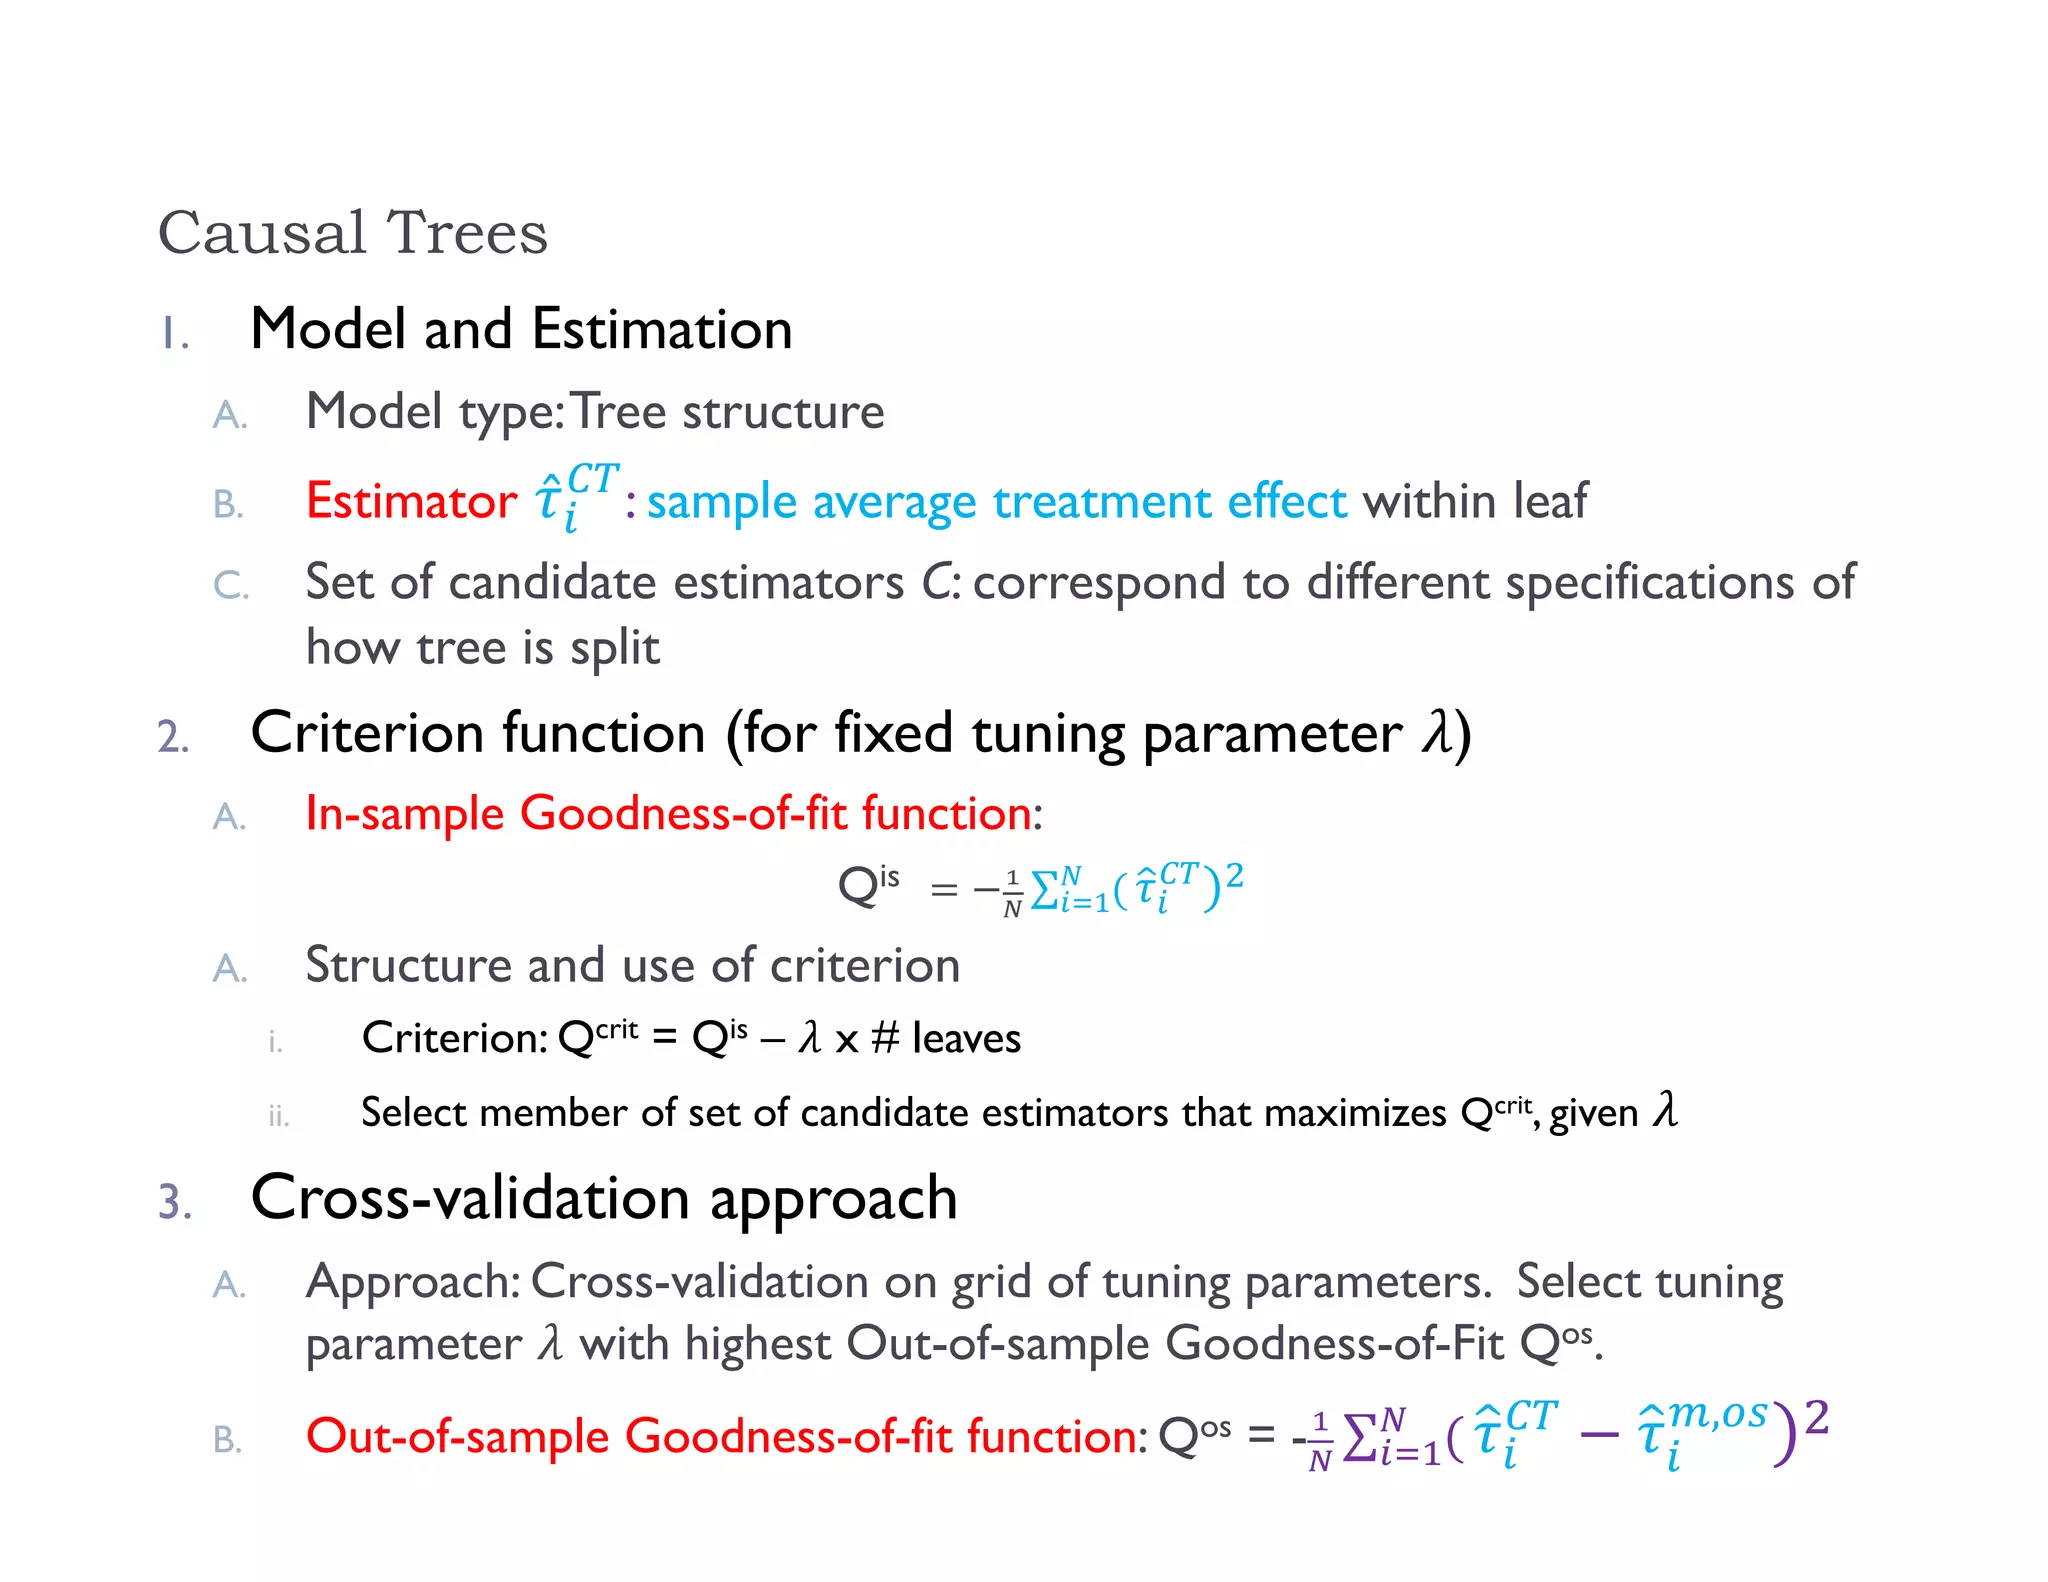
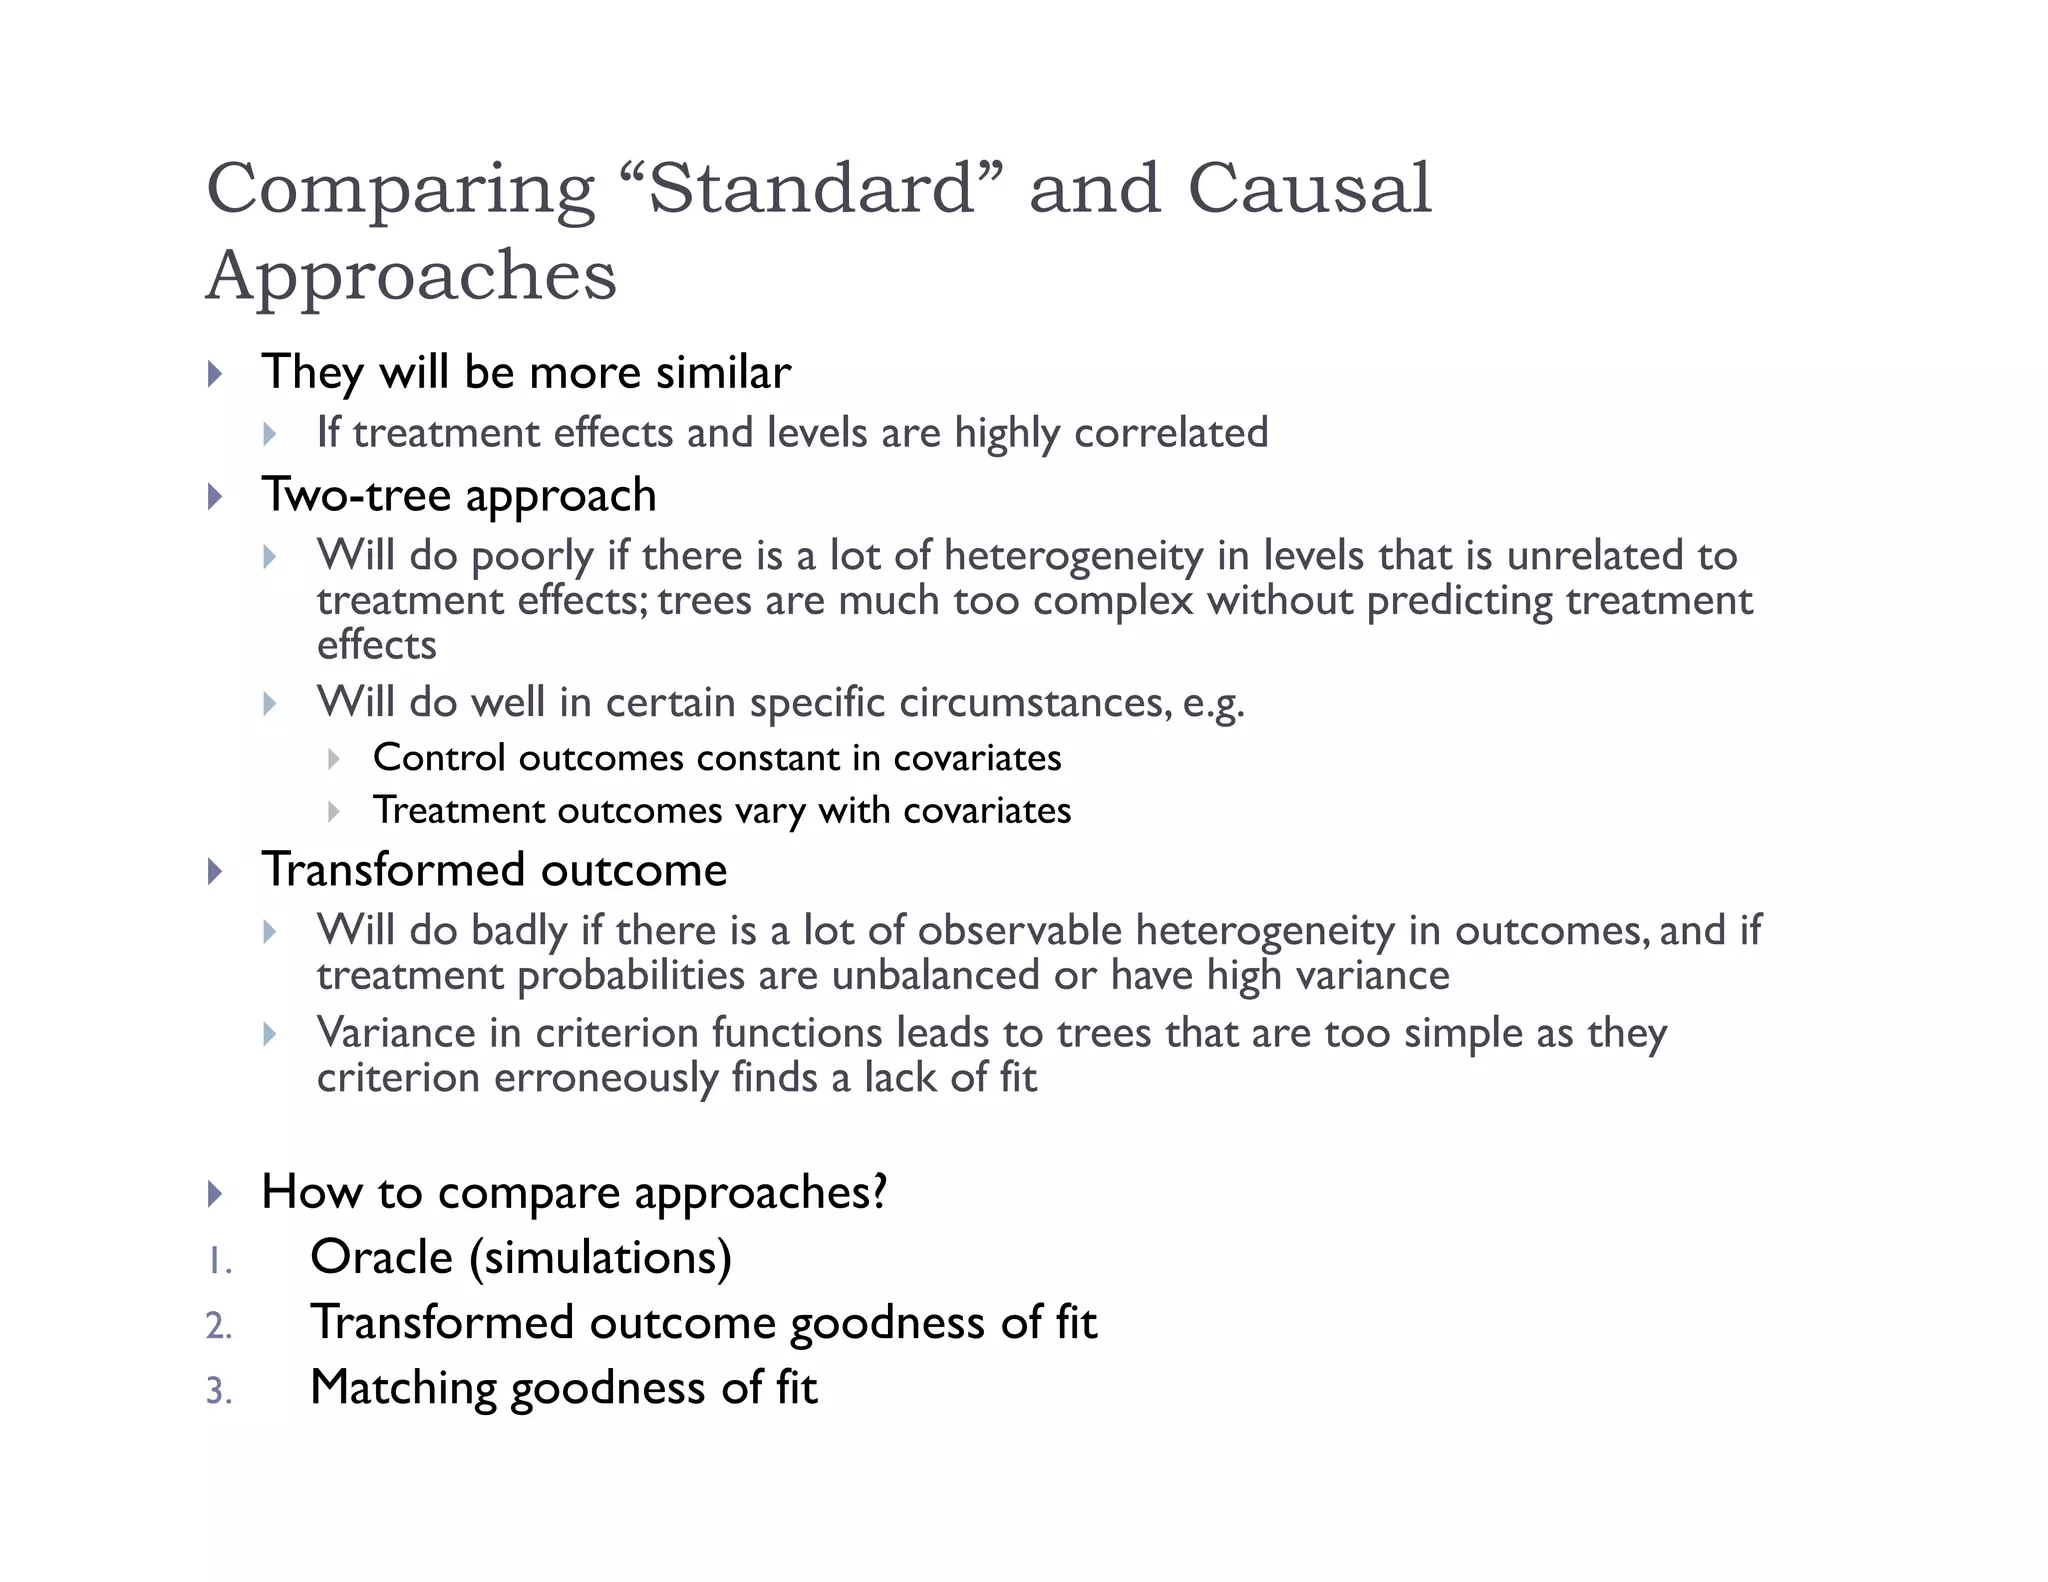
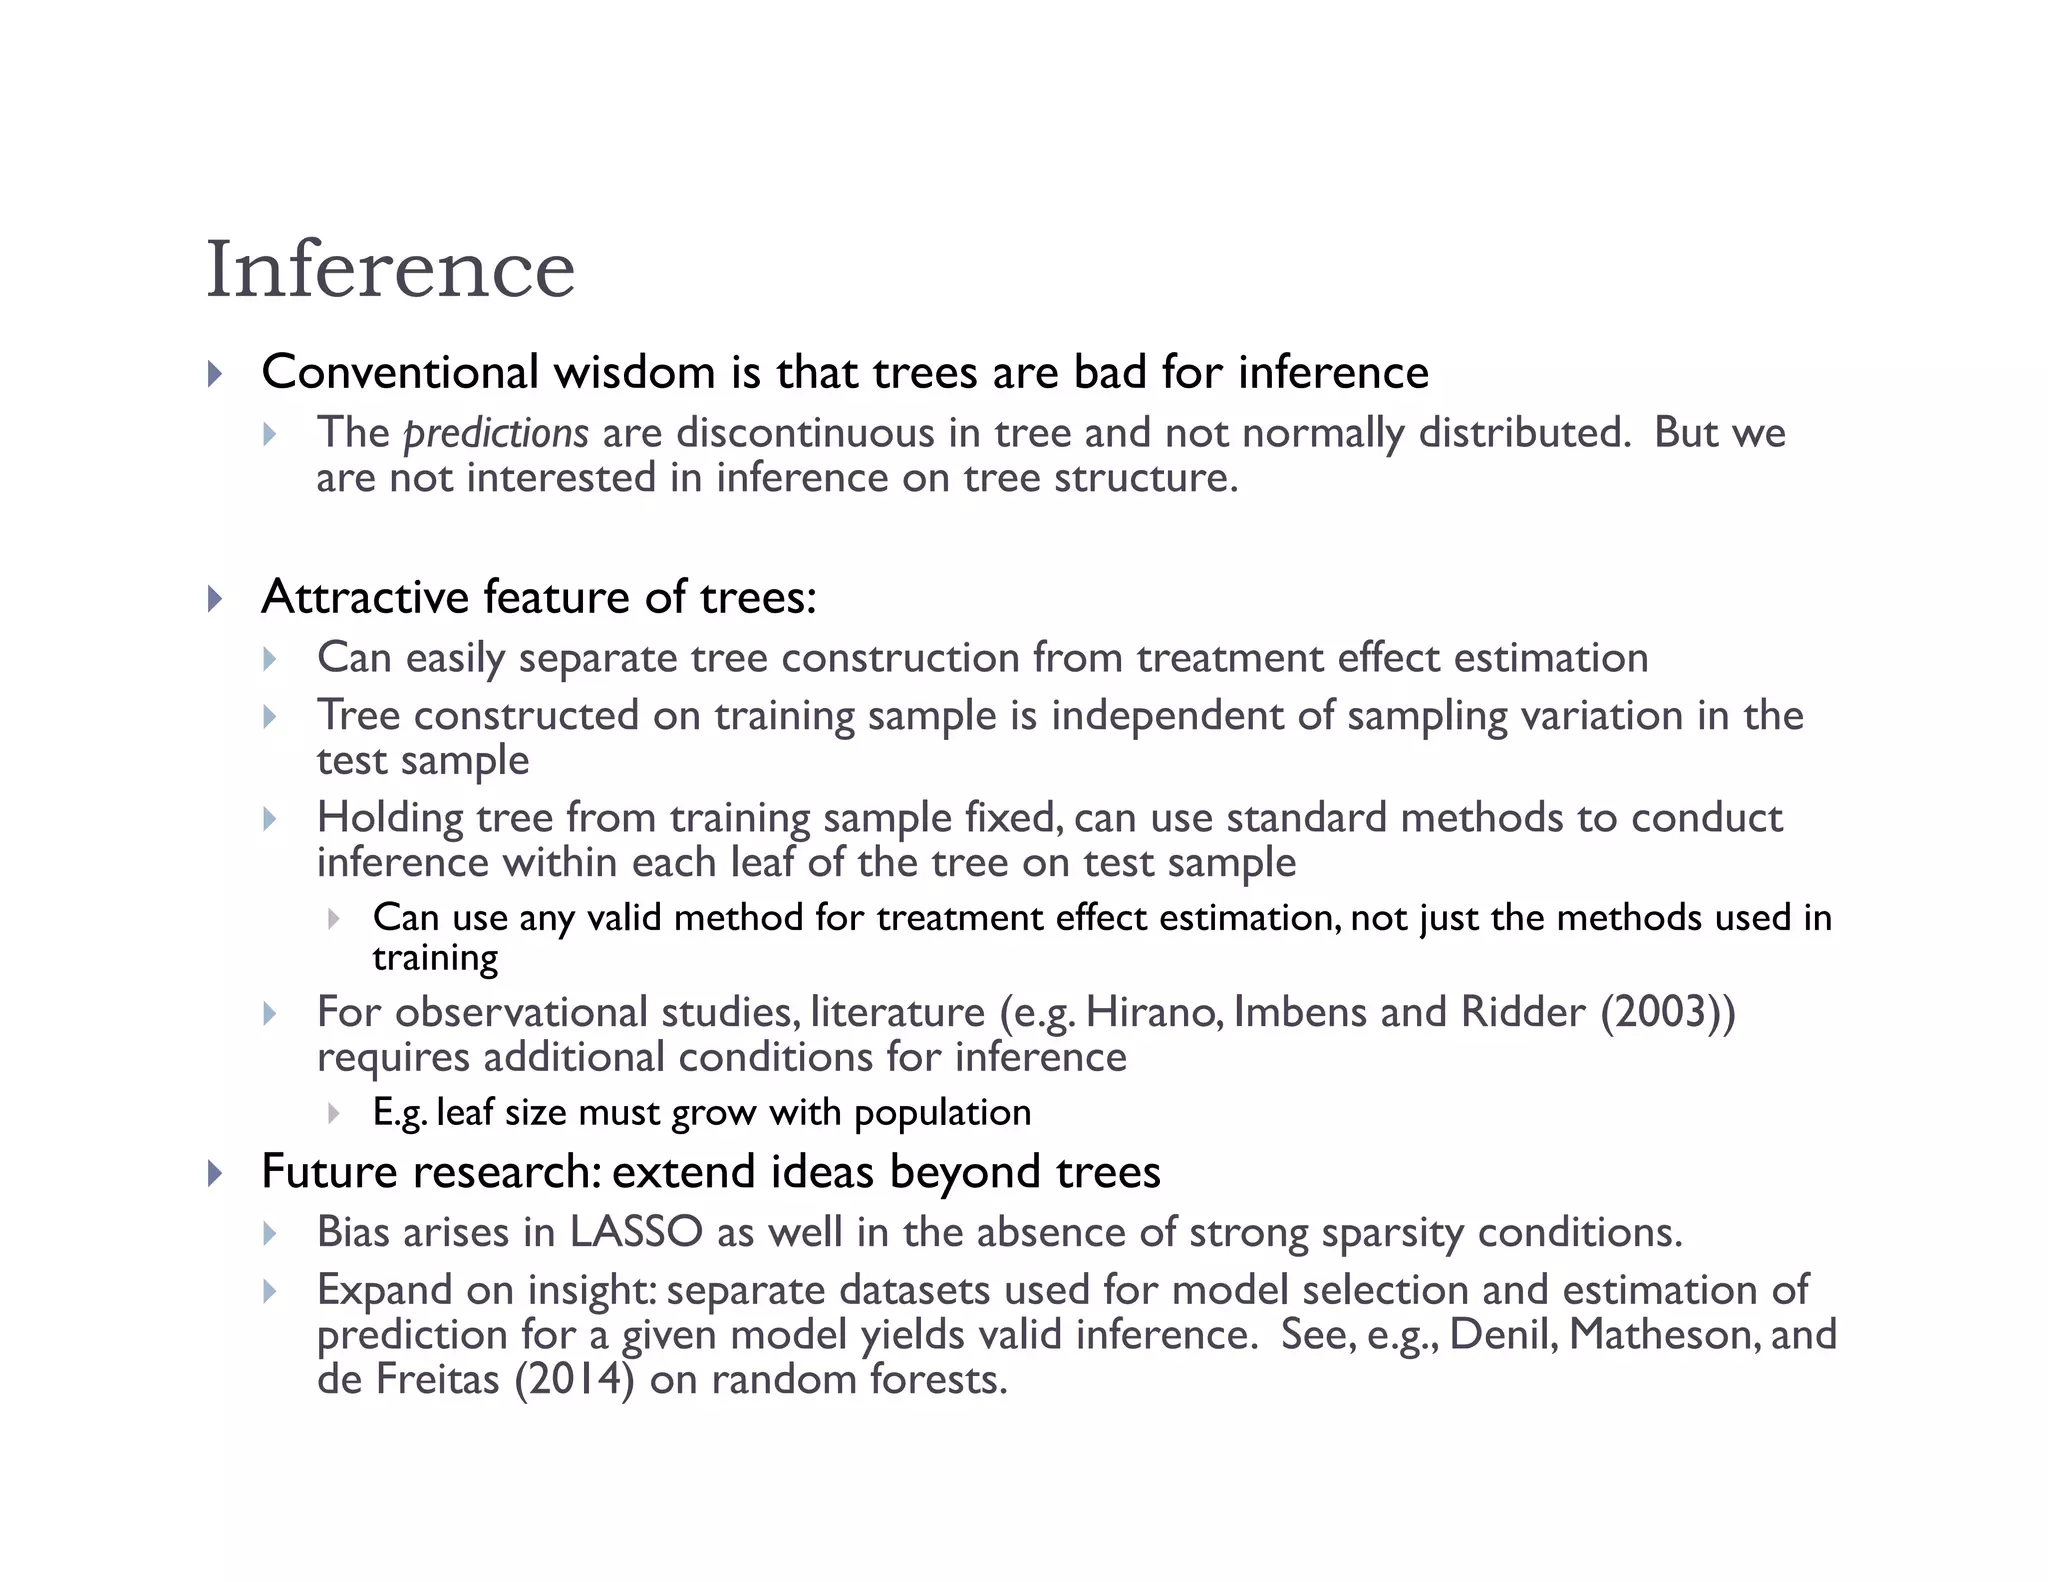
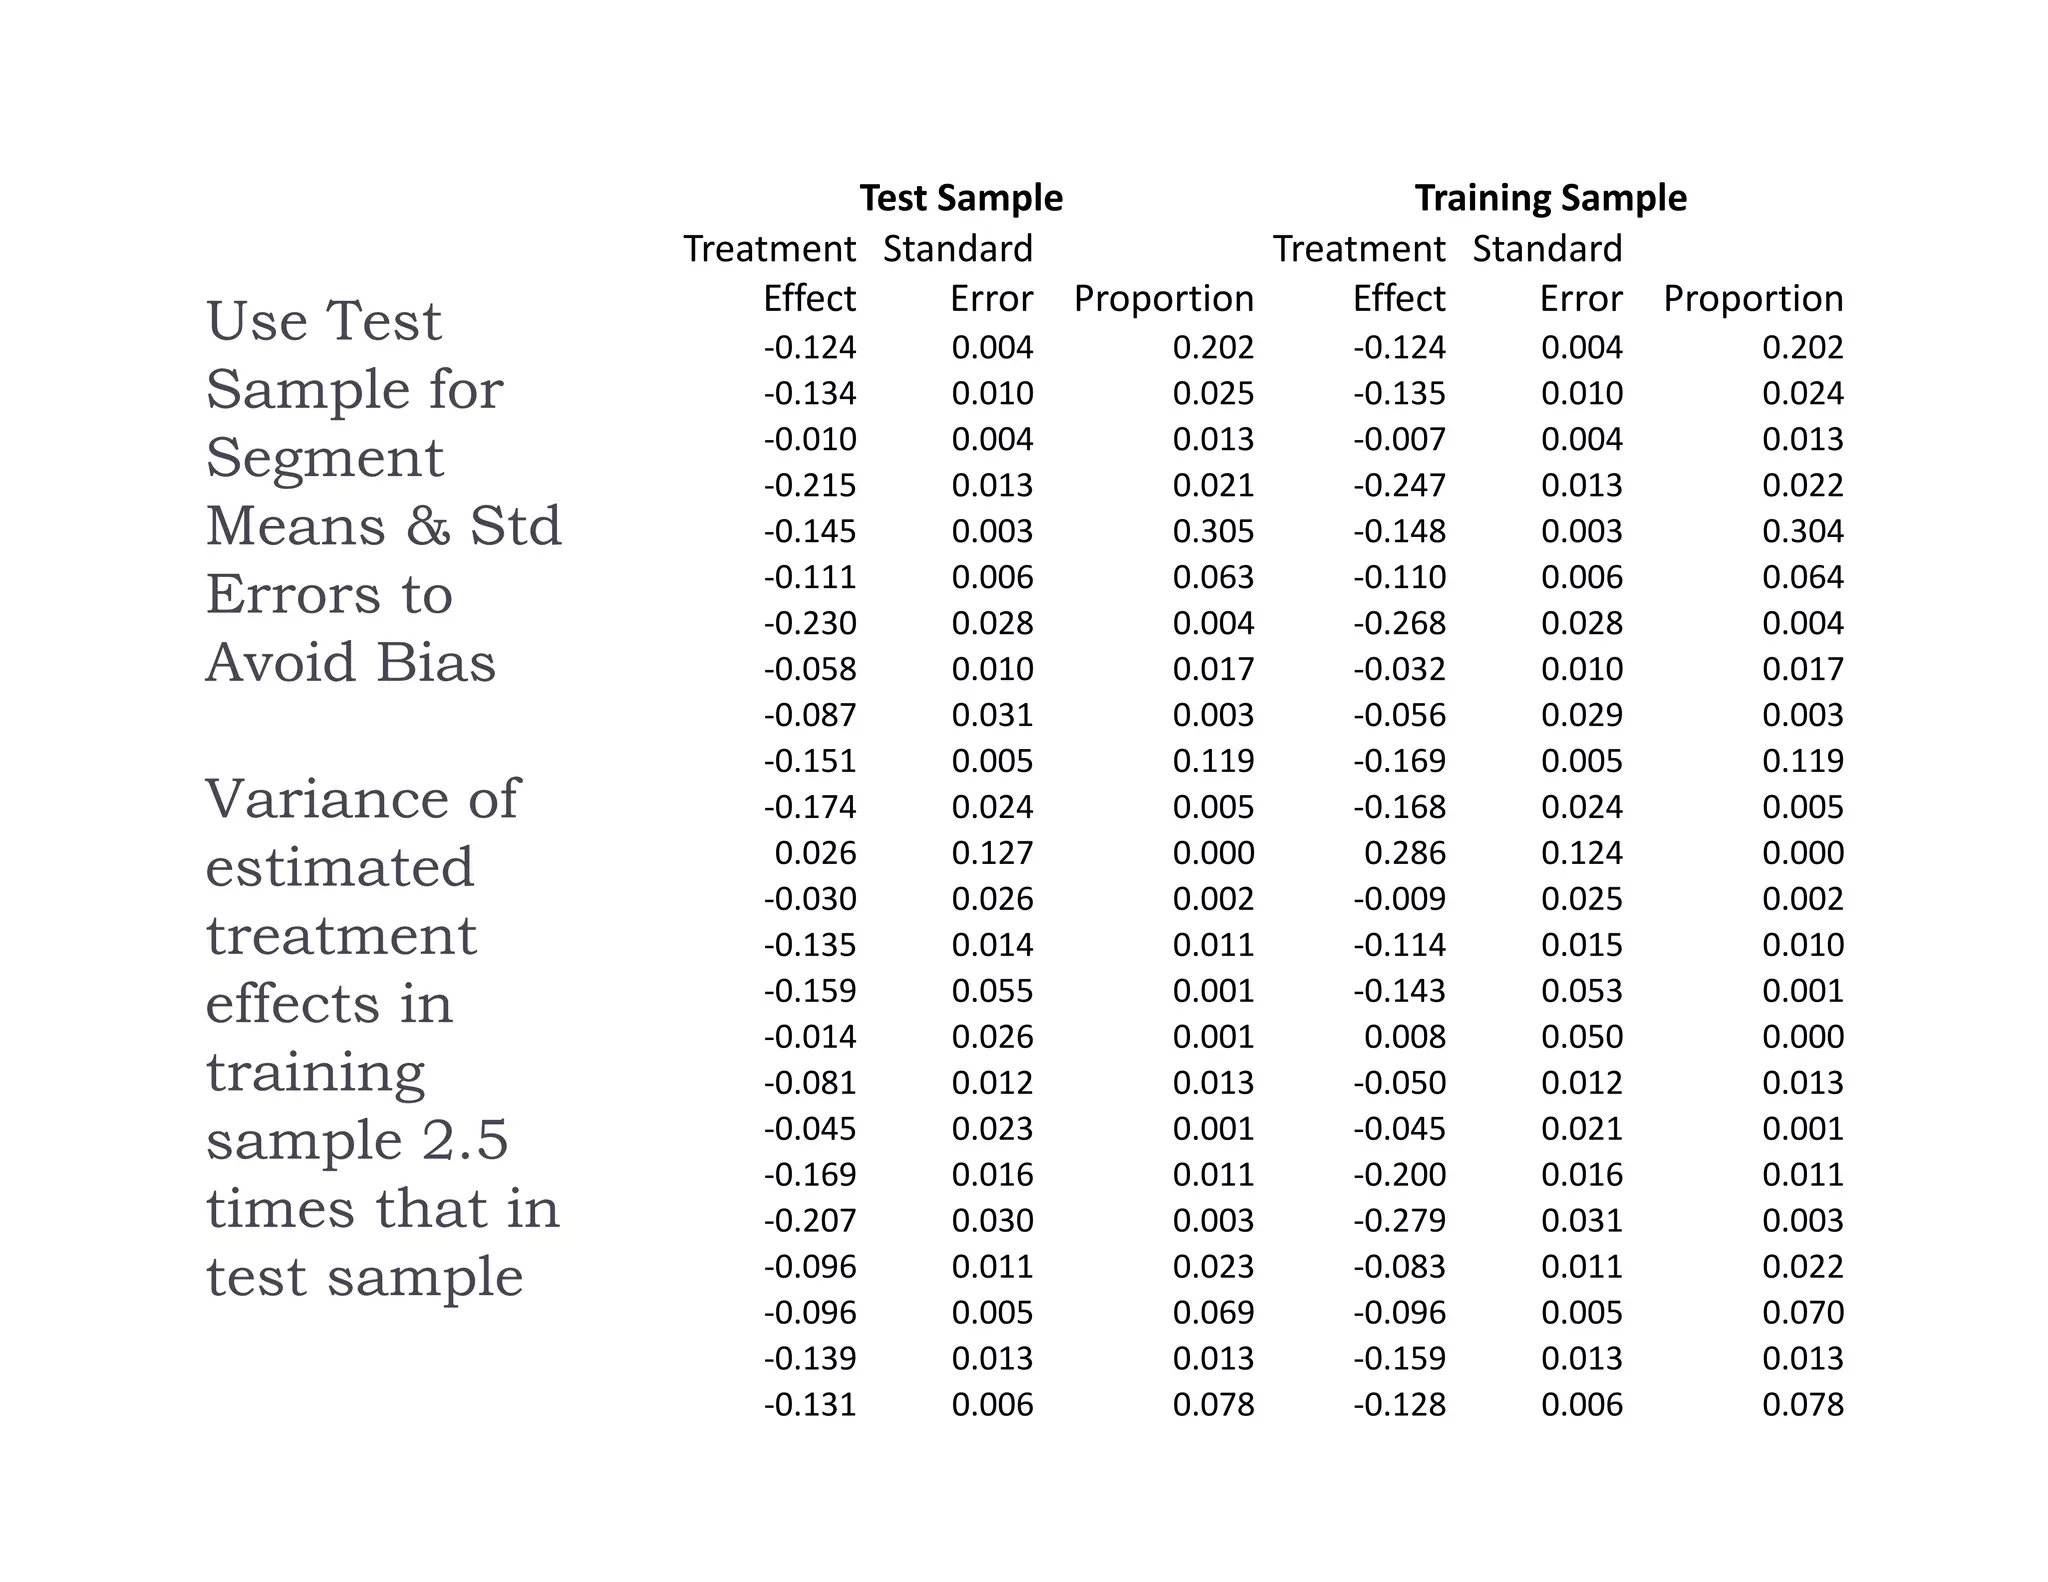
The document discusses using machine learning methods to estimate heterogeneous causal effects. It proposes an approach of using regression trees on a transformed outcome variable to estimate individual treatment effects. However, this approach is critiqued as it can introduce noise. An improved approach is presented that uses the sample average treatment effect within each leaf as the estimator, and uses the variance of predictions for model fitting criteria and a matching estimator for out-of-sample evaluation. The approach separates the tasks of model selection and treatment effect estimation to enable valid statistical inference on estimated effects in subgroups.
Econometrics of High-Dimensional Sparse ModelsNBER
The document discusses high-dimensional sparse econometric models where the number of predictors (p) is much larger than the sample size (n). It outlines an approach for estimating regression functions using penalization methods like the LASSO. Specifically, it discusses:
1. Using the LASSO estimator to minimize squared errors while penalizing the l1-norm of coefficients, inducing sparsity.
2. Choosing the optimal penalty level as a function of the error variance and sample size. Variants like the square-root LASSO provide a tuning-free approach.
3. Examples showing how sparse approximations can better capture patterns in population data than traditional low-dimensional approximations.
This document discusses recommendation systems and topic modeling for documents using machine learning techniques. It begins by introducing recommendation systems and different types of recommendation literature, including item similarity, collaborative filtering, and hierarchical models. It then discusses bringing in user choice data and different collaborative filtering approaches like k-nearest neighbor prediction and matrix factorization. The document also covers topic modeling, including latent Dirichlet allocation, and how topic models can be combined with user choice models. It concludes by discussing challenges in causal inference when using machine learning.
The document outlines a tutorial on conducting laboratory experiments properly with statistical tools. The tutorial covers topics such as paired and two-sample t-tests, analysis of variance (ANOVA), confidence intervals, effect sizes, and statistical power. It provides examples and explanations of key statistical concepts and tests used in information retrieval experimentation, including how to interpret p-values, type I and type II errors, and assumptions of parametric tests. Hands-on exercises are performed in R to demonstrate calculating statistics and running statistical tests on sample data comparing search engine performance.
Machine learning concepts and techniques are summarized in three paragraphs. Key points include:
Learning allows systems to perform tasks more efficiently over time by modifying representations based on experiences. Major learning paradigms include supervised learning from labeled examples, unsupervised learning like clustering without labels, and reinforcement learning using feedback/rewards.
Decision trees are a common inductive learning approach that extrapolate patterns from training examples to classify new examples. They are built top-down by selecting attributes that best split examples into homogeneous groups. The attribute with highest information gain is selected at each node.
Decision trees may be evaluated on predictive accuracy and pruned to avoid overfitting. Rules can be extracted from trees' paths. Parameters are set using
This document provides an introduction to statistical model selection. It discusses various approaches to model selection including predictive risk, Bayesian methods, information theoretic measures like AIC and MDL, and adaptive methods. The key goals of model selection are to understand the bias-variance tradeoff and select models that offer the best guaranteed predictive performance on new data. Model selection aims to find the right level of complexity to explain patterns in available data while avoiding overfitting.
Intro to SVM with its maths and examples. Types of SVM and its parameters. Concept of vector algebra. Concepts of text analytics and Natural Language Processing along with its applications.
Introduction to Some Tree based Learning MethodHonglin Yu
Random Forest, Boosted Trees and other ensemble learning methods build multiple models to improve predictive performance over single models. They combine "weak learners" like decision trees into a "strong learner". Random Forest adds randomness by selecting a random subset of features at each split. Boosting trains trees sequentially on weighted data from previous trees. Both reduce variance compared to bagging. Random Forest often outperforms Boosting while being faster to train. Neural networks can also be viewed as an ensemble method by combining simple units.
No machine learning algorithm dominates in every domain, but random forests are usually tough to beat by much. And they have some advantages compared to other models. No much input preparation needed, implicit feature selection, fast to train, and ability to visualize the model. While it is easy to get started with random forests, a good understanding of the model is key to get the most of them.
This talk will cover decision trees from theory, to their implementation in scikit-learn. An overview of ensemble methods and bagging will follow, to end up explaining and implementing random forests and see how they compare to other state-of-the-art models.
The talk will have a very practical approach, using examples and real cases to illustrate how to use both decision trees and random forests.
We will see how the simplicity of decision trees, is a key advantage compared to other methods. Unlike black-box methods, or methods tough to represent in multivariate cases, decision trees can easily be visualized, analyzed, and debugged, until we see that our model is behaving as expected. This exercise can increase our understanding of the data and the problem, while making our model perform in the best possible way.
Random Forests can randomize and ensemble decision trees to increase its predictive power, while keeping most of their properties.
The main topics covered will include:
* What are decision trees?
* How decision trees are trained?
* Understanding and debugging decision trees
* Ensemble methods
* Bagging
* Random Forests
* When decision trees and random forests should be used?
* Python implementation with scikit-learn
* Analysis of performance
The document proposes a methodology to improve evolutionary multi-objective algorithms (EMOAs) by incorporating achievement scalarizing functions (ASFs) to provide convergence to the Pareto optimal front while maintaining diversity. The methodology executes in serial stages: running an EMOA to get a non-dominated set, clustering this set to extract a representative set, calculating pseudo-weights for the representative set, and perturbing the extreme points to generate reference points to drive the ASF towards the Pareto front over iterations until no improvements are found. Initial studies on test problems ZDT1, ZDT2 and ZDT3 show promising results, with the proposed approach finding a representative set of clustered Pareto points in fewer generations compared to NSGA
The method of differences-in-differences (DID) is widely used to estimate causal effects. The primary advantage of DID is that it can account for time-invariant bias from unobserved confounders. However, the standard DID estimator will be biased if there is an interaction between history in the after period and the groups. That is, bias will be present if an event besides the treatment occurs at the same time and affects the treated group in a differential fashion. We present a method of bounds based on DID that accounts for an unmeasured confounder that has a differential effect in the post-treatment time period. These DID bracketing bounds are simple to implement and only require partitioning the controls into two separate groups. We also develop two key extensions for DID bracketing bounds. First, we develop a new falsification test to probe the key assumption that is necessary for the bounds estimator to provide consistent estimates of the treatment effect. Next, we develop a method of sensitivity analysis that adjusts the bounds for possible bias based on differences between the treated and control units from the pretreatment period. We apply these DID bracketing bounds and the new methods we develop to an application on the effect of voter identification laws on turnout. Specifically, we focus estimating whether the enactment of voter identification laws in Georgia and Indiana had an effect on voter turnout.
This Logistic Regression Presentation will help you understand how a Logistic Regression algorithm works in Machine Learning. In this tutorial video, you will learn what is Supervised Learning, what is Classification problem and some associated algorithms, what is Logistic Regression, how it works with simple examples, the maths behind Logistic Regression, how it is different from Linear Regression and Logistic Regression applications. At the end, you will also see an interesting demo in Python on how to predict the number present in an image using Logistic Regression.
Below topics are covered in this Machine Learning Algorithms Presentation:
1. What is supervised learning?
2. What is classification? what are some of its solutions?
3. What is logistic regression?
4. Comparing linear and logistic regression
5. Logistic regression applications
6. Use case - Predicting the number in an image
What is Machine Learning: Machine Learning is an application of Artificial Intelligence (AI) that provides systems the ability to automatically learn and improve from experience without being explicitly programmed.
- - - - - - - -
About Simplilearn Machine Learning course:
A form of artificial intelligence, Machine Learning is revolutionizing the world of computing as well as all people’s digital interactions. Machine Learning powers such innovative automated technologies as recommendation engines, facial recognition, fraud protection and even self-driving cars.This Machine Learning course prepares engineers, data scientists and other professionals with knowledge and hands-on skills required for certification and job competency in Machine Learning.
- - - - - - -
Why learn Machine Learning?
Machine Learning is taking over the world- and with that, there is a growing need among companies for professionals to know the ins and outs of Machine Learning
The Machine Learning market size is expected to grow from USD 1.03 Billion in 2016 to USD 8.81 Billion by 2022, at a Compound Annual Growth Rate (CAGR) of 44.1% during the forecast period.
- - - - - -
What skills will you learn from this Machine Learning course?
By the end of this Machine Learning course, you will be able to:
1. Master the concepts of supervised, unsupervised and reinforcement learning concepts and modeling.
2. Gain practical mastery over principles, algorithms, and applications of Machine Learning through a hands-on approach which includes working on 28 projects and one capstone project.
3. Acquire thorough knowledge of the mathematical and heuristic aspects of Machine Learning.
4. Understand the concepts and operation of support vector machines, kernel SVM, naive bayes, decision tree classifier, random forest classifier, logistic regression, K-nearest neighbors, K-means clustering and more.
5. Be able to model a wide variety of robust Machine Learning algorithms including deep learning, clustering, and recommendation systems
- - - - - - -
This document introduces random forests and stochastic gradient boosting methods for classification and regression. It discusses how random forests grow many decision trees on bootstrap samples of data and average the results, keeping correlation between trees low. Stochastic gradient boosting iteratively adds small regression trees to minimize a loss function, reducing overfitting risk. The document provides examples of these methods achieving strong predictive performance on competitions and industry applications.
This document provides an introduction to Bayesian linear mixed models. It begins by motivating the use of Bayesian methods as an alternative to frequentist approaches for analyzing psycholinguistic data. It then reviews the components of linear mixed models, including how they can account for repeated measures data. Through a simulation study, it demonstrates that the lmer package may not reliably estimate correlation parameters unless the dataset is large enough. Overall, the document argues that Bayesian linear mixed models allow for more flexible modeling of complex data structures and incorporate prior knowledge compared to frequentist methods.
International Journal of Engineering Research and Applications (IJERA) is an open access online peer reviewed international journal that publishes research and review articles in the fields of Computer Science, Neural Networks, Electrical Engineering, Software Engineering, Information Technology, Mechanical Engineering, Chemical Engineering, Plastic Engineering, Food Technology, Textile Engineering, Nano Technology & science, Power Electronics, Electronics & Communication Engineering, Computational mathematics, Image processing, Civil Engineering, Structural Engineering, Environmental Engineering, VLSI Testing & Low Power VLSI Design etc.
The document discusses basic statistical descriptions of data including measures of central tendency (mean, median, mode), dispersion (range, variance, standard deviation), and position (quartiles, percentiles). It explains how to calculate and interpret these measures. It also covers estimating these values from grouped frequency data and identifying outliers. The key goals are to better understand relationships within a data set and analyze data at multiple levels of precision.
Here are the key differences between supervised and unsupervised learning:
Supervised Learning:
- Uses labeled examples/data to learn. The labels provide correct answers for the learning algorithm.
- The goal is to build a model that maps inputs to outputs based on example input-output pairs.
- Common algorithms include linear/logistic regression, decision trees, k-nearest neighbors, SVM, neural networks.
- Used for classification and regression predictive problems.
Unsupervised Learning:
- Uses unlabeled data where there are no correct answers provided.
- The goal is to find hidden patterns or grouping in the data.
- Common algorithms include clustering, association rule learning, self-organizing maps.
-
Data Science - Part V - Decision Trees & Random Forests Derek Kane
This lecture provides an overview of decision tree machine learning algorithms and random forest ensemble techniques. The practical example includes diagnosing Type II diabetes and evaluating customer churn in the telecommunication industry.
The document discusses decision trees and random forest algorithms. It begins with an outline and defines the problem as determining target attribute values for new examples given a training data set. It then explains key requirements like discrete classes and sufficient data. The document goes on to describe the principles of decision trees, including entropy and information gain as criteria for splitting nodes. Random forests are introduced as consisting of multiple decision trees to help reduce variance. The summary concludes by noting out-of-bag error rate can estimate classification error as trees are added.
Machine learning basics using trees algorithm (Random forest, Gradient Boosting)Parth Khare
This document provides an overview of machine learning classification and decision trees. It discusses key concepts like supervised vs. unsupervised learning, and how decision trees work by recursively partitioning data into nodes. Random forest and gradient boosted trees are introduced as ensemble methods that combine multiple decision trees. Random forest grows trees independently in parallel while gradient boosted trees grow sequentially by minimizing error from previous trees. While both benefit from ensembling, gradient boosted trees are more prone to overfitting and random forests are better at generalizing to new data.
The document discusses consistency of random forests. It summarizes recent theoretical results showing that random forests are consistent estimators under certain conditions. Specifically, it is shown that random forests are consistent if the number of features sampled at each node (mtry) increases with sample size and the minimum node size decreases with sample size. The document also discusses how consistency holds even when the splitting criteria are randomized, as in random forests, as long as the base classifiers are consistent.
This document provides an overview of a survey of multi-objective evolutionary algorithms for data mining tasks. It discusses key concepts in multi-objective optimization and evolutionary algorithms. It also reviews common data mining tasks like feature selection, classification, clustering, and association rule mining that are often formulated as multi-objective problems and solved using multi-objective evolutionary algorithms. The survey focuses on reviewing applications of multi-objective evolutionary algorithms for feature selection and classification in part 1, and applications for clustering, association rule mining and other tasks in part 2.
The document discusses cluster analysis, an unsupervised machine learning technique used to group similar cases together. It describes how cluster analysis is used in marketing research for market segmentation, understanding customer behaviors, and identifying new product opportunities. The key steps in cluster analysis involve selecting a distance measure, clustering algorithm, determining the optimal number of clusters, and validating the results.
Multi-criteria Decision Analysis for Customization of Estimation by Analogy M...gregoryg
The document discusses using multi-criteria decision analysis to customize estimation by analogy (EBA) methods. It proposes using the AQUA+ EBA method, which supports attributes weighting and selection. It presents a decision-centric process model for customizing EBA and defines a multi-criteria decision problem to determine the best attributes weighting heuristic for different datasets based on criteria like MMRE, prediction accuracy, and strength. It demonstrates the approach on sample datasets and identifies Pareto optimal solutions and clusters.
Probability density estimation using Product of Conditional ExpertsChirag Gupta
This document discusses probability density estimation using a product of conditional experts model. It summarizes that density estimation constructs a probability distribution function from observed data to understand the underlying pattern. A product of conditional experts model is proposed, where simple classification models like logistic regression are used as experts to estimate the conditional probability. The experts are combined by multiplying their probabilities. The model is trained using gradient ascent to maximize the log probability. When evaluated on artificial and real datasets, the product of conditional experts model is shown to learn distributions close to the true distributions and generalize better than linear and non-linear baseline models. The document also explores applying the model to outlier detection.
This document summarizes an analysis of weather sensor data to predict rainfall amounts in a region. Various machine learning models were tested on the data, including linear regression, Bayesian MARS, decision trees, and random forests. Dimensionality reduction via principal component analysis improved the random forest model, with the best performance using the first 40 principal components. Testing different parameters like tree depth and minimum parent nodes helped optimize the decision tree models. The best root mean squared error achieved was 0.608, close to the top performing model's error of 0.581.
This Presentation is on recommended system on question paper predication using machine learning techniques. We did literature survey and implement using same technique.
Efficient Disease Classifier Using Data Mining Techniques: Refinement of Rand...IOSR Journals
The document describes research on improving the termination criteria for the random forest algorithm when classifying disease data. The random forest algorithm constructs a forest of decision trees to predict disease classification. Typically, random forest terminates tree construction based on accuracy and correlation metrics. The proposed method uses binomial distribution, multinomial distribution, and sequential probability ratio testing to determine when to terminate tree construction, with the goal of stopping earlier than typical random forest approaches. Experimental results on five disease datasets show the proposed method with probability distributions achieves better accuracy than classical random forest while constructing fewer trees, improving the efficiency of the algorithm.
The document discusses using random forests and KNN algorithms to segment and classify brain tumors. It proposes using selective search segmentation to extract important regions from images before applying random forests, in order to address issues with random patch selection. The goals are to increase discriminative power and accuracy of the random forest classifier by selecting more informative image patches from the segmentation. Literature on using decision tree ensembles for biomarker identification and classification is also reviewed. Performance is measured using metrics like accuracy, ROC curves, and error rates.
The document discusses random forest, an ensemble classifier that uses multiple decision tree models. It describes how random forest works by growing trees using randomly selected subsets of features and samples, then combining the results. The key advantages are better accuracy compared to a single decision tree, and no need for parameter tuning. Random forest can be used for classification and regression tasks.
This document summarizes methods for subgroup identification in clinical trials. It begins by distinguishing predictive from prognostic biomarkers. It then provides a taxonomy of four main approaches to subgroup identification: global outcome modeling, global treatment effect modeling, modeling individual treatment regimes, and local treatment effect modeling (subgroup search). The document discusses several examples and methods under each approach. It concludes by noting important considerations for evaluating subgroup identification methods, such as the number of predictors handled, model complexity control, type I error control, and obtaining honest effect size estimates.
Causal random forests are used to estimate heterogeneous treatment effects by splitting individuals into buckets defined by variable values. The splitting is done by regression trees that minimize an extended mean squared error, which rewards heterogeneity between leaves while penalizing small leaves. This honest sampling and splitting approach allows for unbiased estimates of conditional average treatment effects within subgroups. Causal random forests relax assumptions of traditional methods like propensity score matching and can help identify which subgroups experience the largest effects from a treatment or policy.
This document discusses using classification algorithms to analyze a dataset about interest in vacations. It compares the decision tree and naive Bayes classification models based on accuracy. For the decision tree model, the accuracy was about 45% while sensitivity was around 70%. For the naive Bayes model, the accuracy was higher at about 60% and the sensitivity was 87.5%. Overall, the naive Bayes classification model had better predictive performance than the decision tree model based on this vacation interest dataset.
The document provides an overview of factor analysis, including:
- Factor analysis is a statistical technique used to reduce a large number of variables into a smaller number of underlying factors or components according to patterns of correlation between variables.
- The two main types are exploratory factor analysis, which is used when the underlying factors are unknown, and confirmatory factor analysis, which is used to test hypotheses about a predetermined factor structure.
- Key steps in factor analysis include determining the appropriateness of the data, extracting factors using various criteria, rotating factors to improve interpretation, and interpreting the results including factor loadings and communalities.
This document provides an overview of key concepts in statistics, machine learning, and data science. It discusses topics such as populations and samples, parameters and statistics, measures of central tendency and variation, hypothesis testing, linear and logistic regression, decision trees, overfitting and regularization, bagging and boosting, and random forests. The document also provides examples to illustrate statistical fundamentals like hypothesis testing, one sample t-tests, and type I and II errors.
Hybrid Method HVS-MRMR for Variable Selection in Multilayer Artificial Neural...IJECEIAES
The variable selection is an important technique the reducing dimensionality of data frequently used in data preprocessing for performing data mining. This paper presents a new variable selection algorithm uses the heuristic variable selection (HVS) and Minimum Redundancy Maximum Relevance (MRMR). We enhance the HVS method for variab le selection by incorporating (MRMR) filter. Our algorithm is based on wrapper approach using multi-layer perceptron. We called this algorithm a HVS-MRMR Wrapper for variables selection. The relevance of a set of variables is measured by a convex combination of the relevance given by HVS criterion and the MRMR criterion. This approach selects new relevant variables; we evaluate the performance of HVS-MRMR on eight benchmark classification problems. The experimental results show that HVS-MRMR selected a less number of variables with high classification accuracy compared to MRMR and HVS and without variables selection on most datasets. HVS-MRMR can be applied to various classification problems that require high classification accuracy.
Machine learning workshop, session 3.
- Data sets
- Machine Learning Algorithms
- Algorithms by Learning Style
- Algorithms by Similarity
- People to follow
This document provides highlights and key concepts for an exam on structural equation modeling (SEM). It defines terms like path coefficients, direct/indirect/total effects, identification, and discusses techniques for assessing model fit. Identification issues are more likely for models with large numbers of coefficients, reciprocal effects, or many similar concepts. The document also outlines steps in SEM like model specification, identification, estimation, and respecification.
This document discusses various machine learning concepts related to data processing, feature selection, dimensionality reduction, feature encoding, feature engineering, dataset construction, and model tuning. It covers techniques like principal component analysis, singular value decomposition, correlation, covariance, label encoding, one-hot encoding, normalization, discretization, imputation, and more. It also discusses different machine learning algorithm types, categories, representations, libraries and frameworks for model tuning.
There are two main statistical techniques for comparing systems: independent sampling and correlated sampling. When comparing two systems, it is necessary to use confidence intervals. There are three possible scenarios when computing confidence intervals depending on if the sampling is independent or correlated. When comparing several designs, the goals may be to estimate each performance measure, compare to a present system, or select the best. The Bonferroni approach can be used to make statements about multiple alternatives while controlling the overall confidence level. Design of experiments tools like factorial designs, screening, and response surface methods can help understand the effect of design alternatives on performance measures.
This document provides an overview of statistics used in meta-analysis. It discusses key concepts like odds ratios, relative risk, confidence intervals, heterogeneity, and fixed and random effects models. It also summarizes different types of meta-analyses including realist reviews, meta-narrative reviews, and network meta-analyses. Software for performing meta-analyses and potential pitfalls in systematic reviews are also briefly covered.
1. Singular Value Decomposition (SVD) is a matrix factorization technique that decomposes a matrix into three other matrices.
2. SVD is primarily used for dimensionality reduction, information extraction, and noise reduction.
3. Key applications of SVD include matrix approximation, principal component analysis, image compression, recommendation systems, and signal processing.
EDAB Module 5 Singular Value Decomposition (SVD).pptxrajalakshmi5921
1. Singular Value Decomposition (SVD) is a matrix factorization technique that decomposes a matrix into three other matrices.
2. SVD is primarily used for dimensionality reduction, information extraction, and noise reduction.
3. Key applications of SVD include matrix approximation, principal component analysis, image compression, recommendation systems, and signal processing.
Similar to Nbe rcausalpredictionv111 lecture2 (20)
FISCAL STIMULUS IN ECONOMIC UNIONS: WHAT ROLE FOR STATESNBER
1) State deficits can boost job growth in the deficit state but also in neighboring states, showing significant spillover effects. Coordinated fiscal policies across states are more cost-effective than individual state policies.
2) Federal aid to states, when coordinated, can effectively stimulate the overall economy. Targeted aid linked to services for lower income households is more effective than untargeted aid.
3) The economic stimulus of the American Recovery and Reinvestment Act could have been 30% more effective if it relied more on targeted aid and less on untargeted aid. Coordinated fiscal policies that account for spillovers across economic regions are optimal for stimulus programs.
Business in the United States Who Owns it and How Much Tax They PayNBER
This document analyzes business ownership and tax payments in the United States using administrative tax data from 2011. It finds:
1. Pass-through business income, such as from partnerships and S-corporations, is highly concentrated.
2. The average federal income tax rate on pass-through business income is 19%.
3. 30% of income earned by partnerships cannot be uniquely traced to an identifiable, ultimate owner.
Redistribution through Minimum Wage Regulation: An Analysis of Program Linkag...NBER
This document analyzes the program linkages and budgetary spillovers of minimum wage regulation using data from recent federal minimum wage increases. It finds that wages increased for some low-skilled workers but employment declined significantly. While safety net programs provided some income replacement, earnings and tax revenues decreased substantially. Overall, the analysis suggests minimum wage increases reallocated income from employers and taxpayers to low-wage workers, with program and tax revenue spillovers of approximately $1-2 billion annually.
The Distributional Effects of U.S. Clean Energy Tax CreditsNBER
This document summarizes a study examining the distributional effects of US clean energy tax credits from 2006-2012. It finds that higher-income households claimed a disproportionate share of the $18 billion in credits. Specifically, the study analyzes tax return data to see who claimed credits for investments like home weatherization, solar panels, hybrid vehicles, and electric vehicles. It aims to provide insights into how the inequitable distribution may inform future program design and the debate around subsidies versus carbon taxes.
An Experimental Evaluation of Strategies to Increase Property Tax Compliance:...NBER
This document summarizes a study that tested different strategies for increasing property tax compliance in Philadelphia. The researchers worked with the city's Department of Revenue to randomly assign taxpayers with overdue property taxes to receive one of four letters: a standard letter, or a standard letter plus an additional sentence appealing to civic duty, public services benefits, or potential home loss. They found the civic duty appeal significantly increased tax payments, especially for those with lower debts. Appealing to public services benefits also showed some effect on higher debt taxpayers. The researchers conclude strategically targeting messages could further improve compliance.
This document discusses various machine learning techniques including:
1. Tree pruning involves first growing a large tree and then pruning branches that do not improve the objective function. This prevents early stopping.
2. Boosting uses multiple weak learners sequentially to get an additive model that approximates the regression function. It combines many simple models to create a powerful ensemble model.
3. Unsupervised learning techniques like principal component analysis and clustering are used to find patterns in data without an outcome variable. These include reducing dimensions and partitioning data into subgroups.
This document summarizes a discussion between Susan Athey and Guido Imbens on the relationship between machine learning and causal inference. It notes that while machine learning excels at prediction problems using large datasets, it has weaknesses when it comes to causal questions. Econometrics and statistics literature focuses more on formal theories of causality. The document proposes combining the strengths of both fields by developing machine learning methods that can estimate causal effects, accounting for issues like endogeneity and treatment effect heterogeneity. It outlines some open problems and directions for future research at the intersection of these fields.
This document summarizes key points from a lecture on diffusion, identification, and network formation. It discusses how diffusion of products can be modeled, including information passing between neighbors. Estimation techniques are described to model information diffusion on actual networks by simulating propagation over time. The challenges of identification when networks are endogenous are also covered. Forming models of network formation that account for link dependencies is an important area of current research.
This document provides an overview of social and economic networks. It discusses why networks are important to study, as interactions are shaped by relationships. Some examples of networks are presented, such as marriage networks, friendship networks in high schools, military alliances, and interbank payment networks. The document then discusses how to represent networks mathematically and introduces concepts like degree, paths, average path length, and degree distributions. It also covers homophily, or the tendency for similar people to connect, and shows examples of homophily along attributes. Finally, it introduces the idea of centrality and influence within a network, discussing measures like degree centrality and eigenvector centrality.
Daron Acemoglu presents a document on networks, games over networks, and peer effects. The document discusses how networks can be used to model externalities and peer effects. It presents a model of a game over networks where players' payoffs are determined by their own actions, the actions of their network neighbors, and potential strategic interactions. The best responses in this game are characterized. Under certain conditions, such as the game being a potential game, the game will have a unique Nash equilibrium where each player's action is determined by their position in the network. The document discusses applications of this type of network game model.
The document discusses how economic shocks propagate through networks of production and inputs. It begins by presenting a simple model of an economy consisting of sectors that use each other's outputs as inputs. Shocks to individual sectors can spread to other sectors through this production network. While diversification across many sectors could cause microeconomic shocks to "wash out", the structure of the network influences how shocks aggregate. Asymmetric networks with some sectors having outsized importance can lead to greater aggregate volatility than more regular networks where all sectors are equally important. Empirical analysis of input-output data supports the theory by finding significant downstream effects of sectoral shocks.
The NBER Working Paper Series at 20,000 - Joshua GansNBER
This document discusses publication lags in economics research, with working papers appearing years before peer-reviewed published work. It questions whether publication means anything given the large number of working papers now available. It also considers options for the National Bureau of Economic Research's web repository, such as providing open access to working papers along with links to related materials, peer reviews, and published versions of the papers.
The NBER Working Paper Series at 20,000 - Claudia GoldinNBER
This document analyzes trends in the NBER Working Paper series from 1978 to 2013. It finds that the number of working papers published annually has increased dramatically over time, from around 100 in the late 1970s to over 1,200 by 2013. The number of NBER research programs has also expanded significantly, from 7 originally to over 20 currently. Individual working papers now tend to involve more programs and more authors than in the past as well. The working paper series has become less specialized and more collaborative over four decades of growth and evolution.
The NBER Working Paper Series at 20,000 - James PoterbaNBER
This document summarizes the origin and evolution of the NBER Working Paper series from its beginning in 1972 to the present. It started as an outlet for NBER research and has grown tremendously over time. Some key points:
- The first working paper was published in June 1973 and there were only 3 papers in the first month.
- Growth accelerated after Martin Feldstein became NBER President in 1977, with over 200 papers published in 1981.
- There are now over 20,000 working papers published and about 5.5 million downloads per year from around the world.
- The most popular papers focus on topics like financial crises, economic growth, and corporate governance.
The NBER Working Paper Series at 20,000 - Scott SternNBER
The NBER Working Paper series recently reached 20,000 papers published and is recognized as one of the leading economics working paper series in the world. According to 2014 Google Scholar Metrics, the NBER Working Paper series ranked 18th out of thousands of journals by its H-5 index, which measures the productivity and impact of published work. The high ranking of the NBER Working Paper series demonstrates its important role in disseminating new economic research and ideas worldwide.
The NBER Working Paper Series at 20,000 - Glenn EllisonNBER
This document summarizes trends in the publication process and the role of working papers. It finds that publication times at economics journals have increased significantly over the past 30 years. Acceptance rates at top journals have also declined. These changes mean that published papers cannot address current issues or reflect the latest state of knowledge as quickly. The document also finds that working papers, such as those from the NBER, play an increasingly important role, as economists can disseminate their work more quickly through working paper series than through the traditional publication process. NBER working papers account for a large share of papers eventually published in top journals and those NBER papers go on to be well-cited.
- The document summarizes a lecture on using micro data with characteristics-based choice models. It discusses two key advantages of micro data: 1) It provides information on how observed individual characteristics interact with product characteristics. 2) It includes data on individuals who did not purchase products as well as second choices, giving insight into unobserved product characteristics.
- The model specifies utility as depending on observed and unobserved individual characteristics as well as product characteristics. Micro data on first choices matches individual characteristics to chosen products, while second choice data helps account for unobserved characteristics by holding individual conditions constant.
The document discusses practical computing issues that arise when working with large datasets. It begins by noting that many statistical analyses can be done on a single laptop. It then discusses storing very large datasets, which may require terabytes of storage. The document outlines some basic computing concepts for working with big data, including software engineering practices, databases, and distributed computing.
RFP for Reno's Community Assistance CenterThis Is Reno
Property appraisals completed in May for downtown Reno’s Community Assistance and Triage Centers (CAC) reveal that repairing the buildings to bring them back into service would cost an estimated $10.1 million—nearly four times the amount previously reported by city staff.
Jennifer Schaus and Associates hosts a complimentary webinar series on The FAR in 2024. Join the webinars on Wednesdays and Fridays at noon, eastern.
Recordings are on YouTube and the company website.
https://www.youtube.com/@jenniferschaus/videos
Combined Illegal, Unregulated and Unreported (IUU) Vessel List.Christina Parmionova
The best available, up-to-date information on all fishing and related vessels that appear on the illegal, unregulated, and unreported (IUU) fishing vessel lists published by Regional Fisheries Management Organisations (RFMOs) and related organisations. The aim of the site is to improve the effectiveness of the original IUU lists as a tool for a wide variety of stakeholders to better understand and combat illegal fishing and broader fisheries crime.
To date, the following regional organisations maintain or share lists of vessels that have been found to carry out or support IUU fishing within their own or adjacent convention areas and/or species of competence:
Commission for the Conservation of Antarctic Marine Living Resources (CCAMLR)
Commission for the Conservation of Southern Bluefin Tuna (CCSBT)
General Fisheries Commission for the Mediterranean (GFCM)
Inter-American Tropical Tuna Commission (IATTC)
International Commission for the Conservation of Atlantic Tunas (ICCAT)
Indian Ocean Tuna Commission (IOTC)
Northwest Atlantic Fisheries Organisation (NAFO)
North East Atlantic Fisheries Commission (NEAFC)
North Pacific Fisheries Commission (NPFC)
South East Atlantic Fisheries Organisation (SEAFO)
South Pacific Regional Fisheries Management Organisation (SPRFMO)
Southern Indian Ocean Fisheries Agreement (SIOFA)
Western and Central Pacific Fisheries Commission (WCPFC)
The Combined IUU Fishing Vessel List merges all these sources into one list that provides a single reference point to identify whether a vessel is currently IUU listed. Vessels that have been IUU listed in the past and subsequently delisted (for example because of a change in ownership, or because the vessel is no longer in service) are also retained on the site, so that the site contains a full historic record of IUU listed fishing vessels.
Unlike the IUU lists published on individual RFMO websites, which may update vessel details infrequently or not at all, the Combined IUU Fishing Vessel List is kept up to date with the best available information regarding changes to vessel identity, flag state, ownership, location, and operations.
The Antyodaya Saral Haryana Portal is a pioneering initiative by the Government of Haryana aimed at providing citizens with seamless access to a wide range of government services
This report explores the significance of border towns and spaces for strengthening responses to young people on the move. In particular it explores the linkages of young people to local service centres with the aim of further developing service, protection, and support strategies for migrant children in border areas across the region. The report is based on a small-scale fieldwork study in the border towns of Chipata and Katete in Zambia conducted in July 2023. Border towns and spaces provide a rich source of information about issues related to the informal or irregular movement of young people across borders, including smuggling and trafficking. They can help build a picture of the nature and scope of the type of movement young migrants undertake and also the forms of protection available to them. Border towns and spaces also provide a lens through which we can better understand the vulnerabilities of young people on the move and, critically, the strategies they use to navigate challenges and access support.
The findings in this report highlight some of the key factors shaping the experiences and vulnerabilities of young people on the move – particularly their proximity to border spaces and how this affects the risks that they face. The report describes strategies that young people on the move employ to remain below the radar of visibility to state and non-state actors due to fear of arrest, detention, and deportation while also trying to keep themselves safe and access support in border towns. These strategies of (in)visibility provide a way to protect themselves yet at the same time also heighten some of the risks young people face as their vulnerabilities are not always recognised by those who could offer support.
In this report we show that the realities and challenges of life and migration in this region and in Zambia need to be better understood for support to be strengthened and tuned to meet the specific needs of young people on the move. This includes understanding the role of state and non-state stakeholders, the impact of laws and policies and, critically, the experiences of the young people themselves. We provide recommendations for immediate action, recommendations for programming to support young people on the move in the two towns that would reduce risk for young people in this area, and recommendations for longer term policy advocacy.
A Guide to AI for Smarter Nonprofits - Dr. Cori Faklaris, UNC CharlotteCori Faklaris
Working with data is a challenge for many organizations. Nonprofits in particular may need to collect and analyze sensitive, incomplete, and/or biased historical data about people. In this talk, Dr. Cori Faklaris of UNC Charlotte provides an overview of current AI capabilities and weaknesses to consider when integrating current AI technologies into the data workflow. The talk is organized around three takeaways: (1) For better or sometimes worse, AI provides you with “infinite interns.” (2) Give people permission & guardrails to learn what works with these “interns” and what doesn’t. (3) Create a roadmap for adding in more AI to assist nonprofit work, along with strategies for bias mitigation.
AHMR is an interdisciplinary peer-reviewed online journal created to encourage and facilitate the study of all aspects (socio-economic, political, legislative and developmental) of Human Mobility in Africa. Through the publication of original research, policy discussions and evidence research papers AHMR provides a comprehensive forum devoted exclusively to the analysis of contemporaneous trends, migration patterns and some of the most important migration-related issues.
Jennifer Schaus and Associates hosts a complimentary webinar series on The FAR in 2024. Join the webinars on Wednesdays and Fridays at noon, eastern.
Recordings are on YouTube and the company website.
https://www.youtube.com/@jenniferschaus/videos
1. Using ML for Propensity Scores
Propensity score: Pr |
Propensity score weighting and matching is common in
treatment effects literature
“Selection on observables assumption”: |
See Imbens and Rubin (2015) for extensive review
Propensity score estimation is a pure prediction problem
Machine learning literature applies propensity score weighting: e.g.
Beygelzimer and Langford (2009), Dudick, Langford and Li (2011)
Properties or tradeoffs in selection among ML approaches
Estimated propensity scores work better than true propensity score
(Hirano, Imbens and Ridder (2003)), so optimizing for out of sample
prediction is not the best path
Various papers consider tradeoffs, no clear answer, but classification trees
and random forests do well
2. Using ML for Model Specification under
Selection on Observables
A heuristic:
If you control richly for covariates, can estimate
treatment effect ignoring endogeneity
This motivates regressions with rich specification
Naïve approach motivated by heuristic using
LASSO
Keep the treatment variable out of the model
selection by not penalizing it
Use LASSO to select the rest of the model
specification
Problem:
Treatment variable is forced in, and some covariates
will have coefficients forced to zero.
Treatment effect coefficient will pick up those effects
and will thus be biased.
See Belloni, Chernozhukov and Hansen JEP 2014 for
an accessible discussion of this
Better approach:
Need to do variable
selection via LASSO for
the selection equation
and outcome equation
separately
Use LASSO with the
union of variables
selected
Belloni, Chernozhukov &
Hansen (2013) show that
this works under some
assumptions, including
constant treatment
effects
4. Using ML for the first stage of IV
IV assumptions
|
See Imbens and Rubin (2015) for extensive review
First stage estimation: instrument selection and functional
form
| , This is a prediction problem where
interpretability is less important
Variety of methods available
Belloni, Chernozhukov, and Hansen (2010); Belloni, Chen,
Chernozhukov and Hansen (2012) proposed LASSO
Under some conditions, second stage inference occurs as usual
Key: second-stage is immune to misspecification in the first stage
5. Open Questions and Future Directions
Heterogeneous treatment effects in LASSO
Beyond LASSO
What can be learned from statistics literature and treatment
effect literature about best possible methods for selection on
observables and IV cases?
Are there methods that avoid biases in LASSO, that preserve
interpretability and ability to do inference?
Only very recently are there any results about normality of random
forest estimators (e.g.Wager 2014)
What are best-performing methods?
More general conditions where standard inference is valid, or
corrections to standard inference
6. Machine Learning Methods for
Estimating Heterogeneous Causal
Effects
Athey and Imbens, 2015
http://arxiv.org/abs/1504.01132
7. Motivation I: Experiments and Data-Mining
Concerns about ex-post “data-mining”
In medicine, scholars required to pre-specify analysis plan
In economic field experiments, calls for similar protocols
But how is researcher to predict all forms of
heterogeneity in an environment with many covariates?
Goal:
Allow researcher to specify set of potential covariates
Data-driven search for heterogeneity in causal effects with
valid standard errors
8. Motivation II: Treatment Effect
Heterogeneity for Policy
Estimate of treatment effect heterogeneity needed for
optimal decision-making
This paper focuses on estimating treatment effect as
function of attributes directly, not optimized for choosing
optimal policy in a given setting
This “structural” function can be used in future decision-
making by policy-makers without the need for
customized analysis
9. Preview
Distinguish between causal effects and attributes
Estimate treatment effect heterogeneity:
Introduce estimation approaches that combine ML prediction
& causal inference tools
Introduce and analyze new cross-validation approaches
for causal inference
Inference on estimated treatment effects in
subpopulations
Enabling post-experiment data-mining
10. Regression Trees for Prediction
Data
Outcomes Yi, attributes Xi.
Support of Xi is X.
Have training sample with
independent obs.
Want to predict on new
sample
Ex: Predict how many
clicks a link will receive if
placed in the first position
on a particular search
query
Build a “tree”:
Partition of X into “leaves” X j
Predict Y conditional on realization of X
in each region X j using the sample mean
in that region
Go through variables and leaves and
decide whether and where to split leaves
(creating a finer partition) using in-sample
goodness of fit criterion
Select tree complexity using cross-
validation based on prediction quality
11. Regression Trees for Prediction: Components
1. Model and Estimation
A. Model type:Tree structure
B. Estimator ̂ : sample mean of Yi within leaf
C. Set of candidate estimators C: correspond to different specifications of
how tree is split
2. Criterion function (for fixed tuning parameter )
A. In-sample Goodness-of-fit function:
Qis = -MSE (Mean Squared Error)=- ∑
A. Structure and use of criterion
i. Criterion: Qcrit = Qis – x # leaves
ii. Select member of set of candidate estimators that maximizes Qcrit, given
3. Cross-validation approach
A. Approach: Cross-validation on grid of tuning parameters. Select tuning
parameter with highest Out-of-sample Goodness-of-Fit Qos.
B. Out-of-sample Goodness-of-fit function: Qos = -MSE
12. Using Trees to Estimate Causal Effects
Model:
Suppose random assignment of Wi
Want to predict individual i’s treatment effect
1 0
This is not observed for any individual
Not clear how to apply standard machine learning tools
Let
13. Using Trees to Estimate Causal Effects
, | ,
1, 0,
Approach 1:Analyze two groups separately
Estimate 1, using dataset where 1
Estimate 0, using dataset where 0
Use propensity score weighting (PSW) if
needed
Do within-group cross-validation to choose
tuning parameters
Construct prediction using
̂ 1, ̂ 0,
Approach 2: Estimate , using tree
including both covariates
Include PS as attribute if needed
Choose tuning parameters as usual
Construct prediction using
̂ 1, ̂ 0,
Estimate is zero for x where tree does not
split on w
Observations
Estimation and cross-validation
not optimized for goal
Lots of segments in Approach 1:
combining two distinct ways to
partition the data
Problems with these approaches
1. Approaches not tailored to the goal
of estimating treatment effects
2. How do you evaluate goodness of fit
for tree splitting and cross-validation?
1 0 is not observed and
thus you don’t have ground truth for any
unit
14. Proposed Approach 3: Transform the Outcome
Suppose we have 50-50 randomization of treatment/control
Let ∗ 2 1
2 0
Then ∗
2 ⋅ 1 0
Suppose treatment with probability pi
Let ∗
1
0
Then ∗
1 1 0
Selection on observables or stratified experiment
Let ∗
Estimate using traditional methods
15. Causal Trees:
Approach 3 (Conventional Tree, Transformed Outcome)
1. Model and Estimation
A. Model type:Tree structure
B. Estimator ̂∗
: sample mean of ∗
within leaf
C. Set of candidate estimators C: correspond to different specifications of
how tree is split
2. Criterion function (for fixed tuning parameter )
A. In-sample Goodness-of-fit function:
Qis = -MSE (Mean Squared Error) ∑ ∗ ∗
A. Structure and use of criterion
i. Criterion: Qcrit = Qis – x # leaves
ii. Select member of set of candidate estimators that maximizes Qcrit, given
3. Cross-validation approach
A. Approach: Cross-validation on grid of tuning parameters. Select tuning
parameter with highest Out-of-sample Goodness-of-Fit Qos.
B. Out-of-sample Goodness-of-fit function: Qos = -MSE
16. Critique of Proposed Approach 3:
Transform the Outcome
∗
1
0
Within a leaf, sample average of ∗
is not most efficient
estimator of treatment effect
The proportion of treated units within the leaf is not the same
as the overall sample proportion
This weights treatment group mean by p, not by actual fraction
of treated in leaf
This motivates modification:
Use sample average treatment effect in the leaf (average of
treated less average of control)
17. Critique of Proposed Approach 3:
Transform the Outcome
Use of transformed outcome creates noise in tree splitting and
in out-of-sample cross-validation
In-sample:
Use variance of prediction for in-sample goodness of fit
For an estimator guaranteed to be unbiased in sample (such as sample
average treatment effect), the variance of the estimator measures
predictive power
Out of sample:
Use a matching estimator to construct estimate of ground truth
treatment effect out of sample. Single match minimizes bias. ̂ ,
Matching estimator and transformed outcome both unbiased in large
sample when perfect matching can be found. But transformed outcome
introduces variance due to weighting factor; matching estimator controls
for predictable component of variance
∗
1 0
̂ 1 | 0 |
18. Causal Trees
1. Model and Estimation
A. Model type:Tree structure
B. Estimator ̂ : sample average treatment effect within leaf
C. Set of candidate estimators C: correspond to different specifications of
how tree is split
2. Criterion function (for fixed tuning parameter )
A. In-sample Goodness-of-fit function:
Qis ∑
A. Structure and use of criterion
i. Criterion: Qcrit = Qis – x # leaves
ii. Select member of set of candidate estimators that maximizes Qcrit, given
3. Cross-validation approach
A. Approach: Cross-validation on grid of tuning parameters. Select tuning
parameter with highest Out-of-sample Goodness-of-Fit Qos.
B. Out-of-sample Goodness-of-fit function: Qos = - ∑ ,
19. Comparing “Standard” and Causal
Approaches
They will be more similar
If treatment effects and levels are highly correlated
Two-tree approach
Will do poorly if there is a lot of heterogeneity in levels that is unrelated to
treatment effects; trees are much too complex without predicting treatment
effects
Will do well in certain specific circumstances, e.g.
Control outcomes constant in covariates
Treatment outcomes vary with covariates
Transformed outcome
Will do badly if there is a lot of observable heterogeneity in outcomes, and if
treatment probabilities are unbalanced or have high variance
Variance in criterion functions leads to trees that are too simple as they
criterion erroneously finds a lack of fit
How to compare approaches?
1. Oracle (simulations)
2. Transformed outcome goodness of fit
3. Matching goodness of fit
20. Inference
Conventional wisdom is that trees are bad for inference
The predictions are discontinuous in tree and not normally distributed. But we
are not interested in inference on tree structure.
Attractive feature of trees:
Can easily separate tree construction from treatment effect estimation
Tree constructed on training sample is independent of sampling variation in the
test sample
Holding tree from training sample fixed, can use standard methods to conduct
inference within each leaf of the tree on test sample
Can use any valid method for treatment effect estimation, not just the methods used in
training
For observational studies, literature (e.g. Hirano, Imbens and Ridder (2003))
requires additional conditions for inference
E.g. leaf size must grow with population
Future research: extend ideas beyond trees
Bias arises in LASSO as well in the absence of strong sparsity conditions.
Expand on insight: separate datasets used for model selection and estimation of
prediction for a given model yields valid inference. See, e.g., Denil, Matheson, and
de Freitas (2014) on random forests.
21. Problem: Treatment Effect Heterogeneity in
Estimating Position Effects in Search
Queries highly heterogeneous
Tens of millions of unique search phrases each month
Query mix changes month to month for a variety of reasons
Behavior conditional on query is fairly stable
Desire for segments.
Want to understand heterogeneity and make decisions based
on it
“Tune” algorithms separately by segment
Want to predict outcomes if query mix changes
For example, bring on new syndication partner with more queries of a
certain type
22. Relevance v. Position
25.4%
6.9%
4.0% 2.1%
4.9%
3.5%
1.7%
13.5%
17.9%
21.6%
Control
(1st Position)
(1,3) (1,5) (1,10)
CTR
Loss in CTR from Link Demotion (US All Non-Navigational)
Original CTR of Position Gain from Increased Relevance Loss from Demotion
23. Search Experiment Tree: Effect of Demoting
Top Link (Test Sample Effects) Some data
excluded with
prob p(x):
proportions do
not match
population
Highly navigational
queries excluded
26. Conclusions
Key to approach
Distinguish between causal and predictive parts of model
“Best of Both Worlds”
Combining very well established tools from different literatures
Systematic model selection with many covariates
Optimized for problem of causal effects
In terms of tradeoff between granular prediction and overfitting
With valid inference
Easy to communicate method and interpret results
Output is a partition of sample, treatment effects and standard errors
Important application
Data-mining for heterogeneous effects in randomized experiments
27. Literature
Approaches in the spirit of single tree/2 trees
Beygelzimer and Langford (2009)
Analogous to “two trees” approach with multiple
treatments; construct optimal policy
Foster,Tailor, Ruberg(2011)
Estimate , using random forests, define
̂ ̂ 1, ̂ 0, , and do trees on ̂ .
Imai and Ratkovic (2013)
In context of randomized experiment, estimate
, using lasso type methods, and then
̂ ̂ 1, ̂ 0, .
Transformed outcomes or covariates
Tibshirani et al (2014);Weisberg and Pontes
(2015) in regression/LASSO setting
Dudick, Langford, and Li (2011) and Beygelzimer
and Langford (2009) for optimal policy
Don’t highlight or address limitations of
transformed outcomes in estimation & criteria
Estimating treatment effects directly
at leaves of trees
Su,Tsai,Wang, Nickerson, Li
(2009)
Do regular tree, but split if the t-
stat for the treatment effect
difference is large, rather than
when the change in prediction
error is large.
Zeileis, Hothorn, and Hornick
(2005)
“Model-based recursive
partitioning”: estimate a model at
the leaves of a tree. In-sample
splits based on prediction error,
do not focus on out of sample
cross-validation for tuning.
None of these explore cross-
validation based on treatment effect.
28. Extensions (Work in Progress)
Alternatives for cross-validation criteria
Optimizing selection on observables case
What is the best way to estimate propensity score for
this application?
Alternatives to propensity score weighting
29. Heterogeneity: Instrumental Variables
Setup
Binary treatment, binary instrument case
Instrument Zi
∆
1, ∈ 0, ∈
∆
Pr 1| 1, ∈ Pr 1| 0, ∈
LATE estimator for ∈ is:
∆
∆
LATE heterogeneity issues
Tree model: want numerator and denominator
on same set S, to get LATE for units w/ xi in S.
Set of units shifted by instrument varies with x
Average of LATE estimators over all regions is
NOT equal to the LATE for the population
Proposed Method
Estimation & Inference:
Estimate numerator and
denominator simultaneously with a
single tree model
Inference on a distinct sample, can
do separately within each leaf
In-sample goodness of fit:
Prediction accuracy for both
components separately
Weight two components
In-sample criterion penalizes
complexity, as usual
Cross-validation
Bias paramount: is my tree overfit?
Criterion: For each unit, find closest
neighbors and estimate LATE (e.g.
kernel)
Two parameters instead of one:
complexity and relative weight to
numerator
Can also estimate an approximation
for optimal weights
30. Next Steps
Application to demand elasticities (Amazon, eBay,
advertisers)
Can apply methods with regression at the bottom of
the tree—some modifications needed
More broadly, richer demand models at scale
Lessons for economists
ML methods work better in economic problems when
customized for economic goals
Not hard to customize methods and modify them
Not just possible but fairly easy to be systematic about
model selection
32. Optimal Decision Policies
Decision Policies v.
Treatment Effects
In some applications, the
goal is directly to estimate
an optimal decision policy
There may be a large
number of alternatives
Decisions are made
immediately
Examples
Offers or marketing to
users
Advertisements
Mailings or emails
Online web page
optimization
Customized prices
33. Model
Outcome Yi incorporates both
costs and benefits
If cost is known, e.g. a mailing,
define outcome to include cost
Treatment Wi is multi-valued
Attributes Xi observed
Maintain selection on
observables assumption:
|
Propensity score:
Pr |
Optimal policy:
(x) = argmaxwE[Yi(w)|Xi=x]
Examples/interpretation
Marketing/web site design
Outcome is voting, purchase, a
click, etc.
Treatment is the offer
Past user behavior used to
define attributes
Selection on observables
justified by past
experimentation (or real-time
experimentation)
Personalized medicine
Treatment plan as a function of
individual characteristics
34. Learning Policy Functions
ML Literature:
Contextual bandits (e.g., John
Langford), associative
reinforcement learning, associative
bandits, learning with partial
feedback, bandits with side
information, partial label problem
Cost-sensitive classification
Classifiers (e.g. logit, CART, SVM)
= discrete choice models
Weight observations by
observation-specific weight
Objective function: minimize
classification error
The policy problem
Minimize regret from suboptimal
policy (“policy regret”)
∗
For 2-choice case:
Procedure with transformed outcome:
Train classifier as if obs. treatment is optimal:
(features, choice, weight)= (Xi, Wi, ).
Estimated classifier is a possible policy
Result:
The loss from the cost-weighted classifier
(misclassification error minimization)
is the same in expectation
as the policy regret
Intuition
The expected value of the weights conditional
on xi,wi is E[Yi(wi)|Xi=xi]
Implication
Use off-the-shelf classifier to learn optimal
policies, e.g. logit, CART, SVM
Literature considers extensions to multi-
valued treatments (tree of binary classifiers)
35. Weighted Classification Trees:
Transformed Outcome Approach
Interpretation
This is analog of using the transformed outcome approach for heterogeneous
treatment effects, but for learning optimal policies
The in-sample and out-of-sample criteria have high variance, and don’t adjust for
actual sample proportions or predictable variation in outcomes as function of X
Comparing two policies: Loss A – Loss B with NT units
Policy A & B Rec’s Treated
Units
Control
Units
Expected value of sum
Region S10
A:Treat
B: NoTreat
1
∑
1
∑ Pr ∈ | ∈
Region S01
A: NoTreat
B:Treat
1
∑
1
∑
Pr ∈ | ∈
36. Alternative: Causal Policy Tree
(Athey-Imbens 2015-WIP)
Improve by same logic that causal trees improved on transformed outcome
In sample
Estimate treatment effect ̂ within leaves using actual proportion treated in
leaves (average treated outcomes – average control outcomes)
Split based on classification costs, using sample average treatment effect to
estimate cost within a leaf. Equivalent to modifying TO to adjust for correct leaf
treatment proportions.
Comparing two policies: Loss A – Loss B with NT units
Policy A & B
Rec’s
Treated
Units
Control
Units
Expected value of sum
Region S10
A:Treat
B: NoTreat
∑ ̂
1
∑ ̂ Pr ∈ | ∈
Region S01
A: NoTreat
B:Treat
1
∑ ̂
1
∑ ̂ Pr ∈ | ∈
37. Alternative: Causal Policy Tree
(Athey-Imbens 2015-WIP)
Comparing two policies: Loss A – Loss B with NT units
Policy A & B
Rec’s
Treated
Units
Control
Units
Expected value of sum
Region S10
A:Treat
B: NoTreat
1
∑ ̂
1
∑ ̂ Pr ∈ | ∈
Region S01
A: NoTreat
B:Treat
1
∑ ̂
1
∑ ̂
Pr ∈ | ∈
Policy A & B
Rec’s
Treated
Units
Control
Units
Expected value of sum
Region S10
A:Treat
B: NoTreat
1
∑
1
∑ Pr ∈ | ∈
Region S01
A: NoTreat
B:Treat
1
∑
1
∑
Pr ∈ | ∈
38. Alternative approach for cross-validation criterion
Use nearest-neighbor matching to estimate treatment effect
for test observations
Categorize as misclassified at the individual unit level
Loss function is mis-classification error for misclassified units
When comparing two policies (classifiers), for unit where
policies have different recommendations, the difference in
loss function is the estimated treatment effect for that unit
If sample is large s.t. close matches can be found, this criteria
may be lower variance than transformed outcome in small
samples, and thus a better fit is obtained
Two alternative policies may be similar except in small regions, so
small sample properties are key
Alternative: Causal Policy Tree
(Athey-Imbens 2015-WIP)
39. Inference
Not considered in contextual bandit literature
As before, split the sample for estimating classification tree
and for conducting inference.
Within each leaf:
Optimal policy is determined by sign of estimated treatment effect.
Simply use conventional test of one-sided hypothesis that estimate
of sign of treatment effect is wrong.
Alternative: Causal Policy Tree
(Athey-Imbens 2015-WIP)
40. Existing ML Literature
With minimal coding, apply pre-packaged classification tree using
transformed outcome as weights
Resulting tree is an estimate of optimal policy.
For multiple treatment options
Follow contextual bandit literature and construct tree of binary
classifiers. Race pairs of alternatives, then race winners against
each other on successively smaller subsets of the covariate space.
Also propose further transformations (offsets)
Our observation:
Can do inference on hold-out sample taking tree as fixed.
Can improve on pre-packaged tree with causal policy tree.
Also relates to a small literature in economics:
e.g. Hirano & Porter (2009), Batthacharya & Dupas (2012)
Estimating Policy Functions: Summary
41. Other Related Topics
Online learning
See e.g. Langford
Explore/exploit
Auer et al ’95, more recent work by Langford et al
Doubly robust estimation
Elad Hazan, Satyen Kale, Better Algorithms for Benign Bandits,
SODA 2009.
David Chan, Rong Ge, Ori Gershony,Tim Hesterberg, Diane
Lambert, Evaluating Online Ad Campaigns in a Pipeline: Causal
Models at Scale, KDD 2010
Dudick, Langford, and Li (2011)
43. Inference for Causal Effects v. Attributes:
Abadie, Athey, Imbens & Wooldridge (2014)
Approach
Formally define a population of
interest and how sampling occurs
Define an estimand that answers the
economic question using these
objects (effects versus attributes)
Specify:“What data are missing, and
how is the difference between your
estimator and the estimand
uncertain?”
Given data on 50 states from 2003, we
know with certainty the difference in
average income between coast and interior
Although we could contemplate using data
from 2003 to estimate the 2004, difference
this depends on serial correlation within
states, no direct info in cross-section
Application to Effects v.
Attributes in Regression
Models
Sampling: Sample/population does
not go to zero, finite sample
Causal effects have missing data:
don’t observe both treatments for
any unit
Huber-White robust standard
errors are conservative but best
feasible estimate for causal effects
Standard errors on fixed attributes
may be much smaller if sample is
large relative to population
Conventional approaches take into
account sampling variance that
should not be there
45. Robustness of Causal Estimates
Athey and Imbens (AER P&P, 2015)
General nonlinear models/estimation methods
Causal effect is defined as a function of model parameters
Simple case with binary treatment, effect is 1 0
Consider other variables/features as “attributes”
Proposed metric for robustness:
Use a series of “tree” models to partition the sample by attributes
Simple case: take each attribute one by one
Re-estimate model within each partition
For each tree, calculate overall sample average effect as a weighted
average of effects within each partition
This yields a set of sample average effects
Propose the standard deviation of effects as robustness measure
46. Robustness of Causal Estimates
Athey and Imbens (AER P&P, 2015)
Four Applications:
Randomly assigned training program
Treated individuals with artificial control group from census
data (Lalonde)
Lottery data (Imbens, Rubin & Sacerdote (2001))
Regression of earnings on education from NLSY
Findings
Robustness measure better for randomized experiments,
worse in observational studies
49. Robustness Metrics: Desiderata
Invariant to:
Scaling of explanatory variables
Transformations of vector of explanatory variables
Adding irrelevant variables
Each member model must be somehow distinct to create
variance, yet we want to allow lots of interactions
Need to add lots of rich but different models
Well-grounded way to weight models
This paper had equal weighting
50. Robustness Metrics: Work In Progress
Std Deviation versus Worst-Case
Desire for set of alternative
models that grows richer
New additions are similar to
previous ones, lower std dev
Standard dev metric:
Need to weight models to put
more weight on distinct
alternative models
“Worst-case” or “bounds”:
Find the lowest and highest
parameter estimates from a set
of models
Ok to add more models that
are similar to existing ones.
But worst-case is very sensitive
to outliers—how do you rule
out “bad” models?
Theoretical underpinnings
Subjective versus objective uncertainty
Subjective uncertainty: correct model
Objective uncertainty: distribution of
model estimates given correct model
What are the preferences of the
“decision-maker” who values robustness?
“Variational preferences”
“Worst-case” in set of possible beliefs, allow
for a “cost” of beliefs that captures beliefs
that are “less likely.” (see Strzalecki, 2011)
Our approach for exog. covariate case:
Convex cost to models that perform poorly
out of sample from a predictive perspective
Good model
Low obj. uncertainty: tightly estimated
Other models that predict outcomes well
also yield similar parameter estimates
51. Conclusions on Robustness
ML inspires us to be both systematic and pragmatic
Big data gives us more choices in model selection and ability
to evaluate alternatives
Maybe we can finally make progress on robustness