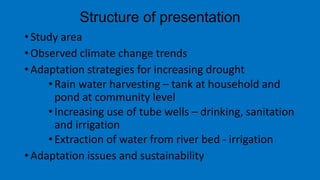
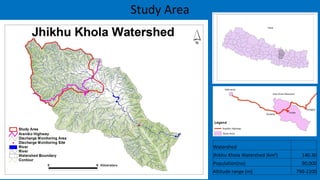
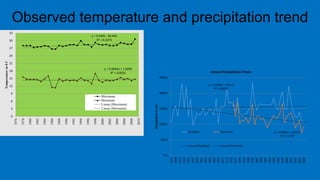
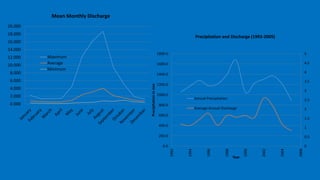
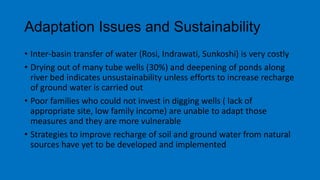
Climate Change Impacts on Water
Resources and Community
Adaptation: A Case of Jhiku Khola
Watershed in Nepal
Narendra Raj Khanal
Prem Sagar Chapagain
Central Department of Geography, Tribhuvan University, Kathmandu,
Nepal
Structure of presentation
• Study area
• Observed climate change trends
• Adaptation strategies for increasing drought
•Rain water harvesting – tank at household and
pond at community level
•Increasing use of tube wells – drinking, sanitation
and irrigation
•Extraction of water from river bed - irrigation
• Adaptation issues and sustainability
Watershed
Jhikhu Khola Watershed (km2) 140.30
Population(no) 90,000
Altitude range (m) 790-2200
Study Area
Observed temperature and precipitation trend
y = 0.049x - 69.446
R² = 0.3275
y = 0.0064x + 1.6069
R² = 0.0031
0
3
6
9
12
15
18
21
24
27
30
33
1976
1978
1980
1982
1984
1986
1988
1990
1992
1994
1996
1998
2000
2002
2004
2006
2008
2010
Temperaturein0C
Maximum
Minimum
Linear (Maximum)
Linear (Minimum)
y = 1.1996x + 1501.5
R² = 0.0052
y = -8.0801x + 1570.4
R² = 0.1178
0.0
500.0
1000.0
1500.0
2000.0
2500.0
1947
1949
1951
1953
1955
1957
1959
1961
1963
1965
1967
1969
1971
1973
1975
1977
1979
1981
1983
1985
1987
1989
1991
1993
1995
1997
1999
2001
2003
2005
2007
2009
Precipitationinmm
Annual Precipitation Trend
Dhulikhel Panchkhal
Linear (Dhulikhel) Linear (Panchkhal)
0.000
2.000
4.000
6.000
8.000
10.000
12.000
14.000
16.000
18.000
20.000
Mean Monthly Discharge
Maximum
Average
Minimum
0
0.5
1
1.5
2
2.5
3
3.5
4
4.5
5
0.0
200.0
400.0
600.0
800.0
1000.0
1200.0
1400.0
1600.0
1800.0
1992
1994
1996
1998
2000
2002
2004
2006
Precipitationinmm
Year
Precipitation and Discharge (1993-2005)
Annual Precipitation
Average Annual Discharge
Adaptation Measures: Construction of
Wells
VDC Number
Anaikot 21
Baluwa 186
Hokse 102
Kharelthok 12
Panchkhal 117
Palanchok 9
Total 447
VDC Number
Anaikot 21
Baluwa 186
Hokse 102
Kharelthok 12
Panchkhal 117
Palanchok 9
Total 447
y = -17.907x + 37001
R² = 0.1955
y = 2.4345x - 4859.1
R² = 0.7317
0
10
20
30
40
50
60
70
80
90
100
110
120
130
140
150
0.0
200.0
400.0
600.0
800.0
1000.0
1200.0
1400.0
1600.0
1800.0
1992
1994
1996
1998
2000
2002
2004
2006
2008
2010
2012
Precipitation
No of wells
Linear (Precipitation)
Linear (No of wells)
Strategies: Increase in the number of wells as the rains decline and fluctuates high
-4.5
-4
-3.5
-3
-2.5
-2
-1.5
-1
-0.5
0
June August October December February April
Average depth of water level by
season
-12.00
-10.00
-8.00
-6.00
-4.00
-2.00
0.00
1 3 5 7 9 11 13 15 17 19 21 23 25 27 29 31 33 35 37 39 41 43 45 47 49 51 53
Recorded water level by month
June August October December February April
-12.00
-10.00
-8.00
-6.00
-4.00
-2.00
0.00
1 3 5 7 9 11 13 15 17 19 21 23 25 27 29 31 33 35 37 39 41 43 45 47 49 51 53
Recorded minimum and maximum water level
Minimum Maximum
0.00
1.00
2.00
3.00
4.00
5.00
6.00
1 4 7 10 13 16 19 22 25 28 31 34 37 40 43 46 49 52 55
Fluctuation in water level
Difference Average
Water level in 37% tube
wells is less than the
average water level
Decreasing
Water Level
11% Detoriation in
Water Quality
11%
Dried Out
Within 5 Years
3%
Dried Out
Within 5-10
years
1%
No Change
73%
Under
Construction
1%
Condition of tube wells
Adaptation Measures: Construction of
Ditch Along the River Bed
Distribution of Ditches
Total Number of Ditches: 127
Google Earth ( Jan 26, 2010)
0
0.5
1
1.5
2
2.5
3
3.5
4
1 3 5 7 9 11 13 15 17 19 21 23 25 27 29 31 33 35 37 39 41 43 45 47
depth2013
Depth_2012
Density
(No/km)
Average
depth (m)
2012 16 1.11
2013 20 2.14
Strategies: Increase in the number of ditch and its depth
Adaptation measures: Rain water
collection Tanks at Household Level and
Water Storage Pond at Community Level
Adaptation: Rain water
harvesting (Tank)
Rain Water harvesting
Pond
Adaptation Measures: Change in Land
Use
• Abandonment of agricultural land
• Change in cropping patter ( maize)
Current cropping pattern and monthly rainfall
Type
Jan Feb Mar Apr May June July Aug Sep Oct Nov Dec
Push/Magh Magh/Phagun Phagun/Charitra Chaitra/Baisakha Baisakh/Jestha Jestha/Asar Asar/Shrawan Shrawan/Vadra Vadra/Aswin Aswin/Kartic Kartic/Mangsir Mangsir/Push
Khet1
Khet2
Khet3
Bari1
Bari2
Potato
Potato
Tomato/ cauliflower
Wheat
Tomato/ bean
Rice
Cauliflower
Tomato
Bean
Potato
Rice
Maze
Lady finger
Maize
Jan. Feb. March April May June July Aug. Sept. Oct. Nov. Dec.
Rainfall 12.1 21.9 1.2 75.8 25.3 90.5 321.4 321.3 215.9 5.7 19.4 0
0
30
60
90
120
150
180
210
240
270
300
330
360
Rainfallinmm
DroughtDrought Wet
Adaptation Issues and Sustainability
• Inter-basin transfer of water (Rosi, Indrawati, Sunkoshi) is very costly
• Drying out of many tube wells (30%) and deepening of ponds along
river bed indicates unsustainability unless efforts to increase recharge
of ground water is carried out
• Poor families who could not invest in digging wells ( lack of
appropriate site, low family income) are unable to adapt those
measures and they are more vulnerable
• Strategies to improve recharge of soil and ground water from natural
sources have yet to be developed and implemented
Thanks

Narendra raj khanal

  • 1.
    Climate Change Impactson Water Resources and Community Adaptation: A Case of Jhiku Khola Watershed in Nepal Narendra Raj Khanal Prem Sagar Chapagain Central Department of Geography, Tribhuvan University, Kathmandu, Nepal
  • 2.
    Structure of presentation •Study area • Observed climate change trends • Adaptation strategies for increasing drought •Rain water harvesting – tank at household and pond at community level •Increasing use of tube wells – drinking, sanitation and irrigation •Extraction of water from river bed - irrigation • Adaptation issues and sustainability
  • 3.
    Watershed Jhikhu Khola Watershed(km2) 140.30 Population(no) 90,000 Altitude range (m) 790-2200 Study Area
  • 4.
    Observed temperature andprecipitation trend y = 0.049x - 69.446 R² = 0.3275 y = 0.0064x + 1.6069 R² = 0.0031 0 3 6 9 12 15 18 21 24 27 30 33 1976 1978 1980 1982 1984 1986 1988 1990 1992 1994 1996 1998 2000 2002 2004 2006 2008 2010 Temperaturein0C Maximum Minimum Linear (Maximum) Linear (Minimum) y = 1.1996x + 1501.5 R² = 0.0052 y = -8.0801x + 1570.4 R² = 0.1178 0.0 500.0 1000.0 1500.0 2000.0 2500.0 1947 1949 1951 1953 1955 1957 1959 1961 1963 1965 1967 1969 1971 1973 1975 1977 1979 1981 1983 1985 1987 1989 1991 1993 1995 1997 1999 2001 2003 2005 2007 2009 Precipitationinmm Annual Precipitation Trend Dhulikhel Panchkhal Linear (Dhulikhel) Linear (Panchkhal)
  • 5.
  • 8.
  • 9.
    VDC Number Anaikot 21 Baluwa186 Hokse 102 Kharelthok 12 Panchkhal 117 Palanchok 9 Total 447
  • 11.
    VDC Number Anaikot 21 Baluwa186 Hokse 102 Kharelthok 12 Panchkhal 117 Palanchok 9 Total 447
  • 12.
    y = -17.907x+ 37001 R² = 0.1955 y = 2.4345x - 4859.1 R² = 0.7317 0 10 20 30 40 50 60 70 80 90 100 110 120 130 140 150 0.0 200.0 400.0 600.0 800.0 1000.0 1200.0 1400.0 1600.0 1800.0 1992 1994 1996 1998 2000 2002 2004 2006 2008 2010 2012 Precipitation No of wells Linear (Precipitation) Linear (No of wells) Strategies: Increase in the number of wells as the rains decline and fluctuates high
  • 13.
    -4.5 -4 -3.5 -3 -2.5 -2 -1.5 -1 -0.5 0 June August OctoberDecember February April Average depth of water level by season -12.00 -10.00 -8.00 -6.00 -4.00 -2.00 0.00 1 3 5 7 9 11 13 15 17 19 21 23 25 27 29 31 33 35 37 39 41 43 45 47 49 51 53 Recorded water level by month June August October December February April -12.00 -10.00 -8.00 -6.00 -4.00 -2.00 0.00 1 3 5 7 9 11 13 15 17 19 21 23 25 27 29 31 33 35 37 39 41 43 45 47 49 51 53 Recorded minimum and maximum water level Minimum Maximum 0.00 1.00 2.00 3.00 4.00 5.00 6.00 1 4 7 10 13 16 19 22 25 28 31 34 37 40 43 46 49 52 55 Fluctuation in water level Difference Average Water level in 37% tube wells is less than the average water level
  • 14.
    Decreasing Water Level 11% Detoriationin Water Quality 11% Dried Out Within 5 Years 3% Dried Out Within 5-10 years 1% No Change 73% Under Construction 1% Condition of tube wells
  • 15.
    Adaptation Measures: Constructionof Ditch Along the River Bed
  • 16.
    Distribution of Ditches TotalNumber of Ditches: 127 Google Earth ( Jan 26, 2010)
  • 17.
    0 0.5 1 1.5 2 2.5 3 3.5 4 1 3 57 9 11 13 15 17 19 21 23 25 27 29 31 33 35 37 39 41 43 45 47 depth2013 Depth_2012 Density (No/km) Average depth (m) 2012 16 1.11 2013 20 2.14 Strategies: Increase in the number of ditch and its depth
  • 18.
    Adaptation measures: Rainwater collection Tanks at Household Level and Water Storage Pond at Community Level
  • 19.
  • 20.
  • 21.
    Adaptation Measures: Changein Land Use • Abandonment of agricultural land • Change in cropping patter ( maize)
  • 22.
    Current cropping patternand monthly rainfall Type Jan Feb Mar Apr May June July Aug Sep Oct Nov Dec Push/Magh Magh/Phagun Phagun/Charitra Chaitra/Baisakha Baisakh/Jestha Jestha/Asar Asar/Shrawan Shrawan/Vadra Vadra/Aswin Aswin/Kartic Kartic/Mangsir Mangsir/Push Khet1 Khet2 Khet3 Bari1 Bari2 Potato Potato Tomato/ cauliflower Wheat Tomato/ bean Rice Cauliflower Tomato Bean Potato Rice Maze Lady finger Maize Jan. Feb. March April May June July Aug. Sept. Oct. Nov. Dec. Rainfall 12.1 21.9 1.2 75.8 25.3 90.5 321.4 321.3 215.9 5.7 19.4 0 0 30 60 90 120 150 180 210 240 270 300 330 360 Rainfallinmm DroughtDrought Wet
  • 23.
    Adaptation Issues andSustainability • Inter-basin transfer of water (Rosi, Indrawati, Sunkoshi) is very costly • Drying out of many tube wells (30%) and deepening of ponds along river bed indicates unsustainability unless efforts to increase recharge of ground water is carried out • Poor families who could not invest in digging wells ( lack of appropriate site, low family income) are unable to adapt those measures and they are more vulnerable • Strategies to improve recharge of soil and ground water from natural sources have yet to be developed and implemented
  • 24.