Download to read offline
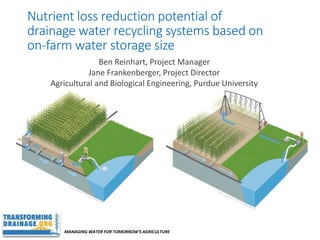
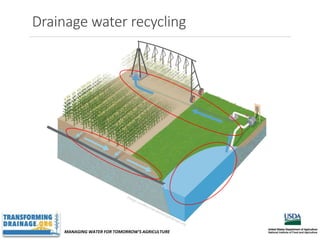
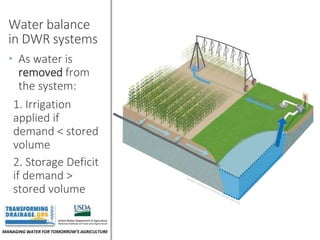
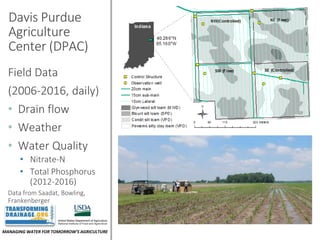
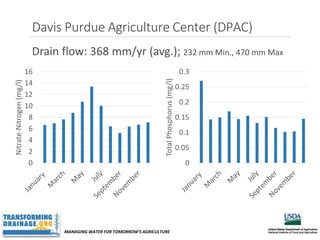
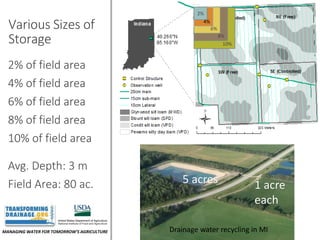
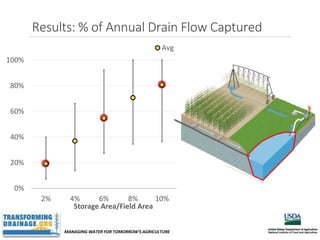
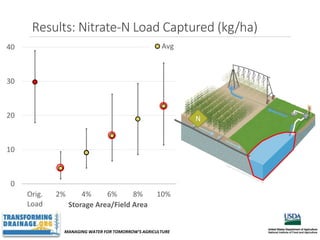
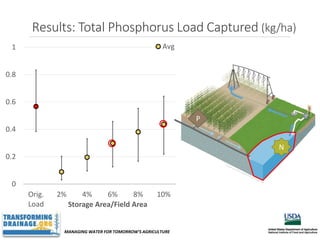
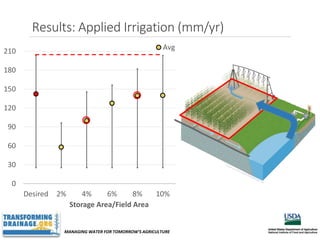
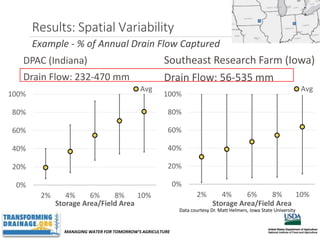
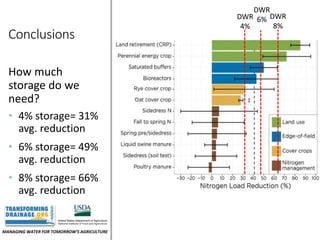


This document summarizes a study on drainage water recycling systems and their ability to reduce nutrient losses based on the size of on-farm water storage. The study uses data from 2006-2016 from the Davis Purdue Agriculture Center in Indiana to model various storage sizes from 2-10% of field area. Larger storage sizes were able to capture more annual drain flow and reduce nitrogen and phosphorus loads, with 8% storage capturing 66% of drain flow on average. The document concludes that drainage water recycling systems with storage sizes of 4-8% of field area can significantly reduce nutrient losses.


