SSI and risks of intensification: Case study on
water quality in the Ethiopian Highlands
Seifu A Tilahun, Feleke K. Sishu, Petra
Schmitter, Tammo Steenhuis
Small-scale irrigation: the answer to ecosystem health?
SIWI World Water Week 2018 – 26th August
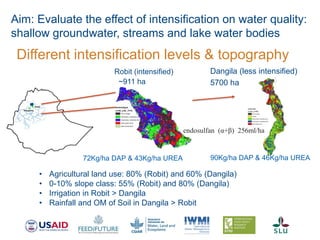
Different intensification levels & topography
Robit (intensified)
~911 ha
Dangila (less intensified)
5700 ha
Aim: Evaluate the effect of intensification on water quality:
shallow groundwater, streams and lake water bodies
• Agricultural land use: 80% (Robit) and 60% (Dangila)
• 0-10% slope class: 55% (Robit) and 80% (Dangila)
• Irrigation in Robit > Dangila
• Rainfall and OM of Soil in Dangila > Robit
72Kg/ha DAP & 43Kg/ha UREA 90Kg/ha DAP & 46Kg/ha UREA
endosulfan (α+β) 256ml/ha
a
Months
Dec,16Jan,17Feb,17M
ar,17Apr,17M
ay,17Jun,17Jul,17Aug,17Sep,17Oct,17Nov,17Dec,17Jan,18Feb,18M
ar,18Arl,18
Monthlyrainfall(mm)
0
100
200
300
400
500
600
700
800
Grourdwaterleveldepth(m)
0
1
2
3
4
5
6
7
8
9
10
11
12
13
14
Rain fall
Upslope
Mid-slope
Valley bottom
b
Months
Dec,16Jan,17Feb,17M
ar,17Apr,17M
ay,17Jun,17Jul,17Aug,17Sep,17O
ct,17Nov,17Dec,17Jan,18Feb,18M
ar,18Arl,18
Monthlyrainfall(mm)
0
100
200
300
400
500
600
700
800
Groundwaterleveldepth(m)
0
1
2
3
4
5
6
7
8
9
10
11
12
13
14
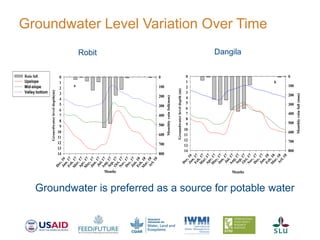
Groundwater Level Variation Over Time
Robit Dangila
Groundwater is preferred as a source for potable water
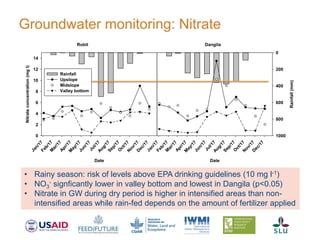
Groundwater monitoring: Nitrate
Date
Jan/17Feb/17M
ar/17Apr/17M
ay/17Jun/17
Jul/17Aug/17Sep/17O
ct/17N
ov/17D
ec/17
Nitrateconcentration(mgl)
0
2
4
6
8
10
12
14
Rainfall
Upslope
Midslope
Valley bottom
Date
Jan/17Feb/17M
ar/17Apr/17M
ay/17Jun/17
Jul/17Aug/17Sep/17O
ct/17N
ov/17D
ec/17
Rainfall(mm)
0
200
400
600
800
1000
Robit Dangila
• Rainy season: risk of levels above EPA drinking guidelines (10 mg l-1)
• NO3
- signficantly lower in valley bottom and lowest in Dangila (p<0.05)
• Nitrate in GW during dry period is higher in intensified areas than non-
intensified areas while rain-fed depends on the amount of fertilizer applied
Date
Jan/17Feb/17M
ar/17Apr/17M
ay/17Jun/17
Jul/17Aug/17Sep/17O
ct/17N
ov/17D
ec/17
Rainfall(mm)
0
200
400
600
800
1000
Date
Jan/17Feb/17M
ar/17Apr/17M
ay/17Jun/17
Jul/17Aug/17Sep/17O
ct/17N
ov/17D
ec/17
Phosphorusconcentration(mgl)
0.0
0.1
0.2
0.3
0.4
Rainfall
Upslope
Midslope
Valley bottom
Robit Dangila
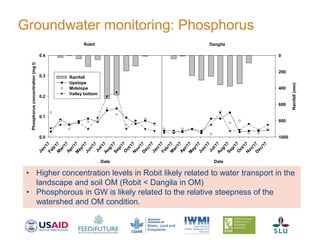
Groundwater monitoring: Phosphorus
• Higher concentration levels in Robit likely related to water transport in the
landscape and soil OM (Robit < Dangila in OM)
• Phosphorous in GW is likely related to the relative steepness of the
watershed and OM condition.
0
0.2
0.4
0.6
0.8
Nov-16
Jan-17
Feb-17
Apr-17
May-17
Jul-17
Sep-17
P-PO4
3-
0
0.2
0.4
0.6
0.8
Nov-16
Dec-16
Feb-17
Apr-17
May-17
Jul-17
Sep-17
Oct-17
0
2
4
6
8
10
0
2
4
6
8
10N-NO3
-
Dangila Robit
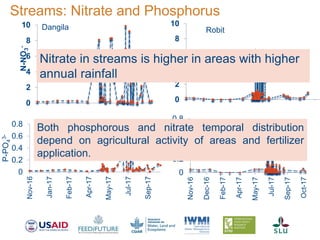
Streams: Nitrate and Phosphorus
Nitrate in streams is higher in areas with higher
annual rainfall
Both phosphorous and nitrate temporal distribution
depend on agricultural activity of areas and fertilizer
application.
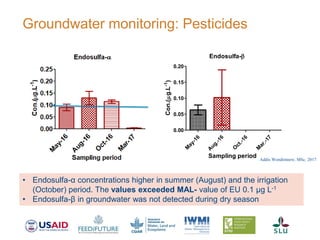
Groundwater monitoring: Pesticides
Addis Wondimnew, MSc. 2017
• Endosulfa-α concentrations higher in summer (August) and the irrigation
(October) period. The values exceeded MAL- value of EU 0.1 µg L-1
• Endosulfa-β in groundwater was not detected during dry season
Endosulfa-
M
ay-16
A
ug.-16
O
ct.-16
M
ar.-17
0.00
0.05
0.10
0.15
0.20
Sampling period
Con.(g.L-1
)
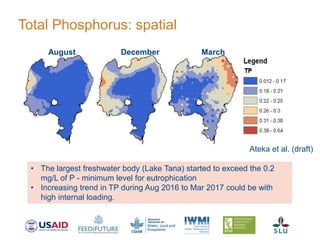
Total Phosphorus: spatial
8
August December March
• The largest freshwater body (Lake Tana) started to exceed the 0.2
mg/L of P - minimum level for eutrophication
• Increasing trend in TP during Aug 2016 to Mar 2017 could be with
high internal loading.
Ateka et al. (draft)
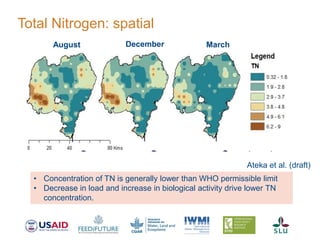
Total Nitrogen: spatial
9
August December March
• Concentration of TN is generally lower than WHO permissible limit
• Decrease in load and increase in biological activity drive lower TN
concentration.
Ateka et al. (draft)
 Target and promote intensified SSI in suitable areas through
evidence-base on agriculture-water-environment-health system
 Reverse degradation and rehabilitate watersheds (river basins)
for improved SSI
 Link watershed management with irrigation
 Support institutional changes and building to set guidelines,
monitor, regulate agrochemical use and occurance in water
bodies
 Increase smallholder awarness on the impact of agrochemicals
on water quality
Key messages: Recommendations for ensuring
small-scale irrigation and ecosystem health
Thank you
We are grateful to Feed the Future Innovation Lab for Small-Scale
Irrigation (ILSSI) and the Sustainable Intensification Innovation Lab for
their support of the Sustainably Intensified Production Systems Impact
on Nutrition (SIPSIN) project funded by USAID. The research is
conducted under a collaborative agreement between Bahir Dar
University and the International Water Management Institute.
This session was carried out and supported by the Feed the Future
Innovation Laboratory for Small-Scale Irrigation funded by USAID, the
CGIAR Research Program on Water, Land and Ecosystems (WLE)
and the Swedish University of Agricultural Sciences.