Download to read offline

![Image Processing for Automated Flaw Detection and CMYK model for Color Image Segmentation
www.iosrjournals.org 90 | Page
often poorly defined, creating difficulty in representing concepts and selecting important features used to solve
the problems. Type-1 (T1) fuzzy set (FS) has been around for more than four decades and yet not able to handle
all kinds of uncertainties appearing in real life. The above statement sounds paradoxical because the word fuzzy
has the connotation of uncertainty. The extension of T1 fuzzy systems, in particular type-2 (T2) accommodates
the system uncertainties and minimizes its effect considerably in decision making. However, T2 FS is difficult
to understand and explain. Application of T1 fuzzy logic to rule-based systems is most significant that
demonstrates its importance as a powerful design methodology to tackle uncertainties. A fuzzy logic system
(FLS) is described completely in terms of T1 fuzzy sets, called type-1 fuzzy logic system (T1FLS), whereas a
FLS with at least one T2 fuzzy set is called T2 fuzzy logic system (T2FLS). T1FLSs cannot directly handle rule
uncertainties because T1 fuzzy sets are certain. On the other hand, T2FLS is very useful in circumstances where
it is difficult to determine an exact membership function of a fuzzy set. Such cases are handled by rule
uncertainties and measurement uncertainties. Like T1FLS, T2 has wide applications and the potential of T2
systems outperforms T1 in most of the cases. The aim of the paper is to describe T2 fuzzy systems for managing
uncertainties, identifying the frontier research areas where T2 fuzzy logic is applied and proposes an algorithm
on application of type-2 fuzzy sets in color image segmentation.
II. THERMAL CONTRASTS
The most basic data processing performed on pulsed thermographic data is the computation of thermal
contrasts. Thermal contrasts have the advantages of being less sensitive to noise and to the surface optical
properties1. The main problem with thermal contrast computation is that it requires a priori knowledge of a
sound area. Although more recently new contrast methods have been developed to overcome this problem
III. PULSED PHASE THERMOGRAPHY
Pulsed phase thermography (PPT) is a processing method in which the thermal images are transformed
from the time domain to the frequency domain5. This can be performed by processing a sequence of thermal
images (thermogram) with discrete Fourier transform (DFT):
…………………………….(1)
Where n designates the frequency increments (n=0,1,…N- 1), and Re and Im are the real and the imaginary
parts of
the DFT, respectively. For convenience, fast Fourier transform (FFT) a computationally efficient version of the
DFT is generally used. Once the data has been converted into the Fourier domain, the phase () and amplitude
(A) images of the different frequencies can be calculated using:
………………………(2)
The phase is particularly advantageous since it is less affected by environmental reflections, emissivity
variations, non-uniform heating, surface geometry and orientation. The phase characteristics are very attractive
not only for qualitative inspections but also for quantitative ones [6].
IV. THERMOGRAPHIC SIGNAL RECONSTRUCTION
Thermographic signal reconstruction (TSR)8 is a processing technique that uses polynomial
interpolation to allow increasing the spatial and the temporal resolution of a thermogram sequence, while
reducing the amount of data to be analyzed. TSR is based on the assumption that temperature profiles for non-
defective areas follow the decay curve given by the one-dimensional solution of the Fourier diffusion equation
for an ideal pulse uniformly applied to the surface of a semi-infinite body9, which is given by:](https://image.slidesharecdn.com/n01368999-140501011356-phpapp01/85/Image-Processing-for-Automated-Flaw-Detection-and-CMYK-model-for-Color-Image-Segmentation-using-Type-2-Fuzzy-Sets-2-320.jpg)
![Image Processing for Automated Flaw Detection and CMYK model for Color Image Segmentation
www.iosrjournals.org 91 | Page
……………………..(3)
Where T(t) is the temperature evolution, Q is the energy applied at the surface and e is the thermal effusively of
the sample, which is defined as: e kc ; where k, ρ, and c are the thermal conductivity, the mass density and
the specific heat, respectively. Equation 3 may be rewritten in a logarithmic notation and expanded into a
polynomial series.
……(4)
The noise reduction resulting from this polynomial interpolation [11,][12] enables the use of derivate processing
to enhance the contrast created by the presence of defects. The first and second derivatives of the thermogram
sequence provide information on the rate of temperature variation. These measurements are analogous to the
relations between position, velocity and acceleration in mechanics. The original thermogram corresponds to the
surface temperature of the inspected object (position). The first derivative gives information on the cooling rate
of the surface temperature (velocity), while the second derivative provides information on the acceleration or
deceleration of this cooling rate (acceleration).
V. PRINCIPAL COMPONENT ANALYSIS
Principal component analysis (PCA) 13, also known as principal component thermography (PCT)14, is
an orthogonal linear transformation that transforms the thermogram sequence into a new coordinate system. The
idea behind PCA is to remove possible correlation in the data by creating a new uncorrelated dataset called
principal components. It has been applied in thermal NDT for data reduction and flaw contrast enhancement.
The algorithm is based on the decomposition of the thermogram into its principal components using singular
value decomposition (SVD). The first step of the PCA algorithm is to reshape the three-dimensional
thermogram into a two dimensional array where the columns and rows contain the spatial and temporal
information, respectively. Thus, the original thermogram T(x,y,t) becomes A(n,m) where n = Nx Ny , m =
Nt, Nx and Ny are the number of pixels per row and column of the IR camera and Nt is the number of thermal
images in the thermogram sequence. The two-dimensional array A is then adjusted by subtracting the mean
along the time dimension, and decomposed into eigenvectors and eigenvalues.
……..(5)
Where U and V are orthogonal matrices which columns form the eigenvectors of AAT and ATA respectively,
and Г is a diagonal matrix that contains the singular values of ATA. Since the thermal images in the thermogram
are non-erratic and vary slowly in time, the principal temporal variations of the dataset are usually contained
within the first few eigenvectors. The principal component images are formed by calculating the dot product of
the eigenvector and the measured temperature.
VI. MODELING UNCERTAINTY USING OF FUZZY LOGIC
Uncertainty appears in many forms and independent of the kind of fuzzy logic (FL) or any kind of
methodology one uses to handle it . Uncertainty involves in real life, due to deficiency of information in various
forms. One of the best sources for general discussions about uncertainty is found in. Two types of uncertainties,
randomness and fuzziness exist, where probability theory is associated with the former and FS with the latter.
Fuzziness (or vagueness) generally recognizes uncertainty resulting from the imprecise boundaries of fuzzy sets,
nonspecificity connected with sizes (cardinalities) of relevant sets and strife (or discord), which expresses
conflicts among the various sets of alternatives. T1 fuzzy sets are certain and not able to handle all kinds of
uncertainties using a single membership value, which is crisp. A FLS needs some measure to capture
uncertainties than just a single number. The extended FL, named as T2FL able to handle uncertainties by
modeling and subsequently minimizing their effects. T2 fuzzy logic provides the measure of dispersion,
fundamental to the design of systems that includes linguistic or numerical uncertainties translating into rules.
T2 fuzzy set is a natural framework for handling both randomness and fuzziness. It is the third dimension of T2
membership function (MF) that allows us to evaluate the model uncertainties. A T2FLS has more design](https://image.slidesharecdn.com/n01368999-140501011356-phpapp01/85/Image-Processing-for-Automated-Flaw-Detection-and-CMYK-model-for-Color-Image-Segmentation-using-Type-2-Fuzzy-Sets-3-320.jpg)
![Image Processing for Automated Flaw Detection and CMYK model for Color Image Segmentation
www.iosrjournals.org 94 | Page
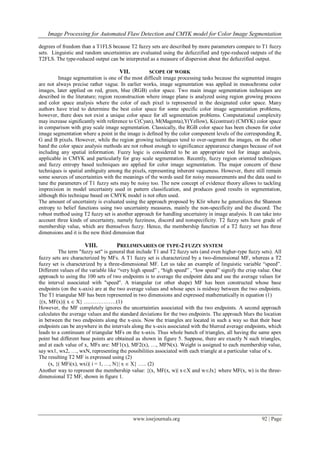
Fig. 4 OU: (a) Gaussian MF with Uncertain Standard Deviation (b) Gaussian MF with uncertain mean (c) Sigmoidal MF with Inflection
Uncertainties (d) Granulated Sigmoidal MF with Granulation Uncertainties.
X. TYPE-2 FUZZY SET ENTROPY
The process of obtaining necessary information to perform segmentation leads to the correct selection
of the regions of interest of the color image. The proposed work applied theory of fuzzy set to evaluate the
regions of interest with fixed accuracy. Fuzziness index [12] and entropy [13] provide the measurement of
degree of uncertainty [14] of the segmentation process. To measure the fuzziness of images, a few formal
definitions are discussed below. An ordinary fuzzy set A of the universe of discourse X is classically defined by
its membership function µA(x): X → [0, 1], xX.
A point x for which µA(x) = 0.5 is said a crossover point of fuzzy set A X . The uncertainty is represented
by the ―α-cut‖ of fuzzy set A, whose membership function µαA(x): X{0,1} is defined in (4).
µαA(x) = 1 if x α
= 0 if x < α …. (4)
Where α [0, 1] and x X
The fuzziness index γ(A) of a fuzzy set A reflects the degree of ambiguity by measuring the distance d(A, A0.5)
between A and its nearest set A0.5 (α=0.5) as described in (5).
γ(A) = 2d(A, A0.5) / n1/p …. (5)
A positive scalar p is introduced to keep γ(A) in between zero and one depending on the type of distance
function used. In the proposed algorithm with the help ―α-cut‖ ―n-cut‖ fuzzy set is described, where n is the
number of elements of n-cut vector. This measure represents the area between two membership functions µA(x)
and µαA(x), described in (6).
γ(A) = X
lim
(
dxxx AA ||
1 5.0
) …. (6)
where
represents the size of the set Ω ( linear index values ) and in practice we can use the discrete
formula, given in (7)
pp
A
Xx
A
p
A xx
X
1
5.0
]||
1
[
…. (7)
pA is a monotonic function, where p ,1[ +] and
X
represents the cardinality of the set X.
The term entropy of fuzzy set A, denoted by H(A) (monotonic increasing function) was first introduced by De
Luca and Termini, expressed in (8).
H(A) = (
2ln./) nxS An …. (8)
Where
xS An = -µA(x)ln(µA(x))-(1-(µA(x))ln(1-µA(x)))
In this work, we use the extension of the ―De Luca and Termini‖ measure to discrete images, proposed by Pal
[53]. The (linear) index of fuzziness of an MN image subset A X with L gray levels g[0, L−1] is defined
in (9) and shown in figure 5.
(A) =
)]()([*)(
1 1
0
gggh
MN
l
L
g
u
…. (9)
Where h(g) represents the histogram of the image and µX(g), the membership function consists of u(g) and
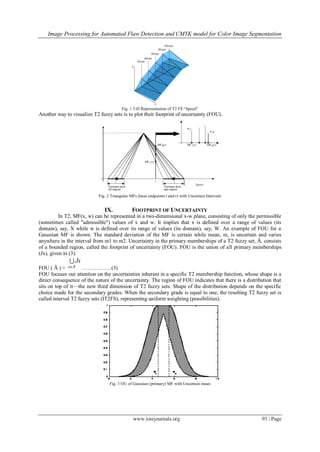
l(g). Entropies are used in with T2 fuzzy sets in gray scale image segmentation by extending the works
proposed by Tizhoosh. Tizhoosh applied T2 fuzzy sets for gray scale image thresholding and obtained good
results even in case of very noisy images. As proposed in , he used interval T2 fuzzy sets with the FOU,
described below:
Upper Limit:
xu :
xu =[µ(x)]0.5
Lower Limit:
xl :
xl =[µ(x)]2](https://image.slidesharecdn.com/n01368999-140501011356-phpapp01/85/Image-Processing-for-Automated-Flaw-Detection-and-CMYK-model-for-Color-Image-Segmentation-using-Type-2-Fuzzy-Sets-6-320.jpg)
![Image Processing for Automated Flaw Detection and CMYK model for Color Image Segmentation
www.iosrjournals.org 95 | Page
Fig. 5 Membership functions representing FOU
Here for the CMYK color model, the same functions are used for image segmentation. To overcome the
drawback of gray scale imaging, various correctional measures are considered in the proposed algorithm.
XI. ALGORITHM FOR COLOR IMAGE SEGMENTATION
Begin
Step1:Read the JPEG file to be segmented
Step2:Select the proper shape of the interval base T2 fuzzy set MF as
A =
Xx
Jxu μA (x, u ) / (x, u) Jx[0, 1]
Step3:Fix the image size of M N matrix;
Step4:Calculate h(g) for each color component of the color space;
//For linear index calculation
Step5:Calculate n – cut of the total image //for color pattern possibility matching with CMYK;
Step6:Initialize the position of the T2 MF;
Step7:Shift the MF with gray level ranges;
Step8: Mapping the picture colors into gray scale format;//For contour detection
Step 9: calculate the values of MF
gu
and
gl (where u(g) , l(g) µX(g));
Step10: Compute edge of the image based on
contour formation;
Step11: Compute similarity matrix say ‗W‘ based on inverting contours;
Step12: Find mid, max and min of fuzzy index;
Step13: Compute the n – cut eigenvectors;//possible
combination of colors for the input picture
Step14: Threshold the image with max value; //Unwanted pixel elimination based on Median filter
Step15: Masking of segmented image using msk matrix is defined by
[0 0 0 0 0
0 1 1 1 0
msk = 0 1 1 1 0
0 1 1 1 0
0 0 0 0 0]
Step16: Median filtering on the segmented image to remove noise;
Step17: Apply the region merging process using the obtained classes of pixels;
//Segmented portion of images are merged.
Step18: Smoothing of image to reduce the number of connected components;
Step19: Calculate the connected components;//n-Cut Eigen vector
Step20: Calculate the number of pixels in the final image;
End.
XII. EXPERIMENTAL RESULTS
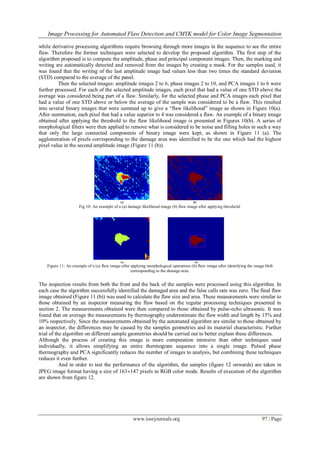
Fig 6: A photograph of an impacted sample.
Upper Limit
Membership
Lower Limit](https://image.slidesharecdn.com/n01368999-140501011356-phpapp01/85/Image-Processing-for-Automated-Flaw-Detection-and-CMYK-model-for-Color-Image-Segmentation-using-Type-2-Fuzzy-Sets-7-320.jpg)

![Image Processing for Automated Flaw Detection and CMYK model for Color Image Segmentation
www.iosrjournals.org 99 | Page
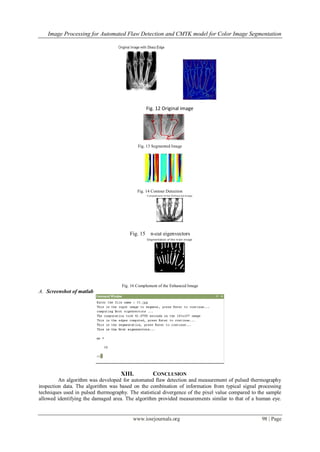
Moreover, the image obtained during the processing was easier to interpret by the inspector, provided the
damage area with stronger contrast compared to other processing techniques used individually.
Also Medical image registration has been an important area of research in the medical application of computer
vision‘s techniques for the past several years. It can be defined as a task of finding the transformation that will
optimally superimposes features from one imaging study over those of another study. The rules were applied to
predict the transient flow and pressure distributions in the brain vasculature comprising a patient specific circle
of Willis geometry and fractal models of peripheral vascular networks. The rules were shown to be able to
efficiently provide detailed descriptions of the flow and pressure distributions at different levels of blood vessel
sizes and simulate the variations of the blood flow in the major cerebral arteries when the peripheral
vasculatures are subjected to various physiological and pathological conditions. In order to improve the
prediction, the mechanisms of active regulation of blood flow need to be defined and implemented in the future
model development.
REFERENCES
[1] Maldague Xavier, ―Theory and Practice of Infrared Technology for Nondestructive Testing‖, John Wiley & Sons Inc, New York
NY, pp. 684, 2001.
[2] D. Gonzalez, Clemente Ibarra-Castanedo, F.J. Madruga and Xavier Maldague, ―Differentiated Absolute Phase Contrast Algorithm
for the Analysis of Pulsed Thermographic Sequences‖, Infrared Physics and Technology, Volume 48, Issue 1, pp. 16-21, 2006.
[3] Mirela Susa, Hernan Dario Benitez, Clemente Ibarra-Castanedo, Humberto Loaiza, Abdel Hakim Bendada and Xavier Maldague,
―Phase contrast using differential absolute contrast method‖, QIRT (Quantitative InfraRed Thermography) Journal, vol. 3, no 2, pp.
219- 230, 2006.
[4] Hernan Dario Benitez, Clemente Ibarra- Castanedo, Abdel Hakim Bendada, Xavier Maldague, Humberto Loaiza and Eduardo
Caicedo, ―Modified Differential Absolute Contrast Using Thermal Quadrupoles for the Nondestructive Testing of Finite Thickness
Specimens by Infrared Thermography‖, in CCECE 2006 - Canadian Conference on Electrical and Computer Engineering, (Ottawa
(Ontario) Canada), May 7-10 2006.
[5] Maldague X. and Marinetti S., ―Pulse Phase Infrared Thermography‖, J.Appl. Phys., Vol. 79, pp. 2694-2698, 1996.
[6] Ibarra-Castanedo C. ―Quantitative subsurface defect evaluation by pulsed phase thermography: depth retrieval with the phase,‖ Ph.
D. thesis, Laval University, 2005, http://www.theses.ulaval.ca/2005/23016/23016.pdf.
[7] Ibarra-Castanedo, C. and Maldague, X. ―Interactive methodology for optimized defect characterization by quantitative pulsed phase
thermography,‖ Research in Nondestructive Evaluation, Vol. 16, No. 4, pp1-19, 2005.
[8] Shepard S. M. ―Advances in Pulsed Thermography‖, Andres E. Rozlosnik, Ralph B. Dinwiddie (eds.), Proc. SPIE, Thermosense
XXIII, Vol. 4360, pp. 511-515, 2001.
[9] Carslaw, H. S. and Jaeger, J. C., ―Conduction of Heat in Solids‖, 2nd edition, Clarendon Press, Oxford.
[10] Martin R. E., Gyekenyesi A. L., Shepard S. M., ―Interpreting the Results, of Pulsed Thermography Data,‖ Materials Evaluation,
Vol. 61, No. 5, pp 611-616, 2003.
[11] Shepard, S. M, ―Temporal Noise Reduction, compression and Analysisn of Thermographic Image Data Sequence‖, US Patent
6,516,084, February, 2003.
[12] Shepard, S. M., Ahmed, T., Rubadeux, B. A., Wang , D., Lhota, J. R., ―Synthetic Processing of Pulsed Thermography Data for
Inspection of Turbine Components‖, Insight Vol.43 No.9, September, 2001.
[13] S. Marinetti, E. Grinzato, P.G. Bison, E. Bozzi, M. Chimenti, G. Pieri, O. Salvetti, ―Statistical analysis of IR thermographic
sequences by PCA‖, Infrared Physics and Technology 46 (2004) 85–91.
[14] Rajic N., ―Principal component thermography for flaw contrastenhancement and flaw depth characterisation in composite
structures‖, Composite Structures 58, pp521–528, 2002.
[15] J.N. Zalameda, P.A. Howell and W.P. Winfree, ―Compression Technique Computational Performance,‖ Proceedings of SPIE
Thermosense XXVII, Vol. 5782, pp. 399-406, 2005.
[16] K. E. Cramer and W. P. Winfree, ―The Application of Principal Component Analysis Using Fixed Eigenvectors to the Infrared
Thermographic Inspection of the Space Shuttle Thermal.
[17] Fred L. Bookstein, Principal warps: Thin-plate splines and the decomposition of deformations, IEEE Transactions on Pattern
Analysis and Machine Intelligence 11 (1989), no. 6, 567–585.
[18] F. Brezzi and M. Fortin, Mixed and hybrid finite element methods, Springer, 1991.
[19] Morten Bro-Nielsen, Medical image registration and surgery simulation, Ph.D. thesis, MM, Technical University of Denmark,
1996.
[20] Chaim Broit, Optimal registration of deformed images, Ph.D. thesis, Computer and Information Science, Uni Pensylvania, 1981.
[21] Gary E. Christensen and H. J. Johnson, Consistent image registration, IEEE Transaction on Medical Imaging 20 (2001), no. 7, 568–
582.
[22] Gary Edward Christensen, Deformable shape models for anatomy, Ph.D. thesis, Sever Institute of Technology, Washington
University, 1994.
[23] A. Collignon, A. Vandermeulen, P. Suetens, and G. Marchal, 3d multimodality medical image registration based on information
theory, Kluwer Academic Publishers: Computational Imaging and Vision 3 (1995), 263–274.
[24] R. Courant and David Hilbert, Methods of mathematical physiks, vol. II, Wiley, New York, 1962.
[25] Bernd Fischer and Jan Modersitzki, Fast inversion of matrices arising in image processing, Num. Algo. 22 (1999), 1–11.
[26] Fast diffusion registration, AMS Contemporary Mathematics, Inverse Problems, Image Analysis, and Medical Imaging, vol. 313,
2002, pp. 117–129.
[27] Combination of automatic non-rigid and landmark based registration: the best of both worlds, Medical Imaging 2003: Image
Processing (J.M. Fitzpatrick M. Sonka, ed.), Proceedings of the SPIE 5032, 2003, pp. 1037–1048.](https://image.slidesharecdn.com/n01368999-140501011356-phpapp01/85/Image-Processing-for-Automated-Flaw-Detection-and-CMYK-model-for-Color-Image-Segmentation-using-Type-2-Fuzzy-Sets-11-320.jpg)

This document discusses several image processing techniques for automated flaw detection in infrared thermography data, including thermal contrast computation, pulsed phase thermography, thermographic signal reconstruction, and principal component analysis. It also discusses using type-2 fuzzy logic to model uncertainties in image segmentation and classification by representing membership functions as three-dimensional rather than two-dimensional. The goal is to develop robust and automated techniques for flaw detection and sizing in carbon fiber composite materials using infrared thermography.