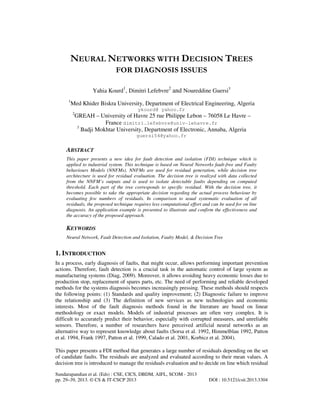
This paper presents a new idea for fault detection and isolation (FDI) technique which is
applied to industrial system. This technique is based on Neural Networks fault-free and Faulty
behaviours Models (NNFMs). NNFMs are used for residual generation, while decision tree
architecture is used for residual evaluation. The decision tree is realized with data collected
from the NNFM’s outputs and is used to isolate detectable faults depending on computed
threshold. Each part of the tree corresponds to specific residual. With the decision tree, it
becomes possible to take the appropriate decision regarding the actual process behaviour by
evaluating few numbers of residuals. In comparison to usual systematic evaluation of all
residuals, the proposed technique requires less computational effort and can be used for on line
diagnosis. An application example is presented to illustrate and confirm the effectiveness and
the accuracy of the proposed approach.
International Journal of Computational Engineering Research(IJCER) is an intentional online Journal in English monthly publishing journal. This Journal publish original research work that contributes significantly to further the scientific knowledge in engineering and Technology.
The classification of different types of tumors is of great importance in cancer diagnosis and its drug discovery. Cancer classification via gene expression data is known to contain the keys for solving the fundamental problems relating to the diagnosis of cancer. The recent advent of DNA microarray technology has made rapid monitoring of thousands of gene expressions possible. With this large quantity of gene expression data, scientists have started to explore the opportunities of classification of cancer using a gene expression dataset. To gain a profound understanding of the classification of cancer, it is necessary to take a closer look at the problem, the proposed solutions, and the related issues altogether. In this research thesis, I present a new way for Leukemia classification using the latest AI technique of Deep learning using Google TensorFlow on gene expression data.
A F AULT D IAGNOSIS M ETHOD BASED ON S EMI - S UPERVISED F UZZY C-M EANS...IJCI JOURNAL
Machine learning approaches are generally adopted i
n many fields including data mining, image
processing, intelligent fault diagnosis etc. As a c
lassic unsupervised learning technology, fuzzy C-me
ans
cluster analysis plays a vital role in machine lear
ning based intelligent fault diagnosis. With the ra
pid
development of science and technology, the monitori
ng signal data is numerous and keeps growing fast.
Only typical fault samples can be obtained and labe
led. Thus, how to apply semi-supervised learning
technology in fault diagnosis is significant for gu
aranteeing the equipment safety. According to this,
a novel
fault diagnosis method based on semi-supervised fuz
zy C-means(SFCM) cluster analysis is proposed.
Experimental results on Iris data set and the steel
plates faults data set show that this method is su
perior to
traditional fuzzy C-means clustering analysis
A Robust Method for Moving Object Detection Using Modified Statistical Mean M...ijait
Moving object detection is low-level, important task for any visual surveillance system. One of the aim of this paper is to, to describe various approaches of moving object detection such as background subtraction, temporal difference, as well as pros and cons of these techniques. A statistical mean technique [10] has been used to overcome the problem in previous techniques. Even statistical mean method also suffers with the problem of superfluous effects of foreground objects. In this paper, the presented method tries to overcome this effect as well as reduces the computational complexity up to some extent. In this paper, a robust algorithm for automatic, noise detection and removal from moving objects in video sequences is presented. The algorithm considers static camera parameters.
View classification of medical x ray images using pnn classifier, decision tr...eSAT Journals
Abstract: In this era of electronic advancements in the field of medical image processing, the quantum of medical X-ray images so produced exorbitantly can be effectively addressed by means of automated indexing, comparing, analysing and annotating that will really be pivotal to the radiologists in interpreting and diagnosing the diseases. In order to envisage such an objective, it has been humbly endeavoured in this paper by proposing an efficient methodology that takes care of the view classification of the X-ray images for the automated annotation from their vast database, with which the decision making for the physicians and radiologists becomes simpler despite an immeasurable and ever-growing trends of the X-ray images. In this paper, X-ray images of six different classes namely chest, head, foot, palm, spine and neck have been collected. The framework proposed in this paper involves the following: The images are pre-processed using M3 filter and segmentation by Expectation Maximization (EM) algorithm, followed by feature extraction through Discrete Wavelet Transform. The orientation of X-ray images has been performed in this work by comparing among the Probabilistic Neural Network (PNN), Decision Tree algorithm and Support Vector Machine (SVM), while the PNN yields an accuracy of 75%, the Decision Tree with 92.77% and the SVM of 93.33%. Key Words: M3 filter, Expectation Maximaization, Discrete Wavelet Transformation, Probabilistic Neural Network, Decision Tree Algorithm and Support Vector Machine.
POSTERIOR RESOLUTION AND STRUCTURAL MODIFICATION FOR PARAMETER DETERMINATION ...IJCI JOURNAL
When only a few lower modes data are available to evaluate a large number of unknown parameters, it is
difficult to acquire information about all unknown parameters. The challenge in this kind of updation
problem is first to get confidence about the parameters that are evaluated correctly using the available
data and second to get information about the remaining parameters. In this work, the first issue is resolved
employing the sensitivity of the modal data used for updation. Once it is fixed that which parameters are
evaluated satisfactorily using the available modal data the remaining parameters are evaluated employing
modal data of a virtual structure. This virtual structure is created by adding or removing some known
stiffness to or from some of the stories of the original structure. A 12-story shear building is considered for
the numerical illustration of the approach. Results of the study show that the present approach is an
effective tool in system identification problem when only a few data is available for updation.
IRJET-Analysis of Face Recognition System for Different ClassifierIRJET Journal
M.Manimozhi, A. John Dhanaseely "Analysis of Face Recognition System for Different Classifier ", International Research Journal of Engineering and Technology (IRJET), Volume2,issue-01 April 2015.e-ISSN:2395-0056, p-ISSN:2395-0072. www.irjet.net .published by Fast Track Publications
Abstract
Face recognition plays vital role for authenticating system. Human Face recognition is a challenging task in computer vision and pattern recognition. Face recognition has attracted much attention due to its potential value in security and law enforcement applications and its theoretical challenges. Different methods are used for feature extraction and classification. Kernel fisher analysis is used for feature extraction. The performance analysis for Euclidean, support vector machine is evaluated. The whole process is done using MATLAB software. A set of 10 person real time images is taken for our work. The classifier recognizes the similar posture as an output.
Medical Image Analysis Through A Texture Based Computer Aided Diagnosis Frame...CSCJournals
Current medical imaging scanners allow to obtain high resolution digital images with a complex informative content expressed by the textural aspect of the membranes covering organs and tissues (hereinafter objects). These textural information can be exploited to develop a descriptive mathematical model of the objects to support heterogeneous activities within medical field. This paper presents a framework based on the texture analysis to model the objects contained in the layout of diagnostic images. By each specific model, the framework automatically also defines a connected application supporting, on the related objects, different fixed targets, such as: segmentation, mass detection, reconstruction, and so on. The framework is tested on MRI images and results are reported.
Detection and classification of brain tumor are very important because it provides anatomical information of normal and abnormal tissues which helps in early treatment planning and patient's case follow-up. There is a number of techniques for medical image classification. We used PNN (Probabilistic Neural Network Algorithm) for image classification technique based on Genetic Algorithm (GA) and K-Nearest Neighbor (K-NN) classifier for feature selection is proposed in this paper. The searching capabilities of genetic algorithms are explored for appropriate selection of features from input data and to obtain an optimal classification. The method is implemented to classify and label brain MRI images into seven tumor types. A number of texture features (Gray Level Co-occurrence Matrix (GLCM)) can be extracted from an image, so choosing the best features to avoid poor generalization and over specialization is of paramount importance then the classification of the image and compare results based on the PNN algorithm.
Automatic Skin Lesion Segmentation and Melanoma Detection: Transfer Learning ...Zabir Al Nazi Nabil
Industrial pollution resulting in ozone layer depletion has influenced
increased UV radiation in recent years which is a major environmental risk factor for invasive skin cancer Melanoma and other keratinocyte cancers. The incidence of deaths from Melanoma has risen worldwide in past two decades.
Deep learning has been employed successfully for dermatologic diagnosis. In
this work, we present a deep learning based scheme to automatically segment
skin lesions and detect melanoma from dermoscopy images. U-Net was used
for segmenting out the lesion from surrounding skin. The limitation of utilizing
deep neural networks with limited medical data was solved with data augmentation and transfer learning. In our experiments, U-Net was used with spatial
dropout to solve the problem of overfitting and different augmentation effects
were applied on the training images to increase data samples. The model was
evaluated on two different datasets. It achieved a mean dice score of 0.87 and a
mean jaccard index of 0.80 on ISIC 2018 dataset. The trained model was assessed on PH² dataset where it achieved a mean dice score of 0.93 and a mean
jaccard index of 0.87 with transfer learning. For classification of malignant
melanoma, a DCNN-SVM model was used where we compared state of the art
deep nets as feature extractors to find the applicability of transfer learning in
dermatologic diagnosis domain. Our best model achieved a mean accuracy of
92% on PH² dataset. The findings of this study is expected to be useful in cancer diagnosis research.
Published at IJCCI 2018. Source code available at https://github.com/zabir-nabil/lesion-segmentation-melanoma-tl
International Refereed Journal of Engineering and Science (IRJES) is a peer reviewed online journal for professionals and researchers in the field of computer science. The main aim is to resolve emerging and outstanding problems revealed by recent social and technological change. IJRES provides the platform for the researchers to present and evaluate their work from both theoretical and technical aspects and to share their views.
CLASSIFICATION OF OCT IMAGES FOR DETECTING DIABETIC RETINOPATHY DISEASE USING...sipij
Optical Coherence Tomography (OCT) imaging aids in retinal abnormality detection by showing the
tomographic retinal layers. OCT images are a useful tool for detecting Diabetic Retinopathy (DR) disease
because of their capability to capture micrometer-resolution. An automated technique was introduced to
differentiate DR images from normal ones. 214 images were subjected to the experiment, of which 160
images were used for classifiers’ training, and 54 images were used for testing. Different features were
extracted to feed our classifiers, including statistical features and local binary pattern (LBP) features. The
experimental results demonstrated that our classifiers were able to discriminate DR retina from the normal
retina with Area Under the Receiver Operating Characteristic (ROC) Curve (AUC) of 100%. The retinal
OCT images have common texture patterns and using a powerful tool for pattern analysis like LBP
features has a significant impact on the achieved results. The result has better performance than previously
proposed methods in the literature.
A COMPARATIVE STUDY OF MACHINE LEARNING ALGORITHMS FOR EEG SIGNAL CLASSIFICATIONsipij
In this paper, different machine learning algorithms such as Linear Discriminant Analysis, Support vector
machine (SVM), Multi-layer perceptron, Random forest, K-nearest neighbour, and Autoencoder with SVM
have been compared. This comparison was conducted to seek a robust method that would produce good
classification accuracy. To this end, a robust method of classifying raw Electroencephalography (EEG)
signals associated with imagined movement of the right hand and relaxation state, namely Autoencoder
with SVM has been proposed. The EEG dataset used in this research was created by the University of
Tubingen, Germany. The best classification accuracy achieved was 70.4% with SVM through feature
engineering. However, our prosed method of autoencoder in combination with SVM produced a similar
accuracy of 65% without using any feature engineering technique. This research shows that this system of
classification of motor movements can be used in a Brain-Computer Interface system (BCI) to mentally
control a robotic device or an exoskeleton.
SENSOR FAULT IDENTIFICATION IN COMPLEX SYSTEMS | J4RV3I12007Journal For Research
In the process control industries, one of the main works is to identify and channelize the fault sensor. The process of sensor troubleshooting is essential to increase the production flow without any interruption. In this project the level measurement in the conical tank is considered and the capacitive sensor is used to measure the level of the water inside the conical tank. First the standard sensor is placed inside and the level is measured and monitored and the history of data’s are obtained. Using LABVIEW, programming is done for the standard sensor to measure the level. Now the measuring sensor is placed and the measurement of the level is done. Using any of the soft computing techniques, the fault can be identified and it is indicated in the display or alarm.
Nowadays crowd analysis, essential factor about decision management of brand strategy, is not a
controllable field by individuals. Therefore a technology, software products is needed. In this paper we
focused on what we have done about crowd analysis and examination the problem of human detection with
fish-eye lenses cameras. In order to identify human density, one of the machine learning algorithm, which
is Haar Classification algorithm, is used to distinguish human body under different conditions. First,
motion analysis is used to search for meaningful data, and then the desired object is detected by the trained
classifier. Significant data has been sent to the end user via socket programming and human density
analysis is presented.
This presentation was prepared as part of the curriculum studies for CSCI-659 Topics in Artificial Intelligence Course - Machine Learning in Computational Linguistics.
It was prepared under guidance of Prof. Sandra Kubler.
Distillation Column Process Fault Detection in the Chemical IndustriesISA Interchange
Chemical plants are complex large-scale systems which need designing robust fault detection schemes to ensure high product quality, reliability and safety under different operating conditions. The present paper is concerned with a feasibility study of the application of the black-box modeling method and Kullback Leibler divergence (KLD) to the fault detection in a distillation column process. A Nonlinear Auto-Regressive Moving Average with eXogenous input (NARMAX) polynomial model is firstly developed to estimate the nonlinear behavior of the plant. Furthermore, the KLD is applied to detect abnormal modes. The proposed FD method is implemented and validated experimentally using realistic faults of a distillation plant of laboratory scale. The experimental results clearly demonstrate the fact that proposed method is effective and gives early alarm to operators.
Fault Detection in the Distillation Column ProcessISA Interchange
Chemical plants are complex large-scale systems which need designing robust fault detection schemes to ensure high product quality, reliability and safety under different operating conditions. The present paper is concerned with a feasibility study of the application of the black-box modeling method and Kullback Leibler divergence (KLD) to the fault detection in a distillation column process. A Nonlinear Auto-Regressive Moving Average with eXogenous input (NARMAX) polynomial model is firstly developed to estimate the nonlinear behavior of the plant. Furthermore, the KLD is applied to detect abnormal modes. The proposed FD method is implemented and validated experimentally using realistic faults of a distillation plant of laboratory scale. The experimental results clearly demonstrate the fact that proposed method is effective and gives early alarm to operators.
Fault Detection in Mobile Communication Networks Using Data Mining Techniques...ijcisjournal
A collection of datasets is Big data so that it to be To process huge and complex datasets becomes difficult.
so that using big data analytics the process of applying huge amount of datasets consists of many data
types is the big data on-hand theoretical models and technique tools. The technology of mobile
communication introduced low power ,low price and multi functional devices. A ground for data mining
research is analysis of data pertaining to mobile communication is used. theses mining frequent patterns
and clusters on data streams collaborative filtering and analysis of social network. The data analysis of
mobile communication has been often used as a background application to motivate many technical
problem in data mining research. This paper refers in mobile communication networking to find the fault
nodes between source to destination transmission using data mining techniques and detect the faults using
outliers. outlier detection can be used to find outliers in multivariate data in a simple ensemble way.
Network analysis with R to build a network.
PERFORMANCE ASSESSMENT OF ANFIS APPLIED TO FAULT DIAGNOSIS OF POWER TRANSFORMER ecij
Continuous monitoring of Power transformer is very much essential during its operation. Incipient faults inside the tank and winding insulation needs careful attention. Traditional ratio methods and Duval triangle can be employed to diagnose the incipient faults. Many times correct diagnosis due to the
borderline problems and the existence of multiple faults may not be possible. Artificial intelligence (AI) techniques could be the best solution to handle the non linearity and complexity in the input data. In the proposed work, adaptive neuro fuzzy inference system (ANFIS), is utilized to deal with 9 incipient fault conditions including healthy condition of power transformer with sufficient DGA transformer oil samples. Comparison of the diagnosis performance of both the methods of ANFIS and the feasibility pertaining to the problem is presented. Diagnosis error in classifying the oil samples and the network structure are the main considerations of the present study.
International Journal of Engineering Research and Applications (IJERA) is a team of researchers not publication services or private publications running the journals for monetary benefits, we are association of scientists and academia who focus only on supporting authors who want to publish their work. The articles published in our journal can be accessed online, all the articles will be archived for real time access.
Our journal system primarily aims to bring out the research talent and the works done by sciaentists, academia, engineers, practitioners, scholars, post graduate students of engineering and science. This journal aims to cover the scientific research in a broader sense and not publishing a niche area of research facilitating researchers from various verticals to publish their papers. It is also aimed to provide a platform for the researchers to publish in a shorter of time, enabling them to continue further All articles published are freely available to scientific researchers in the Government agencies,educators and the general public. We are taking serious efforts to promote our journal across the globe in various ways, we are sure that our journal will act as a scientific platform for all researchers to publish their works online.
Empowering anomaly detection algorithm: a reviewIAESIJAI
Detecting anomalies in a data stream relevant to domains like intrusion detection, fraud detection, security in sensor networks, or event detection in internet of things (IoT) environments is a growing field of research. For instance, the use of surveillance cameras installed everywhere that is usually governed by human experts. However, when many cameras are involved, more human expertise is needed, thus making it expensive. Hence, researchers worldwide are trying to invent the best-automated algorithm to detect abnormal behavior using real-time data. The designed algorithm for this purpose may contain gaps that could differentiate the qualities in specific domains. Therefore, this study presents a review of anomaly detection algorithms, introducing the gap that presents the advantages and disadvantages of these algorithms. Since many works of literature were reviewed in this review, it is expected to aid researchers in closing this gap in the future.
Pattern recognition using context dependent memory model (cdmm) in multimodal...ijfcstjournal
Pattern recognition is one of the prime concepts in current technologies in both private and public sectors.
The analysis and recognition of two or more patterns is a complex task due to several factors. The
consideration of two or more patterns requires huge space for keeping the storage media as well as
computational aspect. Vector logic gives very good strategy for recognition of patterns. This paper
proposes pattern recognition in multimodal authentication system with the use of vector logic and makes
the computation model hard and less error rate. Using PCA two to three biometric patterns will be fusion
and then various key sizes will be extracted using LU factorization approach. The selected keys will be
combined using vector logic, which introduces a memory model often called Context Dependent Memory
Model (CDMM) as computational model in multimodal authentication system that gives very accurate and
very effective outcome for authentication as well as verification. In the verification step, Mean Square
Error (MSE) and Normalized Correlation (NC) as metrics to minimize the error rate for the proposed
model and the performance analysis will be presented.
Enhancing Time Series Anomaly Detection: A Hybrid Model Fusion ApproachIJCI JOURNAL
Exploring and Identifying Anomalies in time-series data is very crucial in today’s world revolve around data. These data are being used to make important decisions; hence, an efficient and reliable anomaly detection system should be involved in this process to ensure that the best decisions are being made. The paper explores other types of anomalies and proposes efficient detection methods which can be used. Anomalies are patterns that deviate from usual expected behavior. These can come from system failures or unexpected activity. This research paper explores the vulnerabilities of commonly used anomaly detection algorithms such as the Z-Score and static threshold approach. Each method used in this paper has its unique capabilities and limitations. These methods range from using statistical methods and machine learning approaches to detecting anomalies in a time-series dataset. Furthermore, this paper explores other open-source libraries that can be used to detect anomalies, such as Greykite and Prophet Python library. This paper serves as a good source for anyone new to anomaly detection and willing to explore.
Wireless Fault Detection System for an Industrial Robot Based on Statistical ...IJECEIAES
Industrial robots are now commonly used in production systems to improve productivity, quality and safety in manufacturing processes. Recent developments involve using robots cooperatively with production line operatives. Regardless of application, there are significant implications for operator safety in the event of a robot malfunction or failure, and the consequent downtime has a significant impact on productivity in manufacturing. Machine healthy monitoring is a type of maintenance inspection technique by which an operational asset is monitored and the data obtained is analysed to detect signs of degradation and thus reducing the maintenance costs. Developments in electronics and computing have opened new horizons in the area of condition monitoring. The aim of using wireless electronic systems is to allow data analysis to be carried out locally at field level and transmitting the results wirelessly to the base station, which as a result will help to overcome the need for wiring and provides an easy and cost-effective sensing technique to detect faults in machines. So, the main focuses of this research is to develop an online and wireless fault detection system for an industrial robot based on statistical control chart approach. An experimental investigation was accomplished using the PUMA 560 robot and vibration signal capturing was adopted, as it responds immediately to manifest itself if any change is appeared in the monitored machine, to extract features related to the robot health conditions. The results indicate the successful detection of faults at the early stages using the key extracted parameters.
COMPARISON OF WAVELET NETWORK AND LOGISTIC REGRESSION IN PREDICTING ENTERPRIS...ijcsit
Enterprise financial distress or failure includes bankruptcy prediction, financial distress, corporate performance prediction and credit risk estimation. The aim of this paper is that using wavelet networks innon-linear combination prediction to solve ARMA (Auto-Regressive and Moving Average) model problem.ARMA model need estimate the value of all parameters in the model, it has a large amount of computation.Under this aim, the paper provides an extensive review of Wavelet networks and Logistic regression. Itdiscussed the Wavelet neural network structure, Wavelet network model training algorithm, Accuracy rateand error rate (accuracy of classification, Type I error, and Type II error). The main research opportunity exist a proposed of business failure prediction model (wavelet network model and logistic regression
model). The empirical research which is comparison of Wavelet Network and Logistic Regression on training and forecasting sample, the result shows that this wavelet network model is high accurate and the overall prediction accuracy, Type Ⅰerror and Type Ⅱ error, wavelet networks model is better thanlogistic regression model.
EFFICIENT USE OF HYBRID ADAPTIVE NEURO-FUZZY INFERENCE SYSTEM COMBINED WITH N...csandit
This research study proposes a novel method for automatic fault prediction from foundry data
introducing the so-called Meta Prediction Function (MPF). Kernel Principal Component
Analysis (KPCA) is used for dimension reduction. Different algorithms are used for building the
MPF such as Multiple Linear Regression (MLR), Adaptive Neuro Fuzzy Inference System
(ANFIS), Support Vector Machine (SVM) and Neural Network (NN). We used classical
machine learning methods such as ANFIS, SVM and NN for comparison with our proposed
MPF. Our empirical results show that the MPF consistently outperform the classical methods.
MRI IMAGES THRESHOLDING FOR ALZHEIMER DETECTIONcsitconf
More than 55 illnesses are associated withMore than 55 illnesses are associated with the development of dementia and Alzheimer's disease
(AD) is the most prevalent form. Vascular dementia (VD) is the second most common form of
dementia. Current diagnosis of Alzheimer disease (Alzheimer's disease) is made by clinical,
neuropsychological, and neuroimaging assessments. Magnetic resonance imaging (MRI) can be
considered the preferred neuroimaging examination for Alzheimer disease because it allows for
accurate measurement of brain structures, especially the size of the hippocampus and related
regions. Image processing techniques has been used for processing the (MRI) image. Image
thresholding is an important concept, both in the area of objects segmentation and recognition.
It has been widely used due to the simplicity of implementation and speed of time execution.
Many thresholding techniques have been proposed in the literature. The aim of this paper is to
provide formula and their implementation to threshold images using Between-Class Variance
with a Mixture of Gamma Distributions. The algorithms will be described by given their steps,
and applications. Experimental results are presented to show good results on segmentation of
(MRI) image. the development of dementia and Alzheimer's disease
(AD) is the most prevalent form. Vascular dementia (VD) is the second most common form of
dementia. Current diagnosis of Alzheimer disease (Alzheimer's disease) is made by clinical,
neuropsychological, and neuroimaging assessments. Magnetic resonance imaging (MRI) can be
considered the preferred neuroimaging examination for Alzheimer disease because it allows for
accurate measurement of brain structures, especially the size of the hippocampus and related
regions. Image processing techniques has been used for processing the (MRI) image. Image
thresholding is an important concept, both in the area of objects segmentation and recognition.
It has been widely used due to the simplicity of implementation and speed of time execution.
Many thresholding techniques have been proposed in the literature. The aim of this paper is to
provide formula and their implementation to threshold images using Between-Class Variance
with a Mixture of Gamma Distributions. The algorithms will be described by given their steps,
and applications. Experimental results are presented to show good results on segmentation of
(MRI) image.
EDGE DETECTION IN RADAR IMAGES USING WEIBULL DISTRIBUTIONcsitconf
Radar images can reveal information about the shape of the surface terrain as well as its
physical and biophysical properties. Radar images have long been used in geological studies to
map structural features that are revealed by the shape of the landscape. Radar imagery also has
applications in vegetation and crop type mapping, landscape ecology, hydrology, and
volcanology. Image processing is using for detecting for objects in radar images. Edge
detection; which is a method of determining the discontinuities in gray level images; is a very
important initial step in Image processing. Many classical edge detectors have been developed
over time. Some of the well-known edge detection operators based on the first derivative of the
image are Roberts, Prewitt, Sobel which is traditionally implemented by convolving the image
with masks. Also Gaussian distribution has been used to build masks for the first and second
derivative. However, this distribution has limit to only symmetric shape. This paper will use to
construct the masks, the Weibull distribution which was more general than Gaussian because it
has symmetric and asymmetric shape. The constructed masks are applied to images and we
obtained good results.
AUTOMATIC THRESHOLDING TECHNIQUES FOR SAR IMAGEScsitconf
Segmentation of Synthetic Aperture Radar (SAR) images have a great use in observing the
global environment, and in analysing the target detection and recognition .But , segmentation
of (SAR) images is known as a very complex task, due to the existence of speckle noise.
Therefore, in this paper we present a fast SAR images segmentation based on between class
variance. Our choice for used (BCV) method, because it is one of the most effective thresholding
techniques for most real world images with regard to uniformity and shape measures. Our
experiments will be as a test to determine which technique is effective in thresholding
(extraction) the oil spill for numerous SAR images, and in the future these thresholding
techniques can be very useful in detection objects in other SAR images
IRIS BIOMETRIC RECOGNITION SYSTEM EMPLOYING CANNY OPERATORcsitconf
Biometrics has become important in security applications. In comparison with many other
biometric features, iris recognition has very high recognition accuracy because it depends on
iris which is located in a place that still stable throughout human life and the probability to find
two identical iris's is close to zero. The identification system consists of several stages including
segmentation stage which is the most serious and critical one. The current segmentation
methods still have limitation in localizing the iris due to circular shape consideration of the
pupil. In this research, Daugman method is done to investigate the segmentation techniques.
Eyelid detection is another step that has been included in this study as a part of segmentation
stage to localize the iris accurately and remove unwanted area that might be included. The
obtained iris region is encoded using haar wavelets to construct the iris code, which contains
the most discriminating feature in the iris pattern. Hamming distance is used for comparison of
iris templates in the recognition stage. The dataset which is used for the study is UBIRIS
database. A comparative study of different edge detector operator is performed. It is observed
that canny operator is best suited to extract most of the edges to generate the iris code for
comparison. Recognition rate of 89% and rejection rate of 95% is achieved.
PLANNING BY CASE-BASED REASONING BASED ON FUZZY LOGICcsitconf
The treatment of complex systems often requires the manipulation of vague, imprecise and
uncertain information. Indeed, the human being is competent in handling of such systems in a
natural way. Instead of thinking in mathematical terms, humans describes the behavior of the
system by language proposals. In order to represent this type of information, Zadeh proposed to
model the mechanism of human thought by approximate reasoning based on linguistic
variables. He introduced the theory of fuzzy sets in 1965, which provides an interface between
language and digital worlds. In this paper, we propose a Boolean modeling of the fuzzy
reasoning that we baptized Fuzzy-BML and uses the characteristics of induction graph
classification. Fuzzy-BML is the process by which the retrieval phase of a CBR is modelled not
in the conventional form of mathematical equations, but in the form of a database with
membership functions of fuzzy rules.
SUPERVISED FEATURE SELECTION FOR DIAGNOSIS OF CORONARY ARTERY DISEASE BASED O...csitconf
Feature Selection (FS) has become the focus of much research on decision support systems
areas for which datasets with tremendous number of variables are analyzed. In this paper we
present a new method for the diagnosis of Coronary Artery Diseases (CAD) founded on Genetic
Algorithm (GA) wrapped Bayes Naïve (BN) based FS.
Basically, CAD dataset contains two classes defined with 13 features. In GA–BN algorithm, GA
generates in each iteration a subset of attributes that will be evaluated using the BN in the
second step of the selection procedure. The final set of attribute contains the most relevant
feature model that increases the accuracy. The algorithm in this case produces 85.50%
classification accuracy in the diagnosis of CAD. Thus, the asset of the Algorithm is then
compared with the use of Support Vector Machine (SVM), Multi-Layer Perceptron (MLP) and
C4.5 decision tree Algorithm. The result of classification accuracy for those algorithms are
respectively 83.5%, 83.16% and 80.85%. Consequently, the GA wrapped BN Algorithm is
correspondingly compared with other FS algorithms. The Obtained results have shown very
promising outcomes for the diagnosis of CAD.
COMPUTATIONAL PERFORMANCE OF QUANTUM PHASE ESTIMATION ALGORITHMcsitconf
A quantum computation problem is discussed in this paper. Many new features that make
quantum computation superior to classical computation can be attributed to quantum coherence
effect, which depends on the phase of quantum coherent state. Quantum Fourier transform
algorithm, the most commonly used algorithm, is introduced. And one of its most important
applications, phase estimation of quantum state based on quantum Fourier transform, is
presented in details. The flow of phase estimation algorithm and the quantum circuit model are
shown. And the error of the output phase value, as well as the probability of measurement, is
analysed. The probability distribution of the measuring result of phase value is presented and
the computational efficiency is discussed.
FEEDBACK SHIFT REGISTERS AS CELLULAR AUTOMATA BOUNDARY CONDITIONScsitconf
We present a new design for random number generation. The outputs of linear feedback shift
registers (LFSRs) act as continuous inputs to the two boundaries of a one-dimensional (1-D)
Elementary Cellular Automata (ECA). The results show superior randomness features and the
output string has passed the Diehard statistical battery of tests. The design is good candidate
for parallel random number generation, has strong correlation immunity and it is inherently
amenable for VLSI implementation.
Hamming Distance and Data Compression of 1-D CAcsitconf
In this paper an application of von Neumann correction technique to the output string of some
chaotic rules of 1-D Cellular Automata that are unsuitable for cryptographic pseudo random
number generation due to their non uniform distribution of the binary elements is presented.
The one dimensional (1-D) Cellular Automata (CA) Rule space will be classified by the time run
of Hamming Distance (HD). This has the advantage of determining the rules that have short
cycle lengths and therefore deemed to be unsuitable for cryptographic pseudo random number
generation. The data collected from evolution of chaotic rules that have long cycles are
subjected to the original von Neumann density correction scheme as well as a new generalized
scheme presented in this paper and tested for statistical testing fitness using Diehard battery of
tests. Results show that significant improvement in the statistical tests are obtained when the
output of a balanced chaotic rule are mutually exclusive ORed with the output of unbalanced
chaotic rule that have undergone von Neumann density correction.
Neuro-symbolic is not enough, we need neuro-*semantic*Frank van Harmelen
Neuro-symbolic (NeSy) AI is on the rise. However, simply machine learning on just any symbolic structure is not sufficient to really harvest the gains of NeSy. These will only be gained when the symbolic structures have an actual semantics. I give an operational definition of semantics as “predictable inference”.
All of this illustrated with link prediction over knowledge graphs, but the argument is general.
DevOps and Testing slides at DASA ConnectKari Kakkonen
My and Rik Marselis slides at 30.5.2024 DASA Connect conference. We discuss about what is testing, then what is agile testing and finally what is Testing in DevOps. Finally we had lovely workshop with the participants trying to find out different ways to think about quality and testing in different parts of the DevOps infinity loop.
Accelerate your Kubernetes clusters with Varnish CachingThijs Feryn
A presentation about the usage and availability of Varnish on Kubernetes. This talk explores the capabilities of Varnish caching and shows how to use the Varnish Helm chart to deploy it to Kubernetes.
This presentation was delivered at K8SUG Singapore. See https://feryn.eu/presentations/accelerate-your-kubernetes-clusters-with-varnish-caching-k8sug-singapore-28-2024 for more details.
Connector Corner: Automate dynamic content and events by pushing a buttonDianaGray10
Here is something new! In our next Connector Corner webinar, we will demonstrate how you can use a single workflow to:
Create a campaign using Mailchimp with merge tags/fields
Send an interactive Slack channel message (using buttons)
Have the message received by managers and peers along with a test email for review
But there’s more:
In a second workflow supporting the same use case, you’ll see:
Your campaign sent to target colleagues for approval
If the “Approve” button is clicked, a Jira/Zendesk ticket is created for the marketing design team
But—if the “Reject” button is pushed, colleagues will be alerted via Slack message
Join us to learn more about this new, human-in-the-loop capability, brought to you by Integration Service connectors.
And...
Speakers:
Akshay Agnihotri, Product Manager
Charlie Greenberg, Host
LF Energy Webinar: Electrical Grid Modelling and Simulation Through PowSyBl -...DanBrown980551
Do you want to learn how to model and simulate an electrical network from scratch in under an hour?
Then welcome to this PowSyBl workshop, hosted by Rte, the French Transmission System Operator (TSO)!
During the webinar, you will discover the PowSyBl ecosystem as well as handle and study an electrical network through an interactive Python notebook.
PowSyBl is an open source project hosted by LF Energy, which offers a comprehensive set of features for electrical grid modelling and simulation. Among other advanced features, PowSyBl provides:
- A fully editable and extendable library for grid component modelling;
- Visualization tools to display your network;
- Grid simulation tools, such as power flows, security analyses (with or without remedial actions) and sensitivity analyses;
The framework is mostly written in Java, with a Python binding so that Python developers can access PowSyBl functionalities as well.
What you will learn during the webinar:
- For beginners: discover PowSyBl's functionalities through a quick general presentation and the notebook, without needing any expert coding skills;
- For advanced developers: master the skills to efficiently apply PowSyBl functionalities to your real-world scenarios.
Dev Dives: Train smarter, not harder – active learning and UiPath LLMs for do...UiPathCommunity
💥 Speed, accuracy, and scaling – discover the superpowers of GenAI in action with UiPath Document Understanding and Communications Mining™:
See how to accelerate model training and optimize model performance with active learning
Learn about the latest enhancements to out-of-the-box document processing – with little to no training required
Get an exclusive demo of the new family of UiPath LLMs – GenAI models specialized for processing different types of documents and messages
This is a hands-on session specifically designed for automation developers and AI enthusiasts seeking to enhance their knowledge in leveraging the latest intelligent document processing capabilities offered by UiPath.
Speakers:
👨🏫 Andras Palfi, Senior Product Manager, UiPath
👩🏫 Lenka Dulovicova, Product Program Manager, UiPath
The Art of the Pitch: WordPress Relationships and SalesLaura Byrne
Clients don’t know what they don’t know. What web solutions are right for them? How does WordPress come into the picture? How do you make sure you understand scope and timeline? What do you do if sometime changes?
All these questions and more will be explored as we talk about matching clients’ needs with what your agency offers without pulling teeth or pulling your hair out. Practical tips, and strategies for successful relationship building that leads to closing the deal.
Software Delivery At the Speed of AI: Inflectra Invests In AI-Powered QualityInflectra
In this insightful webinar, Inflectra explores how artificial intelligence (AI) is transforming software development and testing. Discover how AI-powered tools are revolutionizing every stage of the software development lifecycle (SDLC), from design and prototyping to testing, deployment, and monitoring.
Learn about:
• The Future of Testing: How AI is shifting testing towards verification, analysis, and higher-level skills, while reducing repetitive tasks.
• Test Automation: How AI-powered test case generation, optimization, and self-healing tests are making testing more efficient and effective.
• Visual Testing: Explore the emerging capabilities of AI in visual testing and how it's set to revolutionize UI verification.
• Inflectra's AI Solutions: See demonstrations of Inflectra's cutting-edge AI tools like the ChatGPT plugin and Azure Open AI platform, designed to streamline your testing process.
Whether you're a developer, tester, or QA professional, this webinar will give you valuable insights into how AI is shaping the future of software delivery.
Generating a custom Ruby SDK for your web service or Rails API using Smithyg2nightmarescribd
Have you ever wanted a Ruby client API to communicate with your web service? Smithy is a protocol-agnostic language for defining services and SDKs. Smithy Ruby is an implementation of Smithy that generates a Ruby SDK using a Smithy model. In this talk, we will explore Smithy and Smithy Ruby to learn how to generate custom feature-rich SDKs that can communicate with any web service, such as a Rails JSON API.
Builder.ai Founder Sachin Dev Duggal's Strategic Approach to Create an Innova...Ramesh Iyer
In today's fast-changing business world, Companies that adapt and embrace new ideas often need help to keep up with the competition. However, fostering a culture of innovation takes much work. It takes vision, leadership and willingness to take risks in the right proportion. Sachin Dev Duggal, co-founder of Builder.ai, has perfected the art of this balance, creating a company culture where creativity and growth are nurtured at each stage.
Securing your Kubernetes cluster_ a step-by-step guide to success !KatiaHIMEUR1
Today, after several years of existence, an extremely active community and an ultra-dynamic ecosystem, Kubernetes has established itself as the de facto standard in container orchestration. Thanks to a wide range of managed services, it has never been so easy to set up a ready-to-use Kubernetes cluster.
However, this ease of use means that the subject of security in Kubernetes is often left for later, or even neglected. This exposes companies to significant risks.
In this talk, I'll show you step-by-step how to secure your Kubernetes cluster for greater peace of mind and reliability.
Epistemic Interaction - tuning interfaces to provide information for AI supportAlan Dix
Paper presented at SYNERGY workshop at AVI 2024, Genoa, Italy. 3rd June 2024
https://alandix.com/academic/papers/synergy2024-epistemic/
As machine learning integrates deeper into human-computer interactions, the concept of epistemic interaction emerges, aiming to refine these interactions to enhance system adaptability. This approach encourages minor, intentional adjustments in user behaviour to enrich the data available for system learning. This paper introduces epistemic interaction within the context of human-system communication, illustrating how deliberate interaction design can improve system understanding and adaptation. Through concrete examples, we demonstrate the potential of epistemic interaction to significantly advance human-computer interaction by leveraging intuitive human communication strategies to inform system design and functionality, offering a novel pathway for enriching user-system engagements.
2. 30 Computer Science & Information Technology (CS & IT)
must be evaluated or not. This technique is validated with the DAMADICS benchmark process, a
European project under which several FDI methods have been developed and compared. This
benchmark is based on industry requirements described in (Bartys et al. 2006). It is used with
different approaches in the purpose of providing a training facility for both industry and
academia. It gains a better understanding for the way in which the various FDI methods can
perform in a realistic control engineering application setting. In the literature, different analytical
FDI approaches have been developed. In (Puig et al. 2006), passive robustness fault detection
method using intervals observers is presented. In (Previdi et al. 2006), authors introduce signal
model based fault detection using squared coherency functions. An actuator fault
distinguishability study is presented in (Koscielny et al. 2006). Several soft computing techniques
used in FDI methods have been developed under the scope of DAMADICS. A data-driven
method in FDI is presented in (Bocaniala et al. 2006), where a novel classifier based on particle
swarm optimization was developed. Group method of data handling (GMDH) neural networks
have been used in (Witczak et al. 2006) for robust fault detection. A computer-assisted FDI
scheme based on a fuzzy qualitative simulation, where the fault isolation is performed by a
hierarchical structure of the neuro-fuzzy networks is presented in (Calado et al. 2006). A neuro-
fuzzy modeling for FDI, involving a hybrid combination of neuro-fuzzy identification and
unknown input observers in the neuro-fuzzy and decoupling fault diagnosis scheme, has been
proposed in (Uppal et al. 2006).
The paper is organized as follows: In section 2 the proposed technique for FDI issues is
presented. This method uses models of faulty and fault-free behaviors with Neural Networks. The
design of decision tree is proposed in section 3 to assist the diagnosis on line with early decision.
Section 4 presents the DAMADICS actuator benchmark and application of our approach. Finally,
in the last section a conclusion about the effectiveness of this approach and future research
directions are presented.
2. NEURAL NETWORKS FAULTY AND FAULT-FREE MODELS
2.1. Fault-free Model
Physical processes are often very complex dynamic systems, having strong non linearities. As a
consequence, knowledge based models are not easy to obtain. Simplifications are essential to
formulate an exploitable model, but they may degrade the accuracy of the mathematical model.
Other problems remain with some model parameters that are not easy to measure or estimate and
that could be variable in time. Another problem lies in the systematic processing of data collected
by sensors.
At this stage, unknown nonlinear systems are considered with input vector U(t) = (ui(t)), i =1,...,q
and output vector Y(t) = (yk(t)), k =1,...,n. The state variables are not measurable. Neural
Networks (NN) are introduced to generate accurate models of the system in normal operating
conditions (Kourd et al., 2008, 2010, 2011). The comparison between the output of the system
and the output Y0’(t) = (y’k0(t)), k =1,...,n, of the NN model gives the error vector E(t) = (ek(t)), k
=1,...,n, with:
ek(t)= yk(t) - y'k0(t) (1)
The Neural Network model is trained with data collected from the fault-free system utilizing
Levenberg-Marquardt algorithm with early stopping that uses three data sets (training, testing and
validation) to avoid overfitting. Moreover, this algorithm is known in its fast convergence. The
obtained model is then tested and validated again with other sets of data. In order to get the best
model, several configurations are tested according to a trial error processing that uses pruning
3. Computer Science & Information Technology (CS & IT) 31
methods to eliminate the useless nodes.
2.2. Faulty Models
When multiple faults are considered, the isolation of the detected faults is no longer trivial and
early diagnosis becomes a difficult task. One can multiply the measurements and use some
analysis tools (residuals analysis) in order to isolate them. In particular, a history of collected data
can be used to improve the knowledge about the faulty behaviors. This knowledge is then used to
design models of faulty behaviors and additional residuals. Such models will be used to provide
estimations for each fault candidate. The decision results are then provided from the comparison
between estimations with the measurements collected during system operations.
The design of faulty models is similar to the method described in previous section (2.A). The
learning of faulty behaviors is obtained according to the Levenberg-Marquardt algorithm with
early stopping. Each model is built for a specific fault candidate fj that is considered as an
additional input. The vectors Y’j(t) = (y’kj(t)), k =1,...,n, j = 1,…p stand for the outputs of the
Neural Networks models designed for the faults fj, j = 1,…p.
3. DECISION TREES FOR RESIDUAL EVALUATION
3.1. Fault detection technique
During monitoring, the direct comparison of the system’s outputs Y(t) and the outputs Y'0(t) of
fault-free model leads to residuals R0(t) = (rk0(t)) and k = 1,…,n with:
rk0(t)= yk(t)-y'k(t), k =1,…,n. (2)
The residual R0(t) provides information about faults for further processing. Fault detection is
based on the evaluation of residuals magnitude. It is assumed that each residual rk0(t), k = 1,…,n
should normally be close to zero in the fault-free case, and it should be far from zero in the case
of a fault. Thus, faults are detected by setting threshold Sk0 on the residual signals (Fig. 1 up,
single residual and a single fault are considered for simplicity). The analysis of residuals rk0(t)
also provides an estimate τk of the time of occurrence tf used for diagnosis issue. When several
residuals are used, the estimate τ of the time of occurrence of faults is given by:
τ = min {τk, k = 1,…,n} (3)
Figure 1. Fault detection by thresholding technique
The faults are detected when the magnitude of one residual |rk0(t)| augments the threshold Sk0:
൜
|ݎሺݐሻ|≤ ܵ: No fault is detected at time ݐ
|ݎሺݐሻ| > ܵ: A fault is detected at time ݐ
(4)
Fault occurrence f
False alarm r(t)
-
0
S0
0 t
t
f(t)
τ
Delay
Fault f detected at
instant τ
t f
4. 32 Computer Science & Information Technology (CS & IT)
The main difficulty with this evaluation is that the measurement of the system outputs yk(t) is
usually corrupted by disturbances (for example, measurement noise). In practice, due to the
modeling uncertainties and disturbances, it is necessary to assign large thresholds Sk0 in order to
avoid false alarms. Such thresholds usually imply a reduction of the fault detection sensitivity and
can lead to non detections. In order to avoid such problems, one can run also the models of faulty
behaviors from t=0 and use the method described below. The idea is to evaluate the probability of
the fault candidates at each instant. A fault is detected when the probability of one neural network
faulty model NNFM(j), j = 1,..., p becomes larger than the probability of the fault-free model
NNFM(0) (Kourd et al., 2010).
3.2. Fault diagnosis based on three valued residuals
The proposed approach is based on the analysis of the outputs obtained after applying the input
U(t) on the real system. Obtained outputs are also analyzed in parallel with fault-free and faulty
behaviors models constructed by Neural Networks technique (Kourd et al., 2012). Detection and
diagnosis are achieved from residuals generation Rj(t), j = 0,...,p according to a decision block.
The diagnosis results either from the usual thresholding technique or from the on-line
determination of fault probabilities and confidence factors (Kourd et al., 2011). In the second
method, the faulty models run simultaneously from time t = τ where τ is the time when the fault
is detected. Each model will behave according to a single fault candidate and the resulting
behaviors will be compared with the collected data to provide rapid diagnosis. In case of
numerous fault candidates fj, j = 1,…,p, the output Y'j(t) = (y’k(t, fj,τ)) of the model NNFM(j) is
compared with the measured vector Y(t) to compute additive residual Rj(t)= (rkj(t,τ)), k = 1,…,n.
The most probable fault candidate is determined according to the comparison of all residuals
rkj(t,τ), k = 1,…,n, j = 1,…,p resulting from the n outputs and p models of faults:
ݎሺ,ݐ ߬ሻ = ݕሺݐሻ − ݕ
ᇱ
ሺ,ݐ ߬ሻ (5)
According to the residual analysis of rkj obtained by equation (5), and adopting positive and
negative thresholds, threes values of these residuals are obtained (positive, negative or null). The
comparison of the current residual with the signatures matrix leads to diagnosis (Chen et al.
1999).
3.3. Decision trees for residual evaluation
The aim of this section is to propose a hierarchical structure to simplify the diagnosis of
automation systems when numerous residuals are computed. The idea is to organize the residuals
in a decision tree. This tree is used to compute only the selection of residuals that are the most
significant for the current signal. The tree starts with the evaluation of the residual that
corresponds to the fault free model (step 1). The value of the residual is used to classify the fault
candidates in several subgroups (figure 2, G1 to Gm). Each subgroup limits the number of fault
candidates. The algorithm continues by evaluating second residual that depends on the subgroup
resulting from the first step (step 2). Another time the fault candidates are separated into
subgroups (figure 2, G11 to G1t for example).
5. Computer Science & Information Technology (CS & IT) 33
Figure 2. FDI decision tree proposed
According to that evaluation, the algorithm continues until a subset of faults with a single
candidate is isolated (presented by the leaves of tree in figure 2). Finally the faults are isolated by
the computation of selected residuals. Thus the computational effort is reduced in comparison
with the systematic evaluation of all residuals. In practice, the use of hierarchical architecture is
feasible online or offline depending on the complexity of the system.
4. APPLICATION IN INDUSTRIAL SYSTEM
To evaluate FDI methods proposed, The DAMADICS benchmark is an engineering research
case-study that can be used. This is electro-pneumatic valve actuator in the Lublin sugar factory
in Poland (Bartys et al., 2006). Its main characteristics are:
(a) The DAMADICS benchmark is based on the physical phenomena that give origin to faults in
the system.
(b) The DAMADICS benchmark clearly defines the process and data sets; the fault scenarios are
standardized. This is done in view of industrial applicability of the tested FDI solutions, to cut off
methods that have no practical feasibility.
4.1. Actuator description
The actuator consists of a control valve, a pneumatic servomotor and a positioner (Figure 3). In
the actuator, faults can appear in: control valve, servo-motor, electro-pneumatic transducer, piston
rod travel transducer, pressure transmitter or microprocessor control unit. A total number of 19
different faults is considered (p = 19, Table 1). The faults are emulated under carefully monitored
conditions, keeping the process operation within acceptable limits. Five available measurements
and one control value signal have been considered for benchmarking purposes: process control
6. 34 Computer Science & Information Technology (CS & IT)
external signal (CV), liquid pressures on the valve inlet (P1) and outlet (P2), liquid flow rate (F),
liquid temperature (T1) and servomotor rod displacement (X).
Figure 3. Electro-pneumatic valve Schema.
Within the DAMADICS project the actuator simulator was developed under MATLAB Simulink.
This tool makes it possible to generate data for the normal and 19 faulty operating modes. The
considered faults can be either of abrupt or incipient origins. Abrupt faults are of small (S),
medium (M) or big (B) magnitude.
4.2. Neural Network Fault-free Model for Actuator
Two Multi Layer Perceptron (MLP) neural networks are designed to model the outputs y1(t) =
X(t) and y2(t) = F(t) of the DAMADICS system in case of fault-free behaviors. y’10(t) = X’(t) and
y’20(t) = F’(t) are the estimated values of X(t) and F(t) processed by NNs:
(X’, F')= NNFM(0) {CV, P1, P2, T1, X, F} (6)
Where NNFM(0) stands for the double MLP structures. To select the structure of NNFM(0),
several tests are carried out to obtain the best architectures (with minimal number of hidden layers
and number of neurons by layer) for modeling the operation of the actuator. The training, testing
and validating data is simulated using Matlab Simulink actuator model. Validation is done by the
measured data provided by 'Lublin Sugar Factory'.
4.3. Neural Network faulty Model for Actuator
The preceding method is applied to build NNs models corresponding to the 19 fault candidates
that are considered in DAMADICS benchmark. For that purpose, it is necessary to create a data
base that contains samples for all faults (Kourd et al., 2011) exposed to the DAMADICS system.
The method is illustrated in Figure 4 for the fault fj with j=1 to 19 faults. The network NNFM(j)
learns the mapping from q=6 inputs to n=2 outputs when fault fj is assumed to affect the system
from time t = 0. Equation (7) holds:
(X’j, F'j)= NNFM(j) (CV, P1, P2, T1, Xj, Fj) (7)
To select the structure of NNFM(j), numerous tests are carried out to obtain the best architectures.
The training and test data are generated using Matlab-Simulink DABLIB models (DAMADICS
2002). The best structure is a Neural Network with 6 nodes in the first hidden layer, 3 nodes in
the second hidden layer and two output neurons. Validation is done with the measured data
provided by the Lublin Sugar Factory in 2001 (DAMADICS 2002).
S
DT
FT
E/P PC
Positioner
CVIPs
V
V3
V1 V2
F
SP
X
PSP
Pz
Pneumatic servo
motor
Valve
PTPT
P1 P2
Fv3
FvT1
TT
P
X
D/APV
Hydraulic
pipes
S
PT
7. Computer Science & Information Technology (CS & IT) 35
Figure 4. Schema of Neural Networks faulty model NNFM(j).
4.4. Residual by Three valued for Actuator system:
The residuals analysis is an essential step in FDI systems. The first parameter to be defined in the
design of a fault detection system is the threshold value, which value allows the system to meet
the required false alarm probability. The problem of the threshold selection is closely linked to the
behavior of residuals and also to constraints that may be imposed such as security margins
tolerance (Lefebvre et al., 2010). The residual vector R0(t) = (rk0(t)), k = 1, 2 for DAMADICS
actuator is first considered for fault detection:
ቊ
ݎଵሺݐሻ = ܺሺݐሻ − ܺ′ሺݐሻ
ݎଶሺݐሻ = ܨሺݐሻ − ܨ′ሺݐሻ
(8)
Where X’ and F’ are the outputs of the NN model of fault-free behaviors. The detection is
obtained by comparing residuals with appropriate thresholds. Three-valued signal are obtained
(positive, negative and zero). The thresholds are figured out according to the standard deviation
of the residual for fault-free case (Kourd et al., 2011). Let us notice that the choice of constant or
adaptive thresholds strongly influences the performance of the FDI system. The thresholds must
be thoroughly selected. For the continuation of our work, the thresholds S10=5*σ1 = 0.0027 and
S20 =5*σ2 =0.004 are selected where σ1 and σ2 are the standard deviations obtained from the
learning process. Table 1 sums up the detection performances for the 19 types of faults according
to the sign of the residual vector R0.
Table 1 Signature matrix for DAMADICS Actuator with residual R0
G0 f0 f1 f2 f3 f4 f5 f6 f7 f8 f9 f10 f11 f12 f13 f14 f15 f16 f17 f18 f19
r10 0 +1 -1 0 -1 0 0 +1 0 0 +1 -1 -1 -1 0 -1 +1 +1 0 0
r20 0 -1 +1 -1 -1 +1 -1 -1 0 -1 -1 +1 +1 -1 0 +1 -1 -1 -1 +1
The signification of (+1) is the case where the residual is above the positive threshold, (-1) is the
case where the residual is below the negative threshold and (0) when the residual is between both
thresholds.
8. 36 Computer Science & Information Technology (CS & IT)
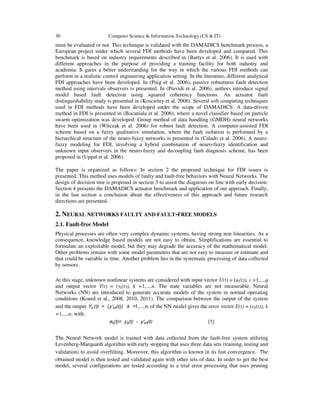
Figure 5. Residuals r10 and r20 in the case where f1 was simulated during time interval [350s
1000s].
The evaluation of residual vector R0 leads to a first stage in detection and isolation. From Table 1,
six groups of faults with similar symptoms can be separated:
• Group 1 : ܩଵ = ሼ݂ଷ ݂ ݂ଽ ݂ଵ଼ሽ with signature ൫
ିଵ
൯
• Group 2 : ܩଶ = ሼ݂ଵ ݂ ݂ଵ ݂ଵ ݂ଵሽ with signature ൫ାଵ
ିଵ
൯
• Group 3 : ܩଷ = ሼ݂ହ ݂ଵଽሽ with signature ൫
ାଵ
൯
• Group 4 : ܩସ = ሼ݂ଶ ݂ଵଵ ݂ଵଶ ݂ଵହሽ with signature ൫ିଵ
ାଵ
൯
• Group 5 : ܩହ = ሼ݂ସ ݂ଵଷሽ with signature ൫ିଵ
ିଵ
൯
• Group 6 : ܩ = ሼ݂ ଼݂ ݂ଵସሽ with signature ൫
൯
The faults in groups G1 to G5 are detected but not isolated because the signatures over r10 and r20
are similar within the group. One can also notice that the faults in group G6 have the same
signature as the fault-free behaviors. Thus faults in group G6 cannot be directly detected with
residuals r10 and r20.
For this reason other residuals generated by faulty behavior neural models NNFM(j) can be added
for each group. This allows the building of signatures matrix. An evaluation step that uses same
thresholding technique is followed up. Tables 2 to 7 sum up the detection performances for the 19
types of faults according to the sign of the residual vector Rj(t) generated by NNFM(j) with j=
1,...,19.
400 500 600 700 800 900 1000
-0.01
-0.005
0
0.005
0.01
400 500 600 700 800 900 1000
-0.03
-0.02
-0.01
0
0.01
0.02
0.03
Mean value
of r10
Mean value
of r20
r10
r20
t
t
+/-S10
+/-S20
9. Computer Science & Information Technology (CS & IT) 37
Table 2 Table 3 Table 4
Signature matrix for group G1 Signature matrix for group G2 Signature matrix for group G3
Table 7
Table 5 Signature matrix for group G6
Signature matrix for group G4 Table 6
Signature matrix for group G5
4.5. Decision tree for diagnosis DAMADICS Actuator:
The introduction of probabilities to evaluate the significance of each residual and the reliability of
the decision is another component of our approach. The proposed method uses a time window
that can be sized according to the time requirement. Diagnosis with a large time window includes
a diagnosis delay but will lead to a decision with a high confidence index. On the contrary single
diagnosis with a small time window leads to early diagnosis but with a lower confidence index.
The diagnosis results either from the usual thresholding technique or from the on-line
determination of fault probabilities and confidence factors (Kourd et al., 2011).
According to the values of residuals and selection of faulty model NNFM (j), we introduce
decision trees to set the path of the branch that must be followed for the isolation of all detected
faults. From this standpoint, we can configure many decision trees that lead to various
computational complexities.
5. CONCLUSION
The accurate and timely fault diagnosis of safety critical systems is important because it can
decrease the probability of catastrophic failures, increase the life of the plant, and reduce
maintenance costs. In this paper, a multiple-model FDI scheme is presented for a DAMADICS
actuator. NNs technique is applied for residual generation. In the first step of FDI, the use of NNs
method is considered as an alternative to the traditional model-based approach for residual
generation. When quantitative models are not readily available, a correctly trained NNs model
can be used as a non-linear dynamic model of the system. The proposed NNFMs presented in this
paper can be used to diagnose the faults in the DANMADICS actuator. In the second step of the
FDI task, a decision tree was introduced for residual evaluation. An evolutionary technique was
used to isolate the faults step by step by separating the fault candidates into several groups with
same signatures. This study shows that the developed approach can produce good diagnosis
results for a complex system exposed to numerous faults. The use of decision trees divides the
computational effort by 10 for the DAMADICS system and can be implemented on line.
G1 f3 f6 f9 f18
r13 0 0 0 0
r23 0 -1 -1 -1
r16 0 0 0 0
r26 -1 0 -1 -1
r19 +1 +1 0 +1
r29 -1 +1 0 +1
r118 0 0 0 0
r218 -1 -1 -1 0
G2 f1 f7 f10 f16 f17
r11 0 +1 +1 +1 +1
r21 0 0 -1 -1 -1
r17 -1 0 +1 +1 +1
r27 0 0 -1 -1 -1
r110 -1 -1 0 +1 +1
r210 +1 +1 0 -1 -1
r116 -1 -1 -1 0 +1
r116 +1 +1 +1 0 -1
r117 -1 -1 -1 -1 0
r117 +1 +1 +1 +1 0
G3 f5 f19
r15 0 0
r25 0 -1
r119 0 0
r219 1 0
G4 f2 f11 f12 f15
r12 0 +1 +1 +1
r22 0 +1 +1 -1
r111 -1 0 +1 +1
r211 -1 0 -1 -1
r112 -1 -1 0 +1
r212 -1 +1 0 -1
r1115 -1 -1 -1 0
r215 +1 +1 +1 0
G5 f4 f13
r14 0 0
r24 0 +1
r113 -1 0
r213 -1 0
G6 f0 f8 f14
r10 0 0 0
r20 0 0 0
r18 0 0 0
r28 0 0 0
r114 0 0 0
r214 0 0 0
10. 38 Computer Science & Information Technology (CS & IT)
Applying this scheme on other types of operating systems will be the key issue of our interests in
future research, in which other labeled faults will be investigated. This work can be extended to
diagnose new faults using integrated set of decision tree which looks to be a worthwhile direction
for future case study. Implementing this decision tree for the online diagnosis issues as well as
choosing its components is an open task for more optimization and quick isolation.
ACKNOWLEDGMENTS
The work was supported in part by Ministry of Higher Education and Scientific Research in
Algeria.
REFERENCES
[1] Bartys M., Patton R., M. Syfert, Heras S. & Quevedo J., (2006) "Introduction to the DAMADICS FDI
benchmark actuator study". Control engineering practice. 14. 577-596.
[2] Brown M. & Harris C. J., (1994) "Neuro-fuzzy adaptive modelling and control". Englewood Cliffs,
NJ: Prentice-Hall.
[3] Browne A., Hudson B. D., Whitley D. C., Ford M.G. & Picton P., (2004) "Biological data mining
with neural networks: implementation and application of a flexible decision tree extraction algorithm
to genomic problem domains". Neurocomputing. 57. 275–293.
[4] Calado J., Korbicz J., Patan K., Patton R.J & Sa da Costa J., (2001) "Soft computing approaches to
fault diagnosis for dynamic systems". European Journal of Control 7. 248–286.
[5] Calado J., & Sa da Costa J., (2006) "Fuzzy neural networks applied to fault diagnosis. In:
Computational intelligence in fault diagnosis", Springer-Verlag, London.
[6] Chen J. & Patton R.J., (1999) "Robust Model-Based Fault Diagnosis for Dynamic Systems". Kluwer
Academic Publishers, Berlin.
[7] Chen Y., Abrahama A. & Yanga B., (2006) "Feature selection and classification using flexible neural
tree". Neurocomputing. 70. 305–313.
[8] DAMADICS, (2002) Website of the RTN DAMADICS. (http://diag.mchtr.pw.edu.pl/damadics).
[9] Frank P.M. & Koppen-Seliger B., (1997) "New developments using AI in fault diagnosis".
Engineering Applications of Artificial Intelligence 10. 3-14.
[10] Gertler, J. (1998) "Fault detection and diagnosis in engineering systems", New York, Basel, Hong
Kong: Marcel Dekker.
[11] Guglielmi G., Parisini T. & Rossi G., (1995) "Fault diagnosis and neural networks: A power plant
application" (keynote paper). Control Engineering Practice. 3. 601–620.
[12] Himmelblau D. M., (1992) "Use of artificial neural networks in monitor faults and for troubleshooting
in the process industries". In: Preprints IFAC Symp. On-line Fault Detection and Supervision in the
Chemical Process Industries, Newark, Delaware. USA. 144-149.
[13] Isermann R., (1994) "Fault diagnosis of machines via parameter estimation and knowledge
processing", A tutorial paper. Automatica. 29. 815–835.
[14] Isermann R., (1997) "Supervision, fault detection and diagnosis of technical systems". Special Section
of Control Engineering Practice 5.
[15] Isermann R., (2006) "Fault Diagnosis Systems. An Introduction from Fault Detection to Fault
Tolerance". Springer-Verlag, New York.
[16] Janczak A., (2005) "Identification of Nonlinear Systems Using Neural Networks and Polynomial
Models". A Block-oriented Approach. Lecture Notes in Control and Information Sciences. Springer-
Verlag, Berlin.
[17] Jang J. S. R., Sun C. T. & Mizutani E., (1997) "Neuro-Fuzzy and Soft Computing". Englewood Cliffs,
NJ: Prentice-Hall.
[18] Korbicz J., Koscielny J., Kowalczuk Z. & Cholewa W., (2004) "Fault Diagnosis. Models, Artificial
Intelligence, Applications". Springer-Verlag, Berlin Heidelberg.
[19] Korbicz J., Patan K. & Kowal M., eds., (2007) "Fault Diagnosis and Fault Tolerant Control.
Challenging Problems of Science - Theory and Applications: Automatic Control and Robotics".
Academic Publishing House EXIT, Warsaw.
[20] Koscielny J. M., Bartys M., Rzepiejewski P. & S. da Costa J., (2006) "Actuator fault
distinguishability study for the DAMADICS benchmark problem". Control Engineering Practice, 14,
645-652.
11. Computer Science & Information Technology (CS & IT) 39
[21] Kourd Y., Guersi N. & Lefebvre D., (2008) "A two stages diagnosis method with Neural networks".
Proceeding ICEETD, Hammamet Tunisie.
[22] Kourd Y., Guersi N. & Lefebvre D. (2010), "Neuro-fuzzy approach for fault Diagnosis: application to
the DAMADICS". 7th international Conference on Informatics in Control, Automation and Robotics.
Proceeding ICINCO 2010. Funchal. Portugal.
[23] Kourd Y., Lefebvre D. & Guersi N. (2011) "Early FDI Based on Residuals Design According to the
Analysis of Models of Faults: Application to DAMADICS". Advances in Artificial Neural Systems.
doi:10, 1155/2011/453169.
[24] Lefebvre D., Chafouk H. & Lebbal M. (2010) "Modélisation et Diagnostic des Systèmes. Une
Approche Hybride". Editions Universitaires Européennes.
[25] Maji P., (2008) "Efficient design of neural network tree using a new splitting criterion".
Neurocomputing. 71. 787-800.
[26] Narendra K., Balakrishnan J. & Kermal M., (1995) "Adaptation and learning using multiple models,
switching and tuning". IEEE Control Systems Magazine. 37–51.
[27] Osowski S. (1996) "Neural Networks in Algorithmitic Expression". WNT, Warsaw (in Polish).
[28] Patan K. & Parisini T., (2005) "Identification of neural dynamic models for fault detection and
isolation: The case of a real sugar evaporation process". Journal of Process Control. 15.67-79
[29] Patton R.J., Chen J. & Siew T. (1994) "Fault diagnosis in nonlinear dynamic systems via neural
networks". In: Proc. of CONTROL’94, Coventry, UK. 2. 1346–1351.
[30] Patton, R.J., Korbicz, J., (1999) "Advances in computational intelligence". Special Issue of
International Journal of Applied Mathematics and Computer Science 9.
[31] Patton R.J., Frank P.M. & Clark R., (2000) "Issues of Fault Diagnosis for Dynamic Systems".
Springer-Verlag, Berlin.
[32] Pomorski D., Perche P. B., (2001) "Inductive learning of decision trees: application to fault isolation
of an induction motor". Engineering Applications of Artificial Intelligence. 14,155–166
[33] Previdi F. & Parisini T., (2006) "Model-free actuator fault detection using a spectral estimation
approach: the case of the DAMADICS benchmark problem". Control Engineering Practice. 14, 635–
644.
[34] Sorsa T. & Koivo H. N., (1992) "Application of neural networks in the detection of breaks in a paper
machine". In: Preprints IFAC Symp. On-line Fault Detection and Supervision in the Chemical Process
Industries, Newark, Delaware, USA. 162–167.
[35] Sugumaran V., Muralidharan V. & Ramachandran K. I., (2007) "Feature selection using decision tree
and classification through proximal support vector machine for fault diagnosis of roller bearing".
Mechanical Systems and Signal Processing. 21. 930-942.
[36] Uppala F. J., Patton R. J. & Witczak M., (2006) "A neuro-fuzzy multiple-model observer approach to
robust fault diagnosis based on the DAMADICS benchmark problem". Control Engineering Practice.
14. 699-717.
[37] Witczak M. & Korbicz J., (2002) "Genetic programming in fault diagnosis and identification of non-
linear dynamic systems". In: W. Cholewa, J. Korbicz, Koscielny & J.M. Kowalczuk, (Eds.),
Diagnostics of processes. Models, Methods of Artifical Intelligence, Applications, Scientific
Engineering Press, Warsaw.
[38] Witczak M., (2007) "Modelling and Estimation Strategies for Fault Diagnosis of Non-Linear
Systems". From Analytical to Soft Computing Approaches. Lecture Notes in Control and Information
Sciences. Springer–Verlag, Berlin.
[39] Witczak M., Korbicz J., Mrugalski M. & Patton R. J., (2006) "A GMDH neural network-based
approach to robust fault diagnosis: Application to the DAMADICS benchmark problem". Control
Engineering Practice. 14. 671-683.
[40] Zhang K., Li Y., Scarf P. & Ball A., (2011) "Feature selection for high-dimensional machinery fault
diagnosis data using multiple models and Radial Basis Function networks". Neurocomputing. 74.
2941–2952.