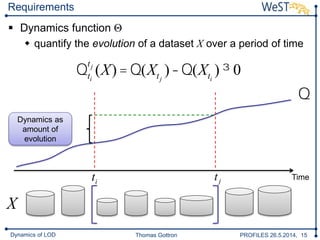
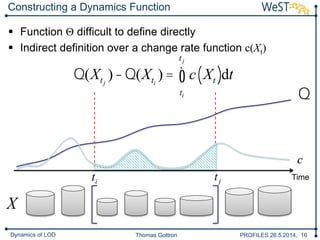
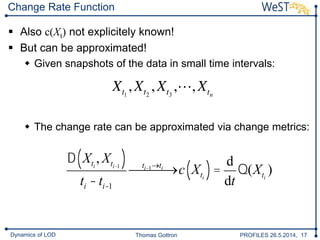
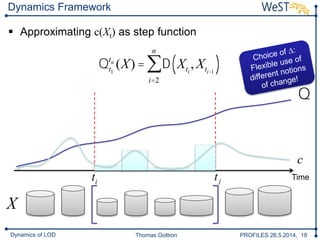
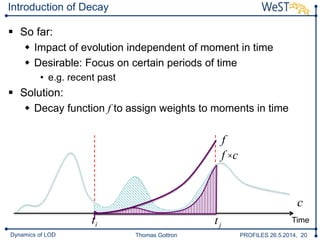
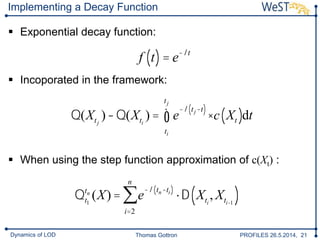
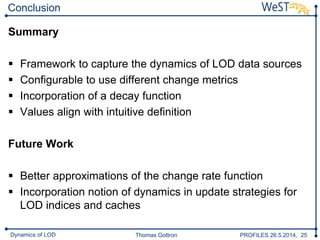
Institute for Web Science & Technologies – WeST
From Changes to Dynamics:
Dynamics Analysis of Linked Open
Data Sources
Renata Dividino, Thomas Gottron
Ansgar Scherp, Gerd Gröner
May 26th, 2014
PROFILES Workshop, Crete
Thomas Gottron PROFILES 26.5.2014, 2Dynamics of LOD
Linked Data Evolves
Thomas Gottron PROFILES 26.5.2014, 3Dynamics of LOD
Linked Data Evolves
Time
Volume
Triples provided by data sources
Thomas Gottron PROFILES 26.5.2014, 4Dynamics of LOD
Effects on Indices and Caches
Thomas Gottron PROFILES 26.5.2014, 5Dynamics of LOD
Updates of Indices and Caches
Thomas Gottron PROFILES 26.5.2014, 6Dynamics of LOD
Change Metrics
Thomas Gottron PROFILES 26.5.2014, 7Dynamics of LOD
Change Metrics
 Comparison of two RDF data sets (e.g. from different
points in time)
 Xi : Set of triple statements
 Numeric expression for „distance“
 Example:
X1
X2
Δ 0,¥[ )
DJaccard X1, X2( ) =1-
X1 Ç X2
X1 È X2
Thomas Gottron PROFILES 26.5.2014, 8Dynamics of LOD
Toy example: Changes Analysis of LOD
1st snapshot
GerdInstitute
ZBW
Institute
WeST
Thomas
Gerd
Ansgar
Renata
Thomas Gottron PROFILES 26.5.2014, 9Dynamics of LOD
Toy example: Changes Analysis of LOD
1st snapshot
GerdInstitute
ZBW
Institute
WeST
Thomas
Gerd
Ansgar
Renata
2nd snapshot
Institute
ZBW
Institute
WeST
Thomas
Gerd
Ansgar
Renata
Institute
Paluno
Thomas Gottron PROFILES 26.5.2014, 10Dynamics of LOD
Toy example: Changes Analysis of LOD
Changes detected between 1st and 2nd snapshot
1. Deleted: <InstituteWEST hasMember Gerd>
2. New: <InstitutePaluno hasMember Gerd >
1st snapshot
GerdInstitute
ZBW
Institute
WeST
Thomas
Gerd
Ansgar
Renata
2nd snapshot
Institute
ZBW
Institute
WeST
Thomas
Gerd
Ansgar
Renata
Institute
Paluno
Thomas Gottron PROFILES 26.5.2014, 11Dynamics of LOD
Toy example: Changes Analysis of LOD
1st snapshot
GerdInstitute
ZBW
Institute
WeST
Thomas
Gerd
Ansgar
Renata
2nd snapshot
Institute
ZBW
Institute
WeST
Thomas
Gerd
Ansgar
Renata
Institute
Paluno
3rd snapshot
Institute
ZBW
Institute
WeST
Thomas
Gerd
Ansgar
Renata
Thomas Gottron PROFILES 26.5.2014, 12Dynamics of LOD
Toy example: Changes Analysis of LOD
1st snapshot 2nd snapshot 3rd snapshot
GerdInstitute
ZBW
Institute
WeST
Thomas
Gerd
Ansgar
Renata
Institute
ZBW
Institute
WeST
Thomas
Gerd
Ansgar
Renata
Institute
ZBW
Institute
WeST
Thomas
Gerd
Ansgar
Renata
Institute
Paluno
Changes detected between 2nd and 3rd snapshot
1. New: <InstituteWEST hasMember Gerd>
2. Deleted: <InstitutePaluno hasMember Gerd >
Thomas Gottron PROFILES 26.5.2014, 13Dynamics of LOD
Toy example: Changes Analysis of LOD
1st snapshot 2nd snapshot 3rd snapshot
GerdInstitute
ZBW
Institute
WeST
Thomas
Gerd
Ansgar
Renata
Institute
ZBW
Institute
WeST
Thomas
Gerd
Ansgar
Renata
Institute
ZBW
Institute
WeST
Thomas
Gerd
Ansgar
Renata
Institute
Paluno
Changes detected between 1st and 3rd snapshot
None!
Thomas Gottron PROFILES 26.5.2014, 14Dynamics of LOD
A Framework for Linked Data
Dynamics
Thomas Gottron PROFILES 26.5.2014, 15Dynamics of LOD
Requirements
 Dynamics function Θ
 quantify the evolution of a dataset X over a period of time
Qti
tj
(X)= Q(Xtj
)-Q(Xti
) ³ 0
Q
Dynamics as
amount of
evolution
Timeti tj
X
Thomas Gottron PROFILES 26.5.2014, 16Dynamics of LOD
Constructing a Dynamics Function
 Function Θ difficult to define directly
 Indirect definition over a change rate function c(Xt)
Q(Xtj
)-Q(Xti
) = c Xt( )
ti
tj
ò dt
Time
Q
c
ti tj
X
Thomas Gottron PROFILES 26.5.2014, 17Dynamics of LOD
Change Rate Function
 Also c(Xt) not explicitely known!
 But can be approximated!
 Given snapshots of the data in small time intervals:
 The change rate can be approximated via change metrics:
D Xti
, Xti-1
( )
ti -ti-1
ti-1®ti
¾ ®¾¾ c Xti
( )=
d
dt
Q(Xti
)
Thomas Gottron PROFILES 26.5.2014, 18Dynamics of LOD
Dynamics Framework
 Approximating c(Xt) as step function
Timeti tj
Q
c
Qt1
tn
(X) = D Xti
, Xti-1
( )
i=2
n
å
X
Thomas Gottron PROFILES 26.5.2014, 19Dynamics of LOD
Use of Decay Functions
Thomas Gottron PROFILES 26.5.2014, 20Dynamics of LOD
Introduction of Decay
 So far:
 Impact of evolution independent of moment in time
 Desirable: Focus on certain periods of time
• e.g. recent past
 Solution:
 Decay function f to assign weights to moments in time
Time
c
ti tj
f
f ×c
Thomas Gottron PROFILES 26.5.2014, 21Dynamics of LOD
Implementing a Decay Function
 Exponential decay function:
 Incoporated in the framework:
 When using the step function approximation of c(Xt) :
f t( )= e-lt
Q(Xtj
)-Q(Xti
) = e
-l tj-t( )
×c Xt( )
ti
tj
ò dt
Qt1
tn
(X) = e
-l tn-ti( )
×D Xti
, Xti-1
( )
i=2
n
å
Thomas Gottron PROFILES 26.5.2014, 22Dynamics of LOD
Some Results
Thomas Gottron PROFILES 26.5.2014, 23Dynamics of LOD
Experiments
 84 snapshots (approx 1.5 years)
 652 data sources (PLD)
 Dynamics on data level
Thomas Gottron PROFILES 26.5.2014, 24Dynamics of LOD
Tabelle1
2012-05-06
2012-06-03
2012-07-01
2012-07-29
2012-08-26
2012-09-23
2012-10-21
2012-11-18
2012-12-16
2013-01-13
2013-02-24
2013-03-24
2013-04-22
2013-05-19
2013-06-16
2013-07-14
2013-08-11
2013-09-08
2013-10-06
2013-11-03
0
0,2
0,4
0,6
0,8
1
Change Rate Function of Seleted Data Sources
Tabelle1
2012-05-06
2012-05-27
2012-06-17
2012-07-08
2012-07-29
2012-08-19
2012-09-09
2012-09-30
2012-10-21
2012-11-11
2012-12-02
2012-12-23
2013-01-13
2013-02-19
2013-03-10
2013-03-31
2013-04-22
2013-05-12
2013-06-04
2013-06-23
2013-07-14
2013-08-04
2013-08-25
2013-09-15
2013-10-06
2013-10-27
2013-11-17
0
0,2
0,4
0,6
0,8
1
Θ = 55.71 , Θdecay = 23.42
dbpedia.org
Tabelle1
2012-05-06
2012-06-03
2012-07-01
2012-07-29
2012-08-26
2012-09-23
2012-10-21
2012-11-18
2012-12-16
2013-01-13
2013-02-24
2013-03-24
2013-04-22
2013-05-19
2013-06-16
2013-07-14
2013-08-11
2013-09-08
2013-10-06
2013-11-03
0
0,2
0,4
0,6
0,8
1
Θ = 58.45 , Θdecay = 18.48
identi.ca
Θ = 51.75 , Θdecay = 25.03
linkedct.org
Tabelle1
2012-05-06
2012-06-03
2012-07-01
2012-07-29
2012-08-26
2012-09-23
2012-10-21
2012-11-18
2012-12-16
2013-01-13
2013-02-24
2013-03-24
2013-04-22
2013-05-19
2013-06-16
2013-07-14
2013-08-11
2013-09-08
2013-10-06
2013-11-03
0
0,2
0,4
0,6
0,8
1
Θ = 20.90 , Θdecay = 8.33
dbtune.org
Thomas Gottron PROFILES 26.5.2014, 25Dynamics of LOD
Conclusion
Summary
 Framework to capture the dynamics of LOD data sources
 Configurable to use different change metrics
 Incorporation of a decay function
 Values align with intuitive definition
Future Work
 Better approximations of the change rate function
 Incorporation notion of dynamics in update strategies for
LOD indices and caches
Thomas Gottron PROFILES 26.5.2014, 26Dynamics of LOD
Thanks!
Contact:
Thomas Gottron
WeST – Institute for Web Science and Technologies
Universität Koblenz-Landau
gottron@uni-koblenz.de

From Changes to Dynamics: Dynamics Analysis of Linked Open Data Sources

  • 1.
    Institute for WebScience & Technologies – WeST From Changes to Dynamics: Dynamics Analysis of Linked Open Data Sources Renata Dividino, Thomas Gottron Ansgar Scherp, Gerd Gröner May 26th, 2014 PROFILES Workshop, Crete
  • 2.
    Thomas Gottron PROFILES26.5.2014, 2Dynamics of LOD Linked Data Evolves
  • 3.
    Thomas Gottron PROFILES26.5.2014, 3Dynamics of LOD Linked Data Evolves Time Volume Triples provided by data sources
  • 4.
    Thomas Gottron PROFILES26.5.2014, 4Dynamics of LOD Effects on Indices and Caches
  • 5.
    Thomas Gottron PROFILES26.5.2014, 5Dynamics of LOD Updates of Indices and Caches
  • 6.
    Thomas Gottron PROFILES26.5.2014, 6Dynamics of LOD Change Metrics
  • 7.
    Thomas Gottron PROFILES26.5.2014, 7Dynamics of LOD Change Metrics  Comparison of two RDF data sets (e.g. from different points in time)  Xi : Set of triple statements  Numeric expression for „distance“  Example: X1 X2 Δ 0,¥[ ) DJaccard X1, X2( ) =1- X1 Ç X2 X1 È X2
  • 8.
    Thomas Gottron PROFILES26.5.2014, 8Dynamics of LOD Toy example: Changes Analysis of LOD 1st snapshot GerdInstitute ZBW Institute WeST Thomas Gerd Ansgar Renata
  • 9.
    Thomas Gottron PROFILES26.5.2014, 9Dynamics of LOD Toy example: Changes Analysis of LOD 1st snapshot GerdInstitute ZBW Institute WeST Thomas Gerd Ansgar Renata 2nd snapshot Institute ZBW Institute WeST Thomas Gerd Ansgar Renata Institute Paluno
  • 10.
    Thomas Gottron PROFILES26.5.2014, 10Dynamics of LOD Toy example: Changes Analysis of LOD Changes detected between 1st and 2nd snapshot 1. Deleted: <InstituteWEST hasMember Gerd> 2. New: <InstitutePaluno hasMember Gerd > 1st snapshot GerdInstitute ZBW Institute WeST Thomas Gerd Ansgar Renata 2nd snapshot Institute ZBW Institute WeST Thomas Gerd Ansgar Renata Institute Paluno
  • 11.
    Thomas Gottron PROFILES26.5.2014, 11Dynamics of LOD Toy example: Changes Analysis of LOD 1st snapshot GerdInstitute ZBW Institute WeST Thomas Gerd Ansgar Renata 2nd snapshot Institute ZBW Institute WeST Thomas Gerd Ansgar Renata Institute Paluno 3rd snapshot Institute ZBW Institute WeST Thomas Gerd Ansgar Renata
  • 12.
    Thomas Gottron PROFILES26.5.2014, 12Dynamics of LOD Toy example: Changes Analysis of LOD 1st snapshot 2nd snapshot 3rd snapshot GerdInstitute ZBW Institute WeST Thomas Gerd Ansgar Renata Institute ZBW Institute WeST Thomas Gerd Ansgar Renata Institute ZBW Institute WeST Thomas Gerd Ansgar Renata Institute Paluno Changes detected between 2nd and 3rd snapshot 1. New: <InstituteWEST hasMember Gerd> 2. Deleted: <InstitutePaluno hasMember Gerd >
  • 13.
    Thomas Gottron PROFILES26.5.2014, 13Dynamics of LOD Toy example: Changes Analysis of LOD 1st snapshot 2nd snapshot 3rd snapshot GerdInstitute ZBW Institute WeST Thomas Gerd Ansgar Renata Institute ZBW Institute WeST Thomas Gerd Ansgar Renata Institute ZBW Institute WeST Thomas Gerd Ansgar Renata Institute Paluno Changes detected between 1st and 3rd snapshot None!
  • 14.
    Thomas Gottron PROFILES26.5.2014, 14Dynamics of LOD A Framework for Linked Data Dynamics
  • 15.
    Thomas Gottron PROFILES26.5.2014, 15Dynamics of LOD Requirements  Dynamics function Θ  quantify the evolution of a dataset X over a period of time Qti tj (X)= Q(Xtj )-Q(Xti ) ³ 0 Q Dynamics as amount of evolution Timeti tj X
  • 16.
    Thomas Gottron PROFILES26.5.2014, 16Dynamics of LOD Constructing a Dynamics Function  Function Θ difficult to define directly  Indirect definition over a change rate function c(Xt) Q(Xtj )-Q(Xti ) = c Xt( ) ti tj ò dt Time Q c ti tj X
  • 17.
    Thomas Gottron PROFILES26.5.2014, 17Dynamics of LOD Change Rate Function  Also c(Xt) not explicitely known!  But can be approximated!  Given snapshots of the data in small time intervals:  The change rate can be approximated via change metrics: D Xti , Xti-1 ( ) ti -ti-1 ti-1®ti ¾ ®¾¾ c Xti ( )= d dt Q(Xti )
  • 18.
    Thomas Gottron PROFILES26.5.2014, 18Dynamics of LOD Dynamics Framework  Approximating c(Xt) as step function Timeti tj Q c Qt1 tn (X) = D Xti , Xti-1 ( ) i=2 n å X
  • 19.
    Thomas Gottron PROFILES26.5.2014, 19Dynamics of LOD Use of Decay Functions
  • 20.
    Thomas Gottron PROFILES26.5.2014, 20Dynamics of LOD Introduction of Decay  So far:  Impact of evolution independent of moment in time  Desirable: Focus on certain periods of time • e.g. recent past  Solution:  Decay function f to assign weights to moments in time Time c ti tj f f ×c
  • 21.
    Thomas Gottron PROFILES26.5.2014, 21Dynamics of LOD Implementing a Decay Function  Exponential decay function:  Incoporated in the framework:  When using the step function approximation of c(Xt) : f t( )= e-lt Q(Xtj )-Q(Xti ) = e -l tj-t( ) ×c Xt( ) ti tj ò dt Qt1 tn (X) = e -l tn-ti( ) ×D Xti , Xti-1 ( ) i=2 n å
  • 22.
    Thomas Gottron PROFILES26.5.2014, 22Dynamics of LOD Some Results
  • 23.
    Thomas Gottron PROFILES26.5.2014, 23Dynamics of LOD Experiments  84 snapshots (approx 1.5 years)  652 data sources (PLD)  Dynamics on data level
  • 24.
    Thomas Gottron PROFILES26.5.2014, 24Dynamics of LOD Tabelle1 2012-05-06 2012-06-03 2012-07-01 2012-07-29 2012-08-26 2012-09-23 2012-10-21 2012-11-18 2012-12-16 2013-01-13 2013-02-24 2013-03-24 2013-04-22 2013-05-19 2013-06-16 2013-07-14 2013-08-11 2013-09-08 2013-10-06 2013-11-03 0 0,2 0,4 0,6 0,8 1 Change Rate Function of Seleted Data Sources Tabelle1 2012-05-06 2012-05-27 2012-06-17 2012-07-08 2012-07-29 2012-08-19 2012-09-09 2012-09-30 2012-10-21 2012-11-11 2012-12-02 2012-12-23 2013-01-13 2013-02-19 2013-03-10 2013-03-31 2013-04-22 2013-05-12 2013-06-04 2013-06-23 2013-07-14 2013-08-04 2013-08-25 2013-09-15 2013-10-06 2013-10-27 2013-11-17 0 0,2 0,4 0,6 0,8 1 Θ = 55.71 , Θdecay = 23.42 dbpedia.org Tabelle1 2012-05-06 2012-06-03 2012-07-01 2012-07-29 2012-08-26 2012-09-23 2012-10-21 2012-11-18 2012-12-16 2013-01-13 2013-02-24 2013-03-24 2013-04-22 2013-05-19 2013-06-16 2013-07-14 2013-08-11 2013-09-08 2013-10-06 2013-11-03 0 0,2 0,4 0,6 0,8 1 Θ = 58.45 , Θdecay = 18.48 identi.ca Θ = 51.75 , Θdecay = 25.03 linkedct.org Tabelle1 2012-05-06 2012-06-03 2012-07-01 2012-07-29 2012-08-26 2012-09-23 2012-10-21 2012-11-18 2012-12-16 2013-01-13 2013-02-24 2013-03-24 2013-04-22 2013-05-19 2013-06-16 2013-07-14 2013-08-11 2013-09-08 2013-10-06 2013-11-03 0 0,2 0,4 0,6 0,8 1 Θ = 20.90 , Θdecay = 8.33 dbtune.org
  • 25.
    Thomas Gottron PROFILES26.5.2014, 25Dynamics of LOD Conclusion Summary  Framework to capture the dynamics of LOD data sources  Configurable to use different change metrics  Incorporation of a decay function  Values align with intuitive definition Future Work  Better approximations of the change rate function  Incorporation notion of dynamics in update strategies for LOD indices and caches
  • 26.
    Thomas Gottron PROFILES26.5.2014, 26Dynamics of LOD Thanks! Contact: Thomas Gottron WeST – Institute for Web Science and Technologies Universität Koblenz-Landau gottron@uni-koblenz.de