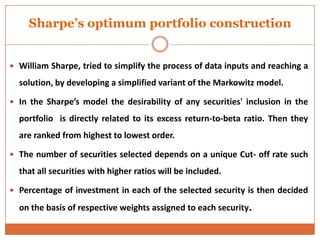
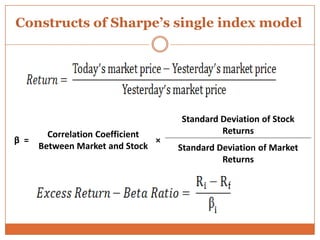
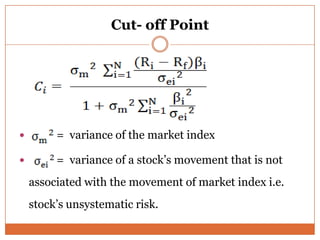
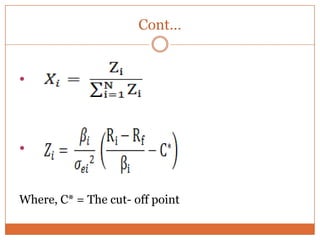
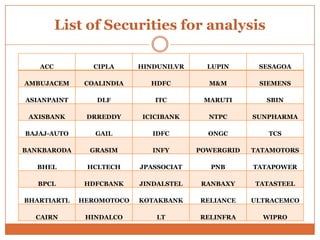
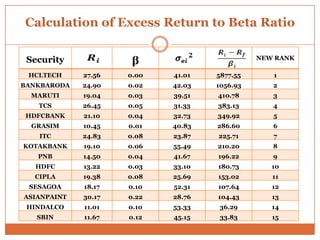
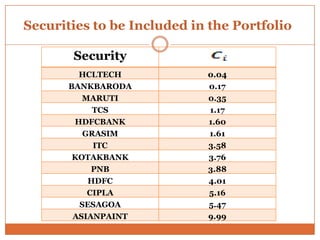
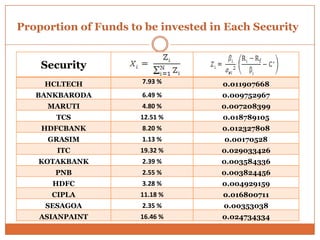
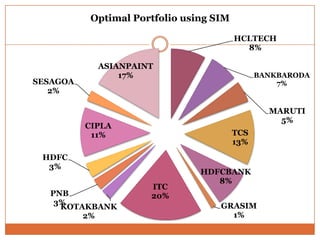
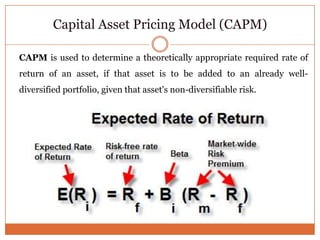
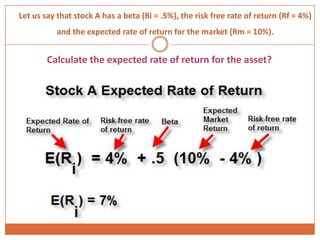
SYNOPSIS
 Efficient Market Theory
 Portfolio Analysis – Markowitz theory
 Sharpe’s optimum portfolio construction
 Capital Asset Pricing Model (CAPM)
Efficient Market Theory
 Efficient Market theory states that the share price fluctuations are
random and do not follow any regular pattern.
Features of Efficient Market
 All instruments are correctly priced as all available information is
perfectly understood and absorbed by all the investors.
 No excess profits are possible.
 In a perfectly efficient market, analysts immediately compete away any
chance of earning abnormal profits.
 The forces of demand and supply move freely and in an independent
and random manner.
The three forms of market efficiency
Weak form: Market pricing information includes only past prices
Semi-strong form: includes public information
Strong form: includes public and private information
Portfolio Analysis
 Portfolio is a combination of securities such as
stocks, bonds, etc.
 The process of blending together these securities
so as to obtain optimum return with minimum
risk is called portfolio construction.
 A rational investor always attempts to minimize risk
and maximize return on his investment.
 Investing in more than one security is a strategy to
attain this goal.
Markowitz Theory
 Markowitz is considered the father of modern portfolio
theory, mainly because he is the first person who gave a
mathematical model for portfolio optimization and diversification.
 Modern portfolio theory (MPT) is a theory of finance that attempts
to maximize portfolio expected return for a given amount of
risk, or minimize the risk for a given level of expected return.
 Markowitz theory' advise investors to invest in multiple securities
rather than pulling all eggs in one basket.
Markowitz model – Portfolio
The portfolio return can be calculated with the help of the
following formula:
= return on the portfolio
= proportion of total portfolio investment in security 1
= expected return on security 1
Markowitz model – Portfolio risk
The portfolio risk can be calculated with the help of the following formula:
σ p = √ X1
2 σ1
2 + X2
2 σ2
2 + 2 X1 X2 ( r12 σ1 σ2)
σ p = Portfolio standard deviation
X1 = Percentage of total portfolio value in stock X1
X2 = Percentage of total portfolio value in stock X2
σ1 = Standard deviation of stock X1
σ2 = Standard deviation of stock X2
r12 = correlation co-efficient of X1 and X2
r12 = Covariance of X 12
σ1 σ2
Sharpe’s optimum portfolio construction
 William Sharpe, tried to simplify the process of data inputs and reaching a
solution, by developing a simplified variant of the Markowitz model.
 In the Sharpe’s model the desirability of any securities' inclusion in the
portfolio is directly related to its excess return-to-beta ratio. Then they
are ranked from highest to lowest order.
 The number of securities selected depends on a unique Cut- off rate such
that all securities with higher ratios will be included.
 Percentage of investment in each of the selected security is then decided
on the basis of respective weights assigned to each security.
Constructs of Sharpe’s single index model
β =
Correlation Coefficient
Between Market and Stock
×
Standard Deviation of Stock
Returns
Standard Deviation of Market
Returns
Cut- off Point
 = variance of the market index
 = variance of a stock’s movement that is not
associated with the movement of market index i.e.
stock’s unsystematic risk.
Cont…


Where, C* = The cut- off point
List of Securities for analysis
ACC CIPLA HINDUNILVR LUPIN SESAGOA
AMBUJACEM COALINDIA HDFC M&M SIEMENS
ASIANPAINT DLF ITC MARUTI SBIN
AXISBANK DRREDDY ICICIBANK NTPC SUNPHARMA
BAJAJ-AUTO GAIL IDFC ONGC TCS
BANKBARODA GRASIM INFY POWERGRID TATAMOTORS
BHEL HCLTECH JPASSOCIAT PNB TATAPOWER
BPCL HDFCBANK JINDALSTEL RANBAXY TATASTEEL
BHARTIARTL HEROMOTOCO KOTAKBANK RELIANCE ULTRACEMCO
CAIRN HINDALCO LT RELINFRA WIPRO
Calculation of Excess Return to Beta Ratio
Security β NEW RANK
HCLTECH 27.56 0.00 41.01 5877.55 1
BANKBARODA 24.90 0.02 42.03 1056.93 2
MARUTI 19.04 0.03 39.51 410.78 3
TCS 26.45 0.05 31.33 383.13 4
HDFCBANK 21.10 0.04 32.73 349.92 5
GRASIM 10.45 0.01 40.83 286.60 6
ITC 24.83 0.08 23.87 225.71 7
KOTAKBANK 19.10 0.06 55.49 210.20 8
PNB 14.50 0.04 41.67 196.22 9
HDFC 13.22 0.03 33.10 180.73 10
CIPLA 19.38 0.08 25.69 153.02 11
SESAGOA 18.17 0.10 52.31 107.64 12
ASIANPAINT 30.17 0.22 28.76 104.43 13
HINDALCO 11.01 0.10 53.33 36.29 14
SBIN 11.67 0.12 45.15 33.83 15
Securities to be Included in the Portfolio
Security
HCLTECH 0.04
BANKBARODA 0.17
MARUTI 0.35
TCS 1.17
HDFCBANK 1.60
GRASIM 1.61
ITC 3.58
KOTAKBANK 3.76
PNB 3.88
HDFC 4.01
CIPLA 5.16
SESAGOA 5.47
ASIANPAINT 9.99
Proportion of Funds to be invested in Each Security
Security
HCLTECH 7.93 % 0.011907668
BANKBARODA 6.49 % 0.009752967
MARUTI 4.80 % 0.007208399
TCS 12.51 % 0.018789105
HDFCBANK 8.20 % 0.012327808
GRASIM 1.13 % 0.00170528
ITC 19.32 % 0.029033426
KOTAKBANK 2.39 % 0.003584336
PNB 2.55 % 0.003824456
HDFC 3.28 % 0.004929159
CIPLA 11.18 % 0.016800711
SESAGOA 2.35 % 0.00353038
ASIANPAINT 16.46 % 0.024734334
HCLTECH
8%
BANKBARODA
7%
MARUTI
5%
TCS
13%
HDFCBANK
8%
GRASIM
1%
ITC
20%
KOTAKBANK
2%
PNB
3%
HDFC
3%
CIPLA
11%
SESAGOA
2%
ASIANPAINT
17%
Optimal Portfolio using SIM
Capital Asset Pricing Model (CAPM)
CAPM is used to determine a theoretically appropriate required rate of
return of an asset, if that asset is to be added to an already well-
diversified portfolio, given that asset's non-diversifiable risk.
Let us say that stock A has a beta (Bi = .5%), the risk free rate of return (Rf = 4%)
and the expected rate of return for the market (Rm = 10%).
Calculate the expected rate of return for the asset?
Assumptions of CAPM
All investors:
 Aim to maximize economic utilities and are rational and risk-averse.
 Are broadly diversified across a range of investments.
 Are price takers, i.e., they cannot influence prices.
 Can lend and borrow unlimited amounts under the risk free rate of interest.
 Trade without transaction or taxation costs.
 Deal with securities that are all highly divisible into small parcels.
 Assume all information is available at the same time to all investors.
 Further, the model assumes that standard deviation of past returns is a perfect
proxy for the future risk associated with a given security

Markowitz - sharpes and CAPM

  • 1.
    SYNOPSIS  Efficient MarketTheory  Portfolio Analysis – Markowitz theory  Sharpe’s optimum portfolio construction  Capital Asset Pricing Model (CAPM)
  • 2.
    Efficient Market Theory Efficient Market theory states that the share price fluctuations are random and do not follow any regular pattern. Features of Efficient Market  All instruments are correctly priced as all available information is perfectly understood and absorbed by all the investors.  No excess profits are possible.  In a perfectly efficient market, analysts immediately compete away any chance of earning abnormal profits.  The forces of demand and supply move freely and in an independent and random manner.
  • 3.
    The three formsof market efficiency Weak form: Market pricing information includes only past prices Semi-strong form: includes public information Strong form: includes public and private information
  • 4.
    Portfolio Analysis  Portfoliois a combination of securities such as stocks, bonds, etc.  The process of blending together these securities so as to obtain optimum return with minimum risk is called portfolio construction.  A rational investor always attempts to minimize risk and maximize return on his investment.  Investing in more than one security is a strategy to attain this goal.
  • 5.
    Markowitz Theory  Markowitzis considered the father of modern portfolio theory, mainly because he is the first person who gave a mathematical model for portfolio optimization and diversification.  Modern portfolio theory (MPT) is a theory of finance that attempts to maximize portfolio expected return for a given amount of risk, or minimize the risk for a given level of expected return.  Markowitz theory' advise investors to invest in multiple securities rather than pulling all eggs in one basket.
  • 6.
    Markowitz model –Portfolio The portfolio return can be calculated with the help of the following formula: = return on the portfolio = proportion of total portfolio investment in security 1 = expected return on security 1
  • 7.
    Markowitz model –Portfolio risk The portfolio risk can be calculated with the help of the following formula: σ p = √ X1 2 σ1 2 + X2 2 σ2 2 + 2 X1 X2 ( r12 σ1 σ2) σ p = Portfolio standard deviation X1 = Percentage of total portfolio value in stock X1 X2 = Percentage of total portfolio value in stock X2 σ1 = Standard deviation of stock X1 σ2 = Standard deviation of stock X2 r12 = correlation co-efficient of X1 and X2 r12 = Covariance of X 12 σ1 σ2
  • 8.
    Sharpe’s optimum portfolioconstruction  William Sharpe, tried to simplify the process of data inputs and reaching a solution, by developing a simplified variant of the Markowitz model.  In the Sharpe’s model the desirability of any securities' inclusion in the portfolio is directly related to its excess return-to-beta ratio. Then they are ranked from highest to lowest order.  The number of securities selected depends on a unique Cut- off rate such that all securities with higher ratios will be included.  Percentage of investment in each of the selected security is then decided on the basis of respective weights assigned to each security.
  • 9.
    Constructs of Sharpe’ssingle index model β = Correlation Coefficient Between Market and Stock × Standard Deviation of Stock Returns Standard Deviation of Market Returns
  • 10.
    Cut- off Point = variance of the market index  = variance of a stock’s movement that is not associated with the movement of market index i.e. stock’s unsystematic risk.
  • 11.
    Cont…   Where, C* =The cut- off point
  • 12.
    List of Securitiesfor analysis ACC CIPLA HINDUNILVR LUPIN SESAGOA AMBUJACEM COALINDIA HDFC M&M SIEMENS ASIANPAINT DLF ITC MARUTI SBIN AXISBANK DRREDDY ICICIBANK NTPC SUNPHARMA BAJAJ-AUTO GAIL IDFC ONGC TCS BANKBARODA GRASIM INFY POWERGRID TATAMOTORS BHEL HCLTECH JPASSOCIAT PNB TATAPOWER BPCL HDFCBANK JINDALSTEL RANBAXY TATASTEEL BHARTIARTL HEROMOTOCO KOTAKBANK RELIANCE ULTRACEMCO CAIRN HINDALCO LT RELINFRA WIPRO
  • 13.
    Calculation of ExcessReturn to Beta Ratio Security β NEW RANK HCLTECH 27.56 0.00 41.01 5877.55 1 BANKBARODA 24.90 0.02 42.03 1056.93 2 MARUTI 19.04 0.03 39.51 410.78 3 TCS 26.45 0.05 31.33 383.13 4 HDFCBANK 21.10 0.04 32.73 349.92 5 GRASIM 10.45 0.01 40.83 286.60 6 ITC 24.83 0.08 23.87 225.71 7 KOTAKBANK 19.10 0.06 55.49 210.20 8 PNB 14.50 0.04 41.67 196.22 9 HDFC 13.22 0.03 33.10 180.73 10 CIPLA 19.38 0.08 25.69 153.02 11 SESAGOA 18.17 0.10 52.31 107.64 12 ASIANPAINT 30.17 0.22 28.76 104.43 13 HINDALCO 11.01 0.10 53.33 36.29 14 SBIN 11.67 0.12 45.15 33.83 15
  • 14.
    Securities to beIncluded in the Portfolio Security HCLTECH 0.04 BANKBARODA 0.17 MARUTI 0.35 TCS 1.17 HDFCBANK 1.60 GRASIM 1.61 ITC 3.58 KOTAKBANK 3.76 PNB 3.88 HDFC 4.01 CIPLA 5.16 SESAGOA 5.47 ASIANPAINT 9.99
  • 15.
    Proportion of Fundsto be invested in Each Security Security HCLTECH 7.93 % 0.011907668 BANKBARODA 6.49 % 0.009752967 MARUTI 4.80 % 0.007208399 TCS 12.51 % 0.018789105 HDFCBANK 8.20 % 0.012327808 GRASIM 1.13 % 0.00170528 ITC 19.32 % 0.029033426 KOTAKBANK 2.39 % 0.003584336 PNB 2.55 % 0.003824456 HDFC 3.28 % 0.004929159 CIPLA 11.18 % 0.016800711 SESAGOA 2.35 % 0.00353038 ASIANPAINT 16.46 % 0.024734334
  • 16.
  • 17.
    Capital Asset PricingModel (CAPM) CAPM is used to determine a theoretically appropriate required rate of return of an asset, if that asset is to be added to an already well- diversified portfolio, given that asset's non-diversifiable risk.
  • 18.
    Let us saythat stock A has a beta (Bi = .5%), the risk free rate of return (Rf = 4%) and the expected rate of return for the market (Rm = 10%). Calculate the expected rate of return for the asset?
  • 19.
    Assumptions of CAPM Allinvestors:  Aim to maximize economic utilities and are rational and risk-averse.  Are broadly diversified across a range of investments.  Are price takers, i.e., they cannot influence prices.  Can lend and borrow unlimited amounts under the risk free rate of interest.  Trade without transaction or taxation costs.  Deal with securities that are all highly divisible into small parcels.  Assume all information is available at the same time to all investors.  Further, the model assumes that standard deviation of past returns is a perfect proxy for the future risk associated with a given security