1. The document discusses various types of security market indexes, including stock market indexes and bond market indexes.
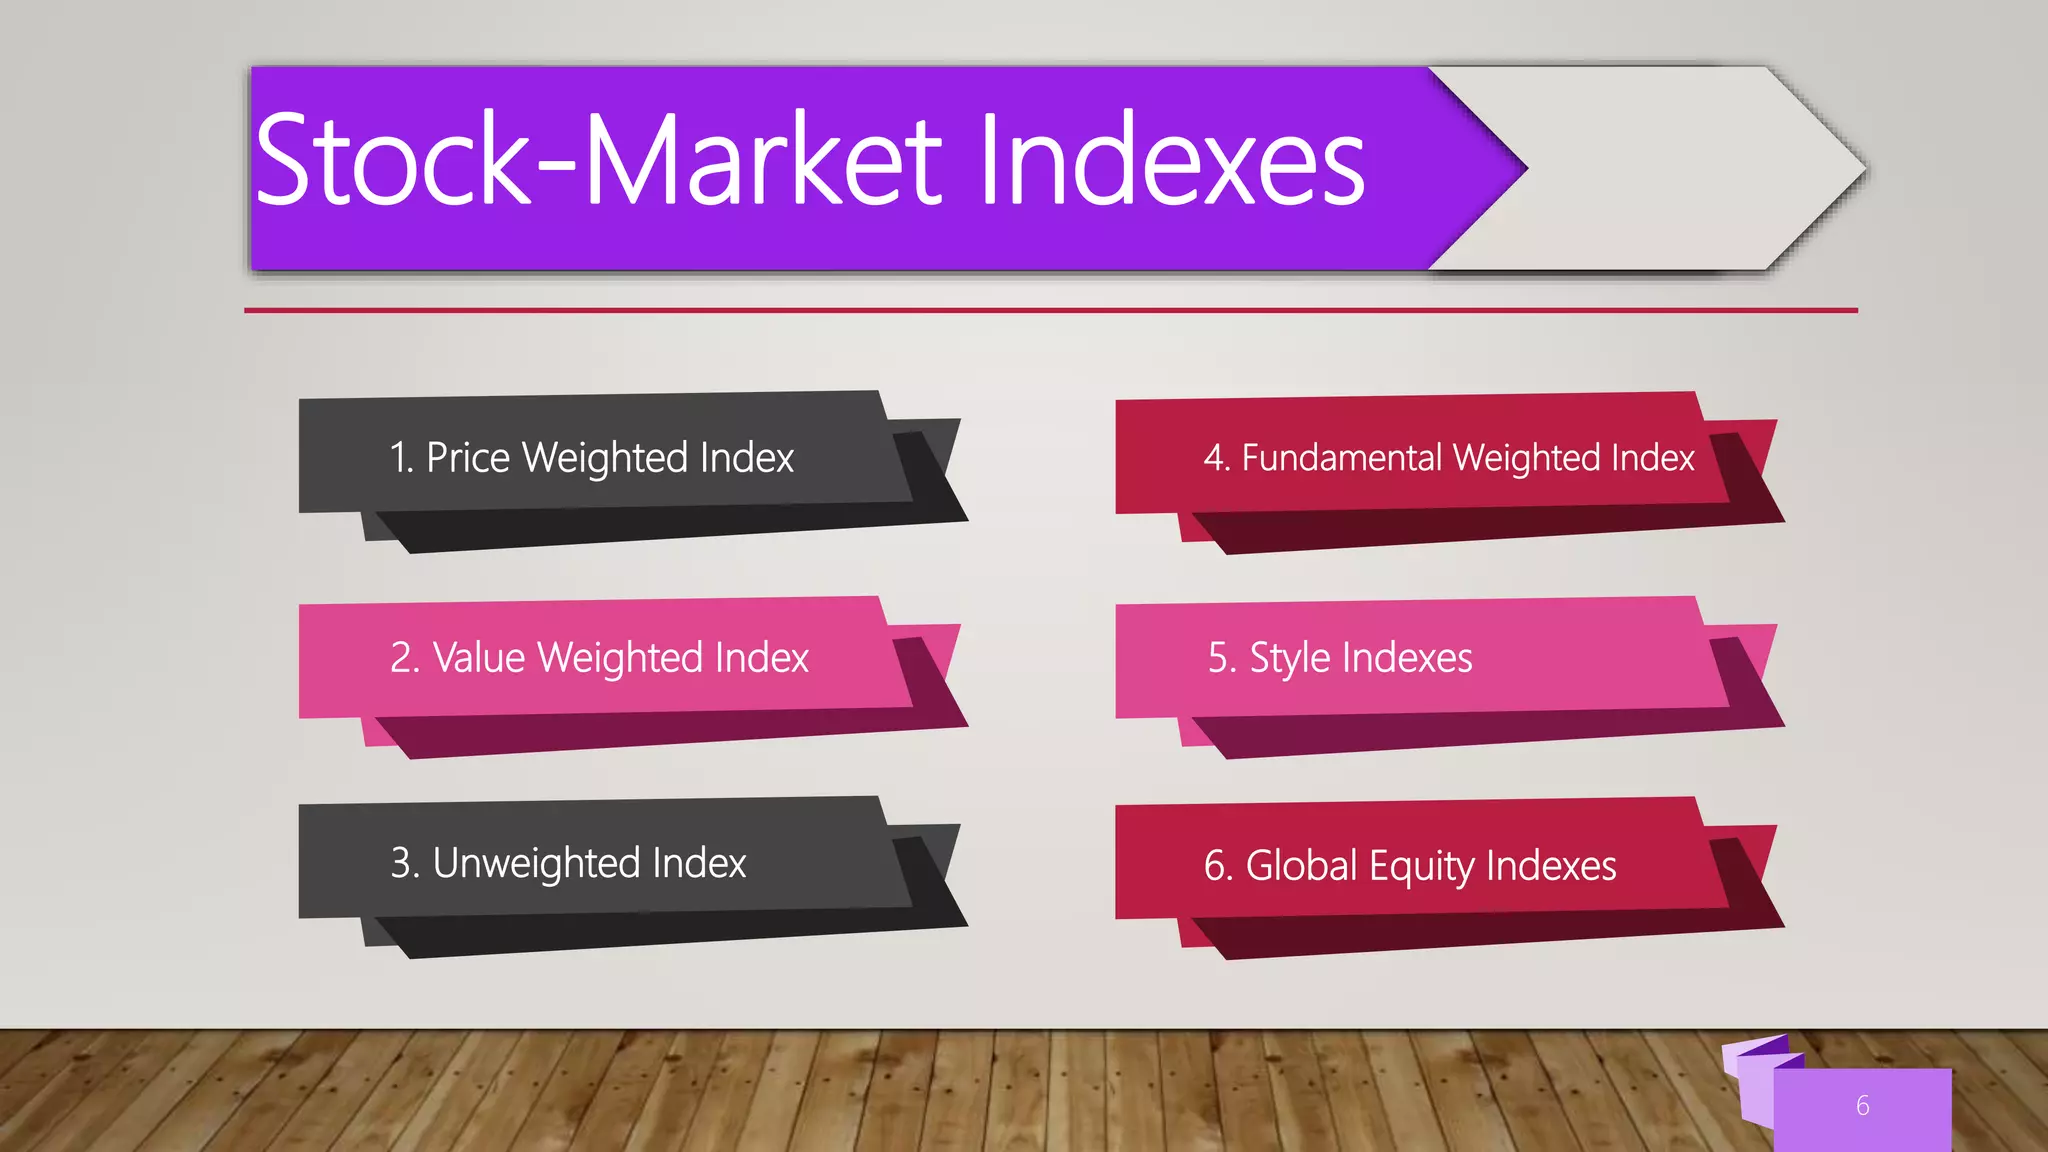
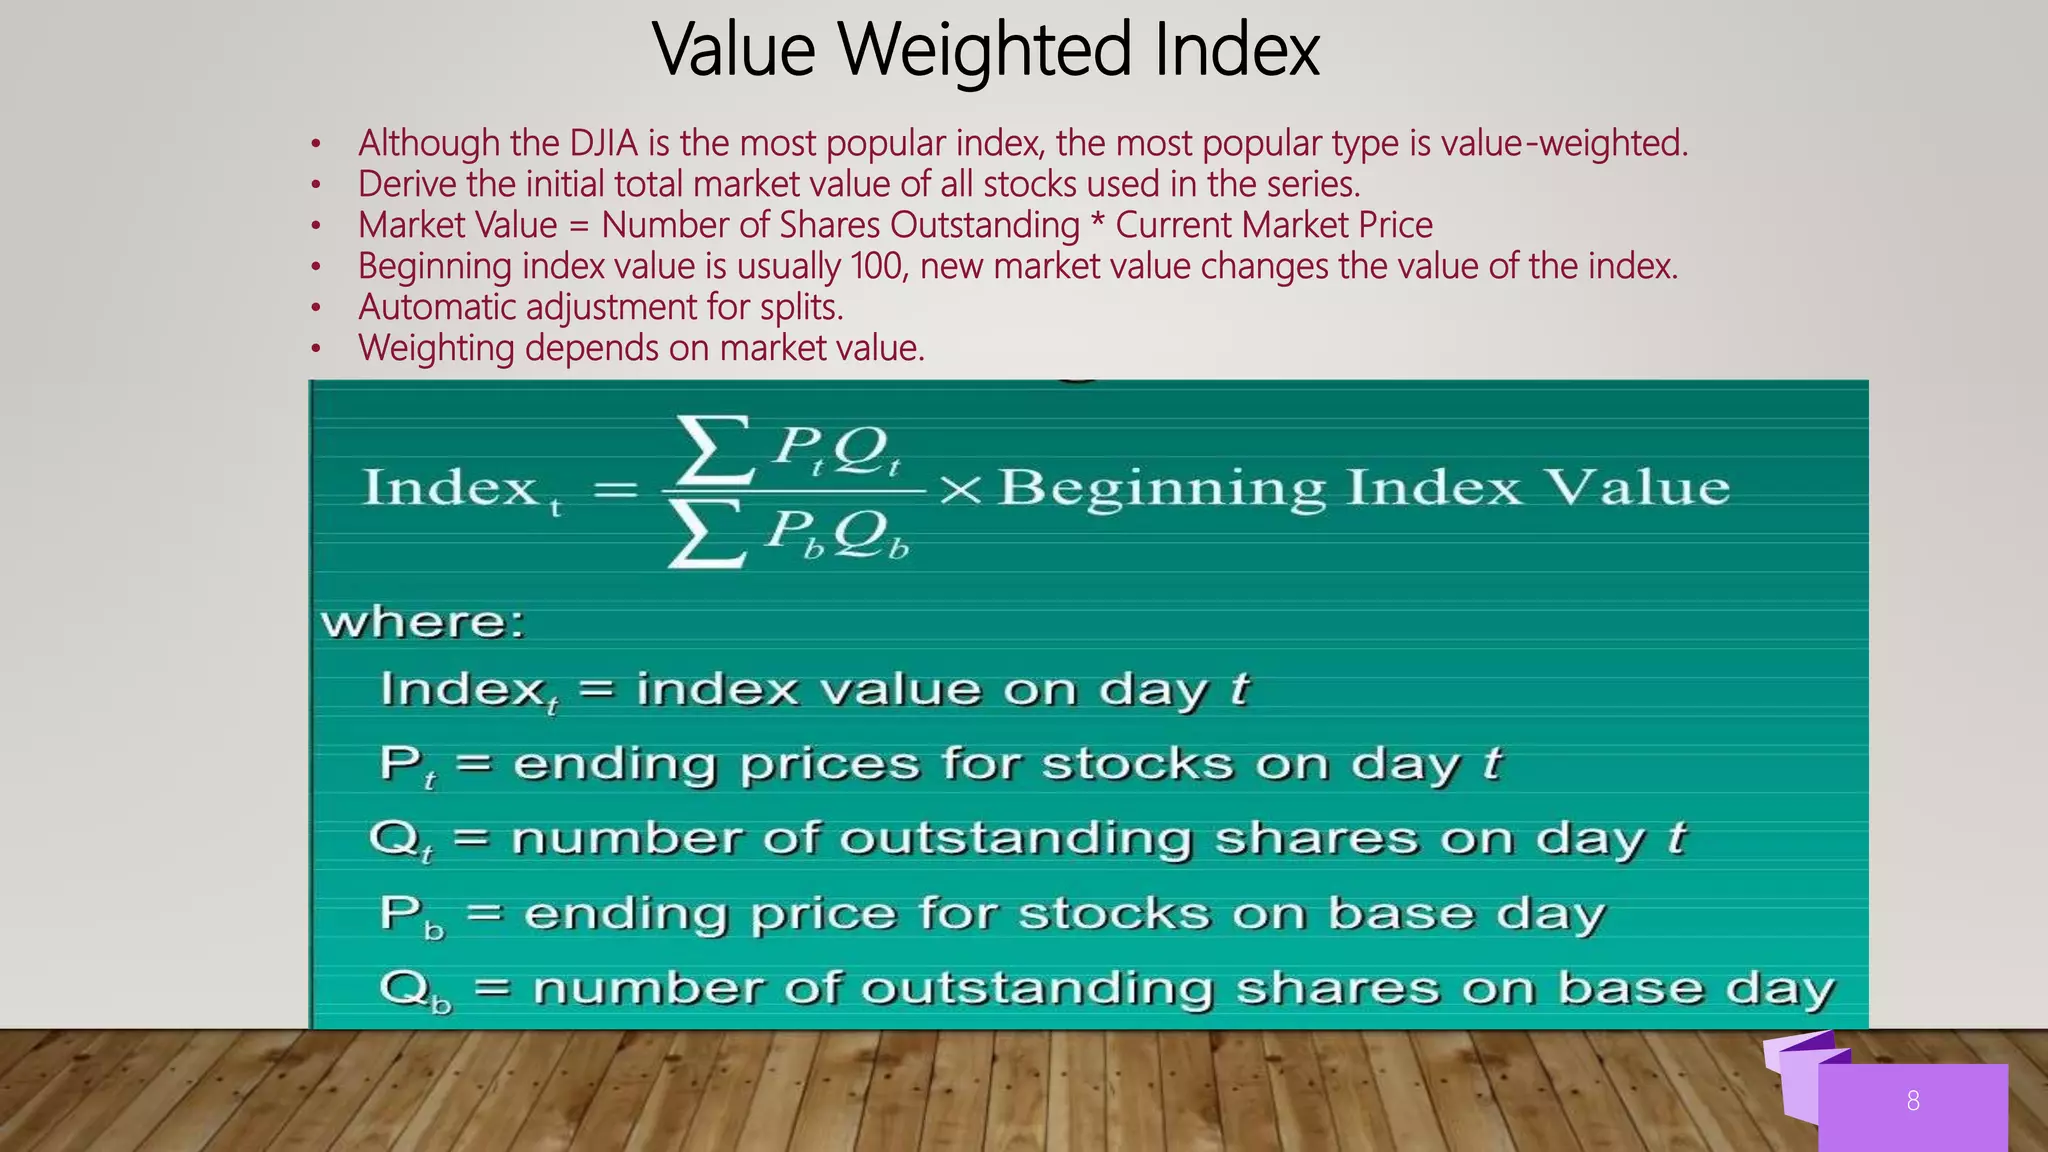
2. Stock market indexes track sections of the stock market and include price weighted indexes like the Dow Jones Industrial Average, value weighted indexes, and global indexes.
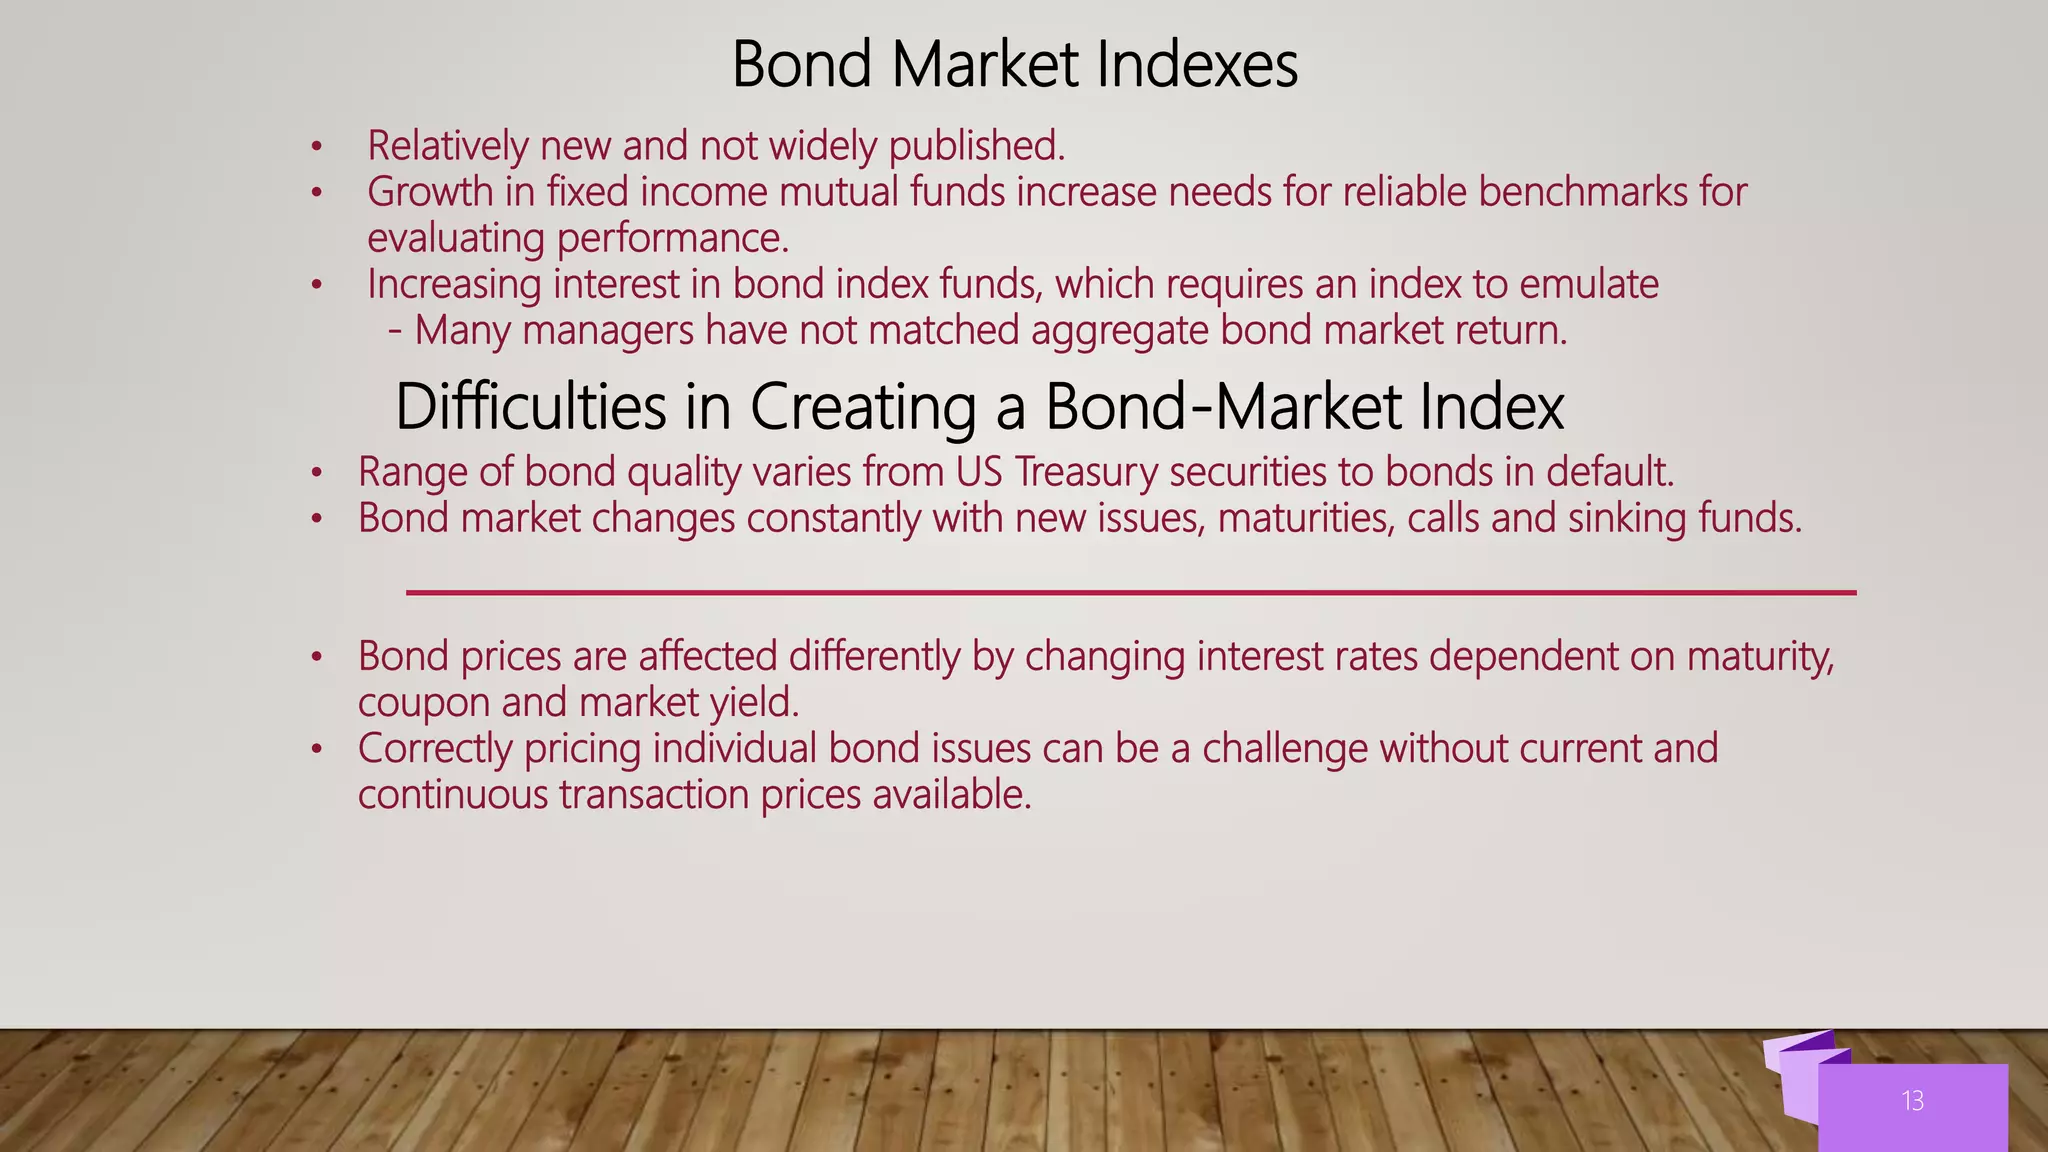
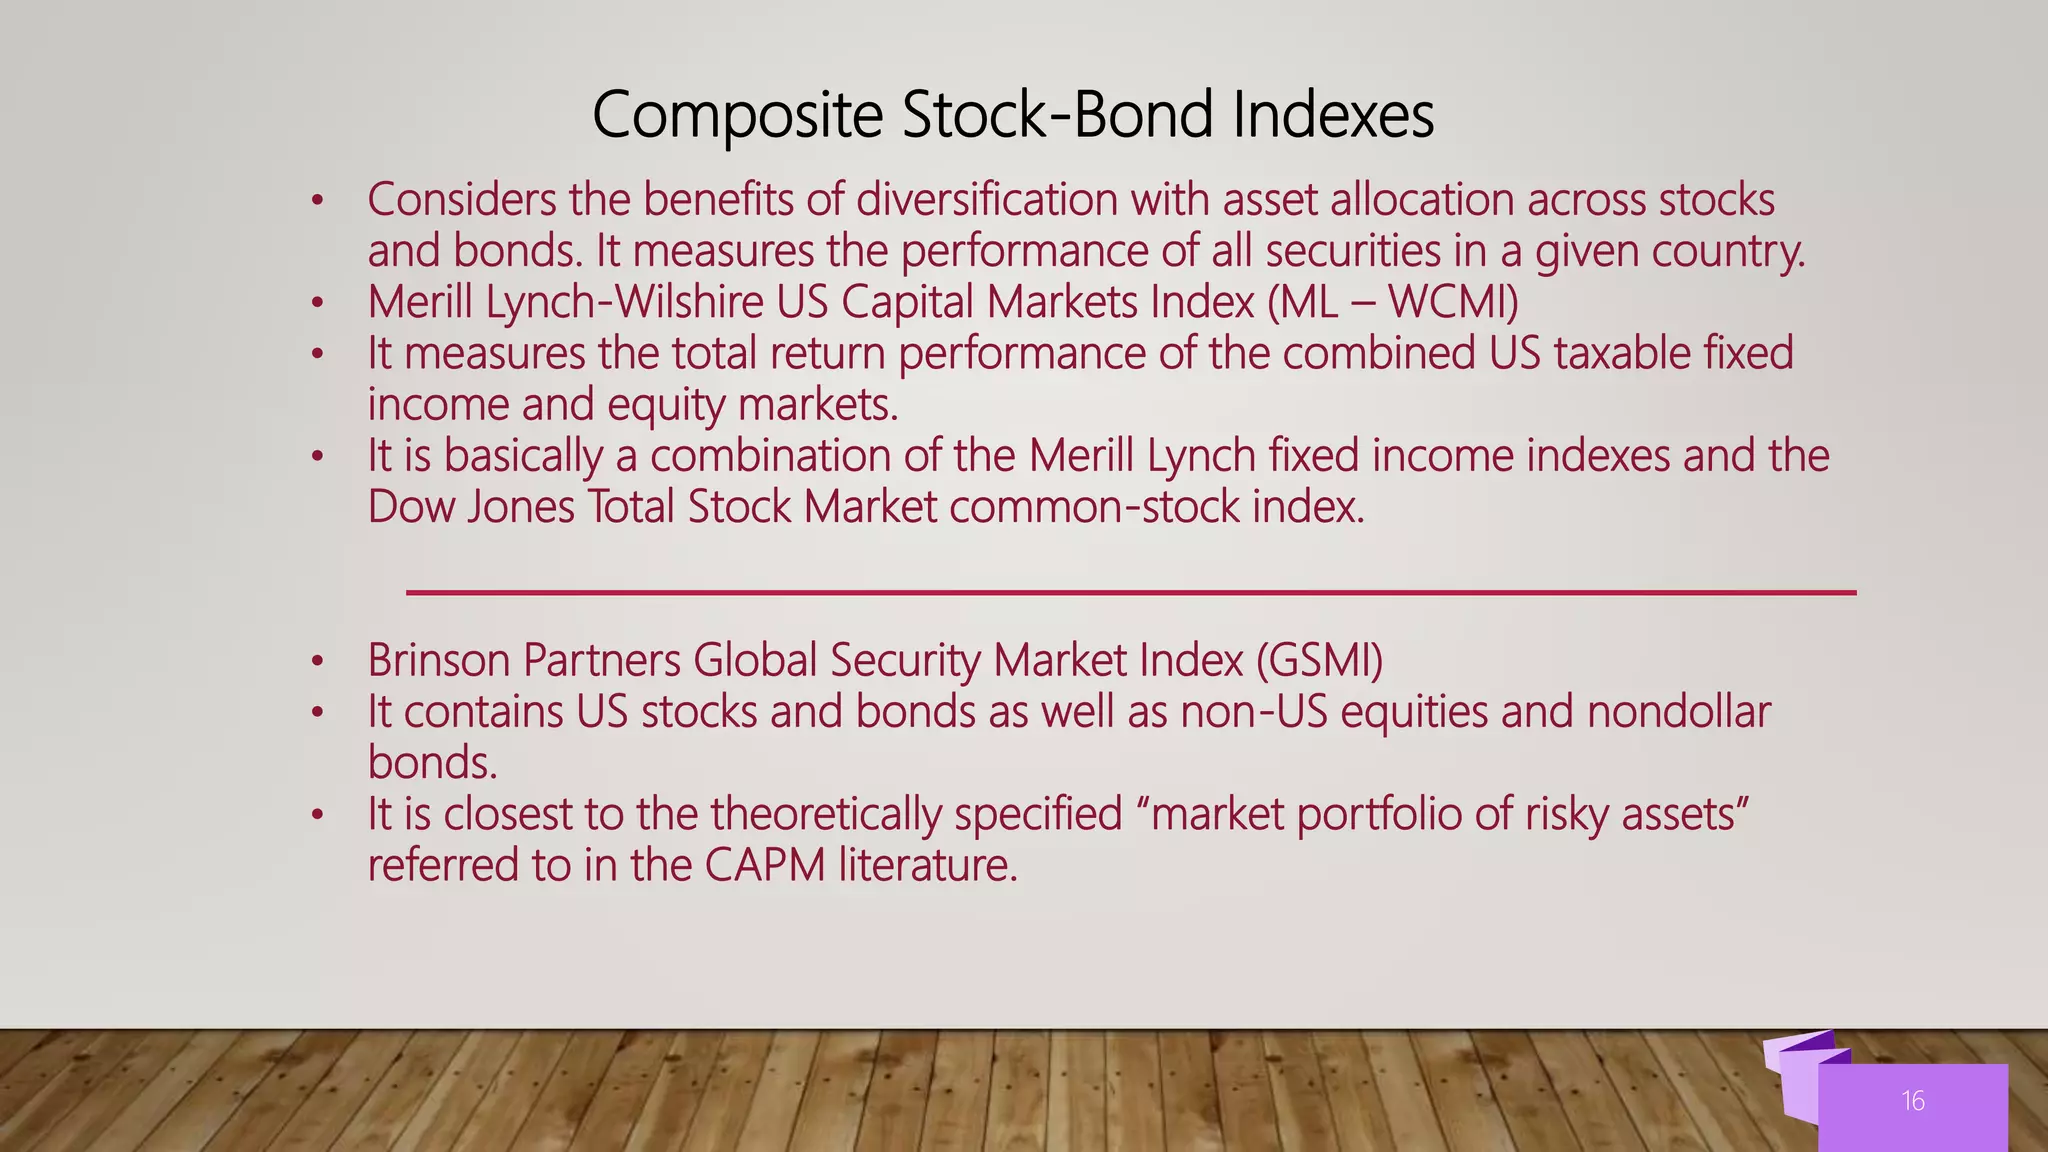
3. Bond market indexes measure the performance of bond markets but are more difficult to construct due to the range of bond qualities. Composite indexes combine stock and bond indexes to measure overall market performance.