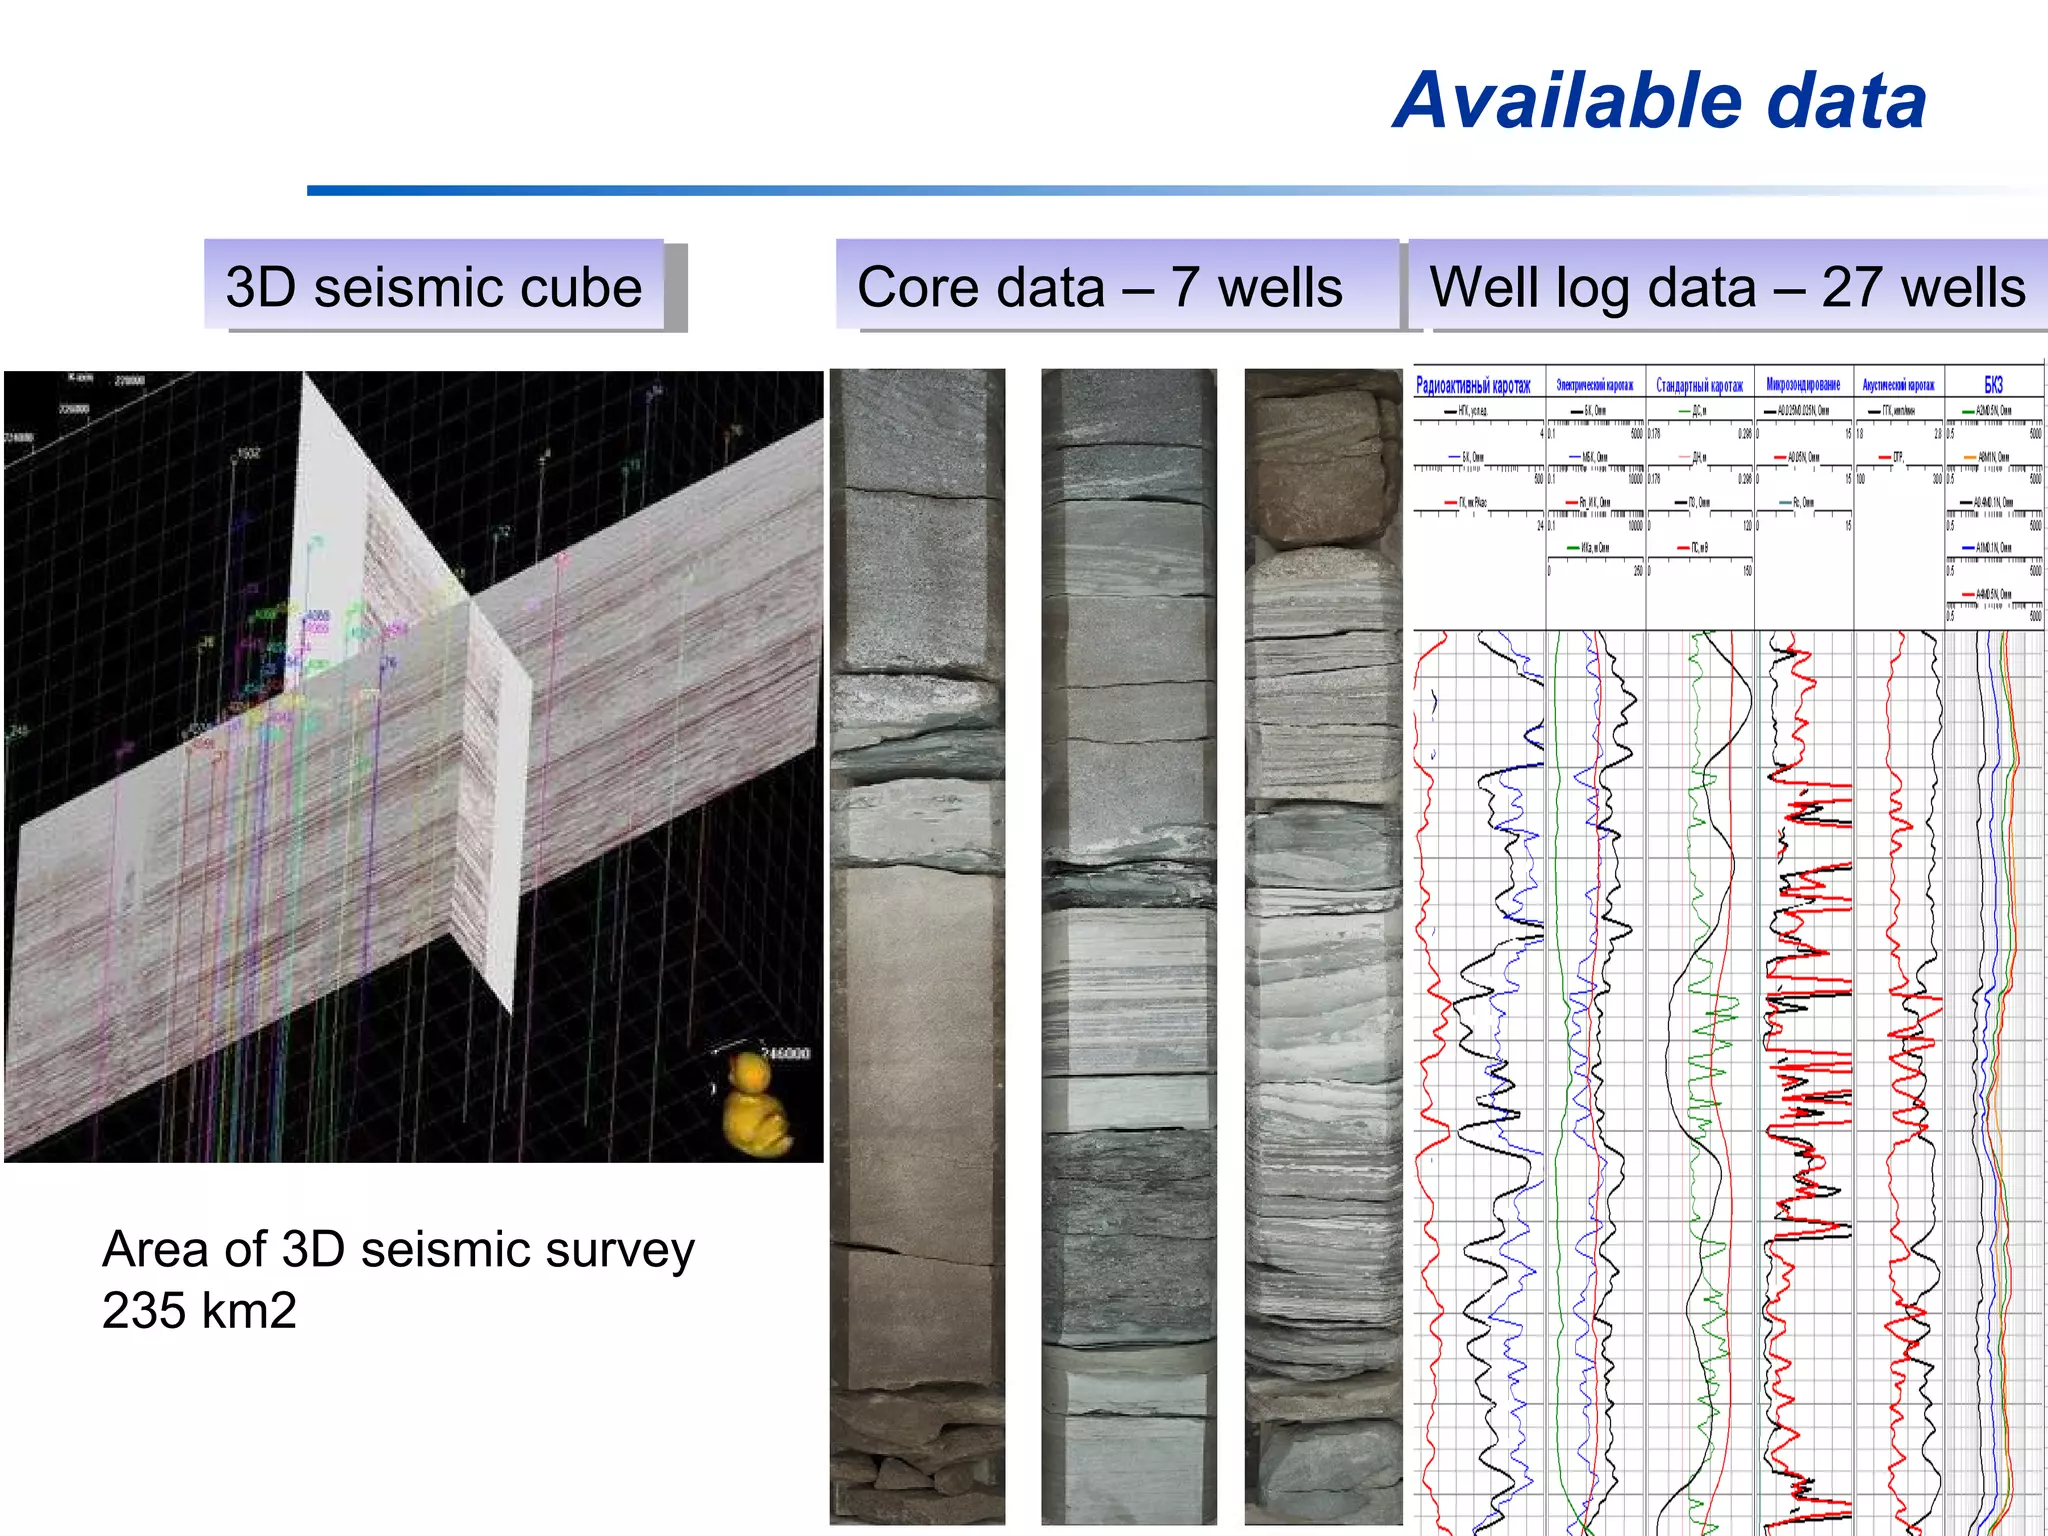
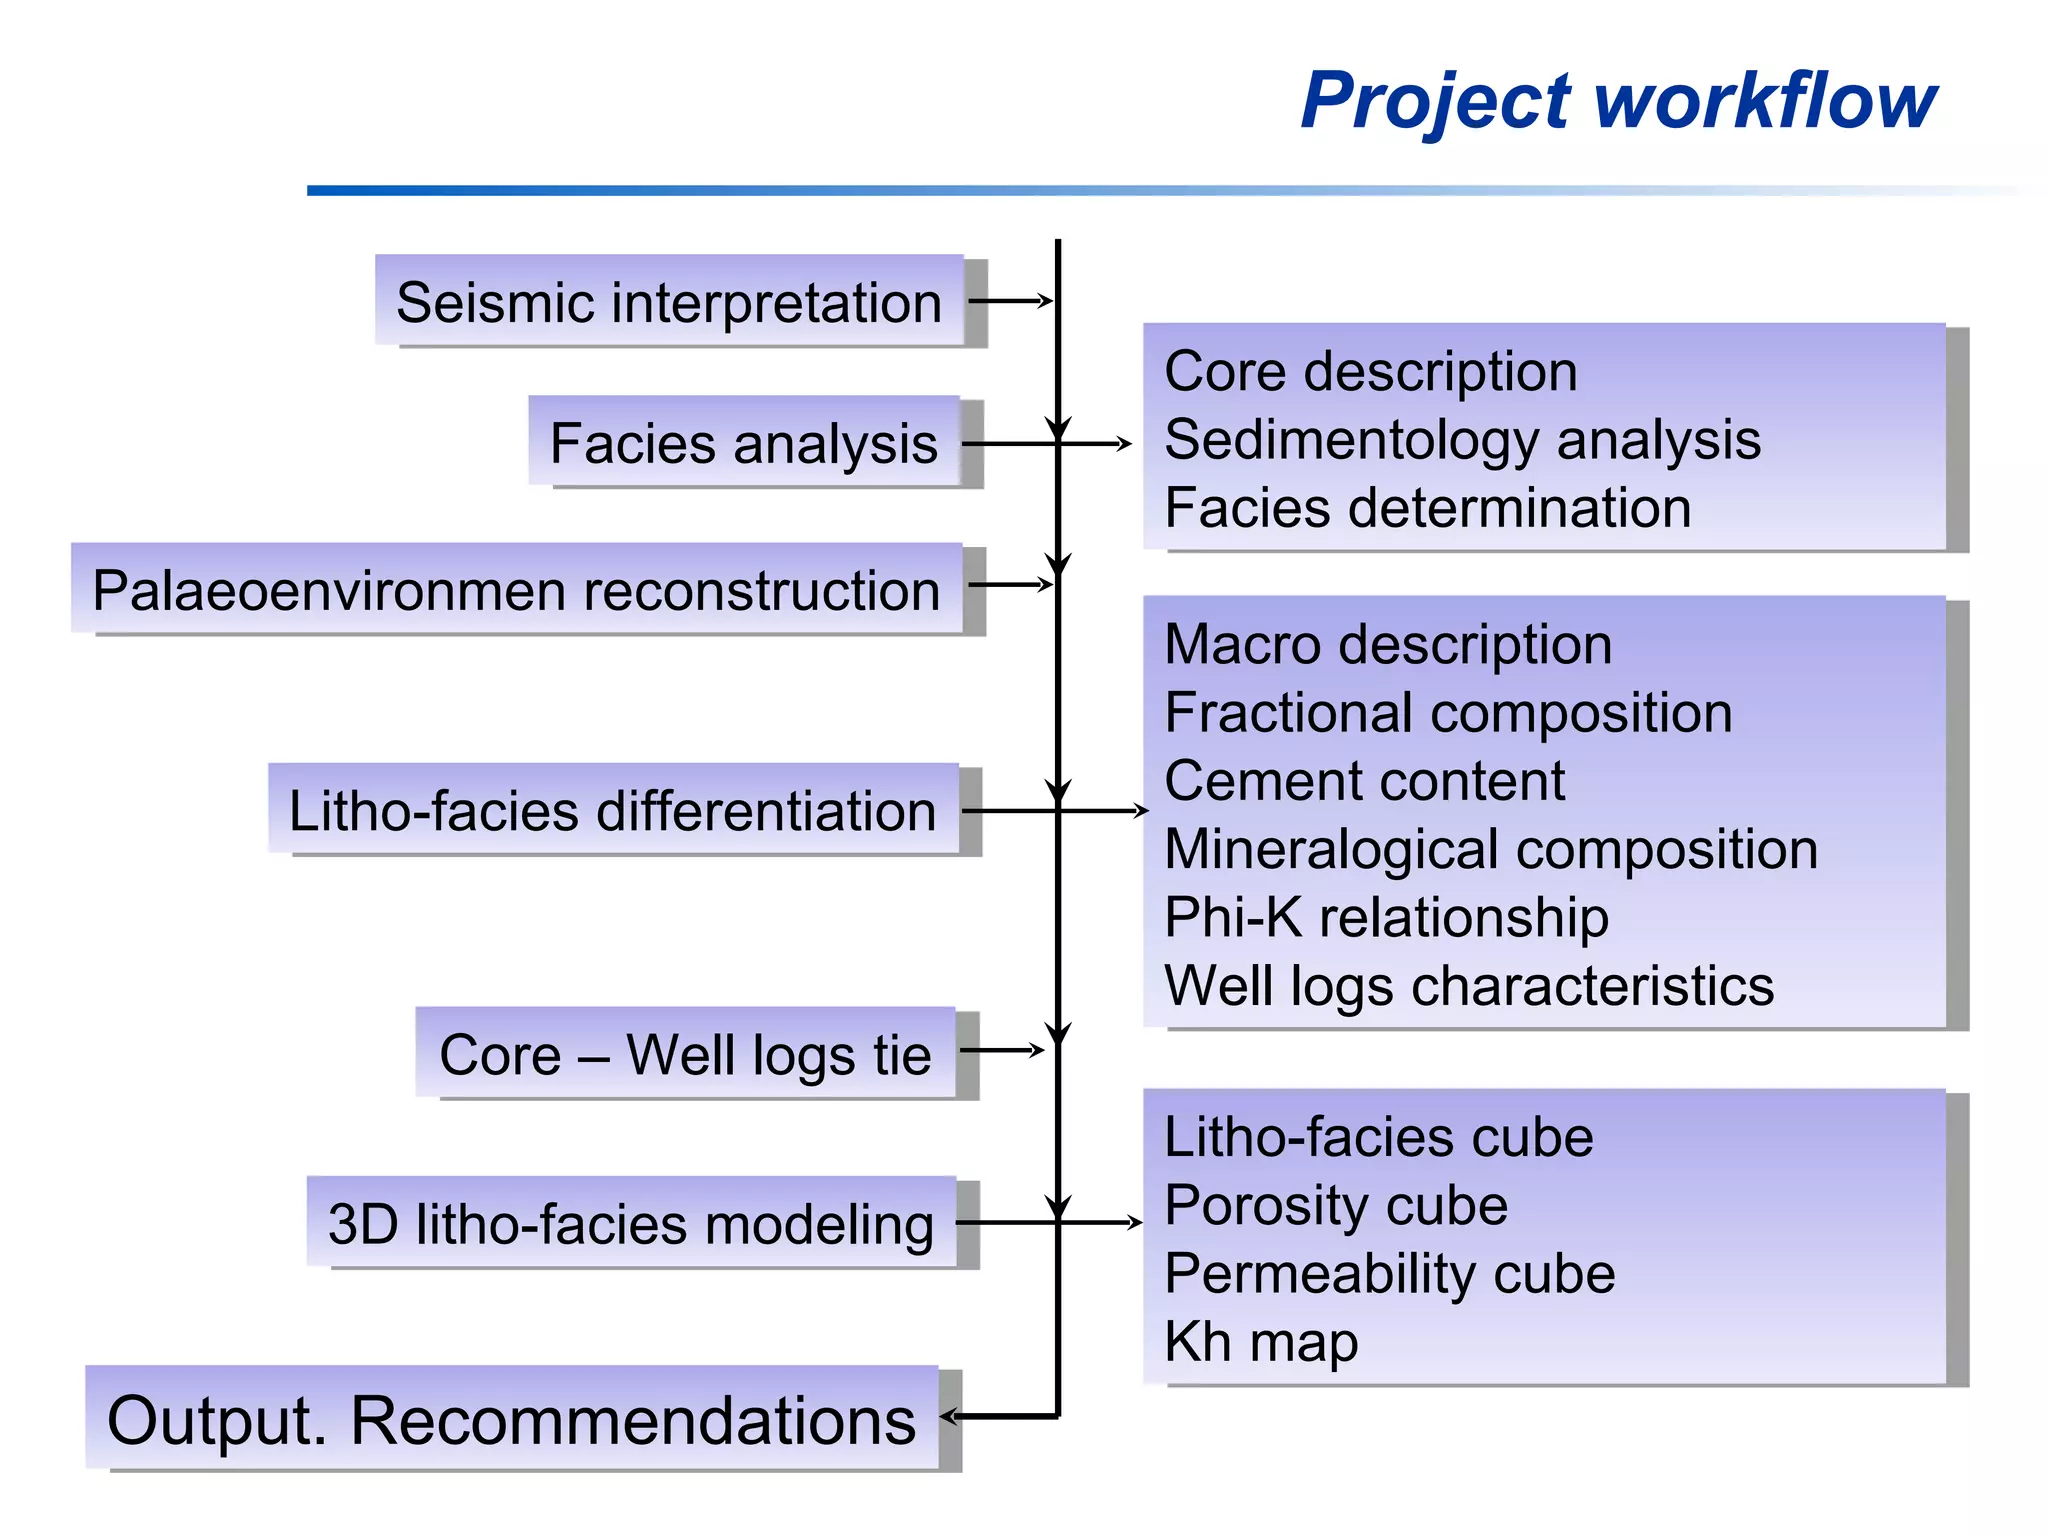
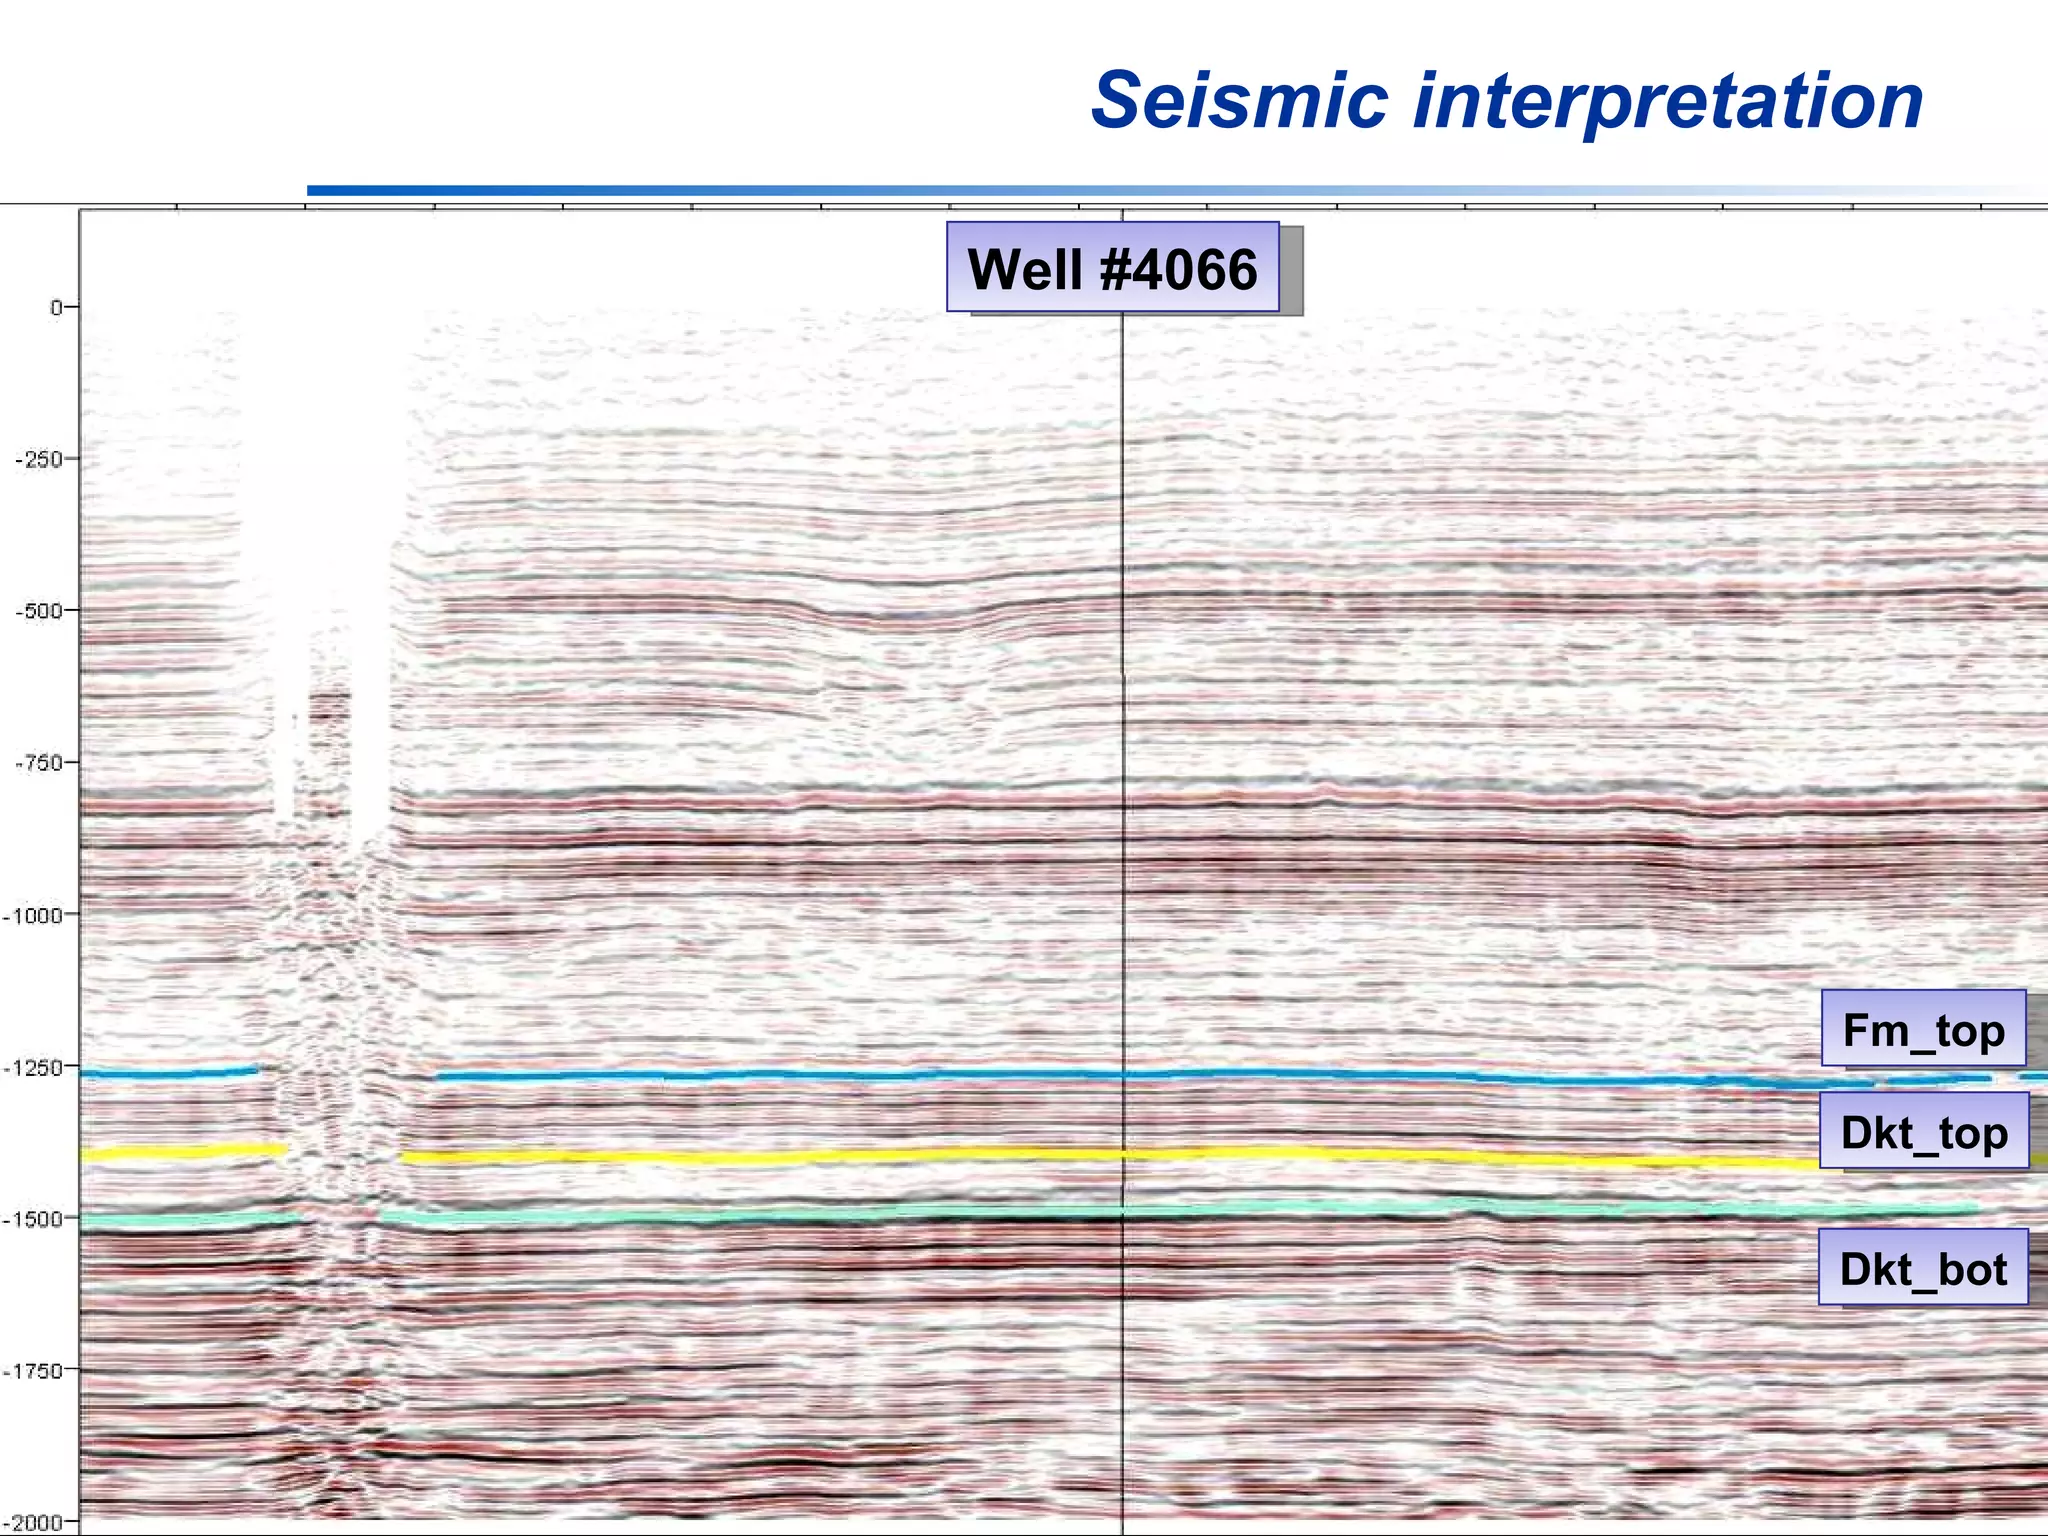
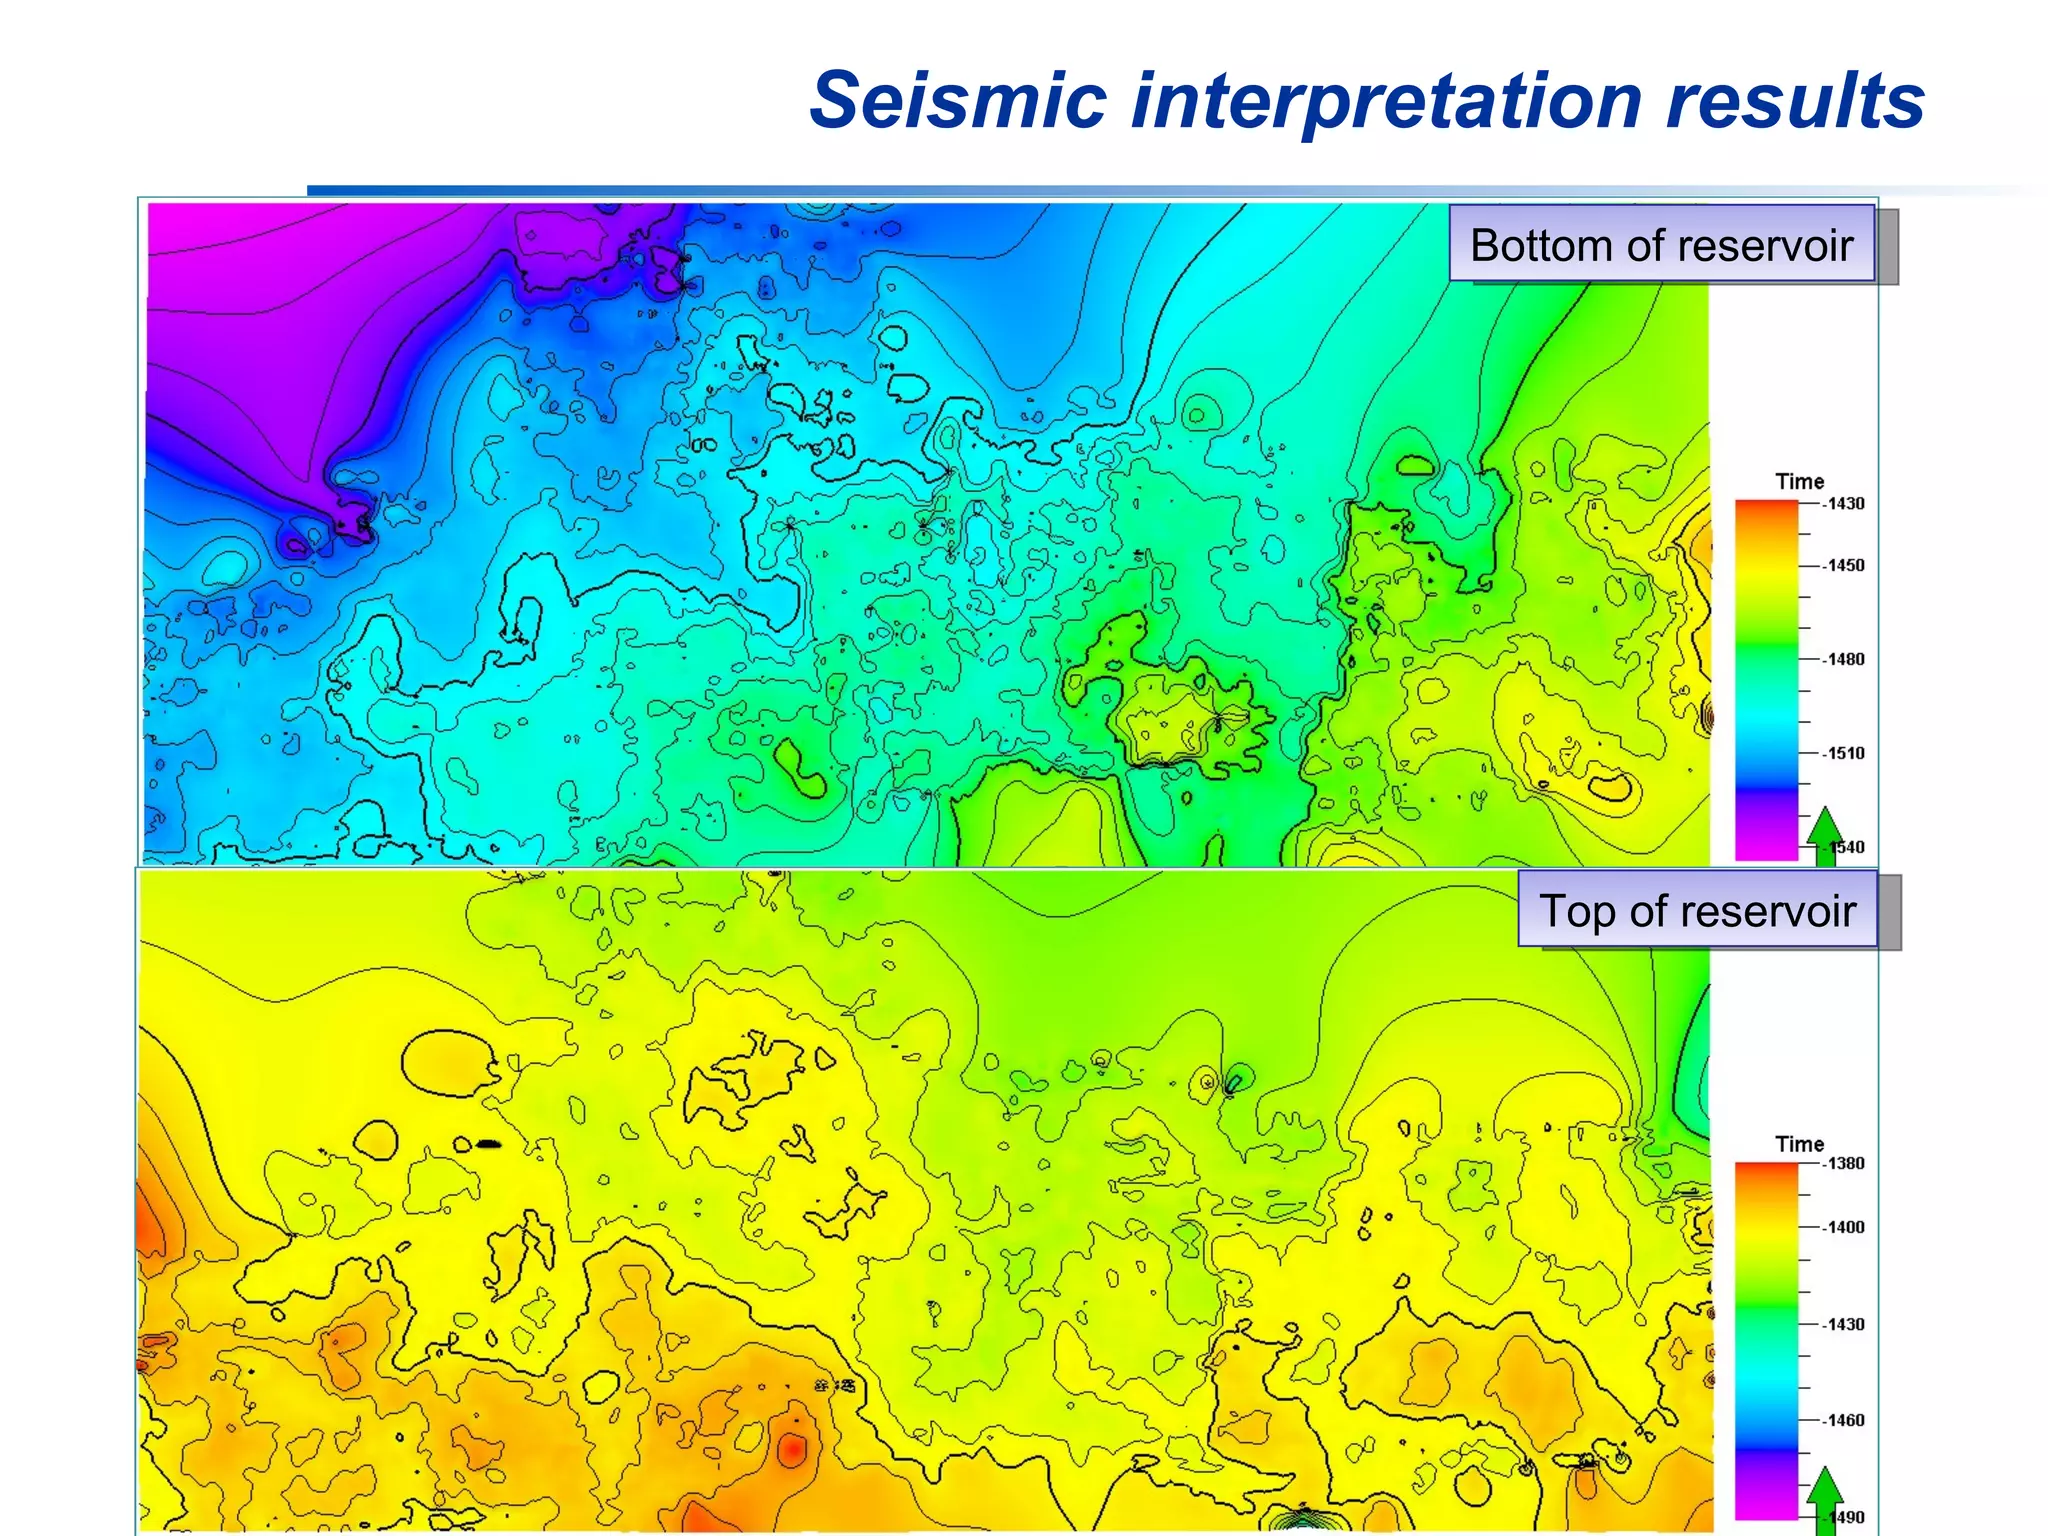
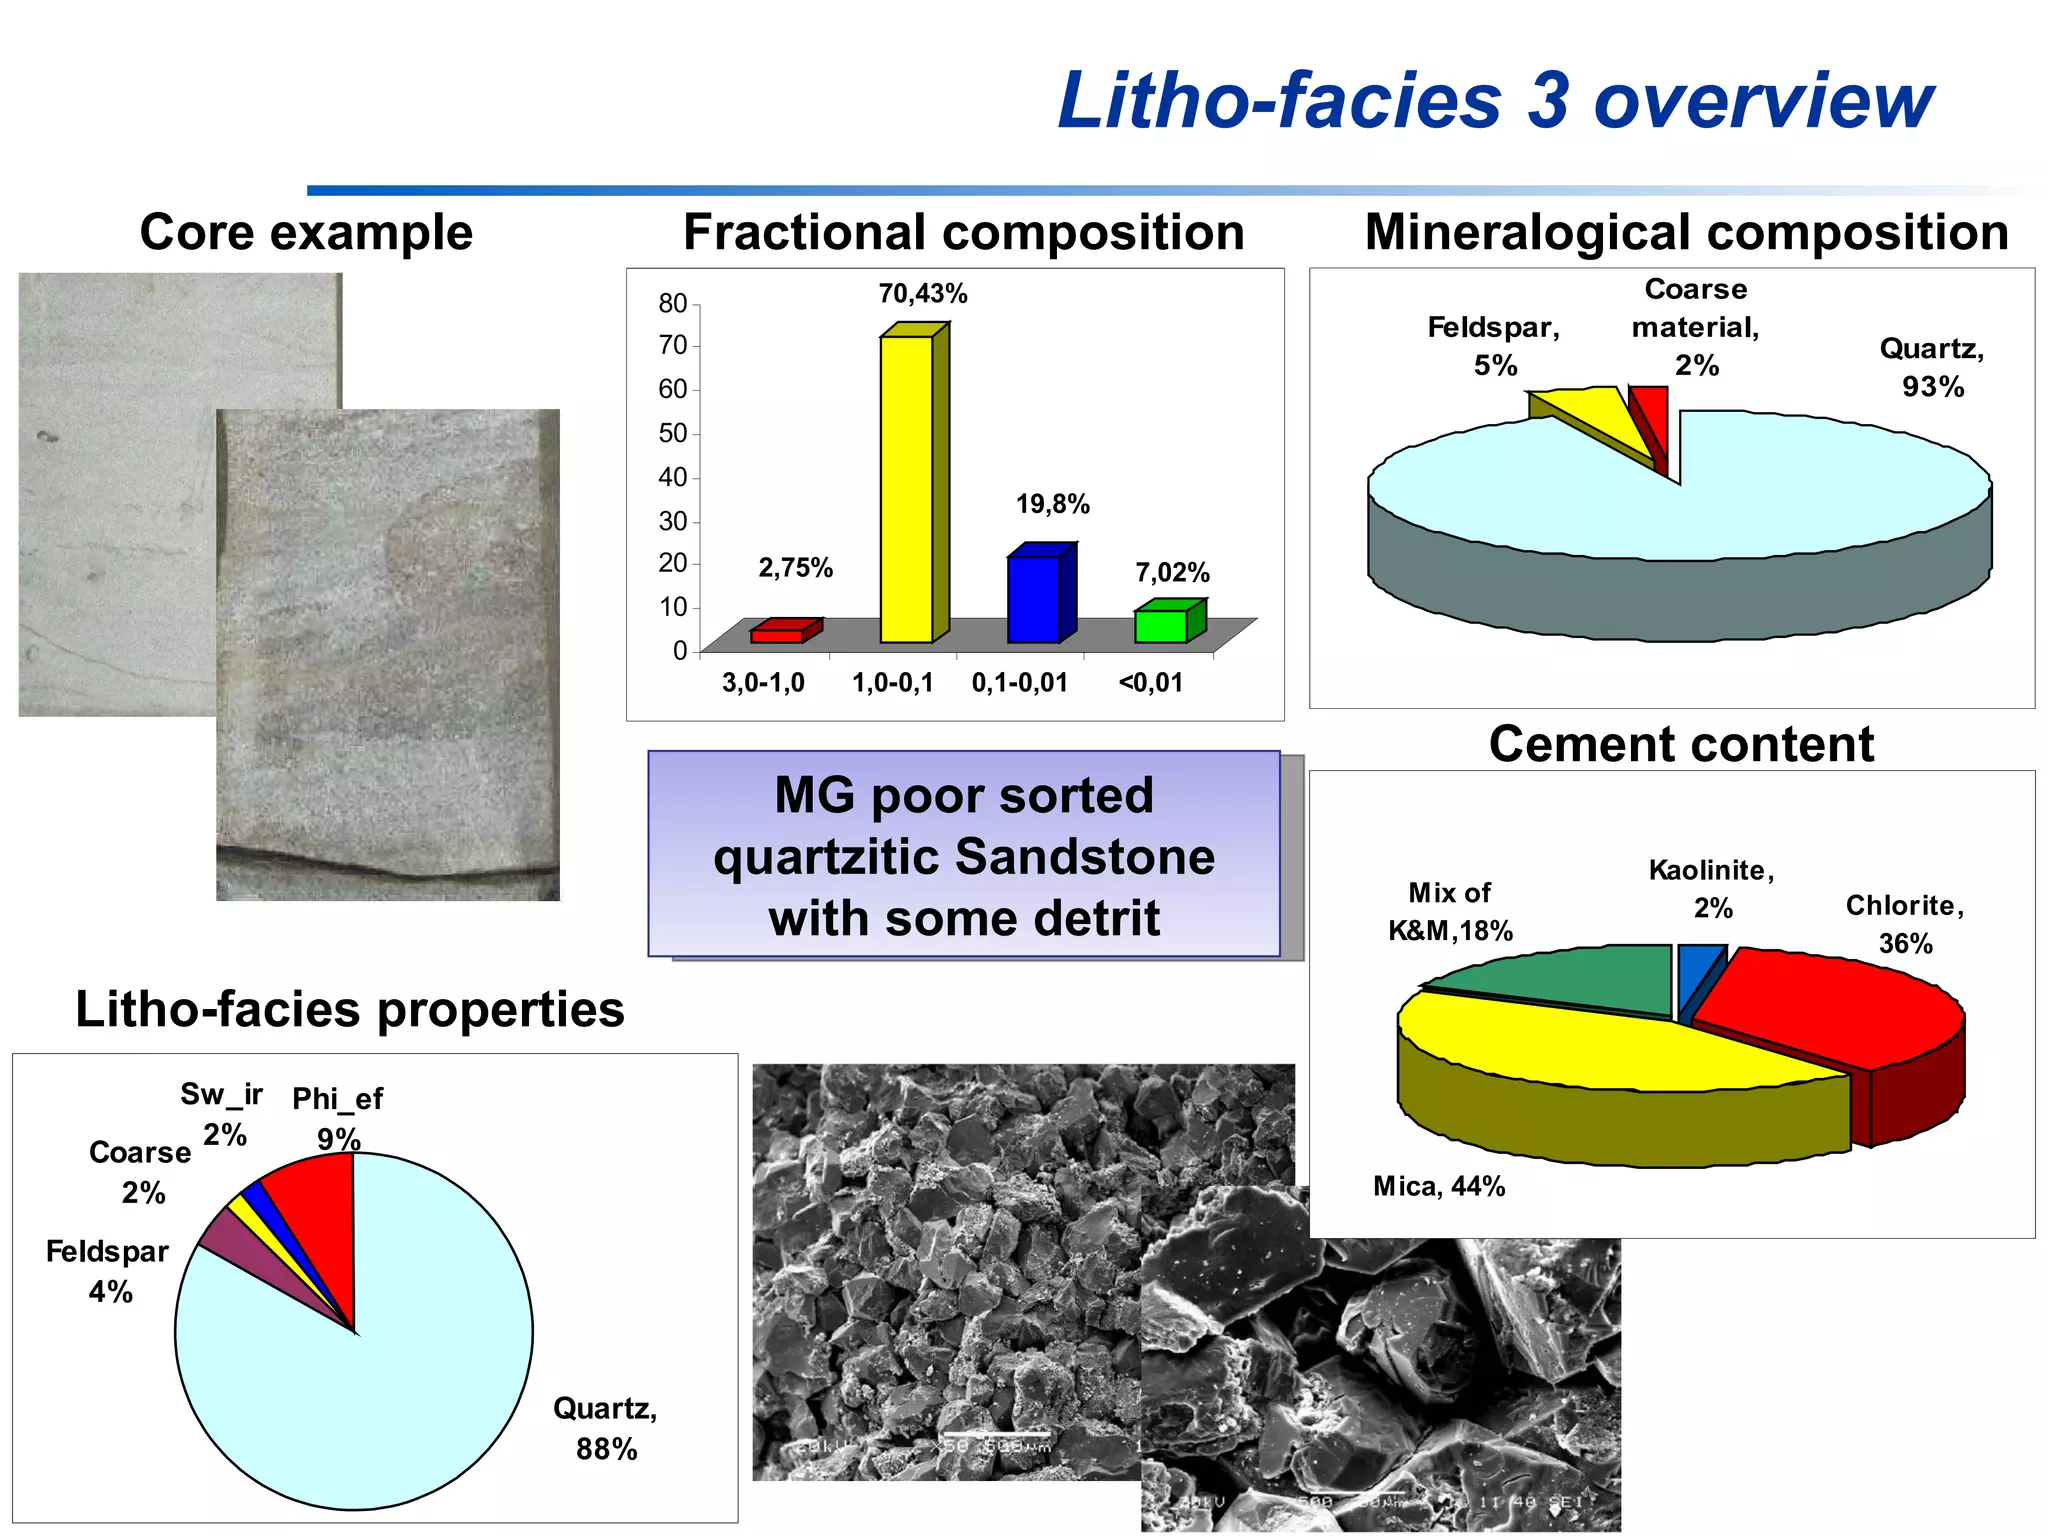
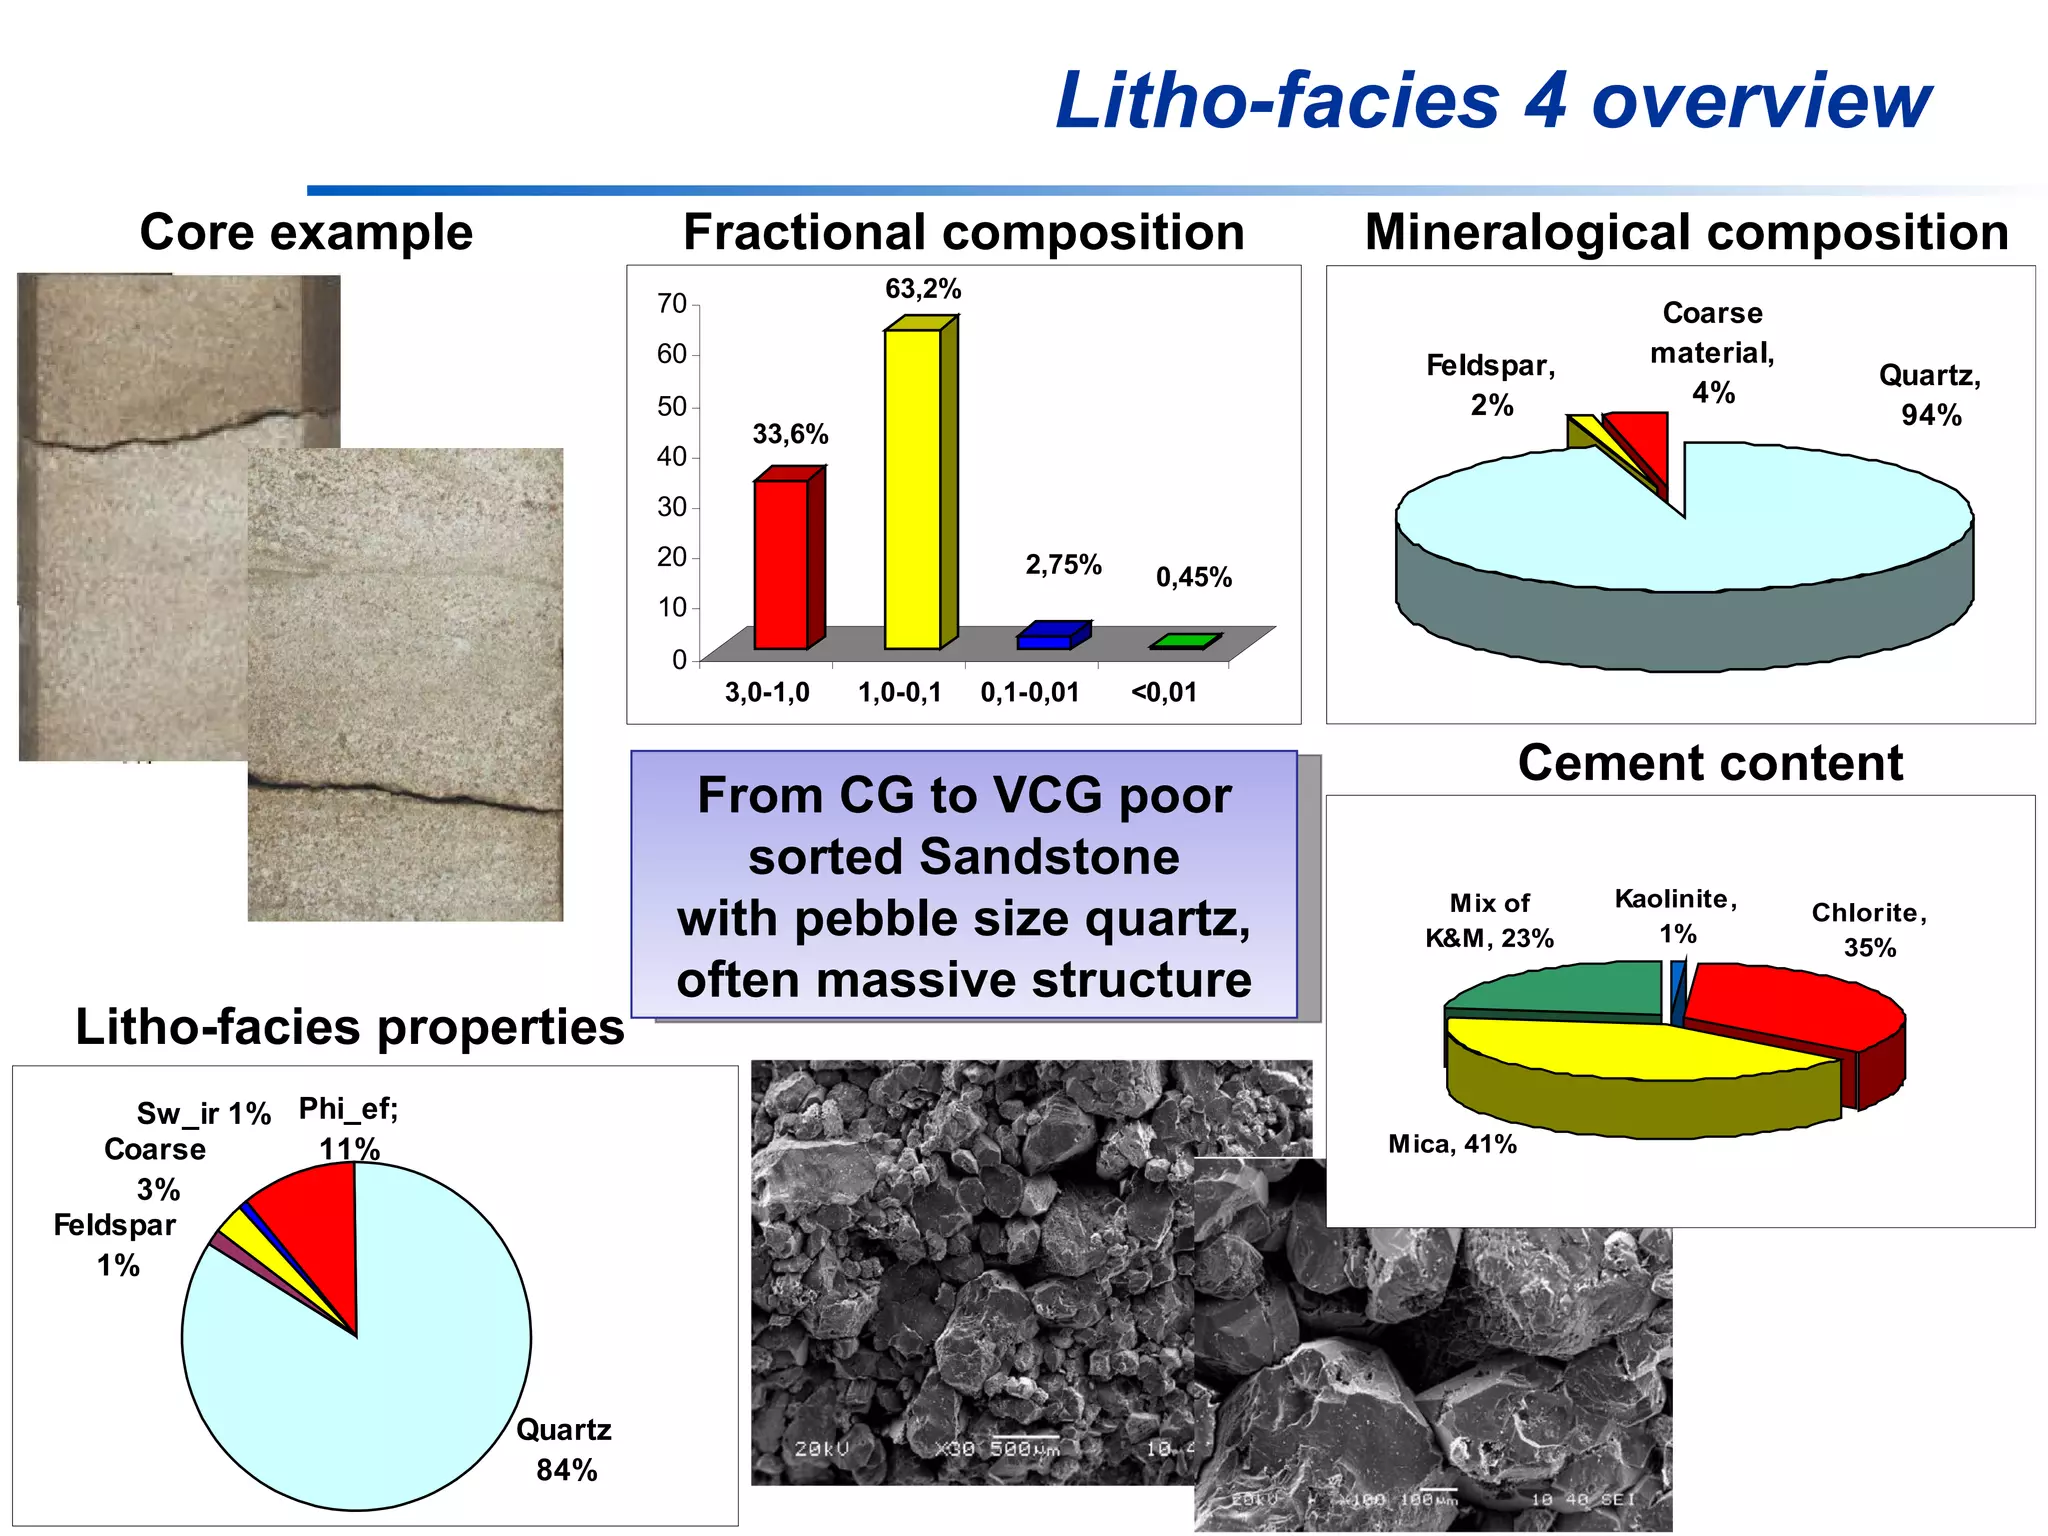
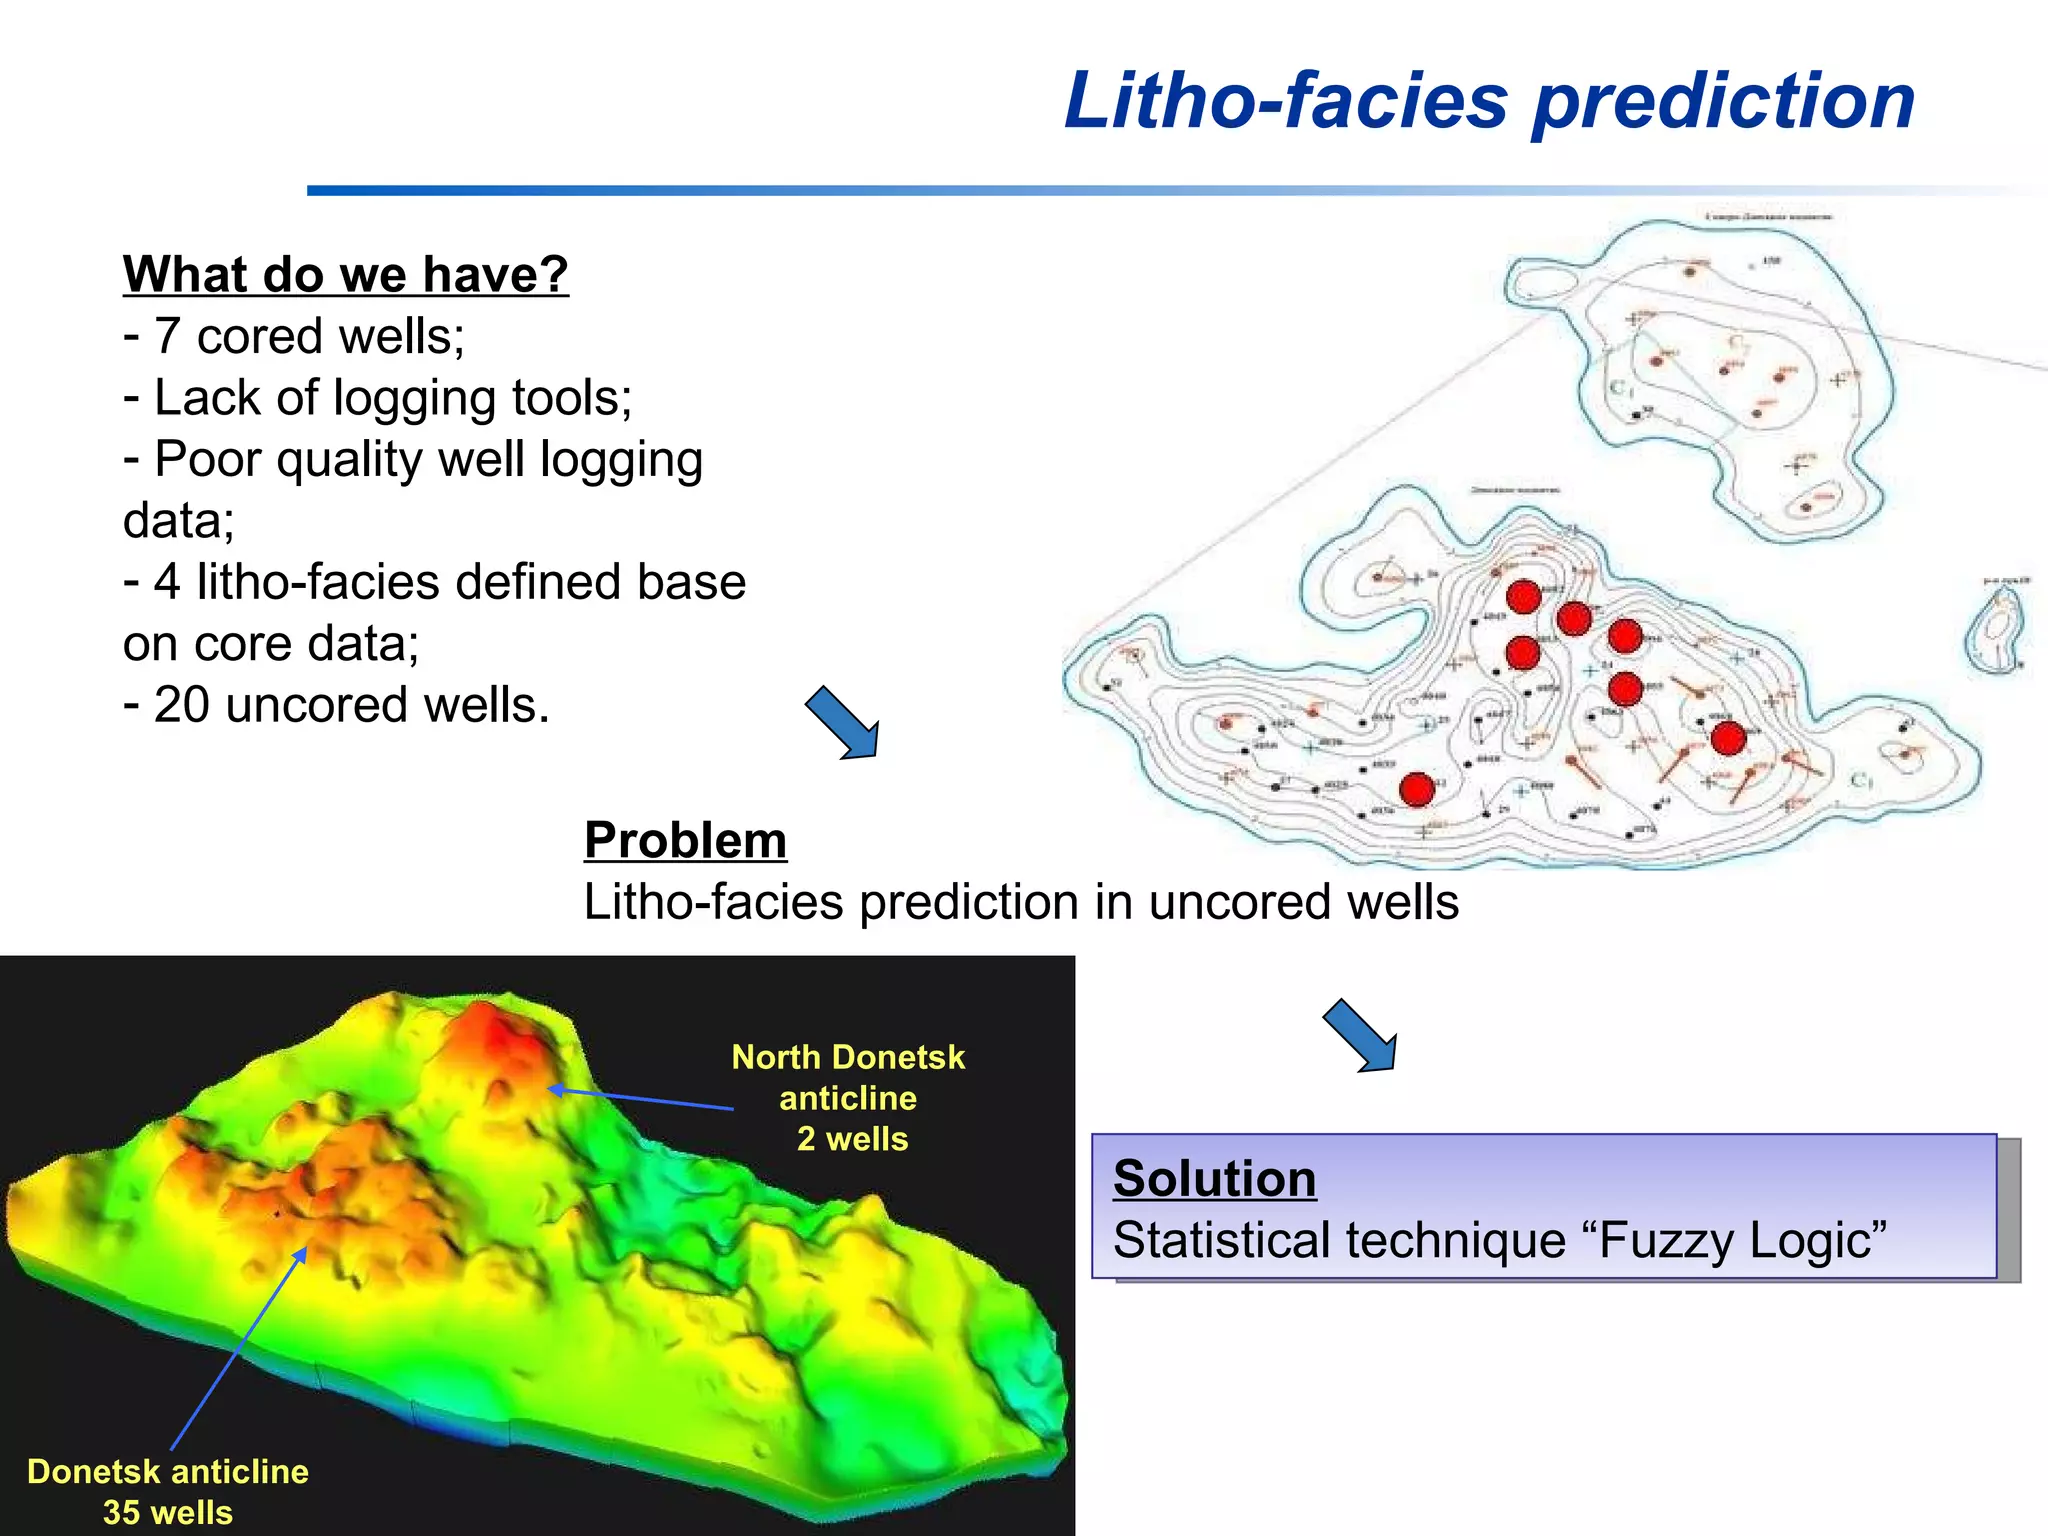
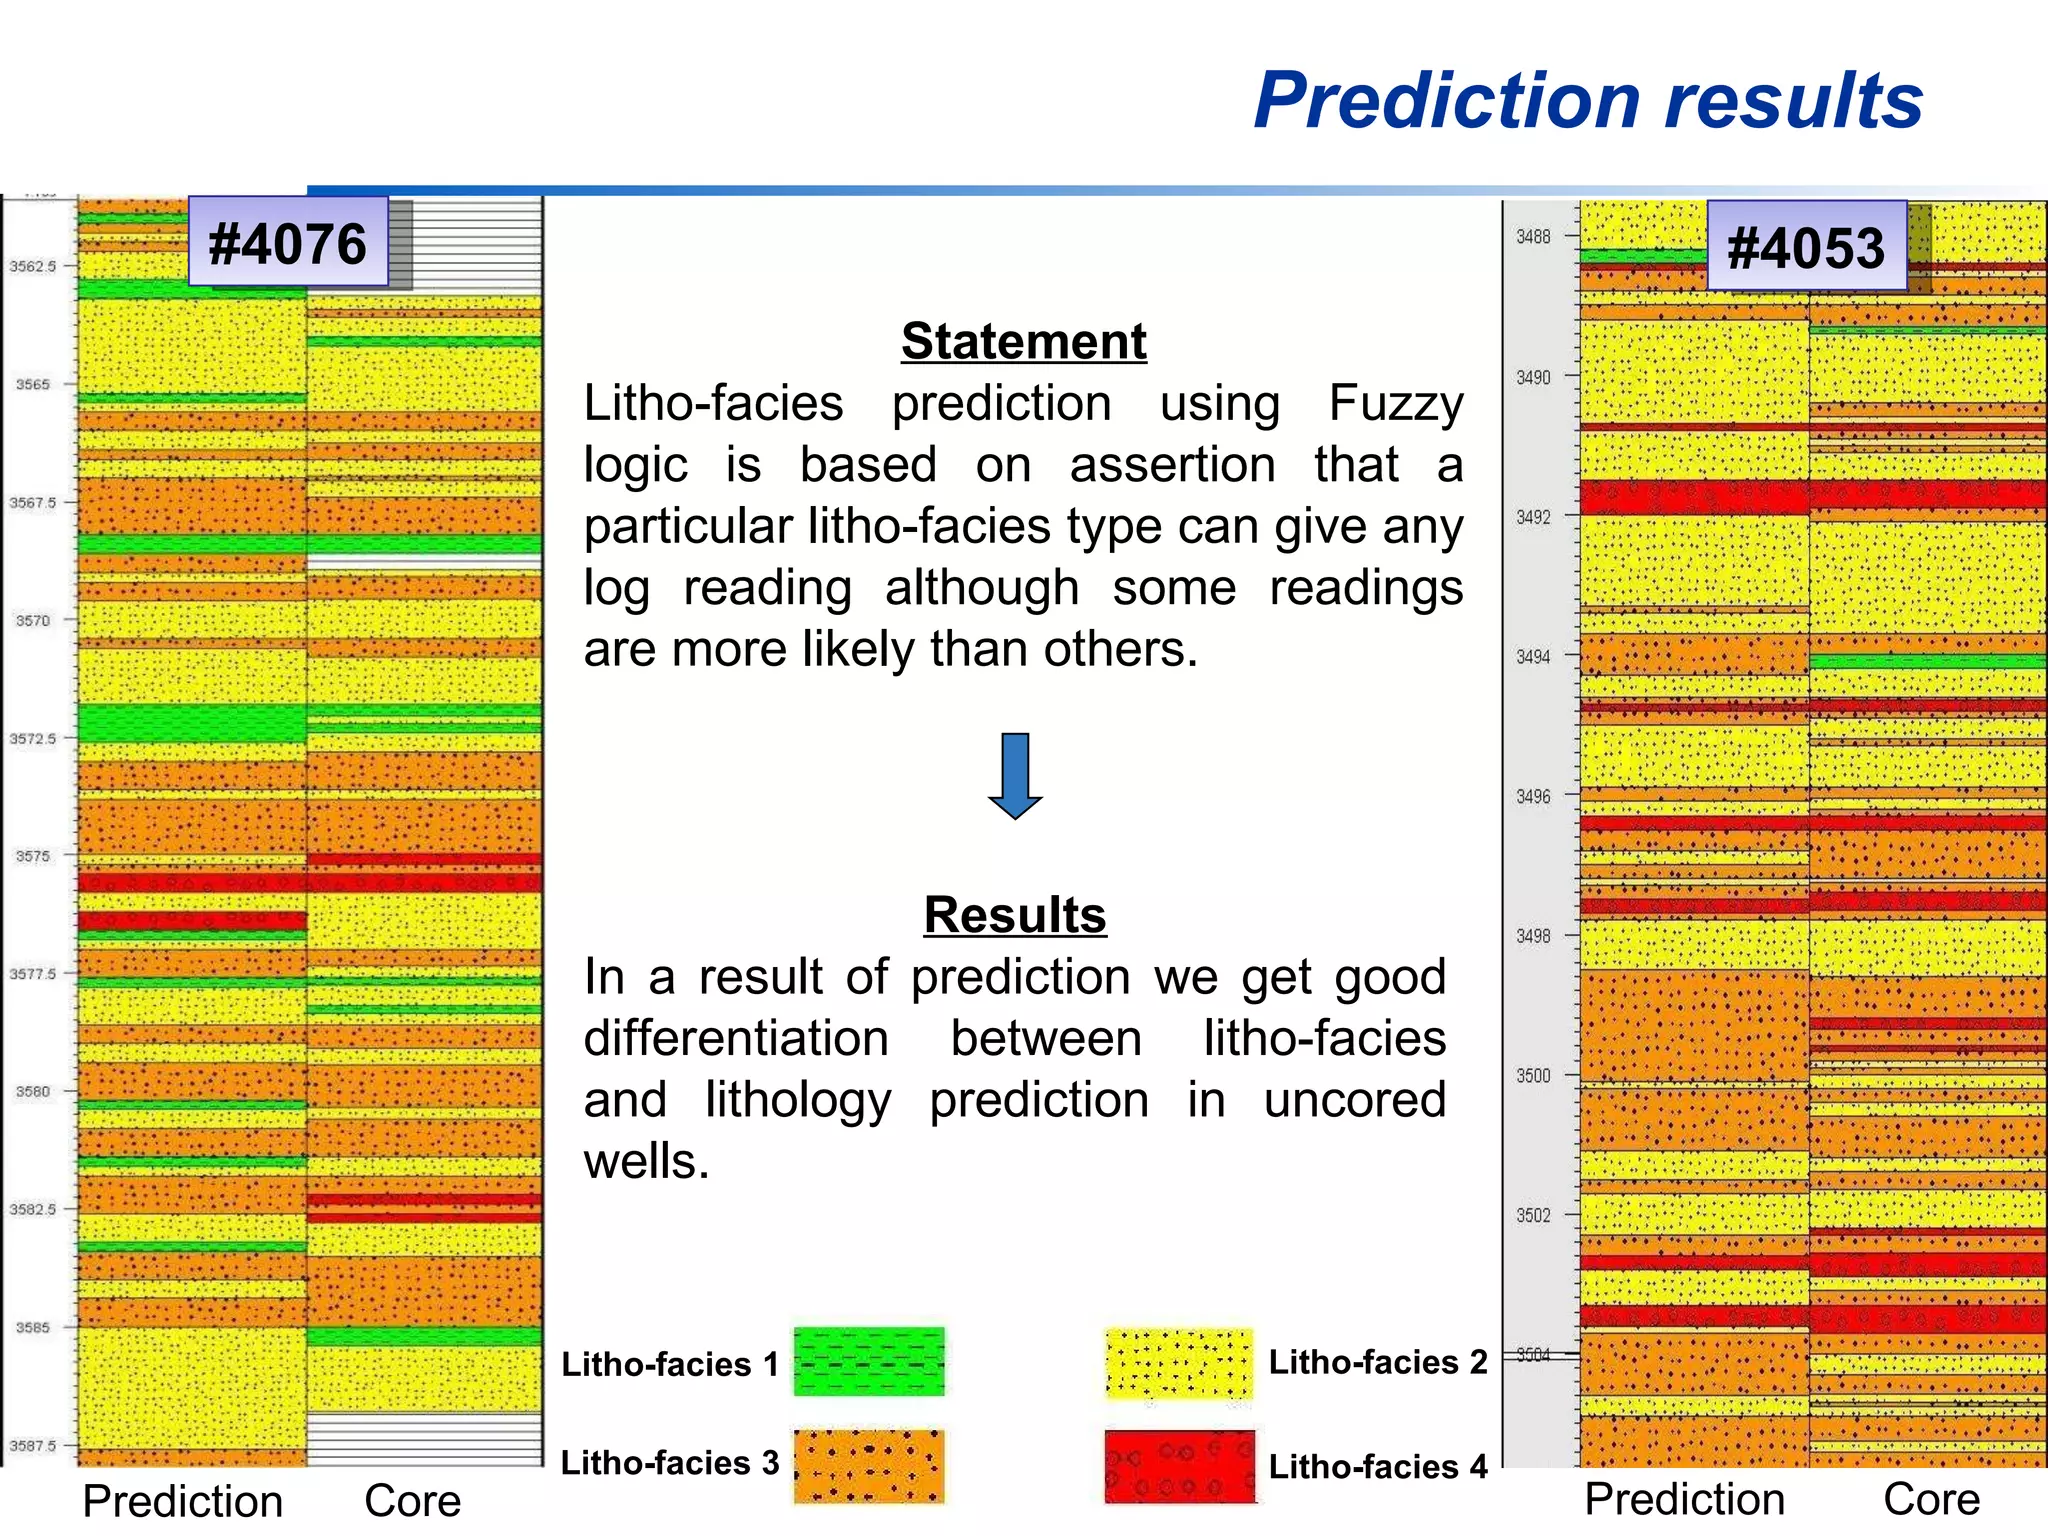
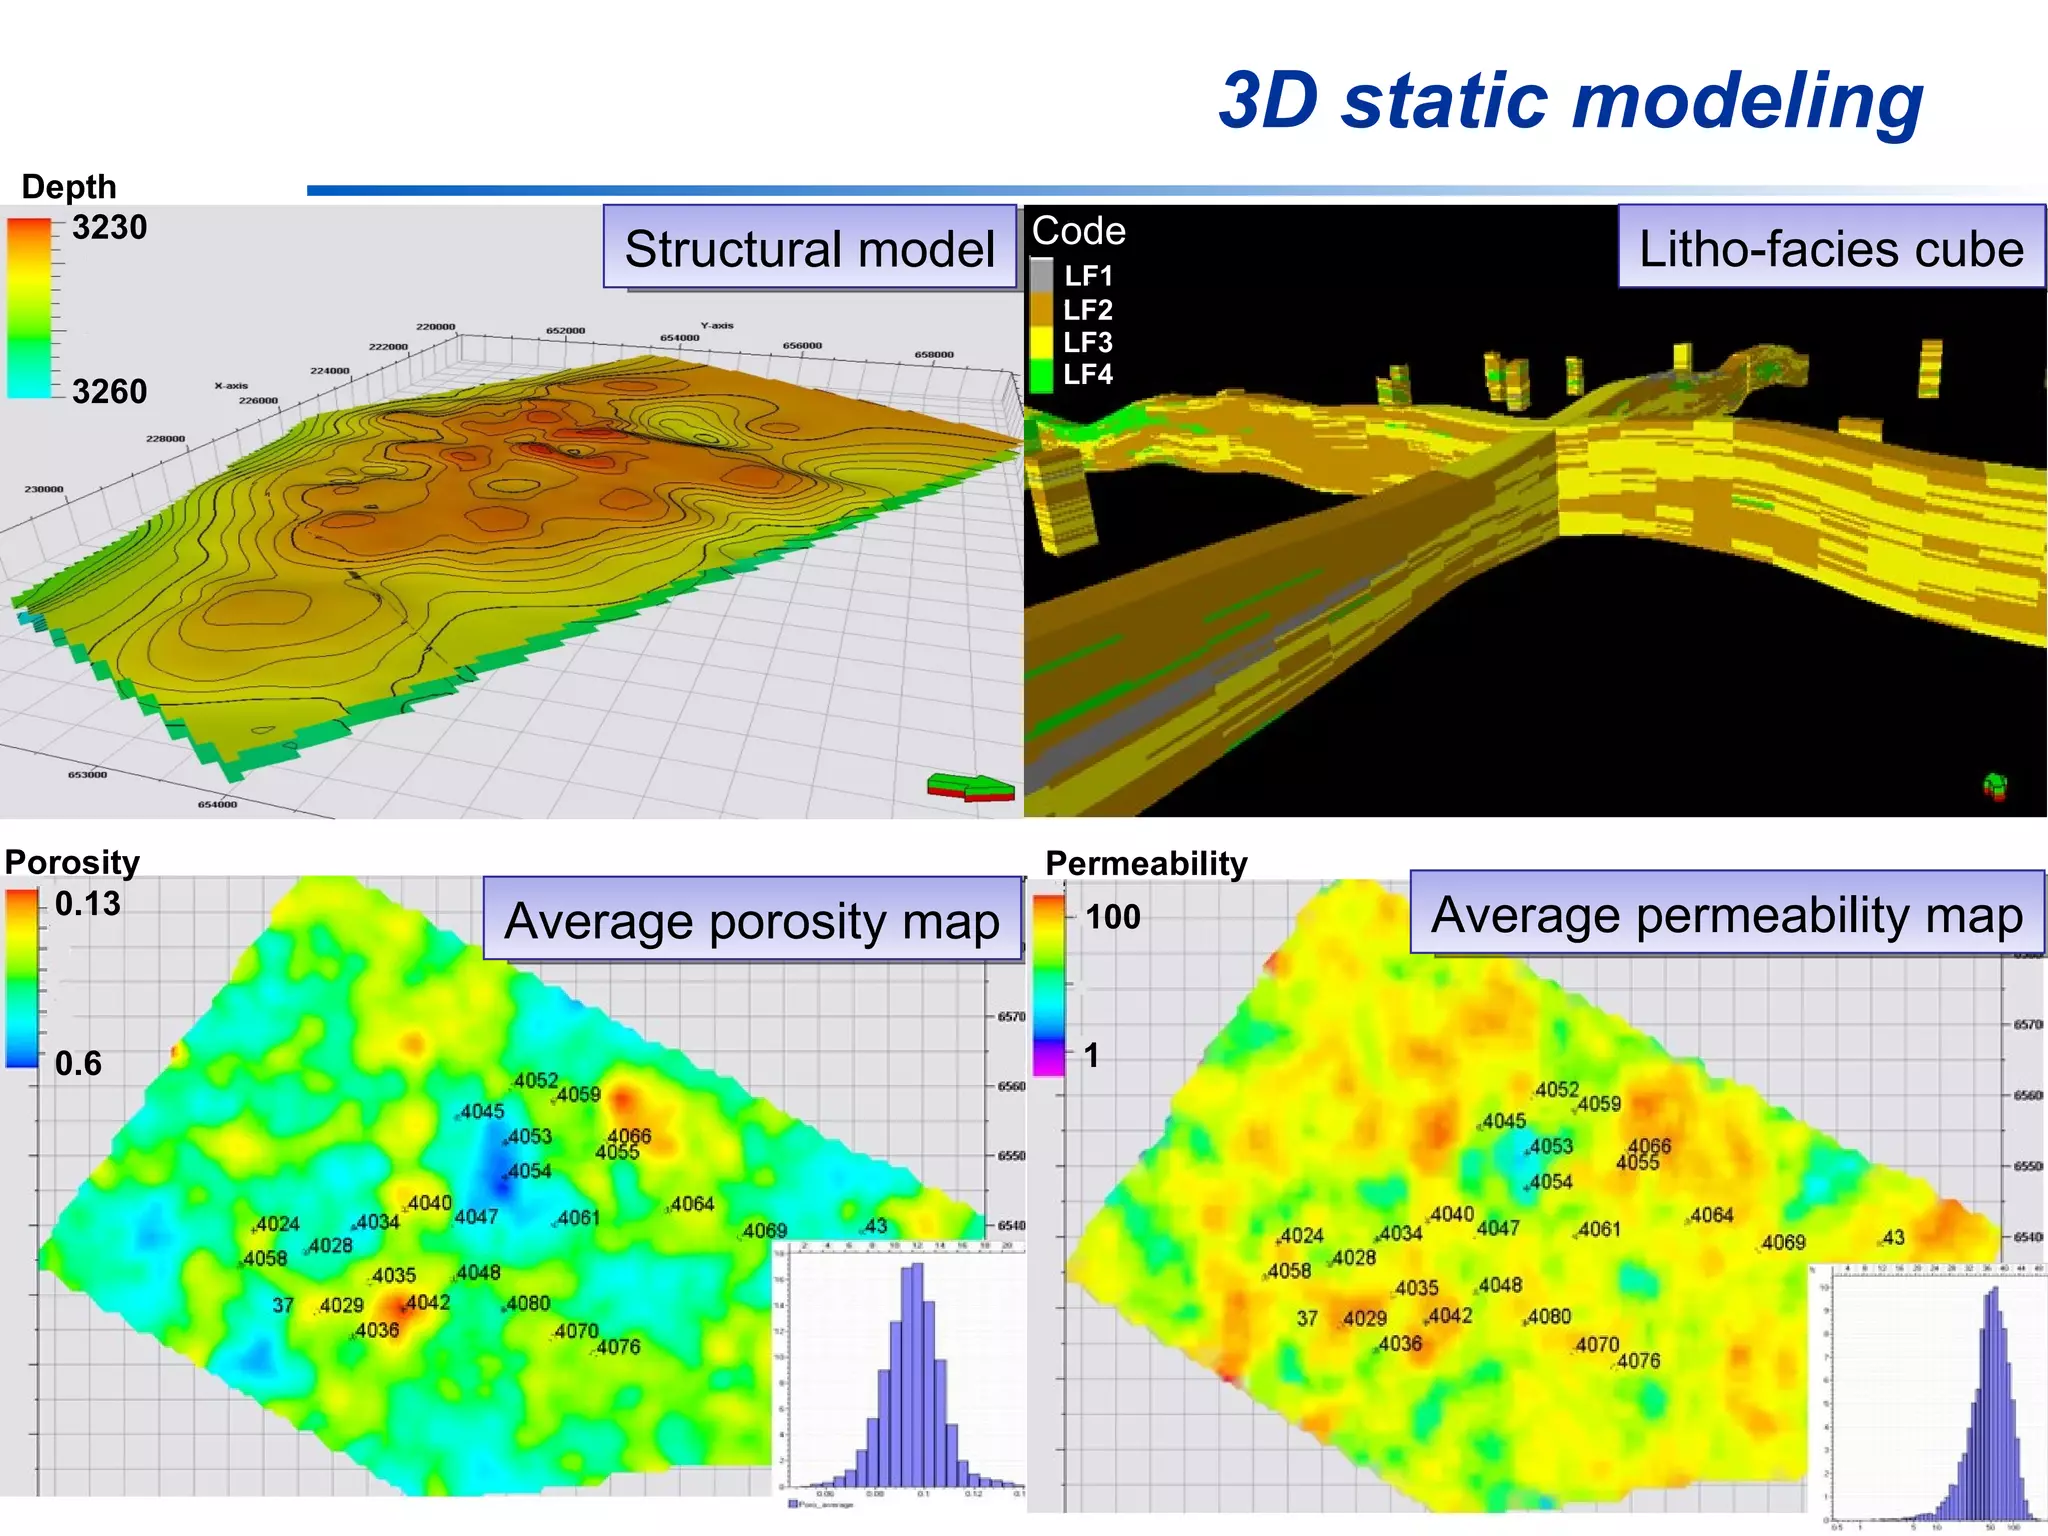
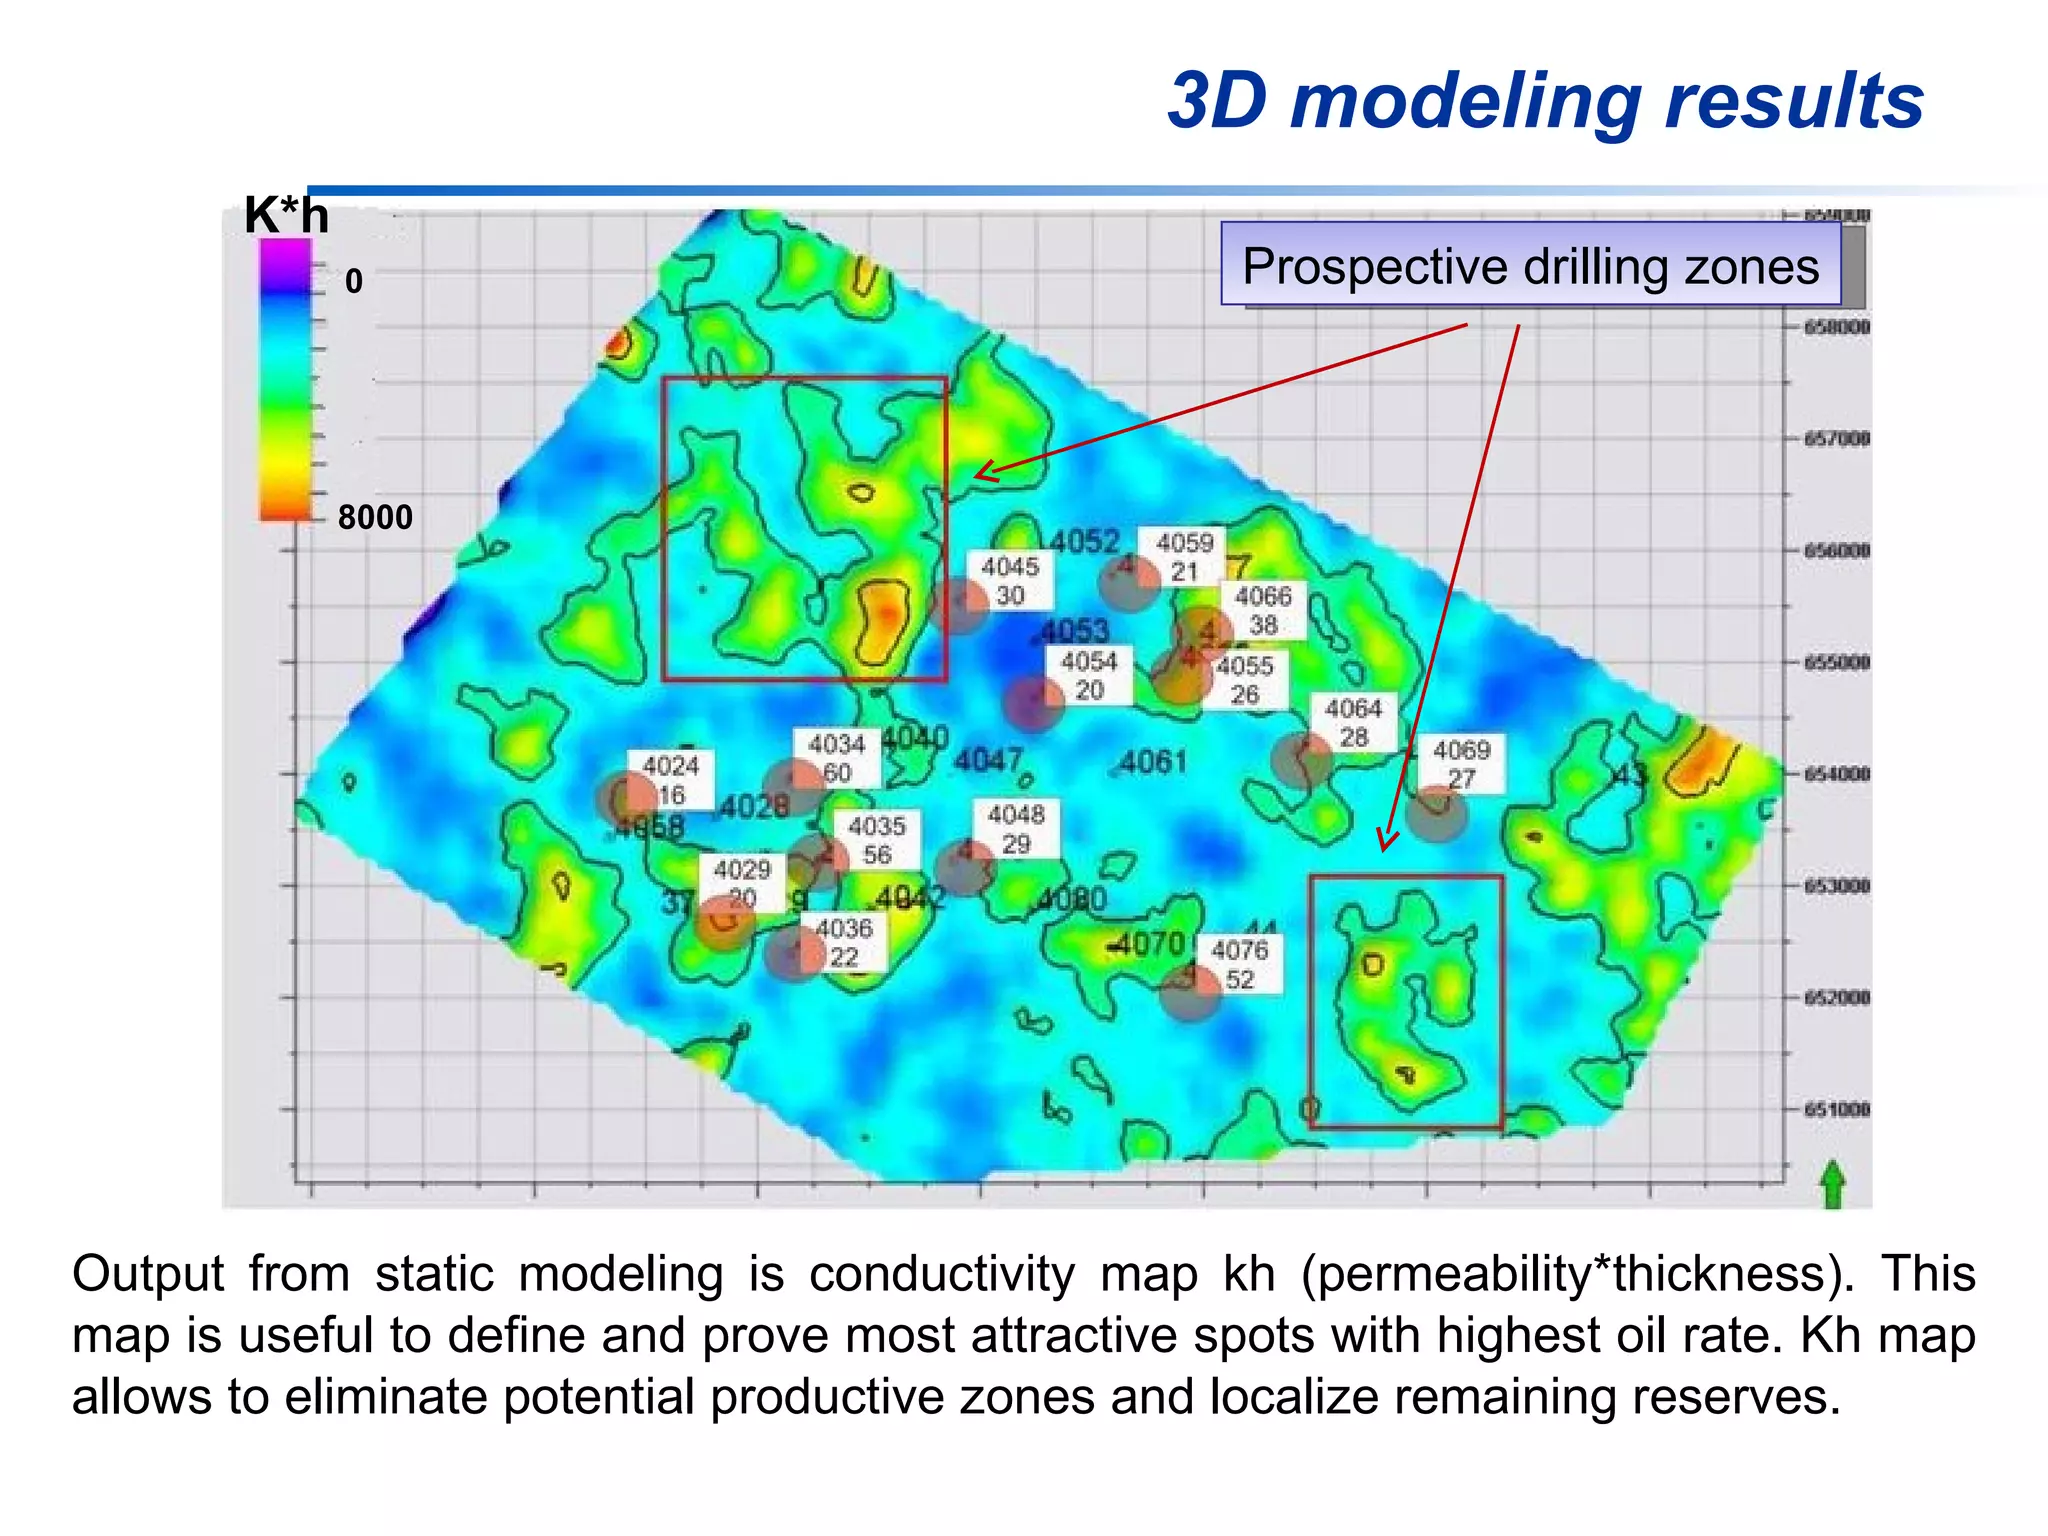
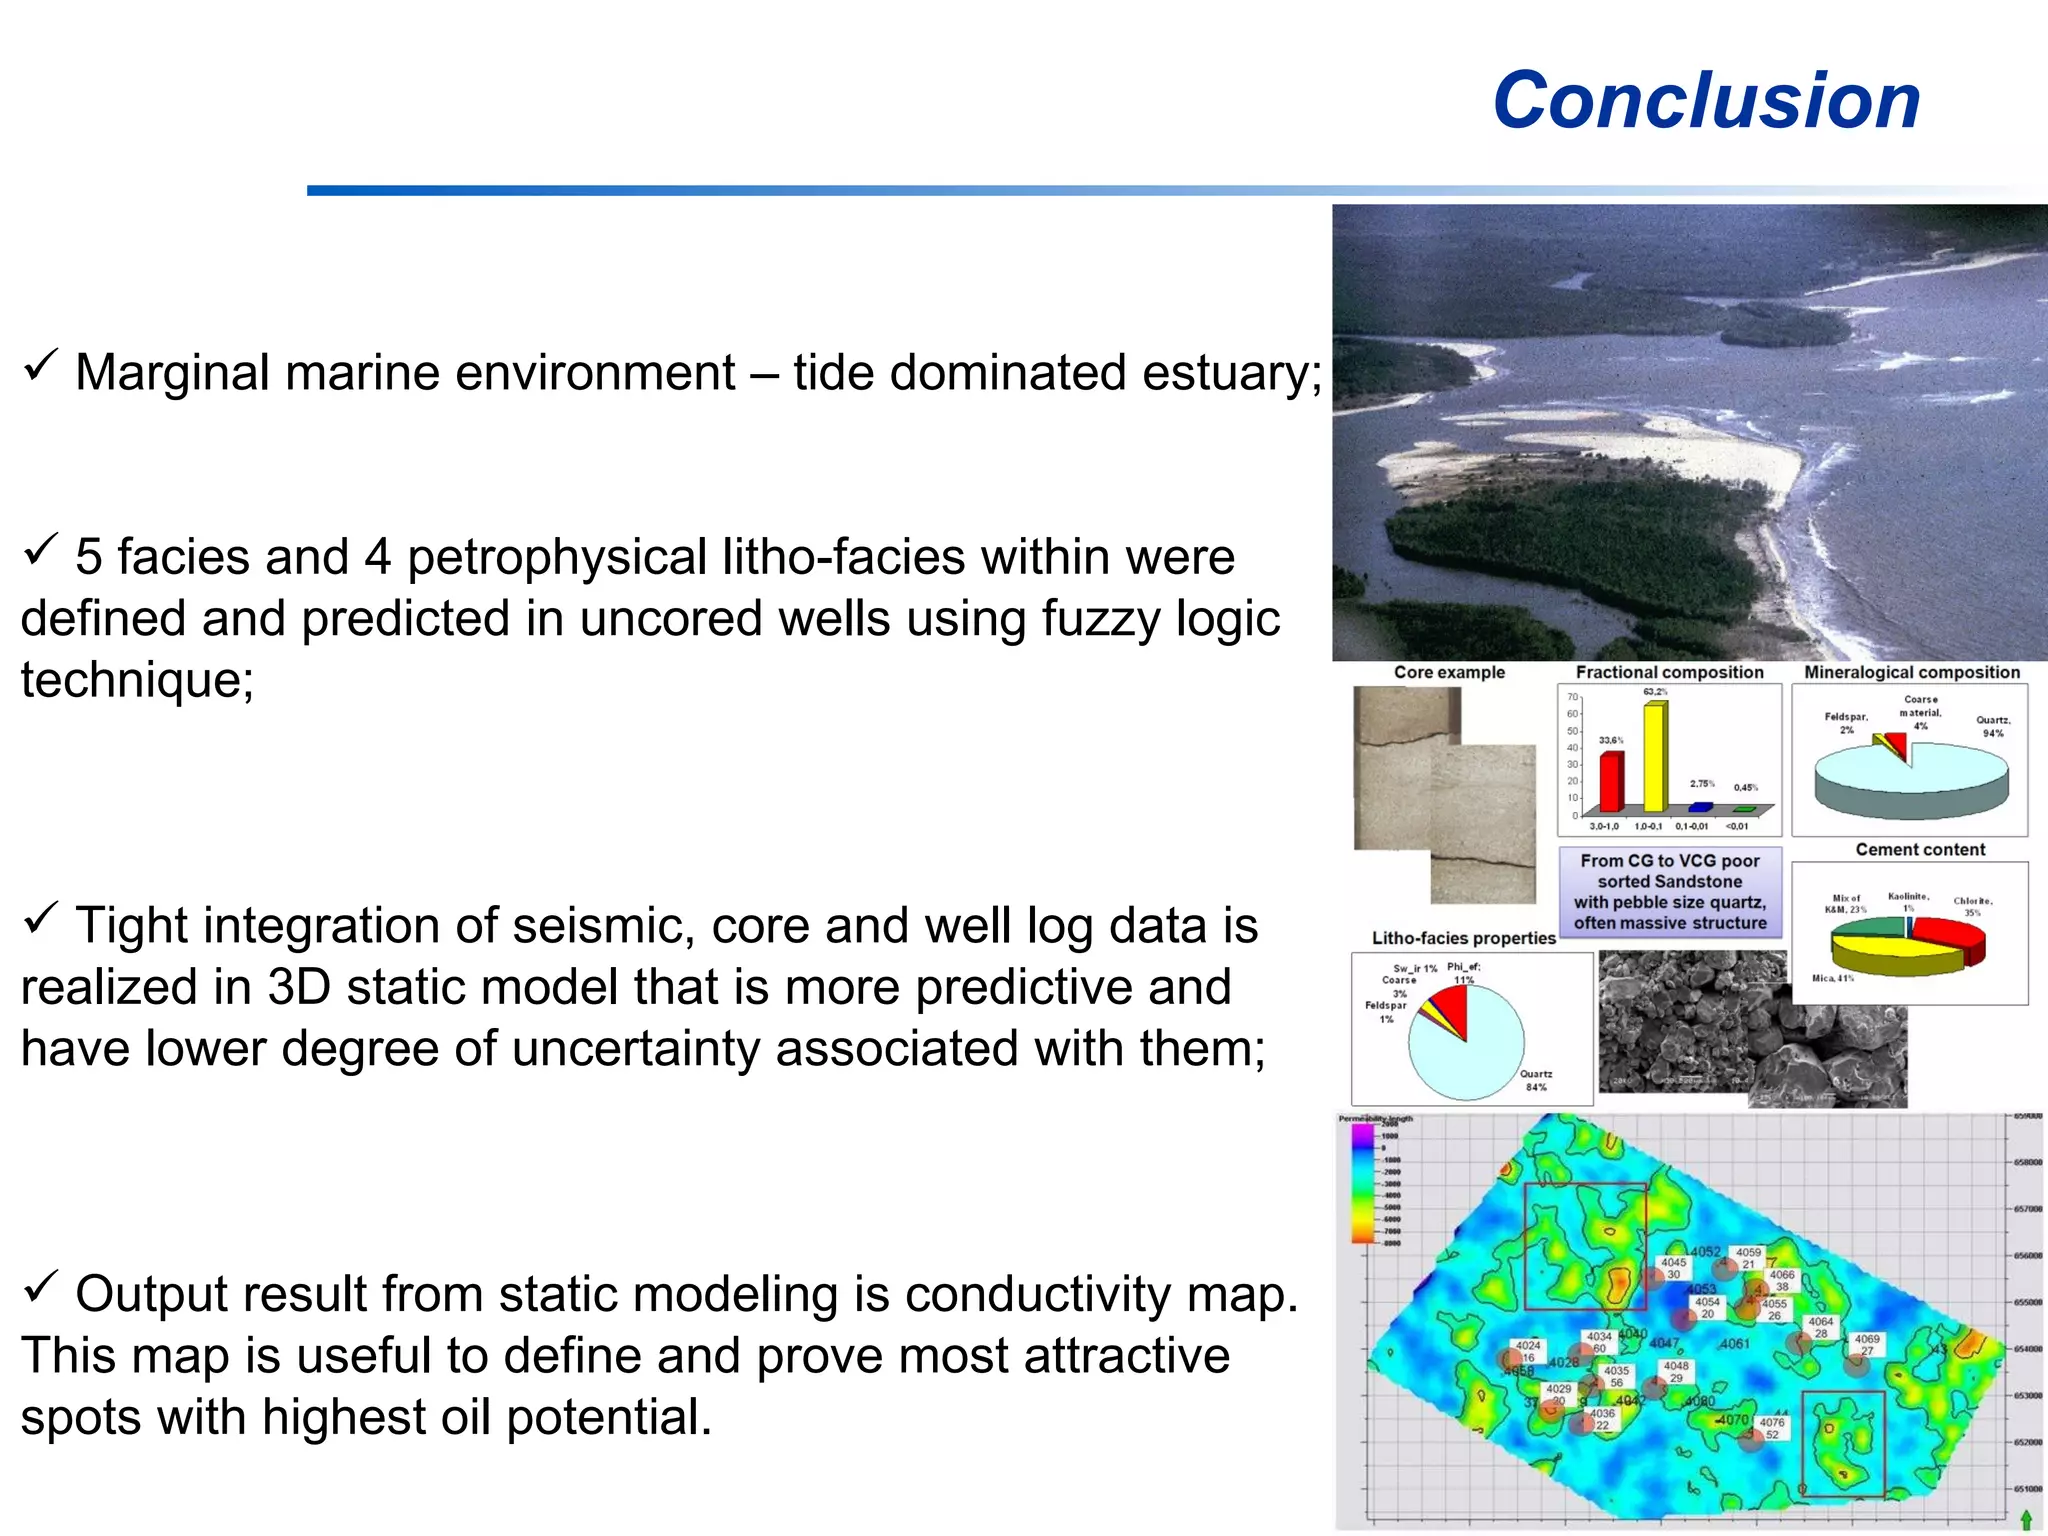
Facies analysis and production classification of Frasnian age reservoir Investigator: Irina Knyazeva Tyumen, 09’2011 Supervisors: Chris Elders
Area of interest Location of the area West Siberia Tectonic map
Regional tectonic
Target Layer:   Dkt – clastic Upper Frasnian Late Devonian, Paleozoic Frasnian-Tournaisian  Oil&Gas complex Chronostratigraphy
3D seismic cube Core data – 7 wells Well log data – 27 wells Available data Area of 3D seismic survey 235 km2
Seismic interpretation Core description Sedimentology analysis Facies determination Project workflow Facies analysis Palaeoenvironmen reconstruction Litho-facies differentiation Macro description Fractional composition Cement content Mineralogical composition Phi-K relationship Well logs characteristics Core – Well logs tie 3D litho-facies modeling Litho-facies cube Porosity cube Permeability cube Kh map Output. Recommendations
Seismic interpretation Well #4066 Dkt_top Dkt_bot Fm_top
Seismic interpretation results Bottom of reservoir Top of reservoir
Seismic interpretation results Thickness of reservoir Implication Combination of these three maps shows that sedimentation rate was slower in South-East and much faster in central and North-West parts.
Core description Structural map bottom of the reservoir Wells with core #4053
Facies analysis Tidal channel Tidal bar Tidal flat Characteristics: - Lithology: mud, sand and less commonly conglomerate; - Cross-bedding and cross-lamination structure; - Bimodal in tidal estuaries; - Fossils content typical for shallow marine; - Fining up succession. Tidal channel facies
Facies analysis Tidal channel Tidal bar Tidal flat Tidal bar facies Characteristics: - Lithology: from fine grained to medium grain size sand; - Sigmoidal cross-bedding associated with the tidal deltas and inlet fills; - Bidirectional current indicators.
Facies analysis Tidal channel Tidal bar Tidal flat Tidal flat facies Characteristics: - Lithology: mud and fine grain sand; - Tabular muds with thin sheets and lenses of sand; Ripple cross-lamination and flaser/lenticular bedding; Fossils content: shallow marine fauna and salt marsh vegetations.
Facies analysis Upper shoreface Foreshore Upper shoreface facies Characteristics: - Lithology: from fine-grained to medium grained sand; - Sedimentary structure: planar cross-bedding; - Clean good reservoir with good porosity and permeability values.
Facies analysis Upper shoreface Foreshore Foreshore facies Characteristics: - Lithology: from medium grained to very coarse grained sand; - Sedimentary structure: trough and planar cross-bedding; - Small amount of bioturbation (by  Scolithos  ichnofacies); - High energy deposition environment.
Ichnofauna examples Palaeophycus . Realted to  Scolithos  ichnofacies. Characterized by high and low sedimentation energy foreshore. Also typical for storm affected sandstones. Can be found in brackish water Planolites. Realted to  Scolithos  ichnofacies. Can be found in any type of environments: from fresh water to deep-water settings.   Chondrites . Related to  Cruziana  ichnofacies. Can be found in marine settings. Specific points for  Chondrites  ichnofacies is low oxygen conditions.   Scolithos . Usually for brackish water and marine environments. But  Scolithos  burrows are result from different organism livings this can be from marine to continental environments. Asterosoma. Related to  Cruziana  ichnofacies. Can be found in Upper and Lower shoreface settings. Thalassinoids. Related to  Cruziana  ichnofacies. Typical for brackish water environments.
Palaeoenvironment reconstruction Sweet et al, Basic clastic facies Marginal marine environment Sweetness seismic attribute Gary Nichols, Sedimentology and stratigraphy, lectures, 2011 Tidal channels Tidal bars River Open sea
Litho-facies determination Phi-K transform TNK-BP interpretation My own interpretation Phi ,  %   lgK ,  mD   0 5 10 15 20 1000 100 10 1 0.1 0.01 LF2 LF1 LF3 LF4 Phi ,  fraction   lgK ,  mD   LF1 < 0.0625 mm LF2 = (0.0625 - 0.25) mm LF3 = (0.25 - 0.5) mm LF4 = (0.5 - 2) mm
Litho-facies determination Phi-K transform TNK-BP interpretation My own interpretation Litho-facies 4:   lg К=8.004*lg(Phi)+9.985 Litho-facies 3:   lg К=7.819*lg(Phi)+9.198 Litho-facies 2:   lg К= 5 . 057 *lg(Phi)+ 5 . 15 9 Litho-facies 1:   lg  K =3.601*lg( Phi )+2.829  Phi ,  %   lgK ,  mD   0 5 10 15 20 1000 100 10 1 0.1 0.01 LF2 LF1 LF3 LF4 Phi ,  fraction   lgK ,  mD
Litho-facies 2 overview Cross-bedded from VFG to FG Sandstone partly bioturbated Core example Fractional composition Mineralogical composition Cement content Litho-facies properties
Litho-facies 3 overview MG poor sorted quartzitic Sandstone with some detrit Core example Fractional composition Mineralogical composition Cement content Litho-facies properties
Litho-facies 4 overview From CG to VCG poor sorted Sandstone with pebble size quartz, often massive structure Core example Fractional composition Mineralogical composition Cement content Litho-facies properties
Litho-facies prediction What do we have? 7 cored wells; Lack of logging tools; Poor quality well logging data; 4 litho-facies defined base on core data; 20 uncored wells. Problem Litho-facies prediction in uncored wells Solution Statistical technique “Fuzzy Logic” Donetsk anticline   35  wells   North Donetsk  anticline   2  wells
Prediction results #4053 #4076 Core  Core  Prediction Prediction Litho-facies 1 Litho-facies 2 Litho-facies 3 Litho-facies 4 Statement Litho-facies prediction using Fuzzy logic is based on assertion that a particular litho-facies type can give any log reading although some readings are more likely than others.  Results In a result of prediction we get good differentiation between litho-facies and lithology prediction in uncored wells.
3D static modeling Structural model Depth 3230 3260 Litho-facies cube Code LF1 LF2 LF3 LF4 Average porosity map Porosity 0.13 0.6 Average permeability map Permeability 1 100
3D modeling results Output from static modeling is conductivity map kh (permeability*thickness). This map is useful to define and prove most attractive spots with highest oil rate. Kh map allows to eliminate potential productive zones and localize remaining reserves.  Prospective drilling zones K*h 8000 0
Conclusion Marginal marine environment – tide dominated estuary; 5 facies and 4 petrophysical litho-facies within were  defined and predicted in uncored wells using fuzzy logic  technique; Tight integration of seismic, core and well log data is  realized in 3D static model that is more predictive and  have lower degree of uncertainty associated with them; Output result from static modeling is conductivity map.  This map is useful to define and prove most attractive  spots with highest oil potential.
Thank you for attention! http://2.bp.blogspot.com/_Bz97zTlEL6U/TPhI9rk8aBI/AAAAAAAABuc/dZvl28QthbU/s1600/P1020294_Estuary.JPG

MSc thesis’2011

  • 1.
    Facies analysis andproduction classification of Frasnian age reservoir Investigator: Irina Knyazeva Tyumen, 09’2011 Supervisors: Chris Elders
  • 2.
    Area of interestLocation of the area West Siberia Tectonic map
  • 3.
  • 4.
    Target Layer: Dkt – clastic Upper Frasnian Late Devonian, Paleozoic Frasnian-Tournaisian Oil&Gas complex Chronostratigraphy
  • 5.
    3D seismic cubeCore data – 7 wells Well log data – 27 wells Available data Area of 3D seismic survey 235 km2
  • 6.
    Seismic interpretation Coredescription Sedimentology analysis Facies determination Project workflow Facies analysis Palaeoenvironmen reconstruction Litho-facies differentiation Macro description Fractional composition Cement content Mineralogical composition Phi-K relationship Well logs characteristics Core – Well logs tie 3D litho-facies modeling Litho-facies cube Porosity cube Permeability cube Kh map Output. Recommendations
  • 7.
    Seismic interpretation Well#4066 Dkt_top Dkt_bot Fm_top
  • 8.
    Seismic interpretation resultsBottom of reservoir Top of reservoir
  • 9.
    Seismic interpretation resultsThickness of reservoir Implication Combination of these three maps shows that sedimentation rate was slower in South-East and much faster in central and North-West parts.
  • 10.
    Core description Structuralmap bottom of the reservoir Wells with core #4053
  • 11.
    Facies analysis Tidalchannel Tidal bar Tidal flat Characteristics: - Lithology: mud, sand and less commonly conglomerate; - Cross-bedding and cross-lamination structure; - Bimodal in tidal estuaries; - Fossils content typical for shallow marine; - Fining up succession. Tidal channel facies
  • 12.
    Facies analysis Tidalchannel Tidal bar Tidal flat Tidal bar facies Characteristics: - Lithology: from fine grained to medium grain size sand; - Sigmoidal cross-bedding associated with the tidal deltas and inlet fills; - Bidirectional current indicators.
  • 13.
    Facies analysis Tidalchannel Tidal bar Tidal flat Tidal flat facies Characteristics: - Lithology: mud and fine grain sand; - Tabular muds with thin sheets and lenses of sand; Ripple cross-lamination and flaser/lenticular bedding; Fossils content: shallow marine fauna and salt marsh vegetations.
  • 14.
    Facies analysis Uppershoreface Foreshore Upper shoreface facies Characteristics: - Lithology: from fine-grained to medium grained sand; - Sedimentary structure: planar cross-bedding; - Clean good reservoir with good porosity and permeability values.
  • 15.
    Facies analysis Uppershoreface Foreshore Foreshore facies Characteristics: - Lithology: from medium grained to very coarse grained sand; - Sedimentary structure: trough and planar cross-bedding; - Small amount of bioturbation (by Scolithos ichnofacies); - High energy deposition environment.
  • 16.
    Ichnofauna examples Palaeophycus. Realted to Scolithos ichnofacies. Characterized by high and low sedimentation energy foreshore. Also typical for storm affected sandstones. Can be found in brackish water Planolites. Realted to Scolithos ichnofacies. Can be found in any type of environments: from fresh water to deep-water settings. Chondrites . Related to Cruziana ichnofacies. Can be found in marine settings. Specific points for Chondrites ichnofacies is low oxygen conditions. Scolithos . Usually for brackish water and marine environments. But Scolithos burrows are result from different organism livings this can be from marine to continental environments. Asterosoma. Related to Cruziana ichnofacies. Can be found in Upper and Lower shoreface settings. Thalassinoids. Related to Cruziana ichnofacies. Typical for brackish water environments.
  • 17.
    Palaeoenvironment reconstruction Sweetet al, Basic clastic facies Marginal marine environment Sweetness seismic attribute Gary Nichols, Sedimentology and stratigraphy, lectures, 2011 Tidal channels Tidal bars River Open sea
  • 18.
    Litho-facies determination Phi-Ktransform TNK-BP interpretation My own interpretation Phi , % lgK , mD 0 5 10 15 20 1000 100 10 1 0.1 0.01 LF2 LF1 LF3 LF4 Phi , fraction lgK , mD LF1 < 0.0625 mm LF2 = (0.0625 - 0.25) mm LF3 = (0.25 - 0.5) mm LF4 = (0.5 - 2) mm
  • 19.
    Litho-facies determination Phi-Ktransform TNK-BP interpretation My own interpretation Litho-facies 4: lg К=8.004*lg(Phi)+9.985 Litho-facies 3: lg К=7.819*lg(Phi)+9.198 Litho-facies 2: lg К= 5 . 057 *lg(Phi)+ 5 . 15 9 Litho-facies 1: lg K =3.601*lg( Phi )+2.829 Phi , % lgK , mD 0 5 10 15 20 1000 100 10 1 0.1 0.01 LF2 LF1 LF3 LF4 Phi , fraction lgK , mD
  • 20.
    Litho-facies 2 overviewCross-bedded from VFG to FG Sandstone partly bioturbated Core example Fractional composition Mineralogical composition Cement content Litho-facies properties
  • 21.
    Litho-facies 3 overviewMG poor sorted quartzitic Sandstone with some detrit Core example Fractional composition Mineralogical composition Cement content Litho-facies properties
  • 22.
    Litho-facies 4 overviewFrom CG to VCG poor sorted Sandstone with pebble size quartz, often massive structure Core example Fractional composition Mineralogical composition Cement content Litho-facies properties
  • 23.
    Litho-facies prediction Whatdo we have? 7 cored wells; Lack of logging tools; Poor quality well logging data; 4 litho-facies defined base on core data; 20 uncored wells. Problem Litho-facies prediction in uncored wells Solution Statistical technique “Fuzzy Logic” Donetsk anticline 35 wells North Donetsk anticline 2 wells
  • 24.
    Prediction results #4053#4076 Core Core Prediction Prediction Litho-facies 1 Litho-facies 2 Litho-facies 3 Litho-facies 4 Statement Litho-facies prediction using Fuzzy logic is based on assertion that a particular litho-facies type can give any log reading although some readings are more likely than others. Results In a result of prediction we get good differentiation between litho-facies and lithology prediction in uncored wells.
  • 25.
    3D static modelingStructural model Depth 3230 3260 Litho-facies cube Code LF1 LF2 LF3 LF4 Average porosity map Porosity 0.13 0.6 Average permeability map Permeability 1 100
  • 26.
    3D modeling resultsOutput from static modeling is conductivity map kh (permeability*thickness). This map is useful to define and prove most attractive spots with highest oil rate. Kh map allows to eliminate potential productive zones and localize remaining reserves. Prospective drilling zones K*h 8000 0
  • 27.
    Conclusion Marginal marineenvironment – tide dominated estuary; 5 facies and 4 petrophysical litho-facies within were defined and predicted in uncored wells using fuzzy logic technique; Tight integration of seismic, core and well log data is realized in 3D static model that is more predictive and have lower degree of uncertainty associated with them; Output result from static modeling is conductivity map. This map is useful to define and prove most attractive spots with highest oil potential.
  • 28.
    Thank you forattention! http://2.bp.blogspot.com/_Bz97zTlEL6U/TPhI9rk8aBI/AAAAAAAABuc/dZvl28QthbU/s1600/P1020294_Estuary.JPG