Download to read offline

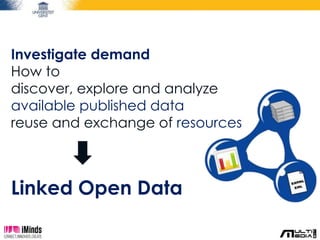
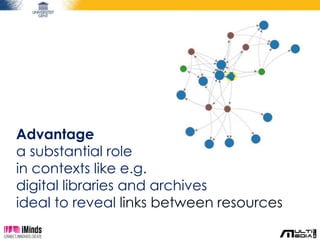
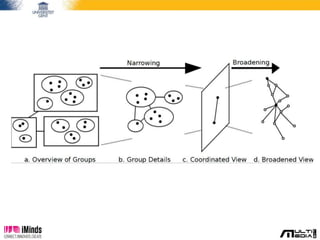
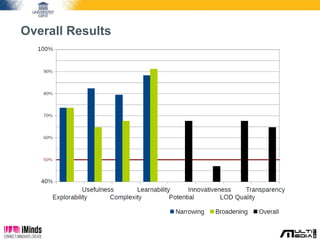

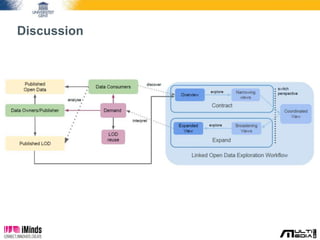
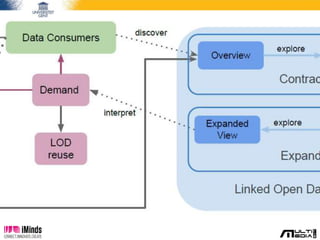
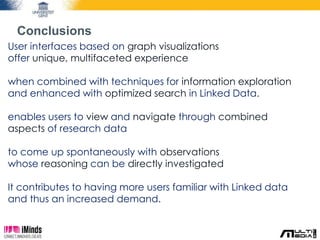

The document outlines a visual workflow designed for discovering, analyzing, and exploiting linked open data, particularly emphasizing its relevance in digital libraries and archives. It discusses user interaction with the dataset, methods for visualization, and evaluation results from case studies that emphasize the perceived goals of explorability and usefulness. The conclusion highlights the benefits of graph visualizations in enhancing user familiarity with linked data and fostering a higher demand for its utilization.