Download to read offline
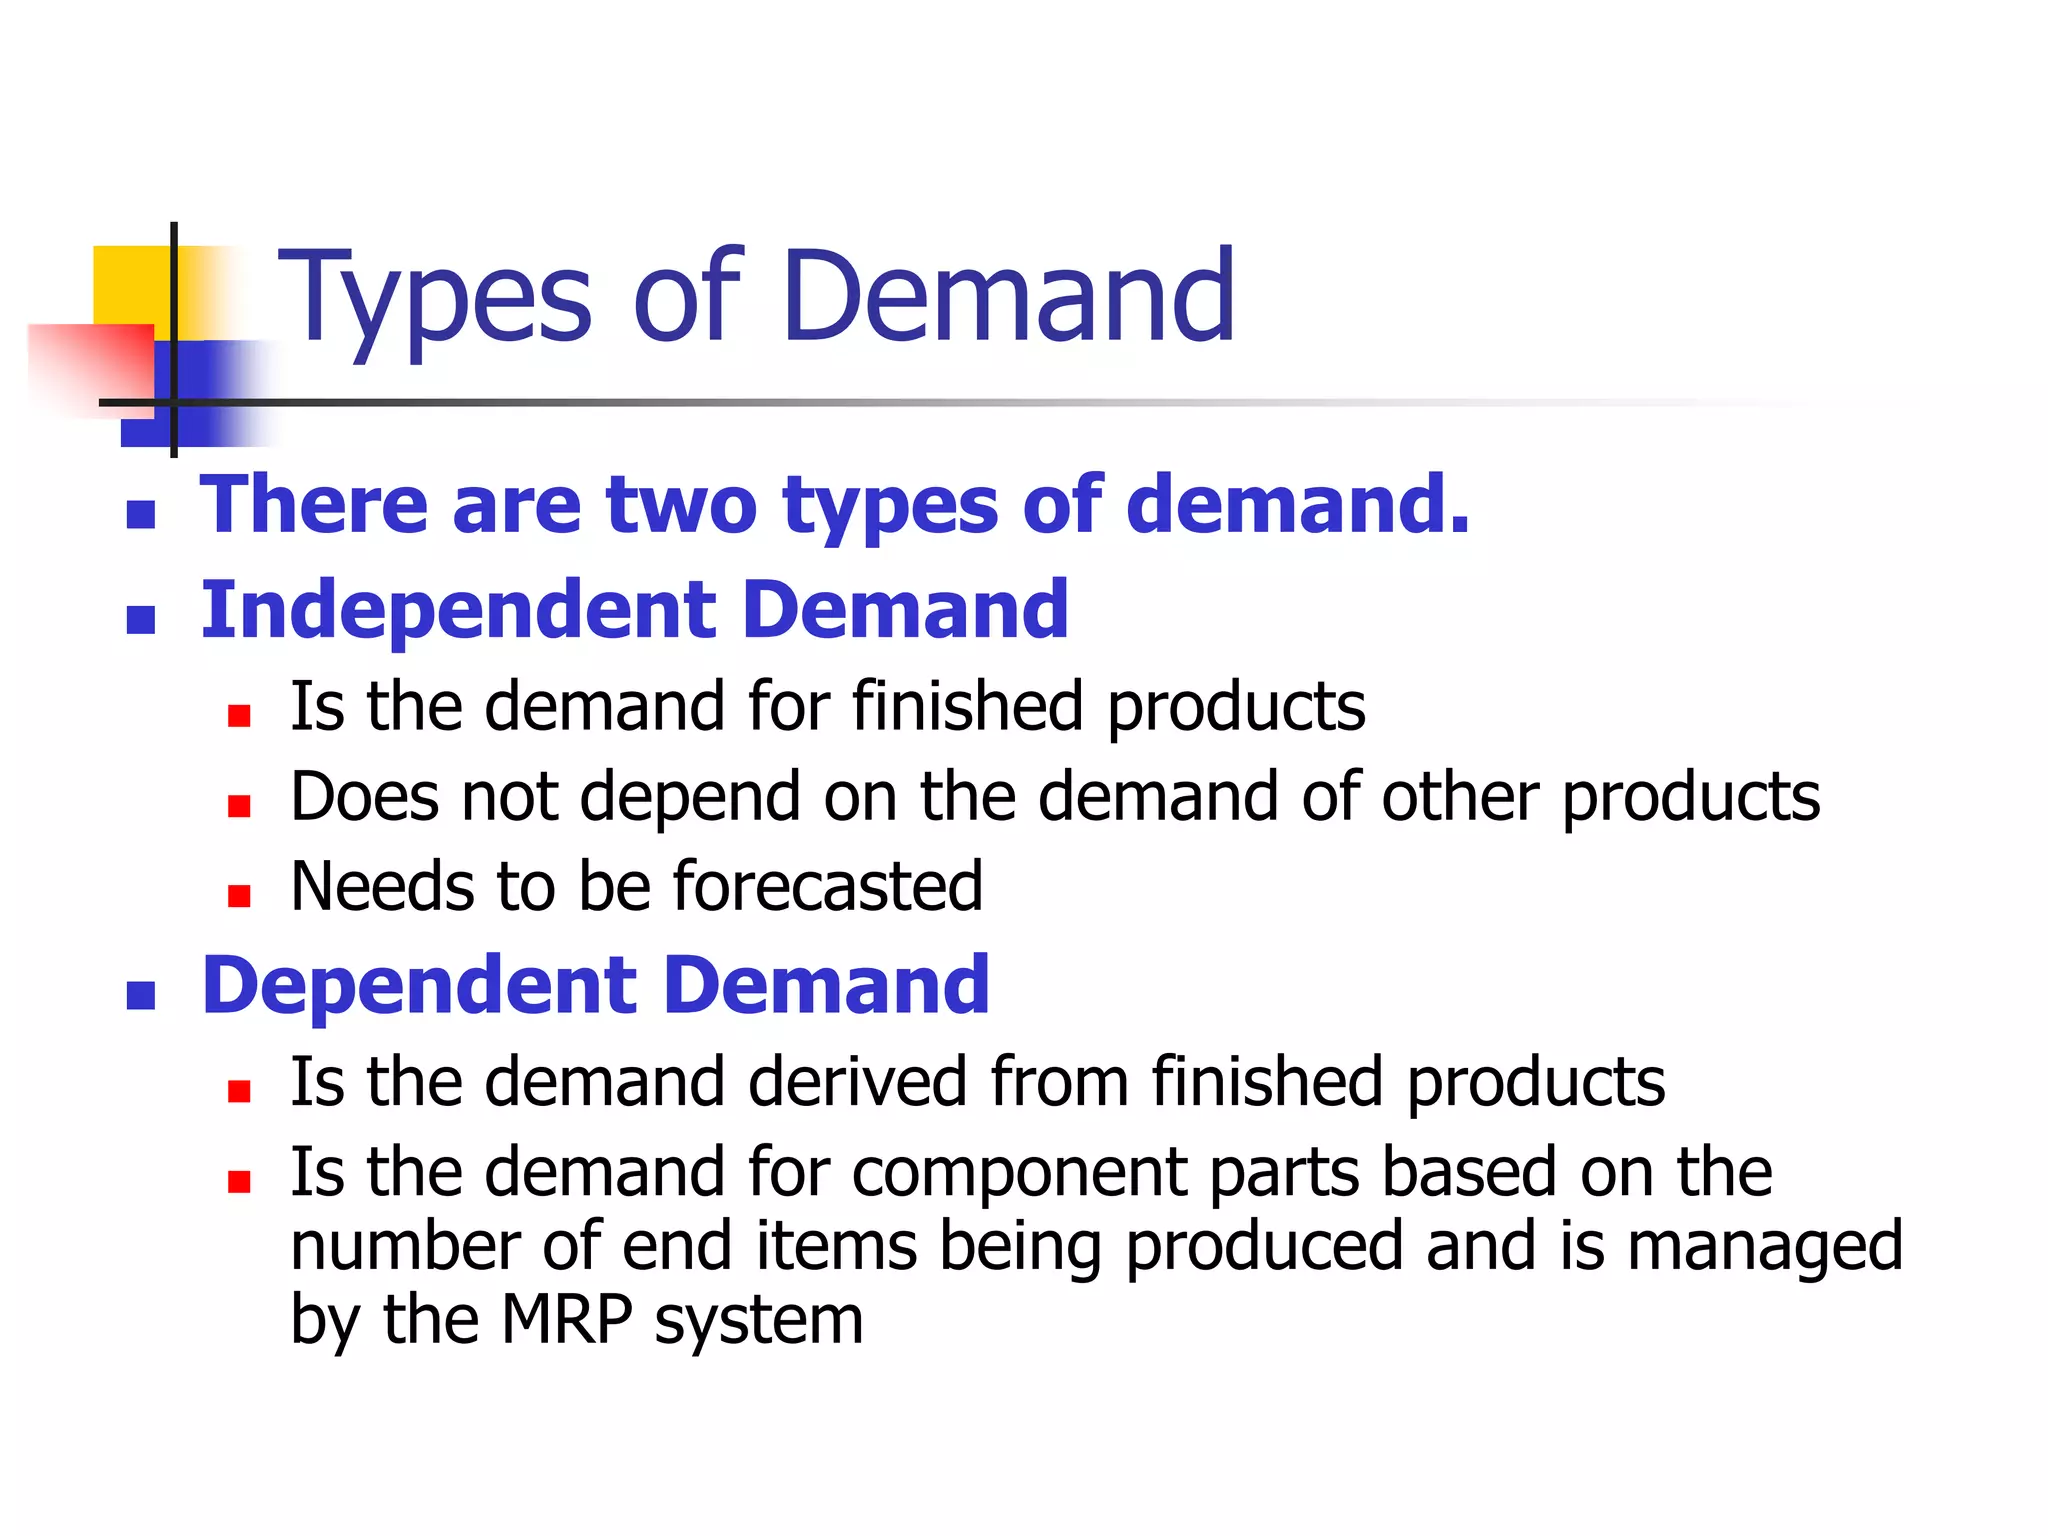
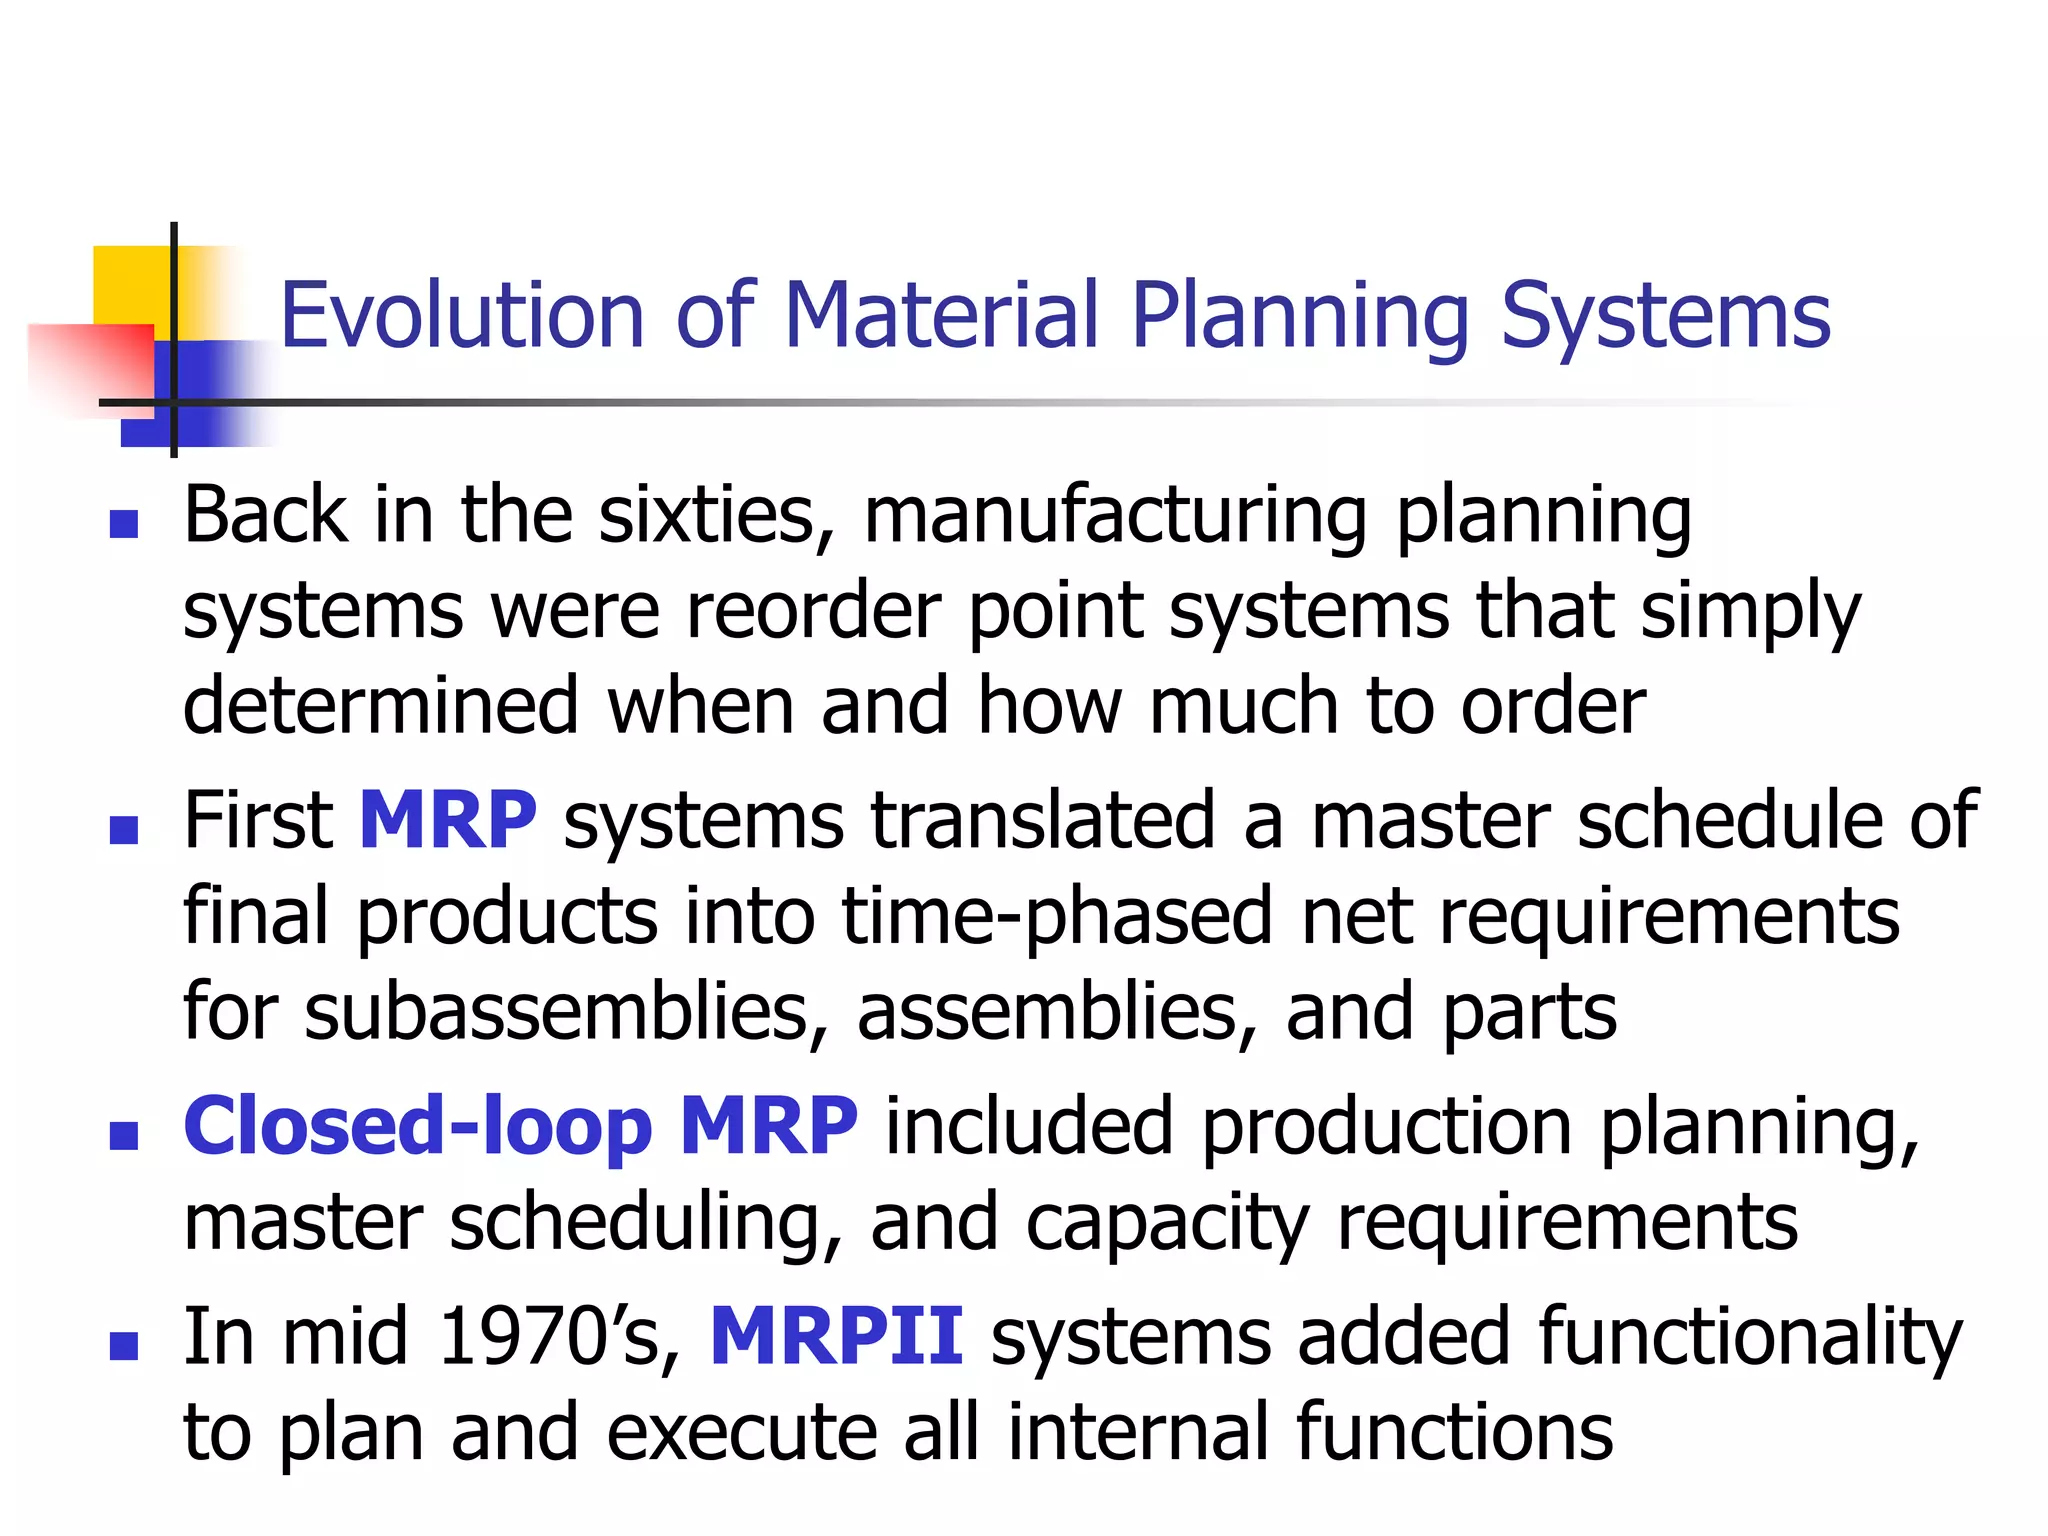


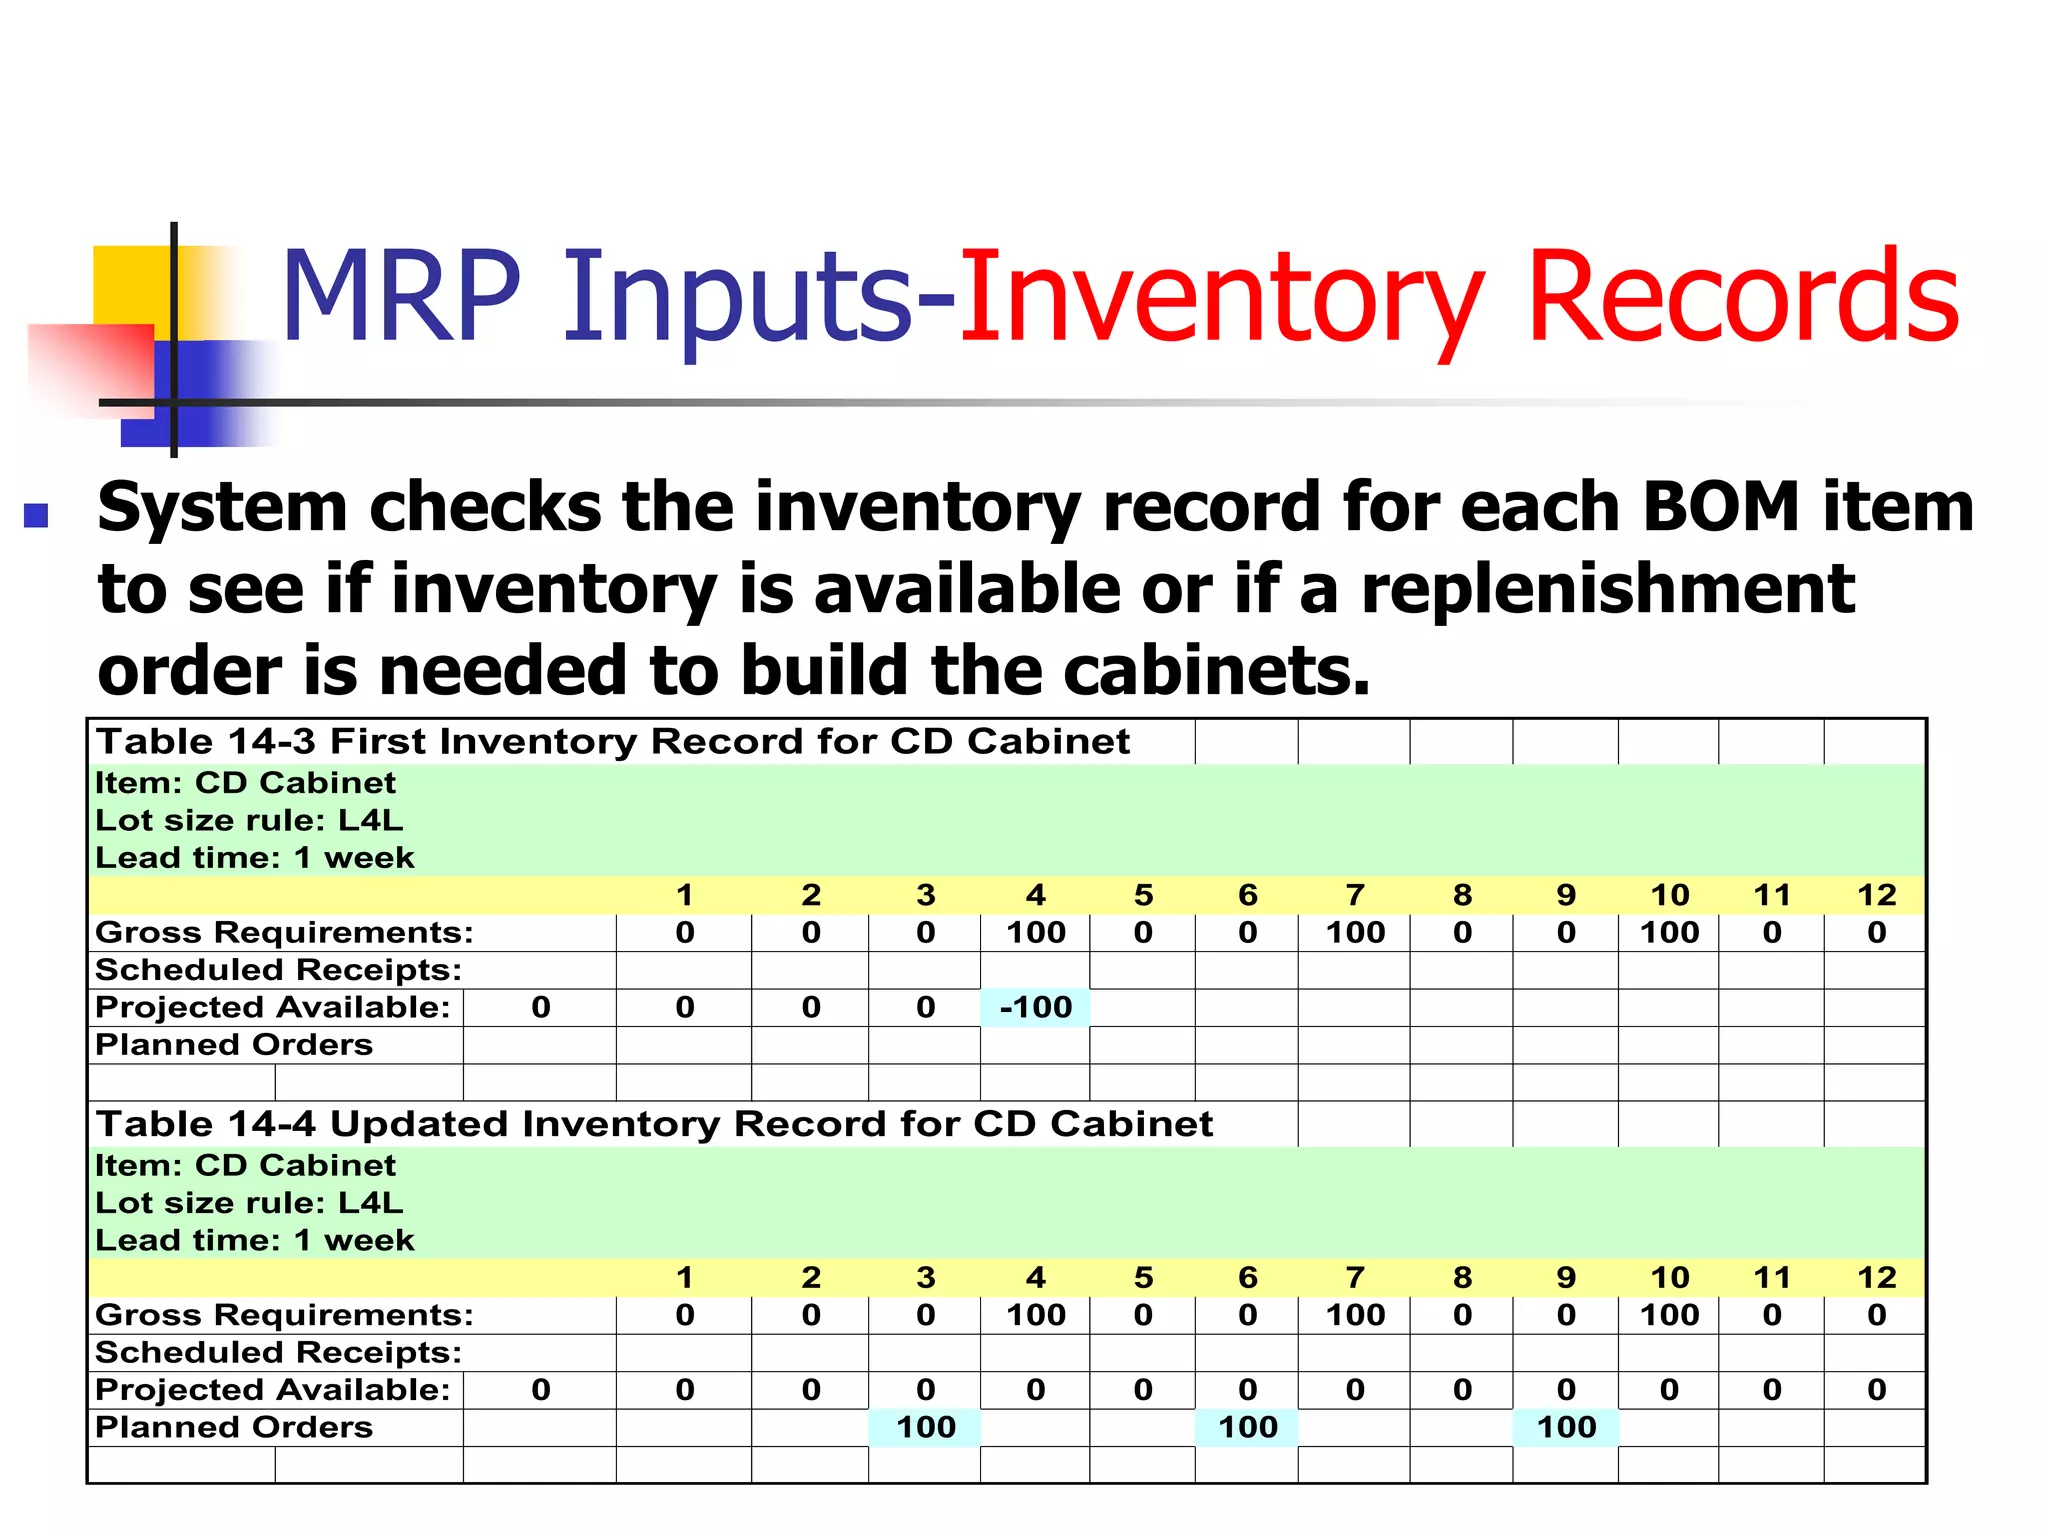


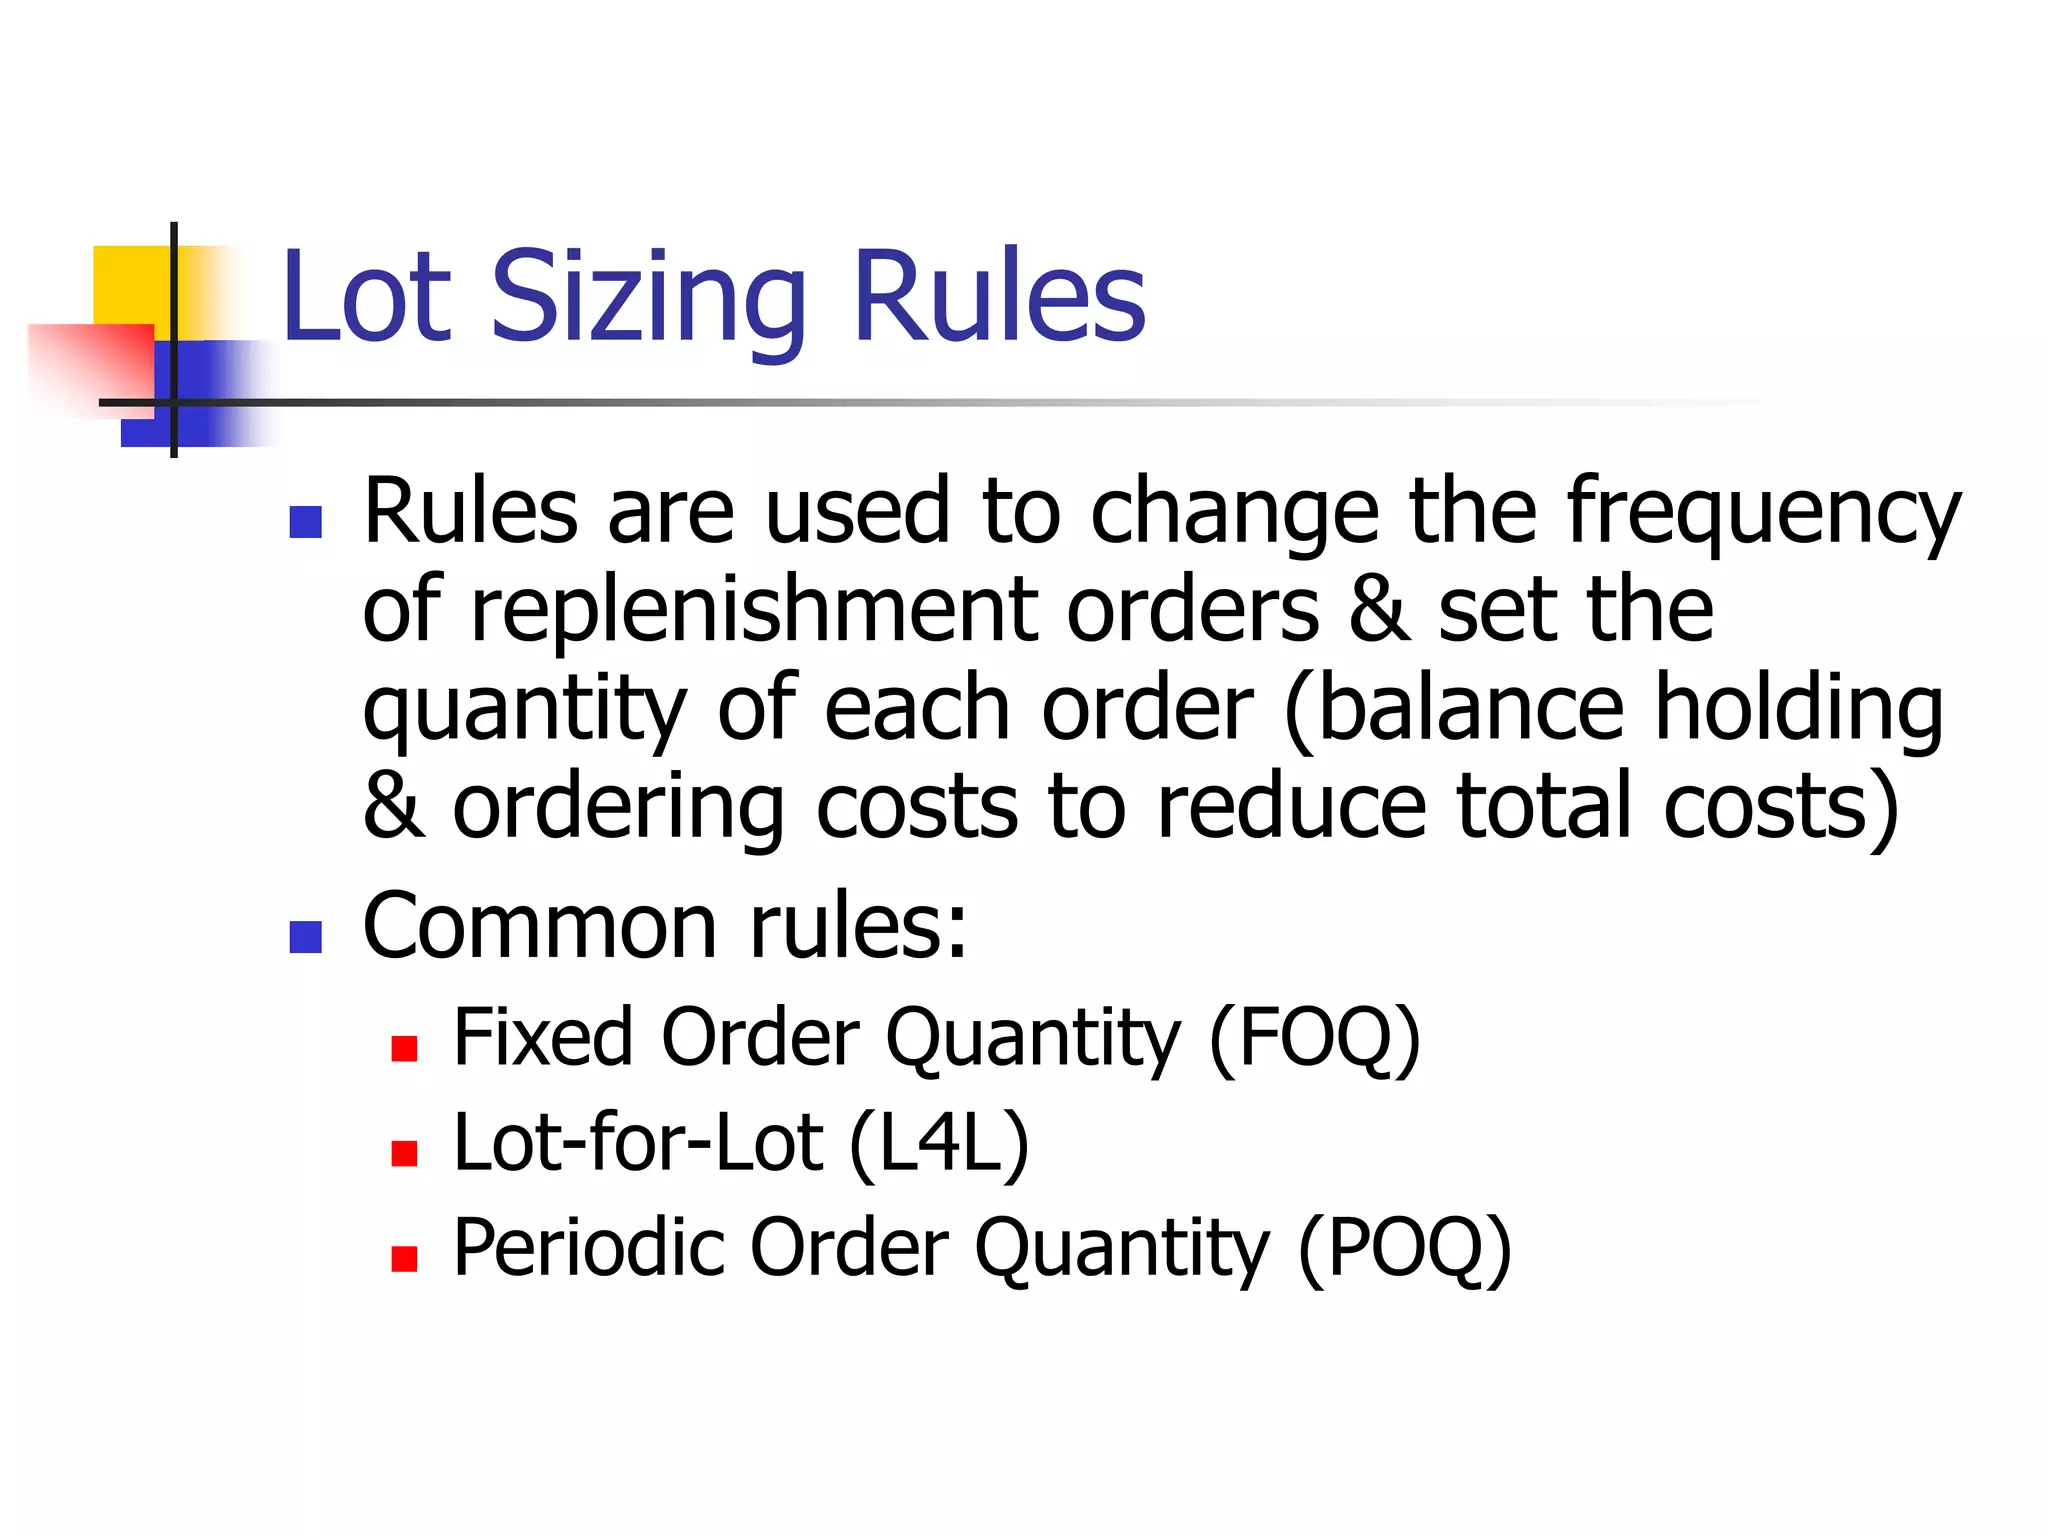


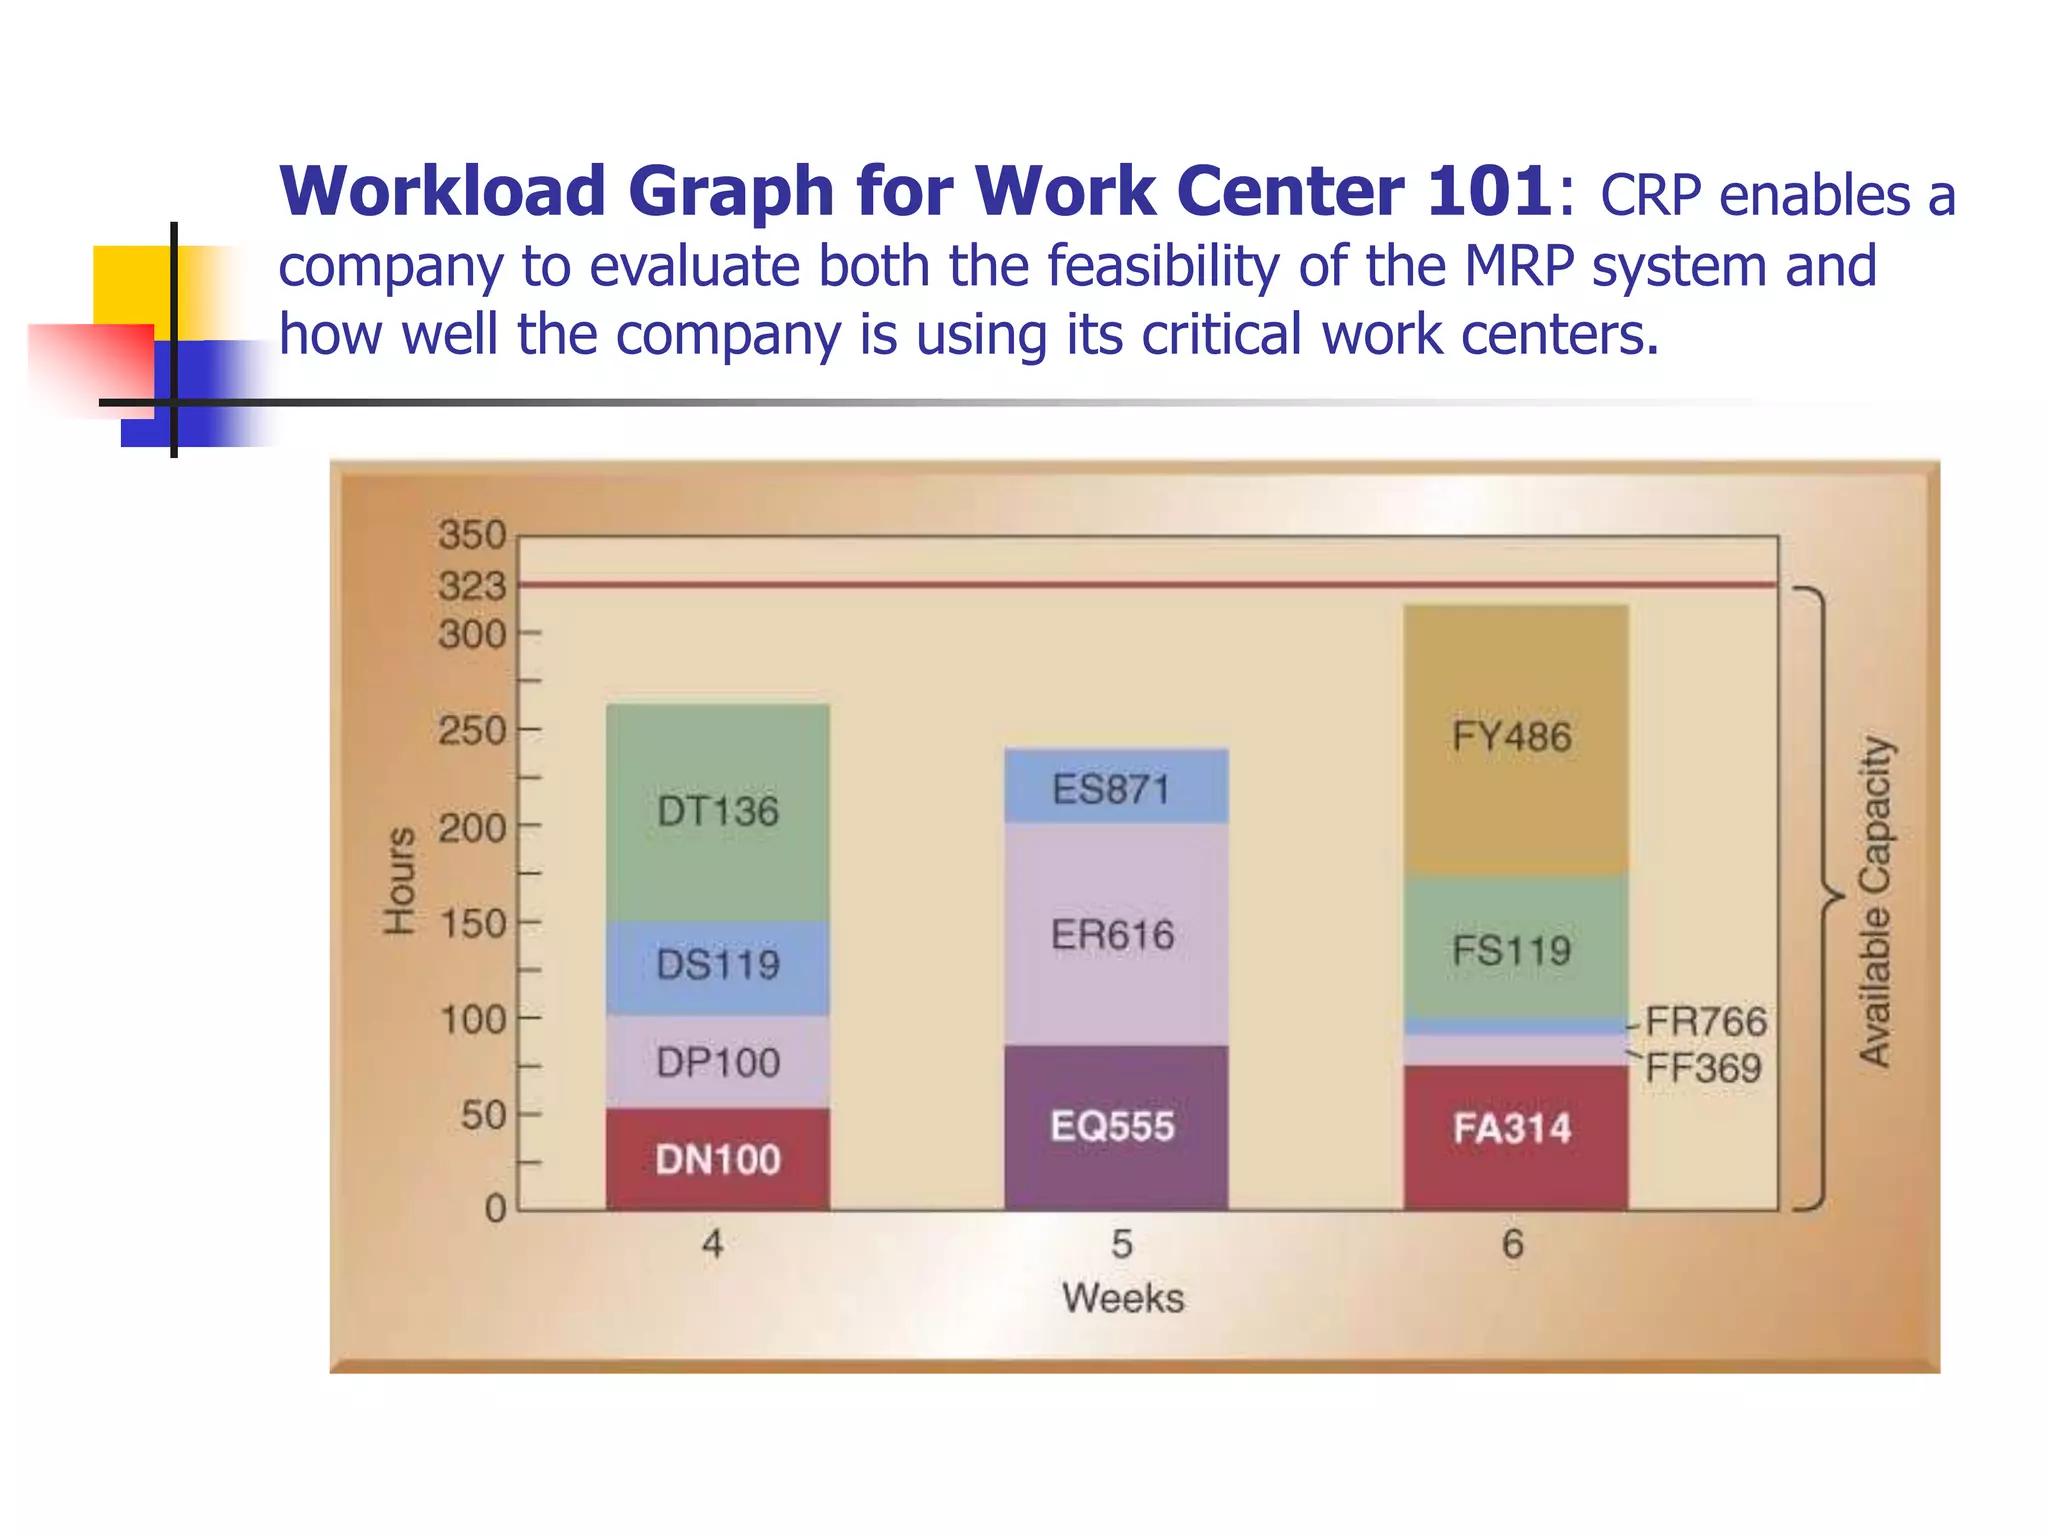
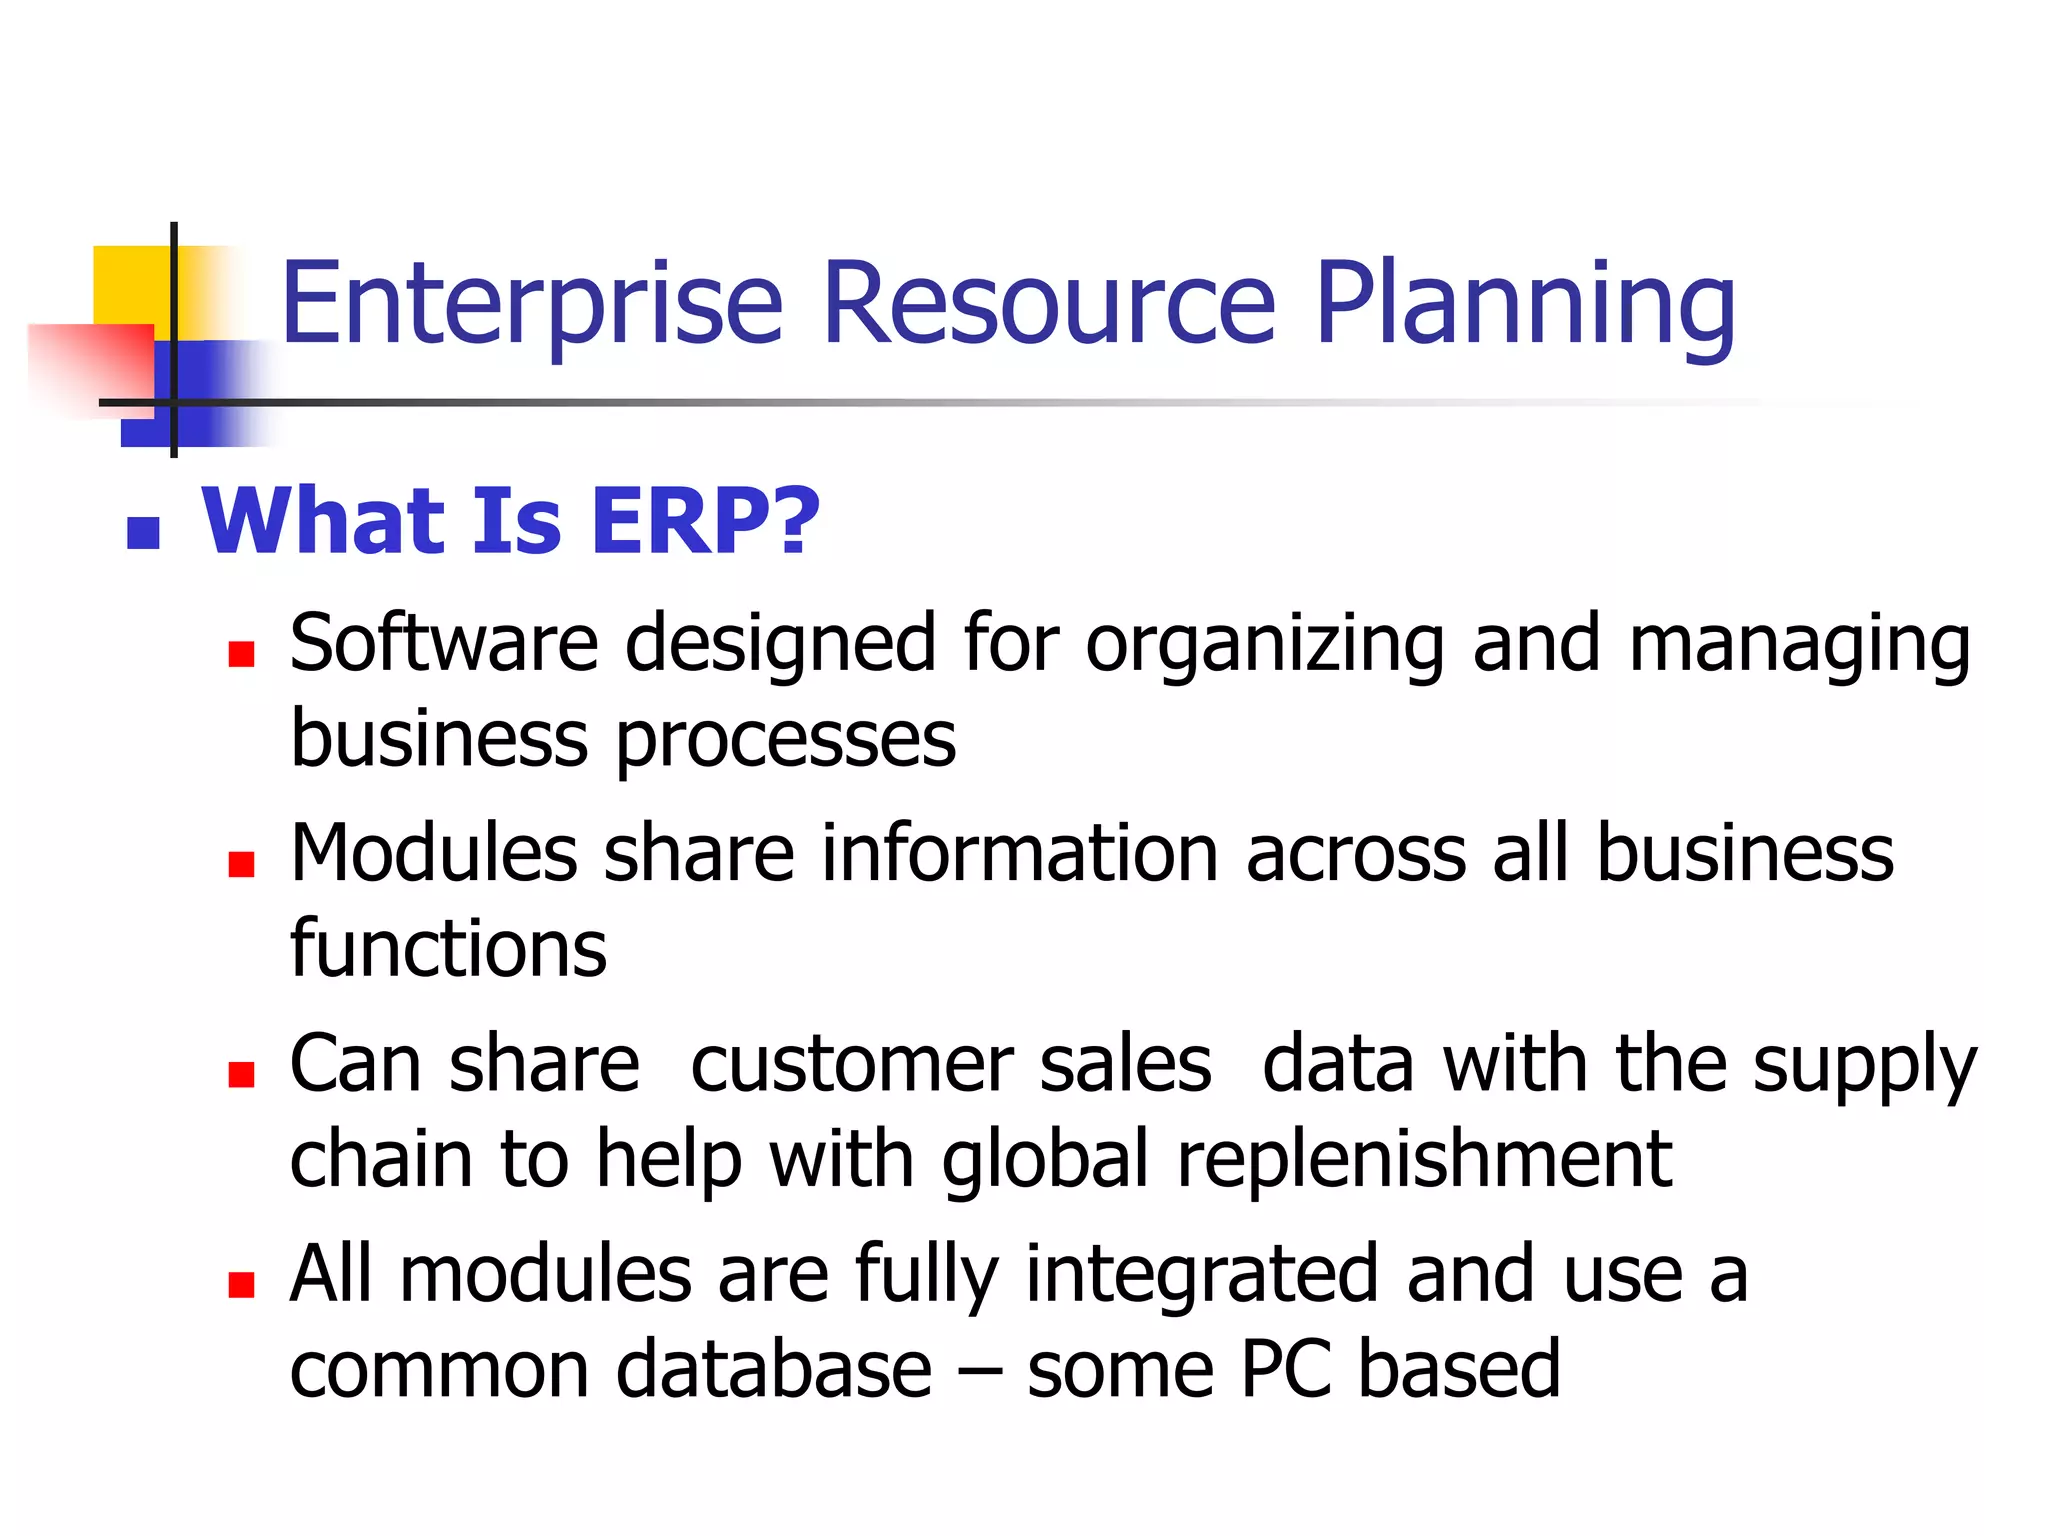
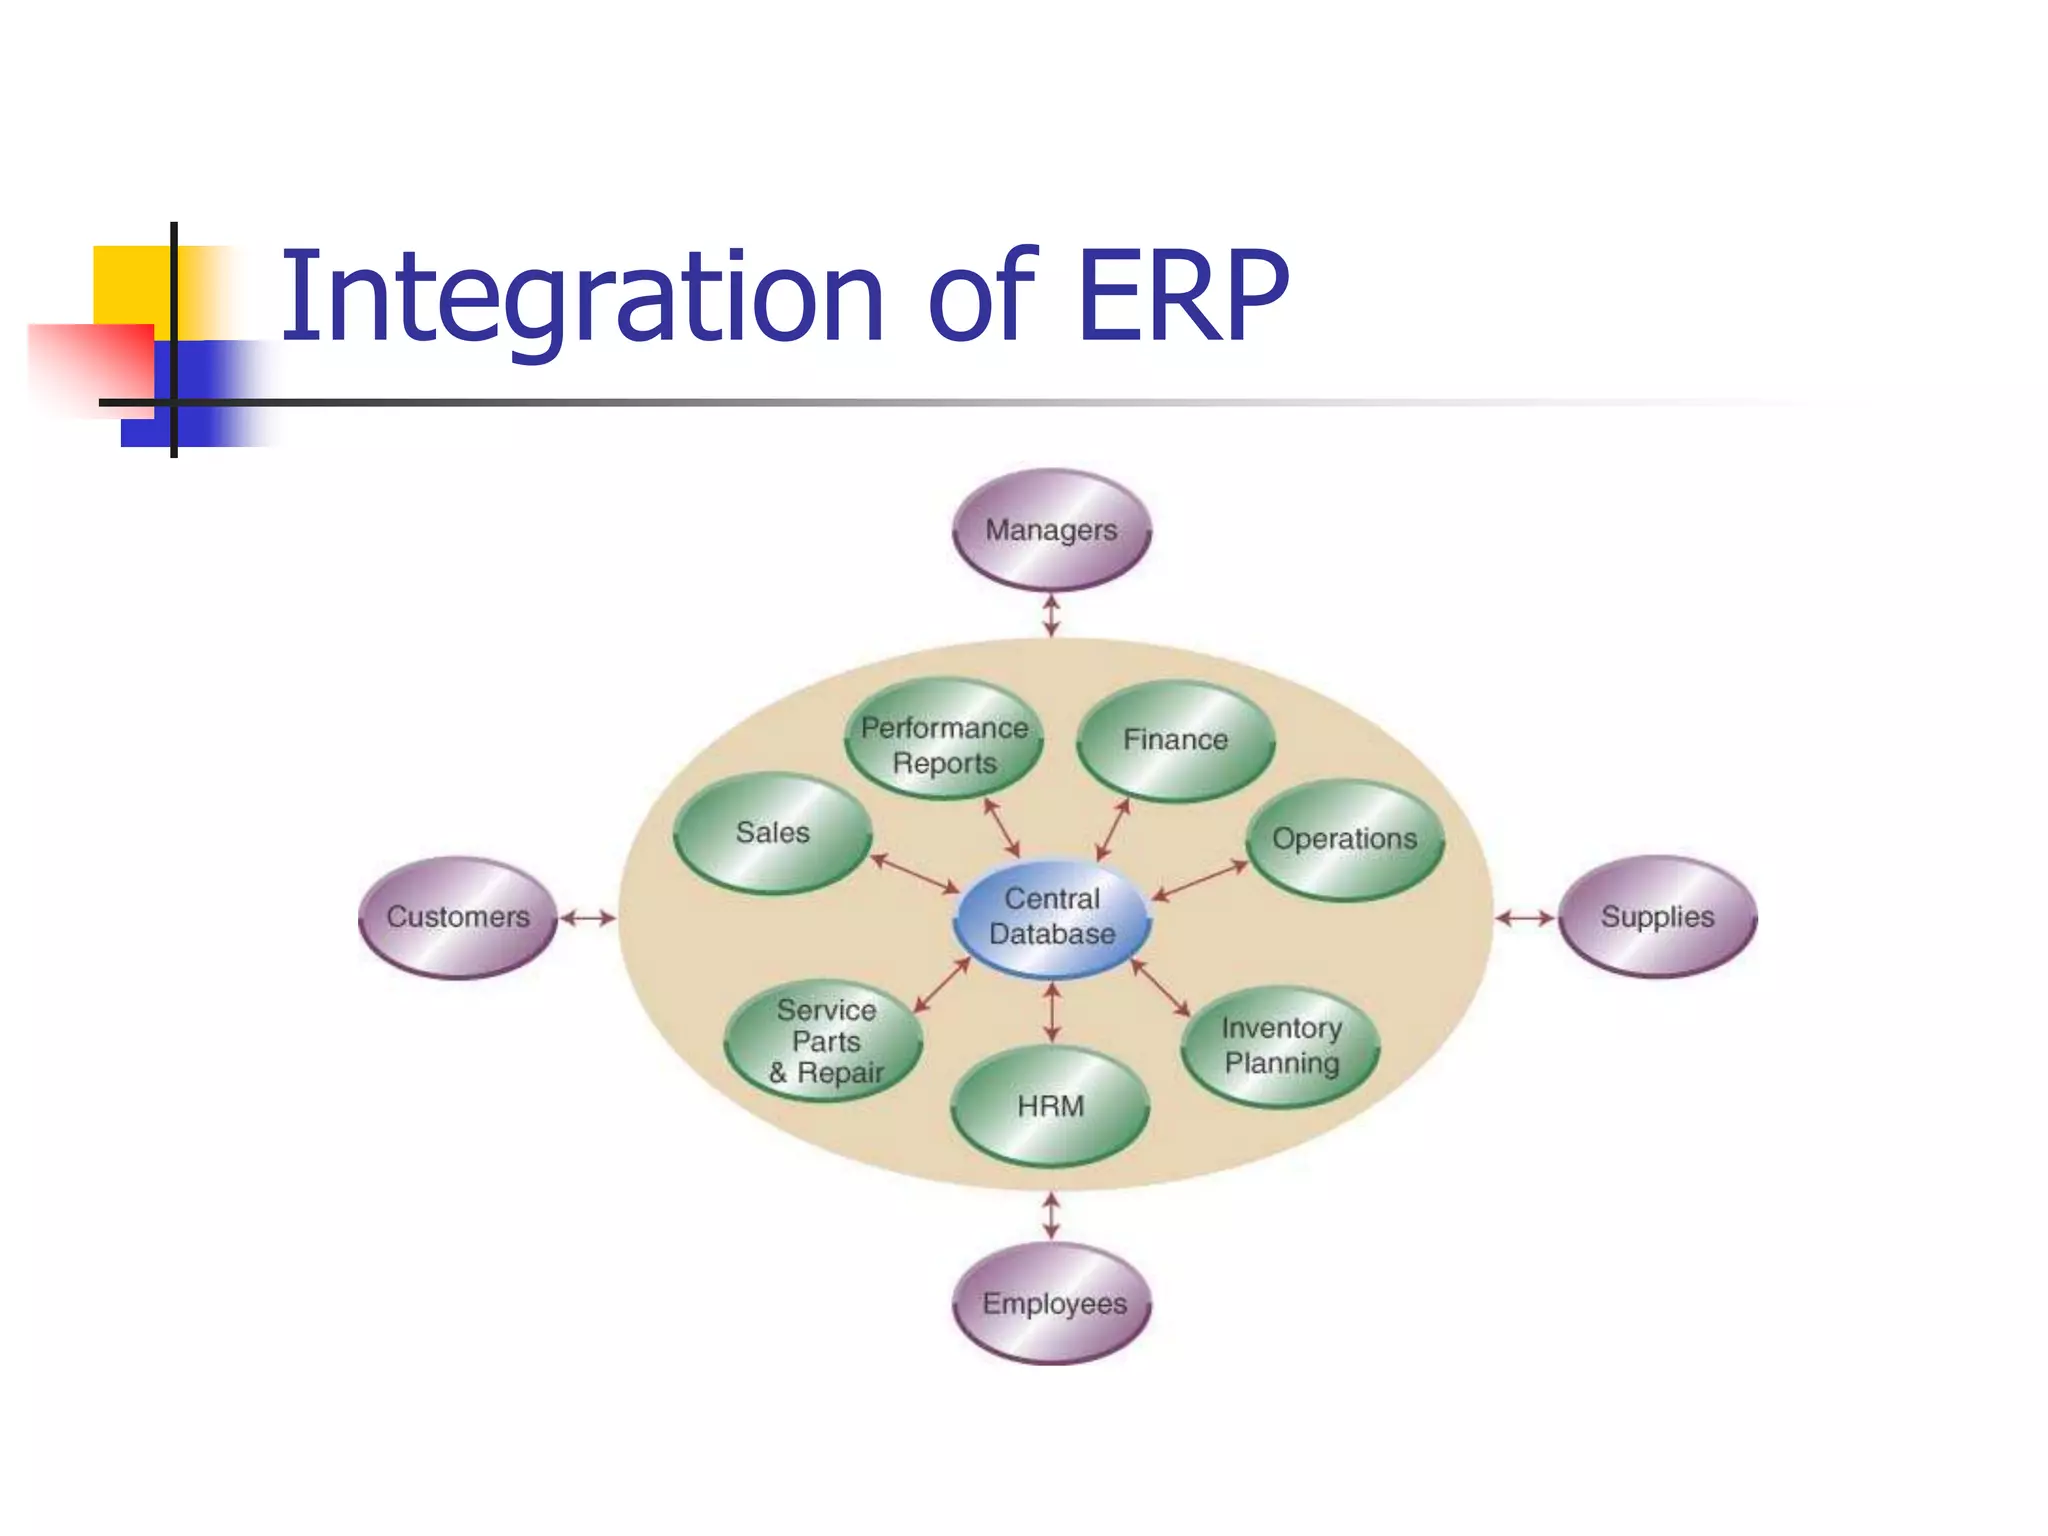


The document provides an overview of resource planning systems like MRP and ERP. It describes the types of demand, evolution of material planning systems, and key components and processes of MRP like inputs, outputs, objectives, bills of materials, and lot sizing rules. It also discusses how ERP builds on MRP by integrating additional business functions for a holistic view of the organization. Benefits of ERP implementation include increased information flow and ability to replace disparate systems, though implementation requires significant costs, time, and management commitment.


