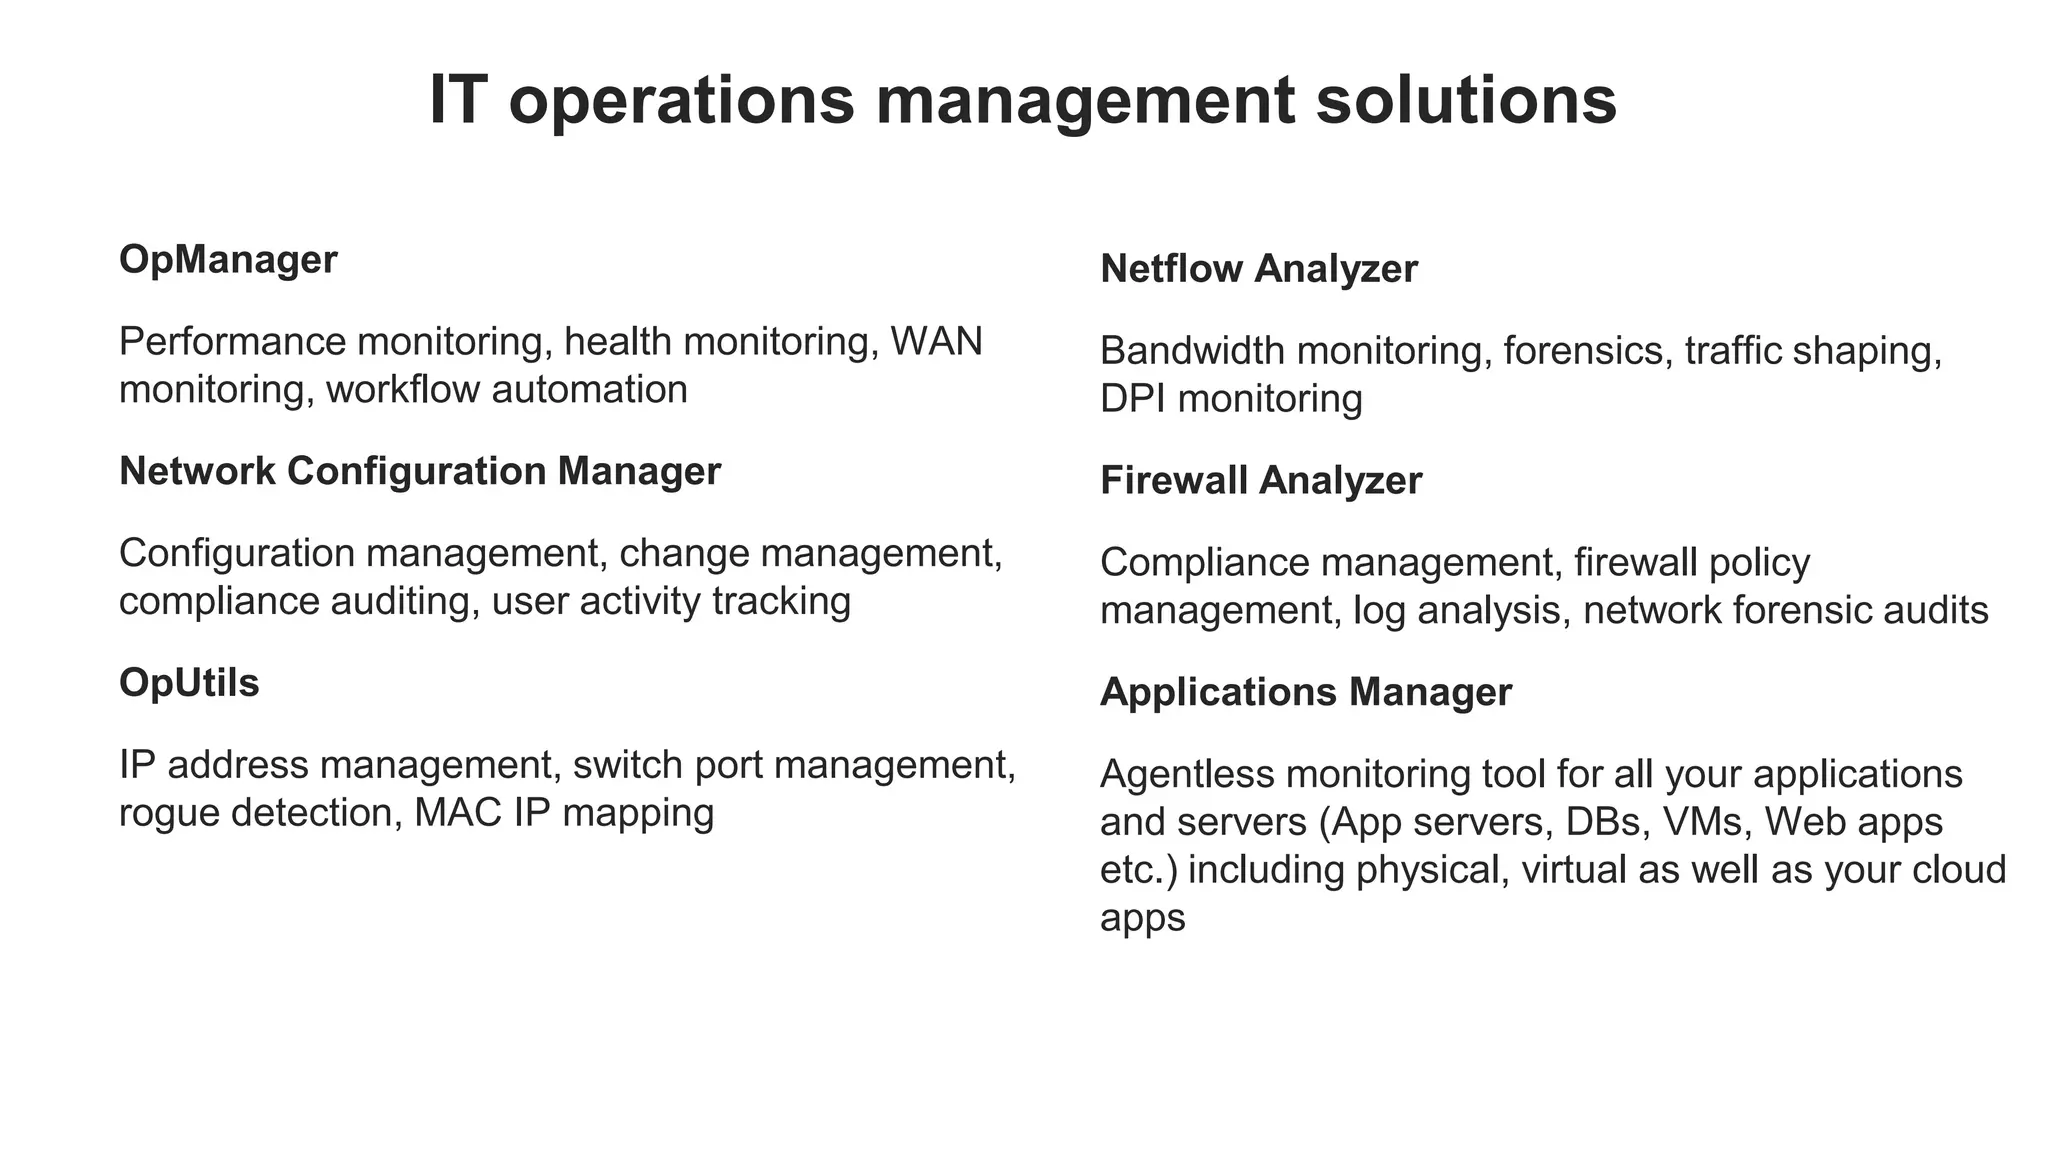
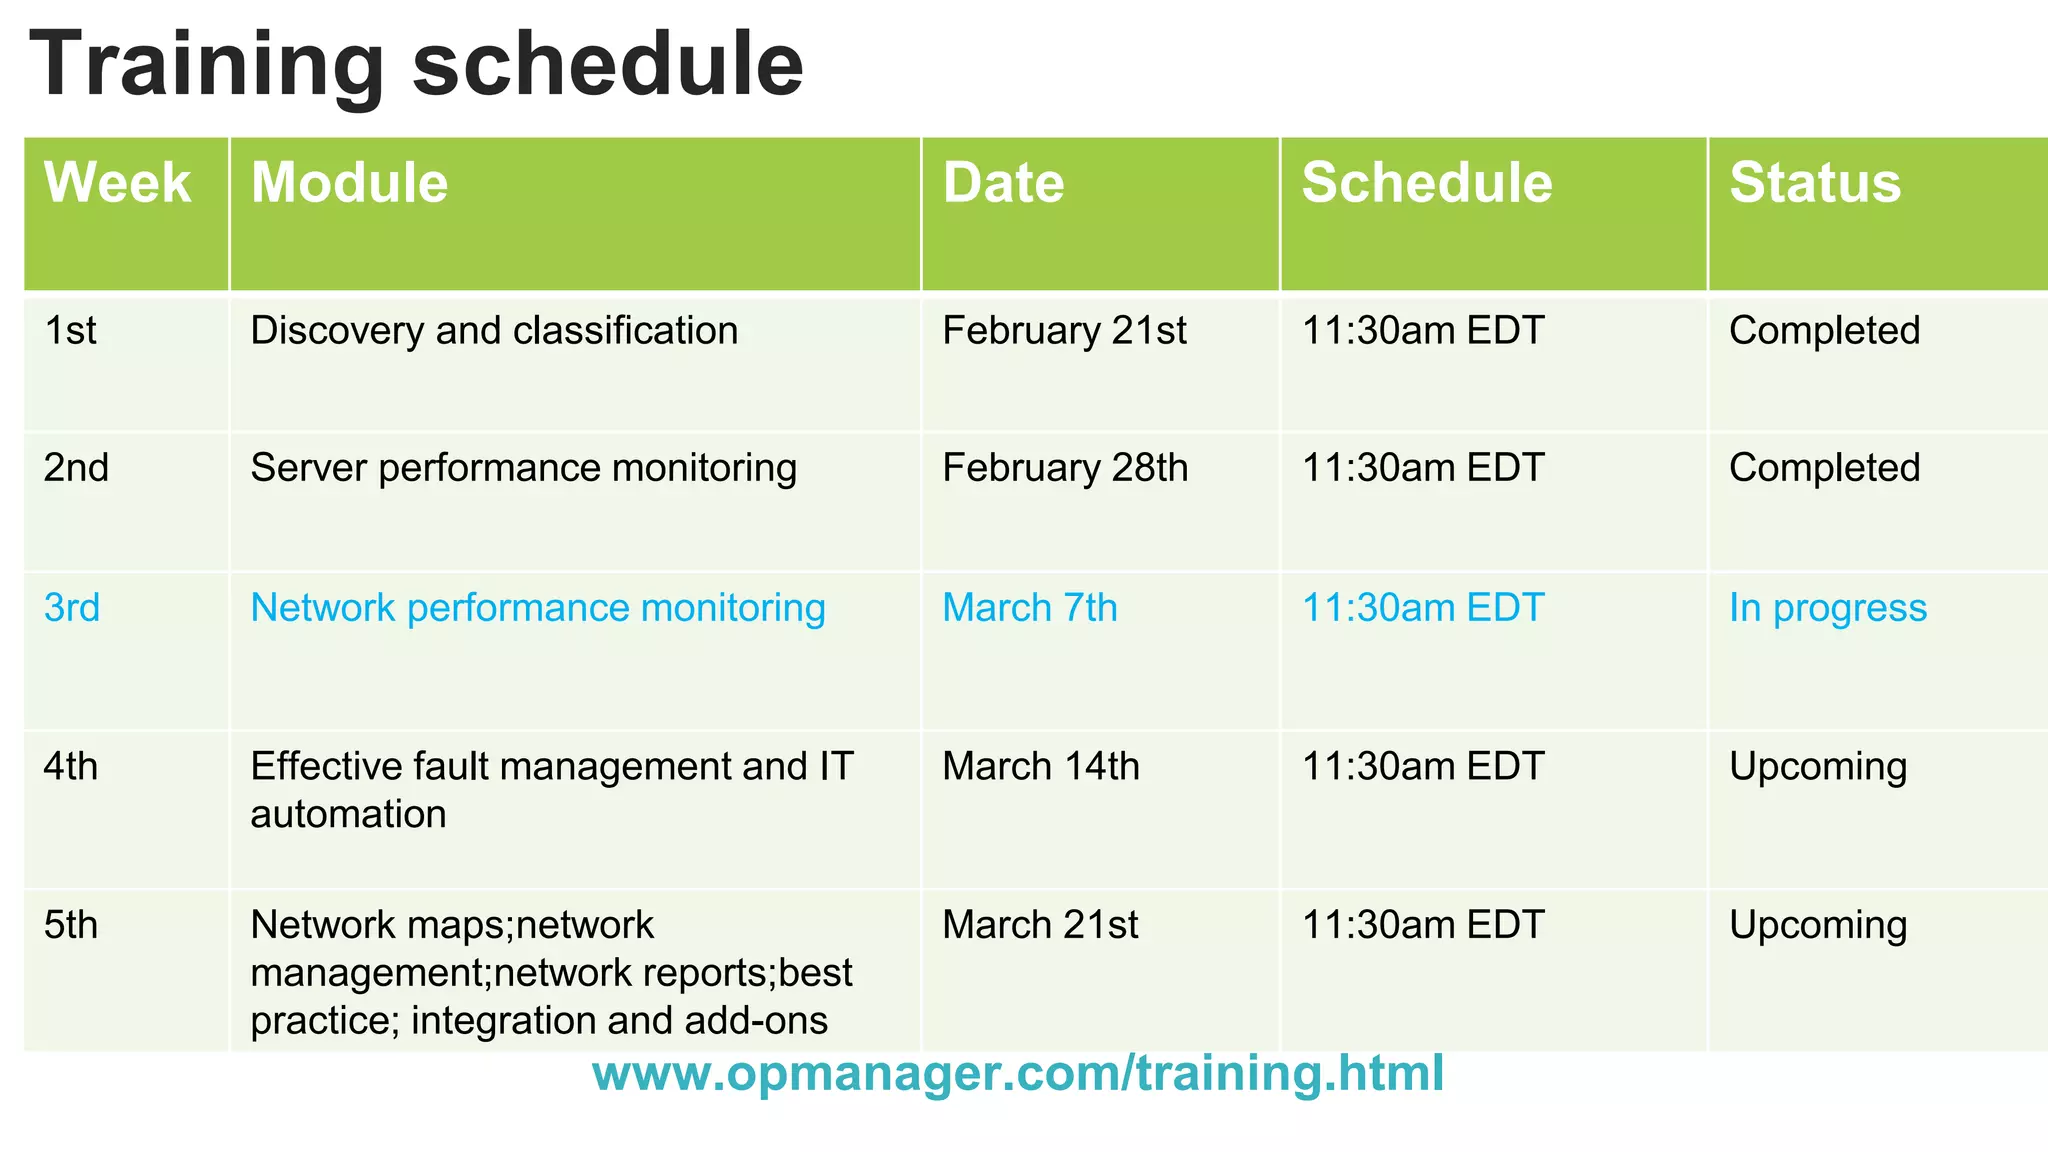
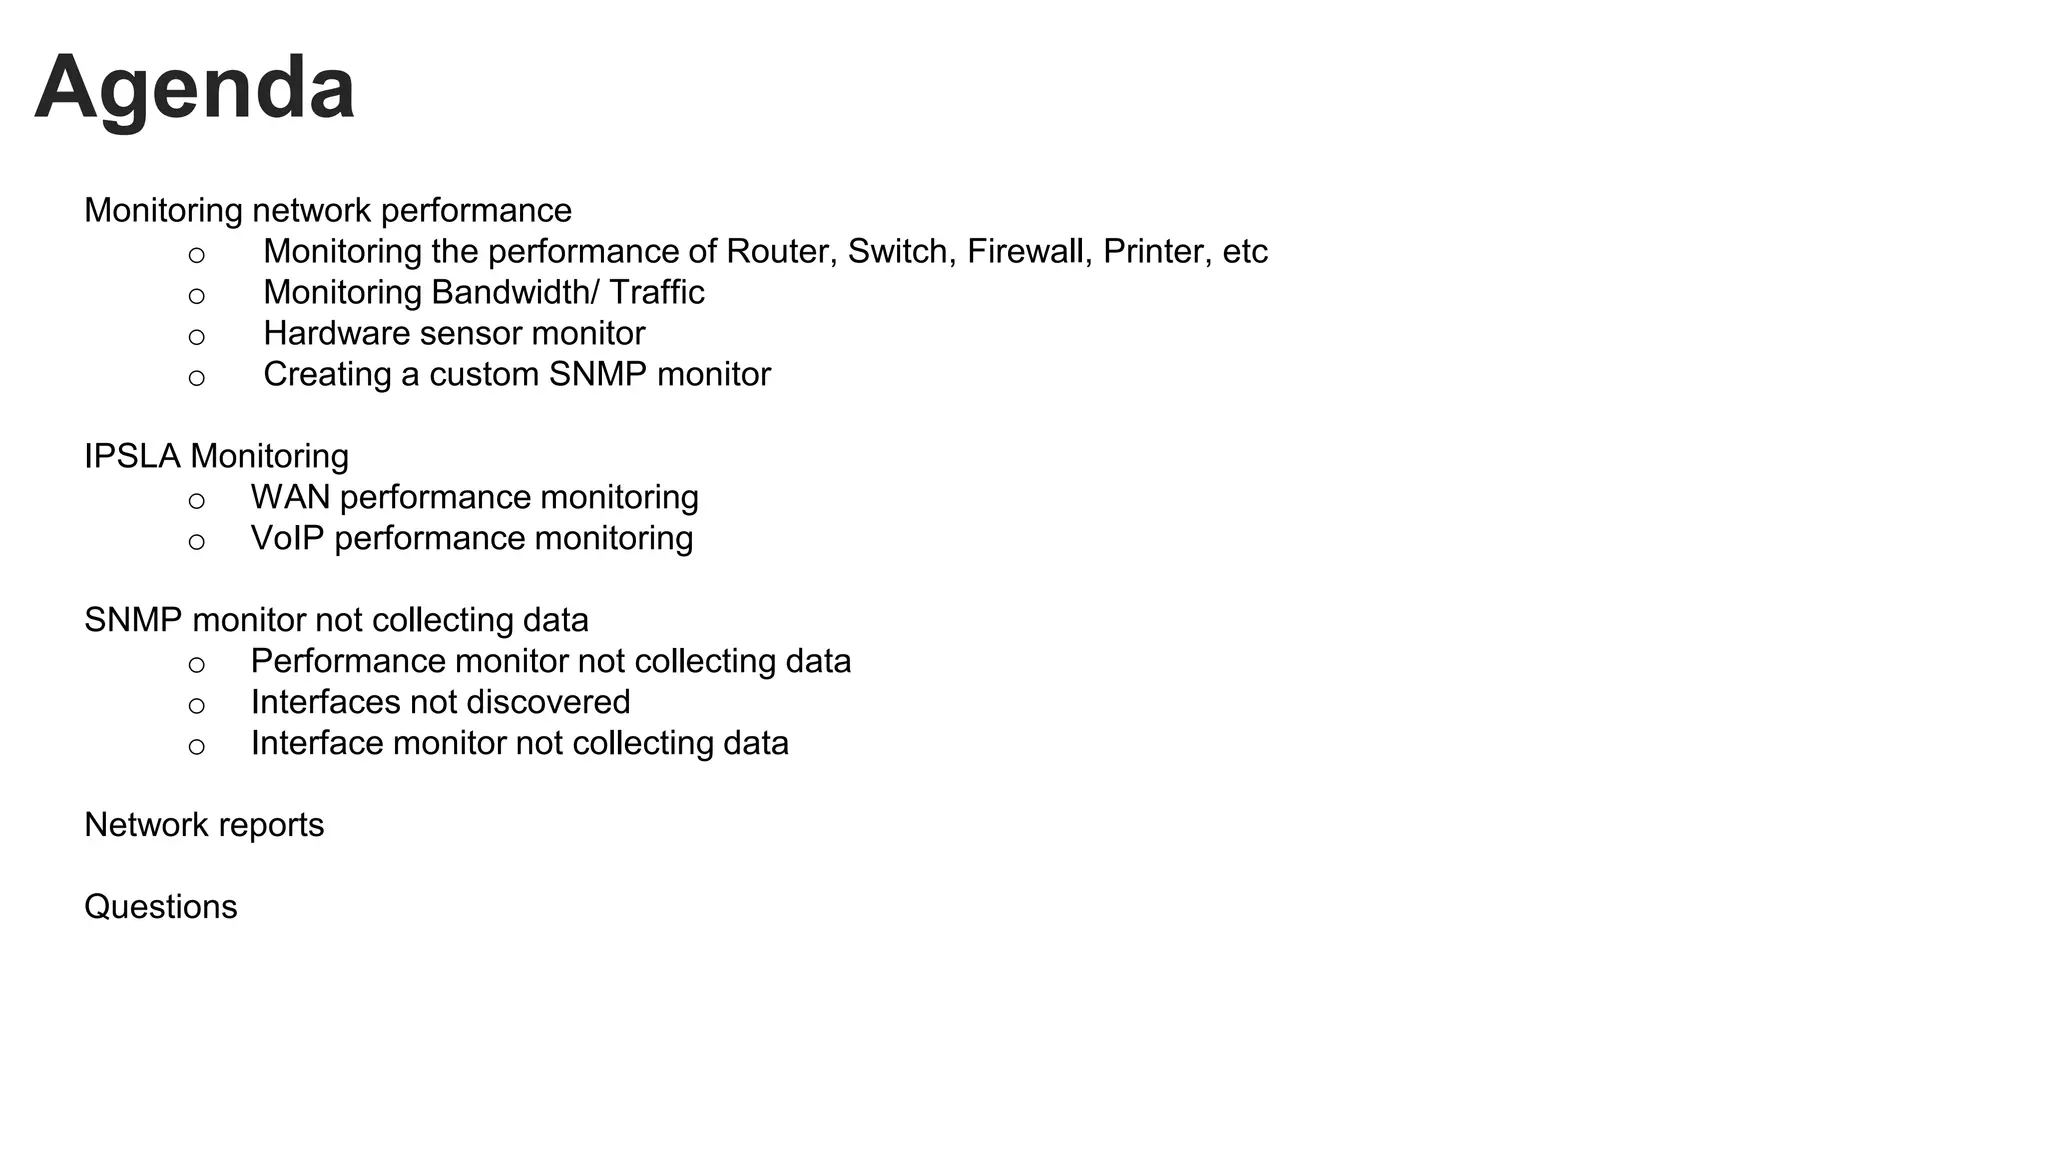
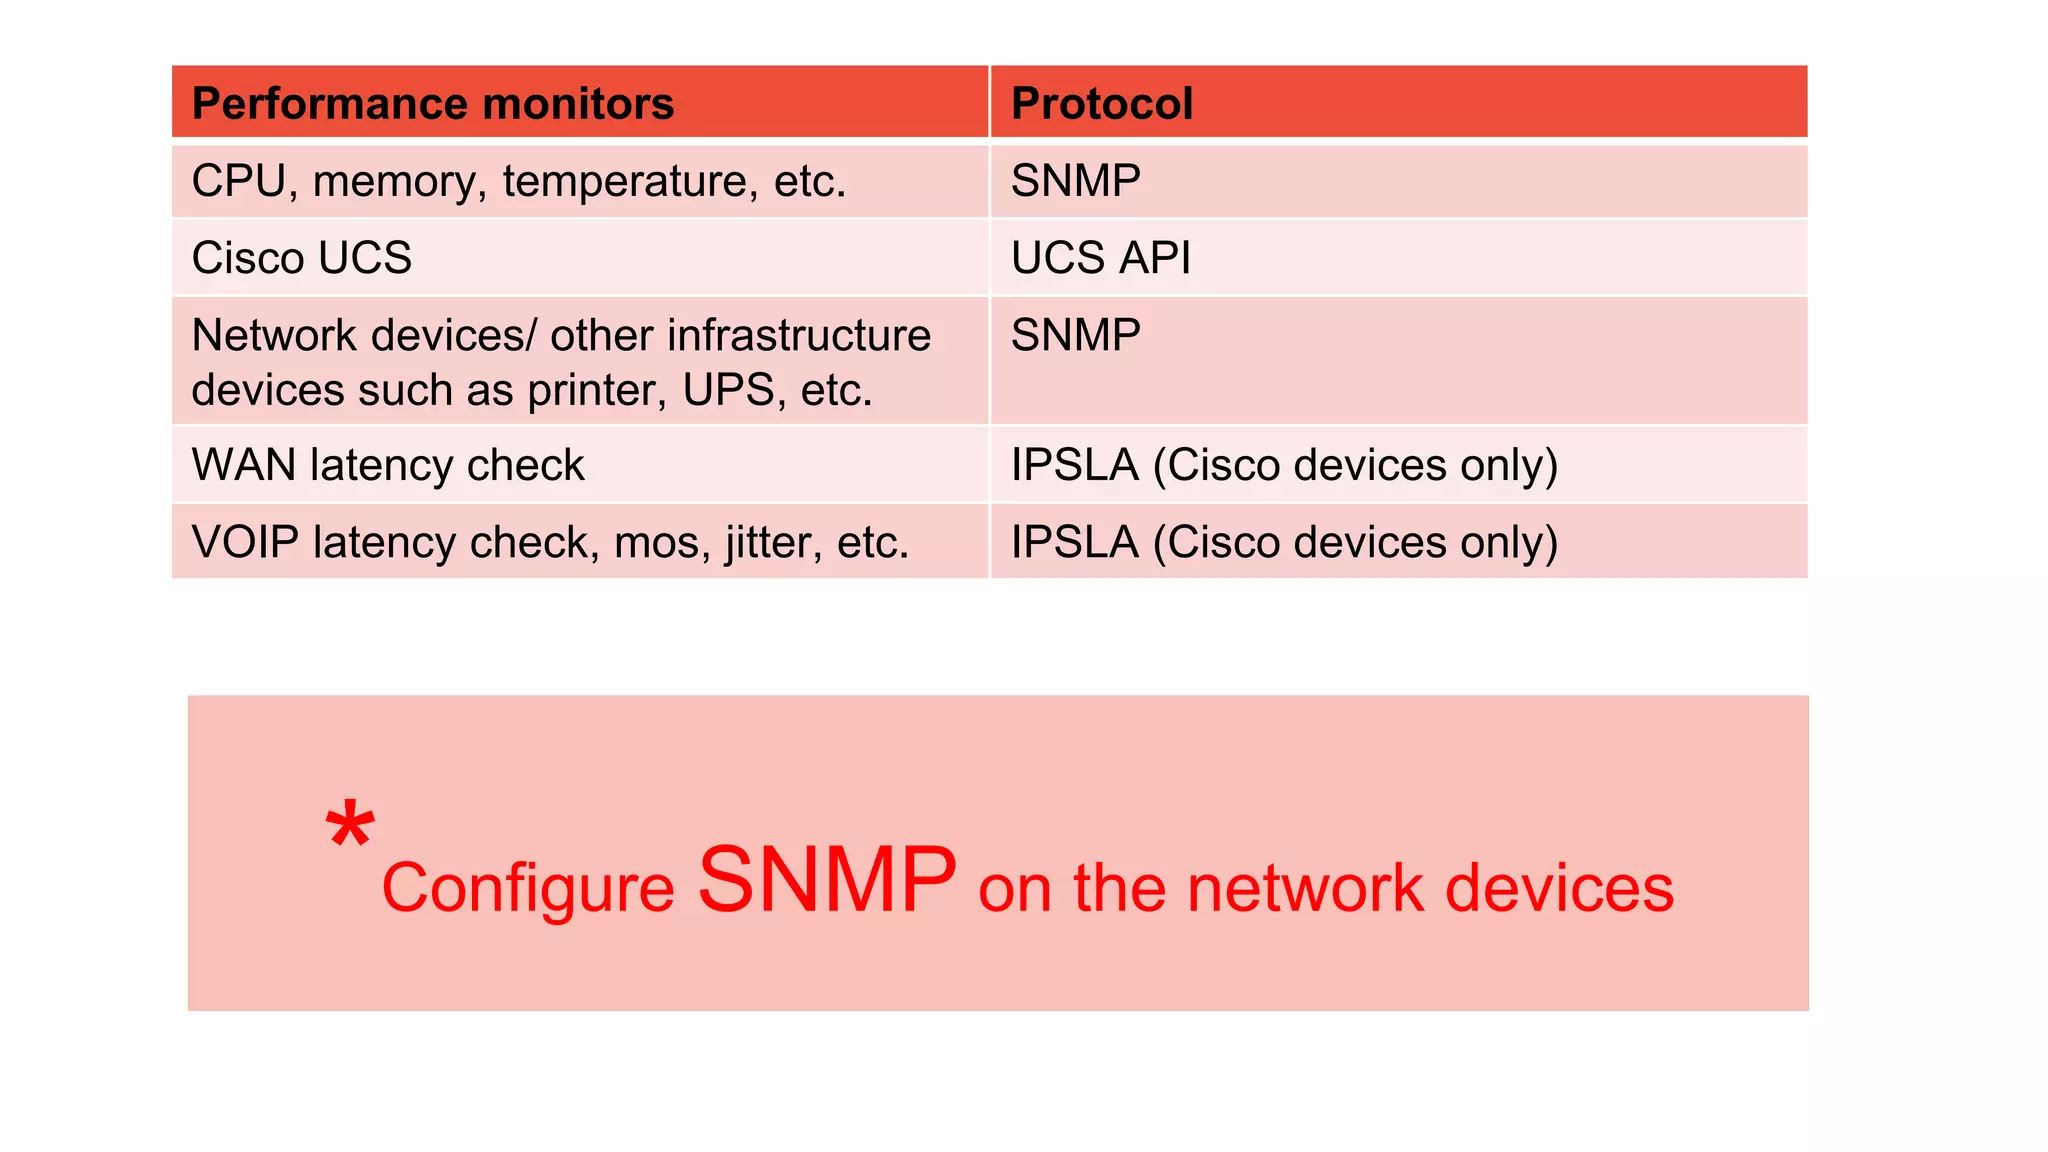
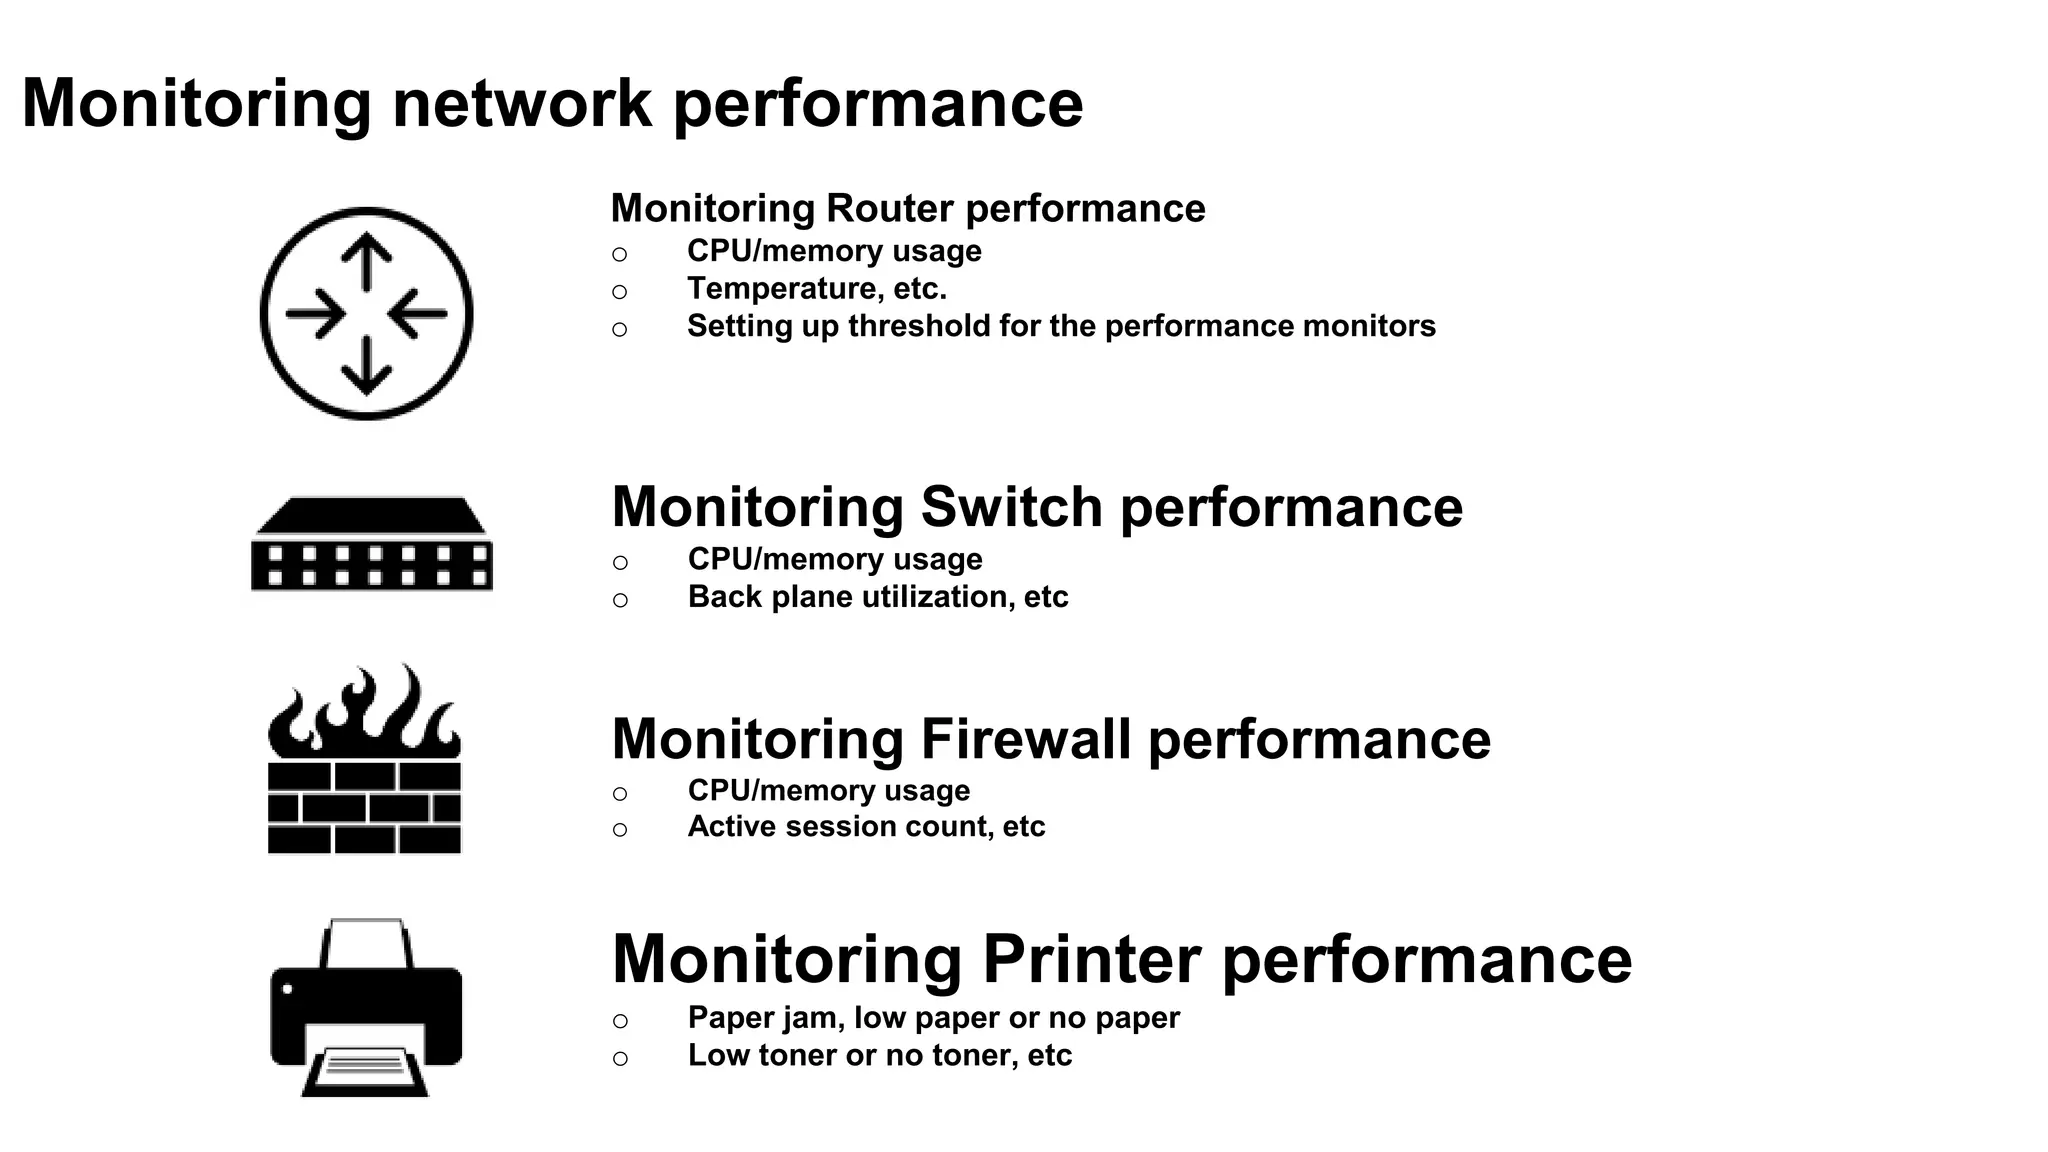
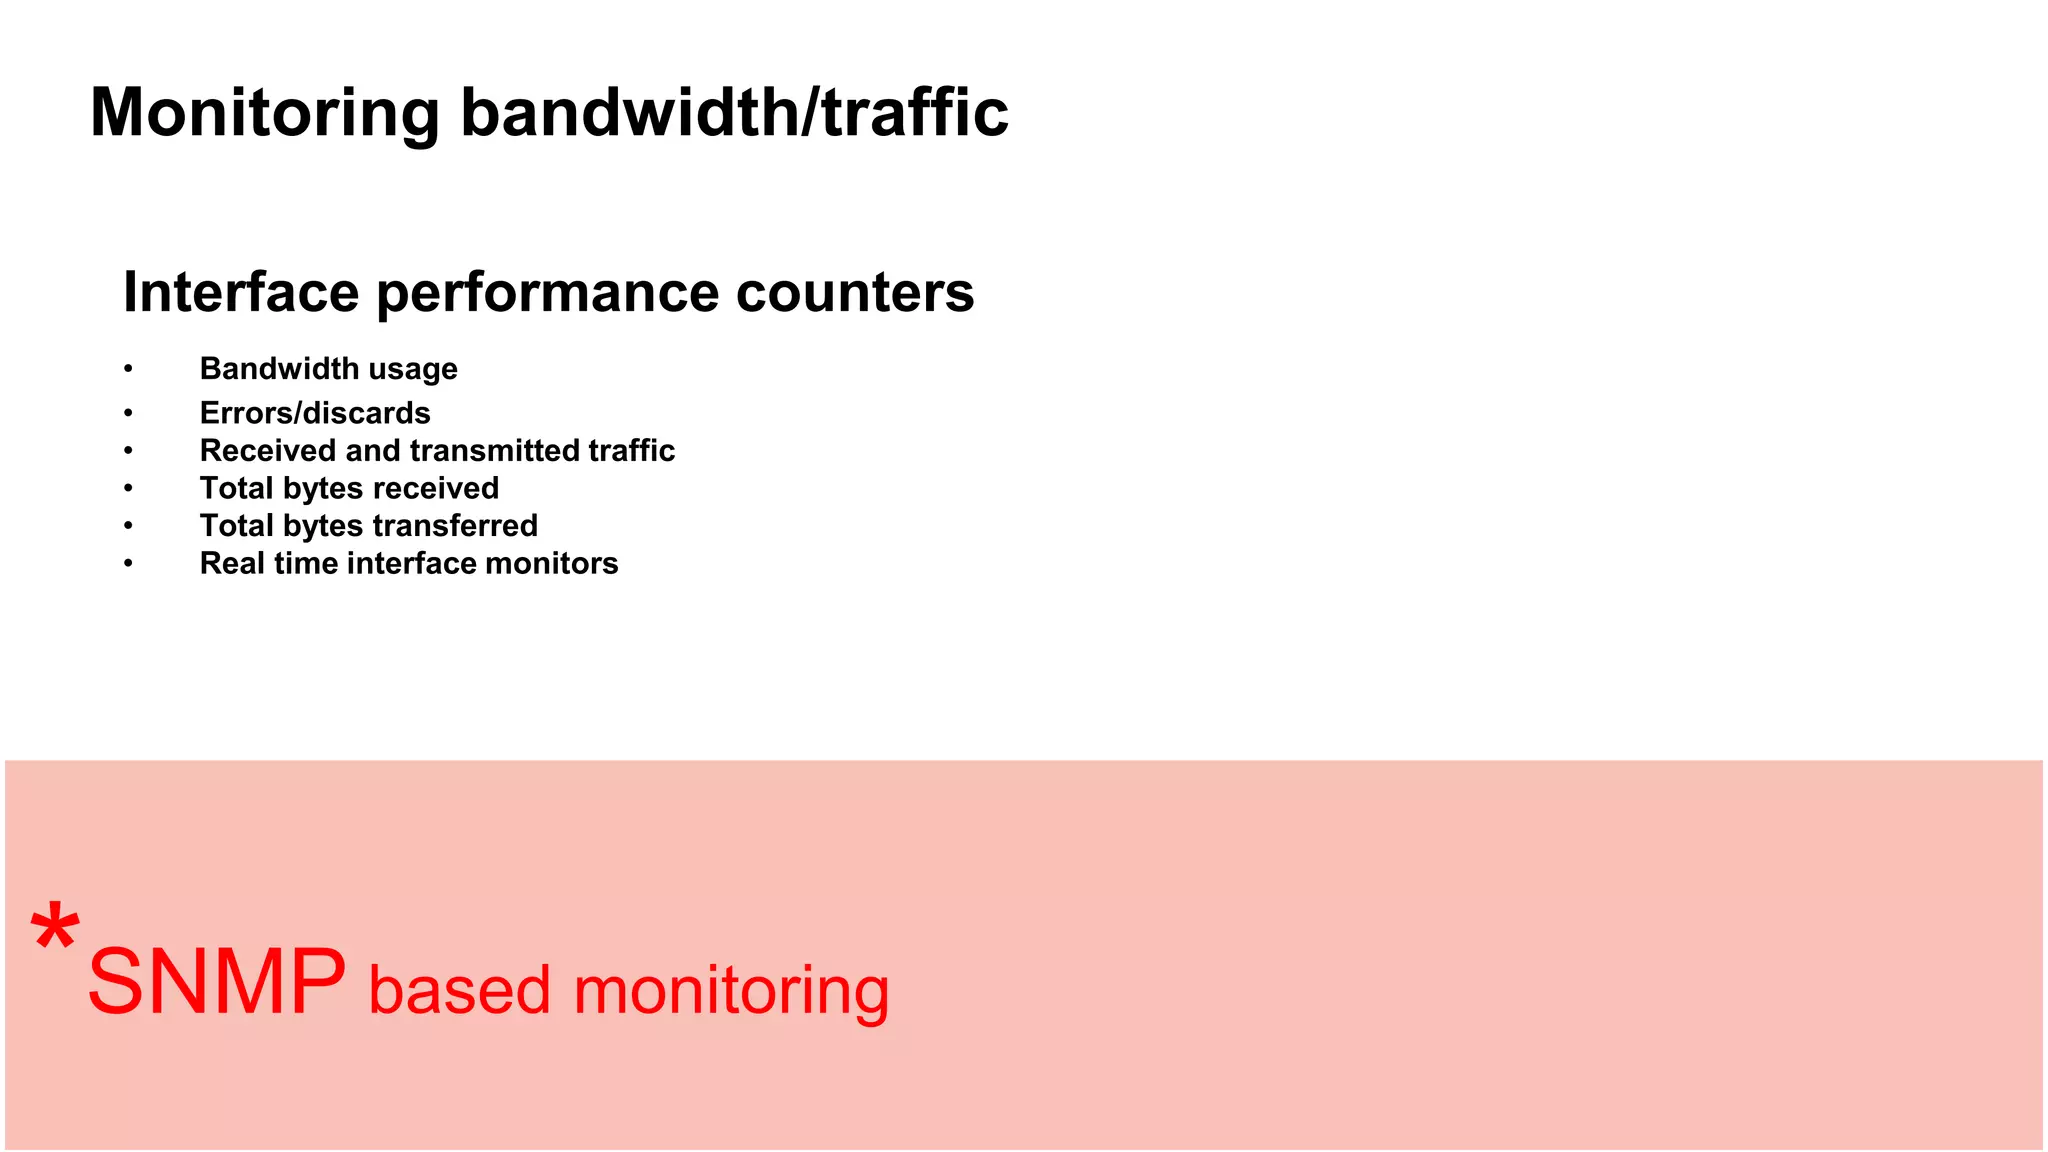
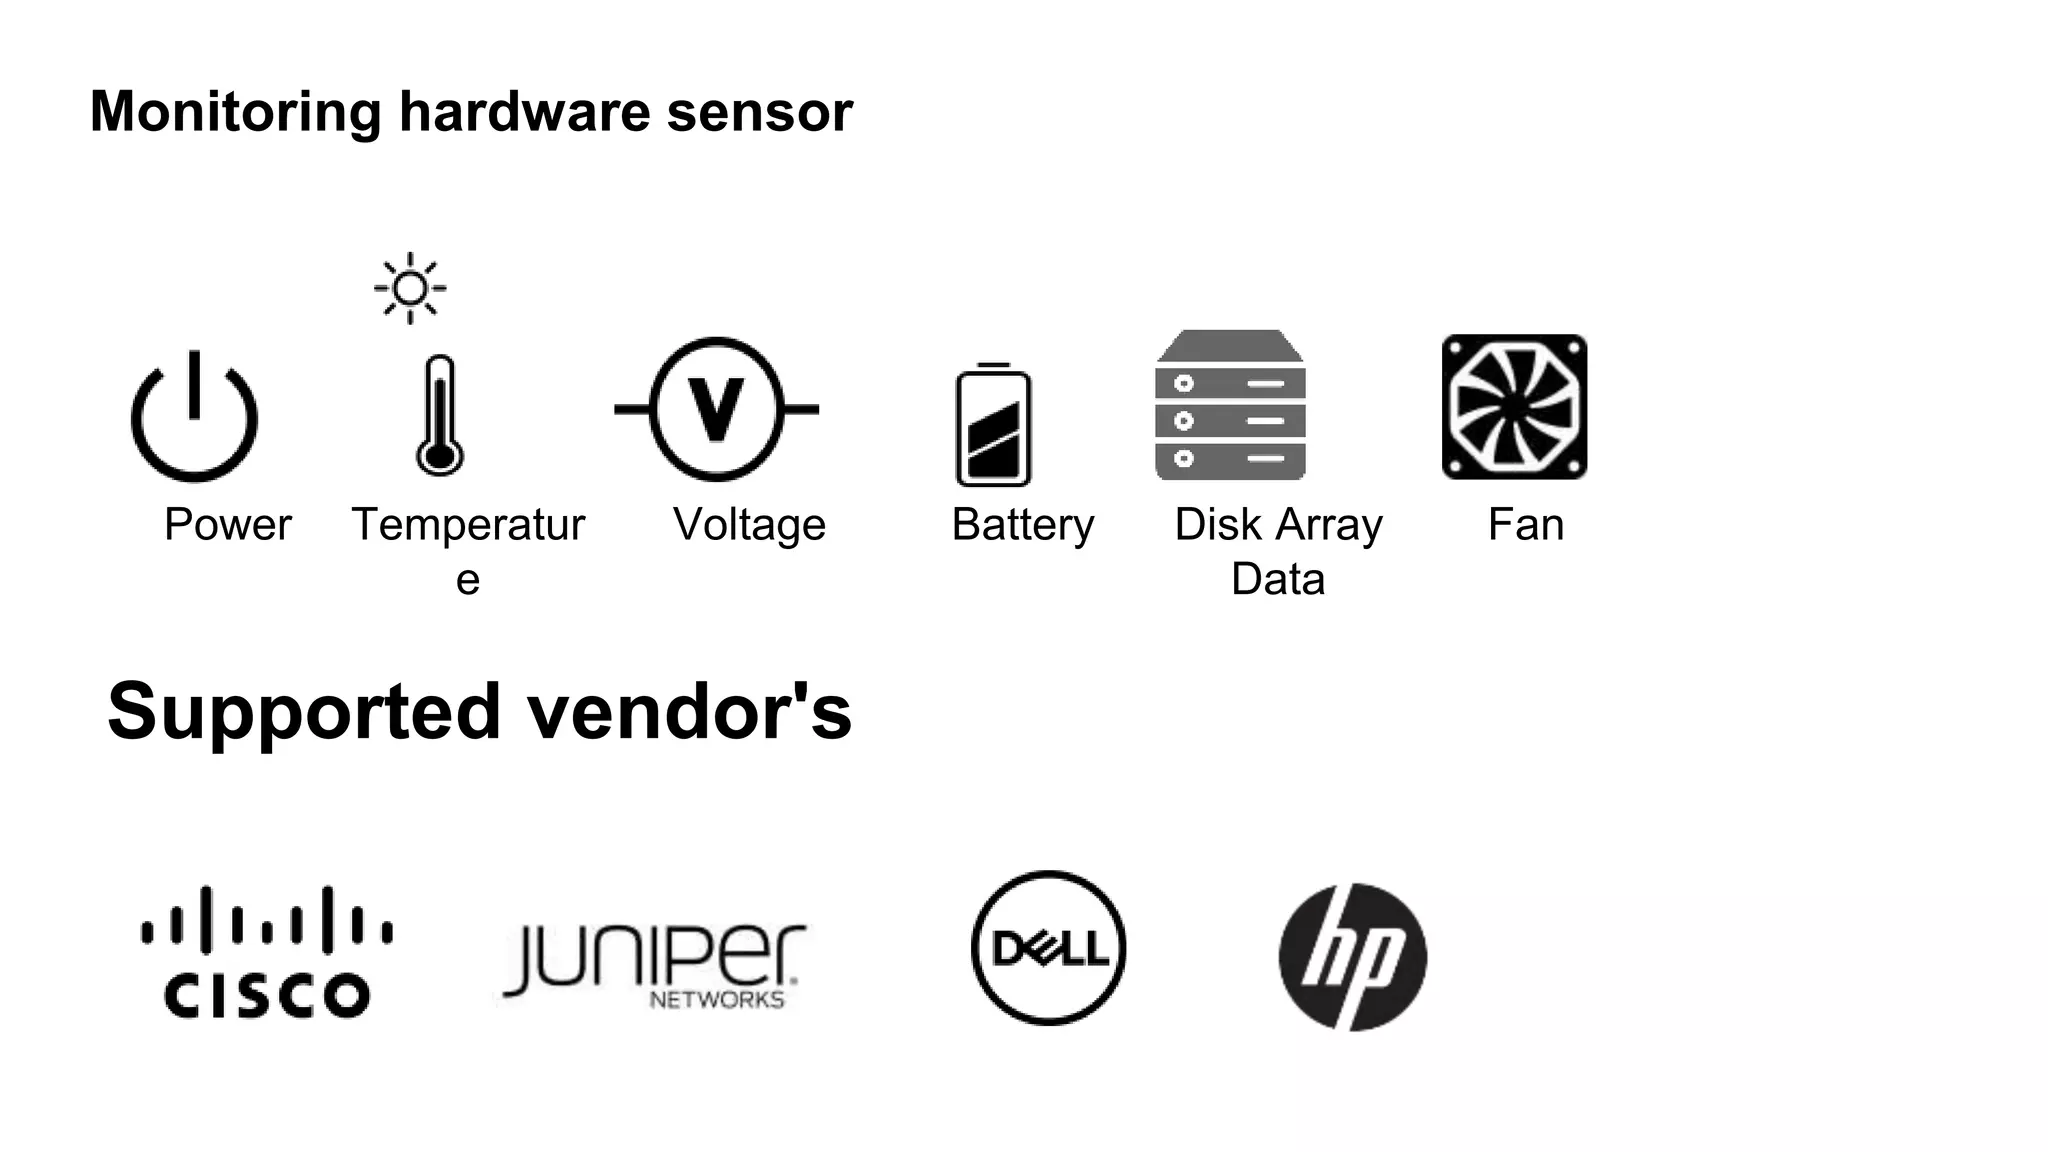
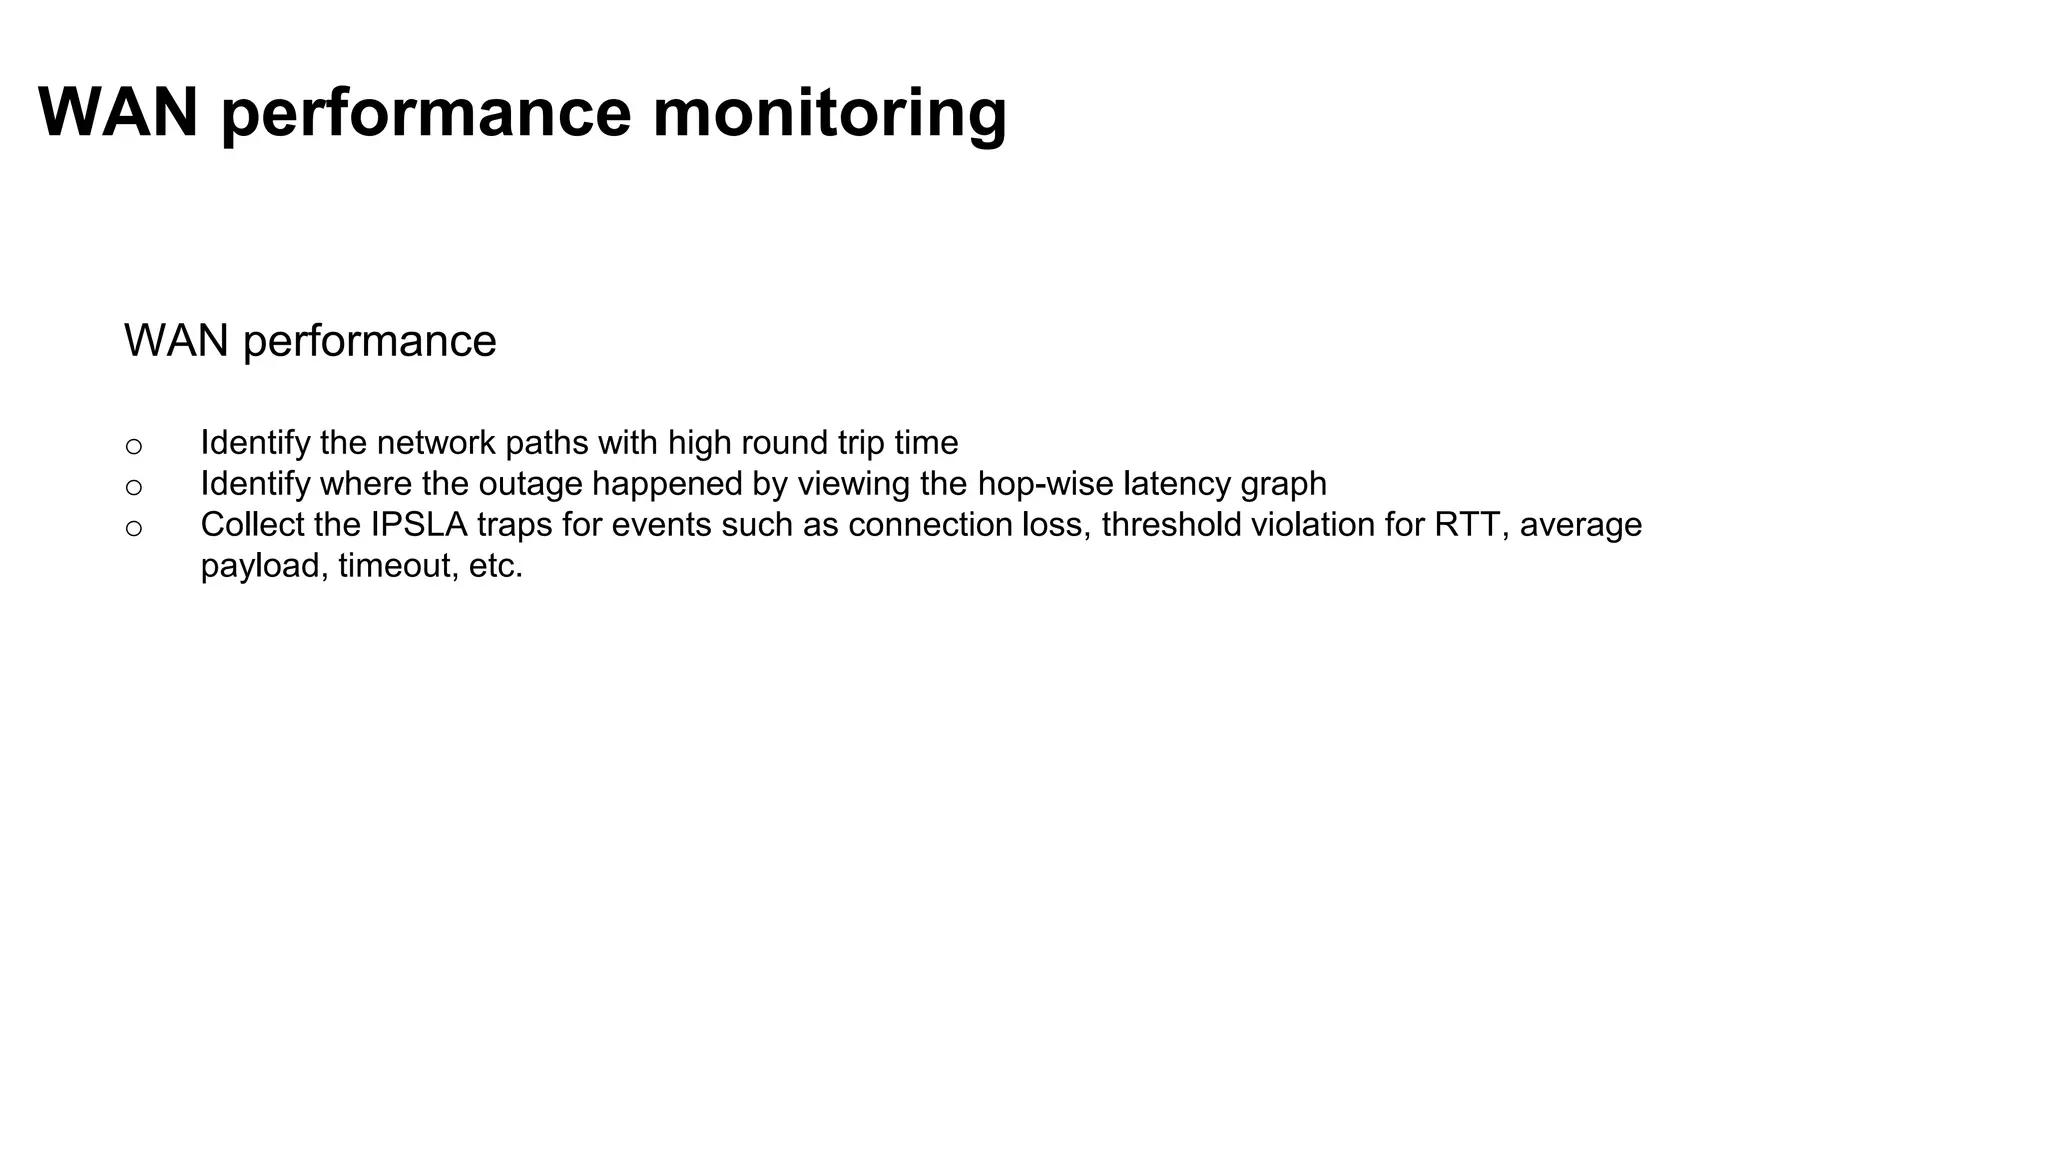
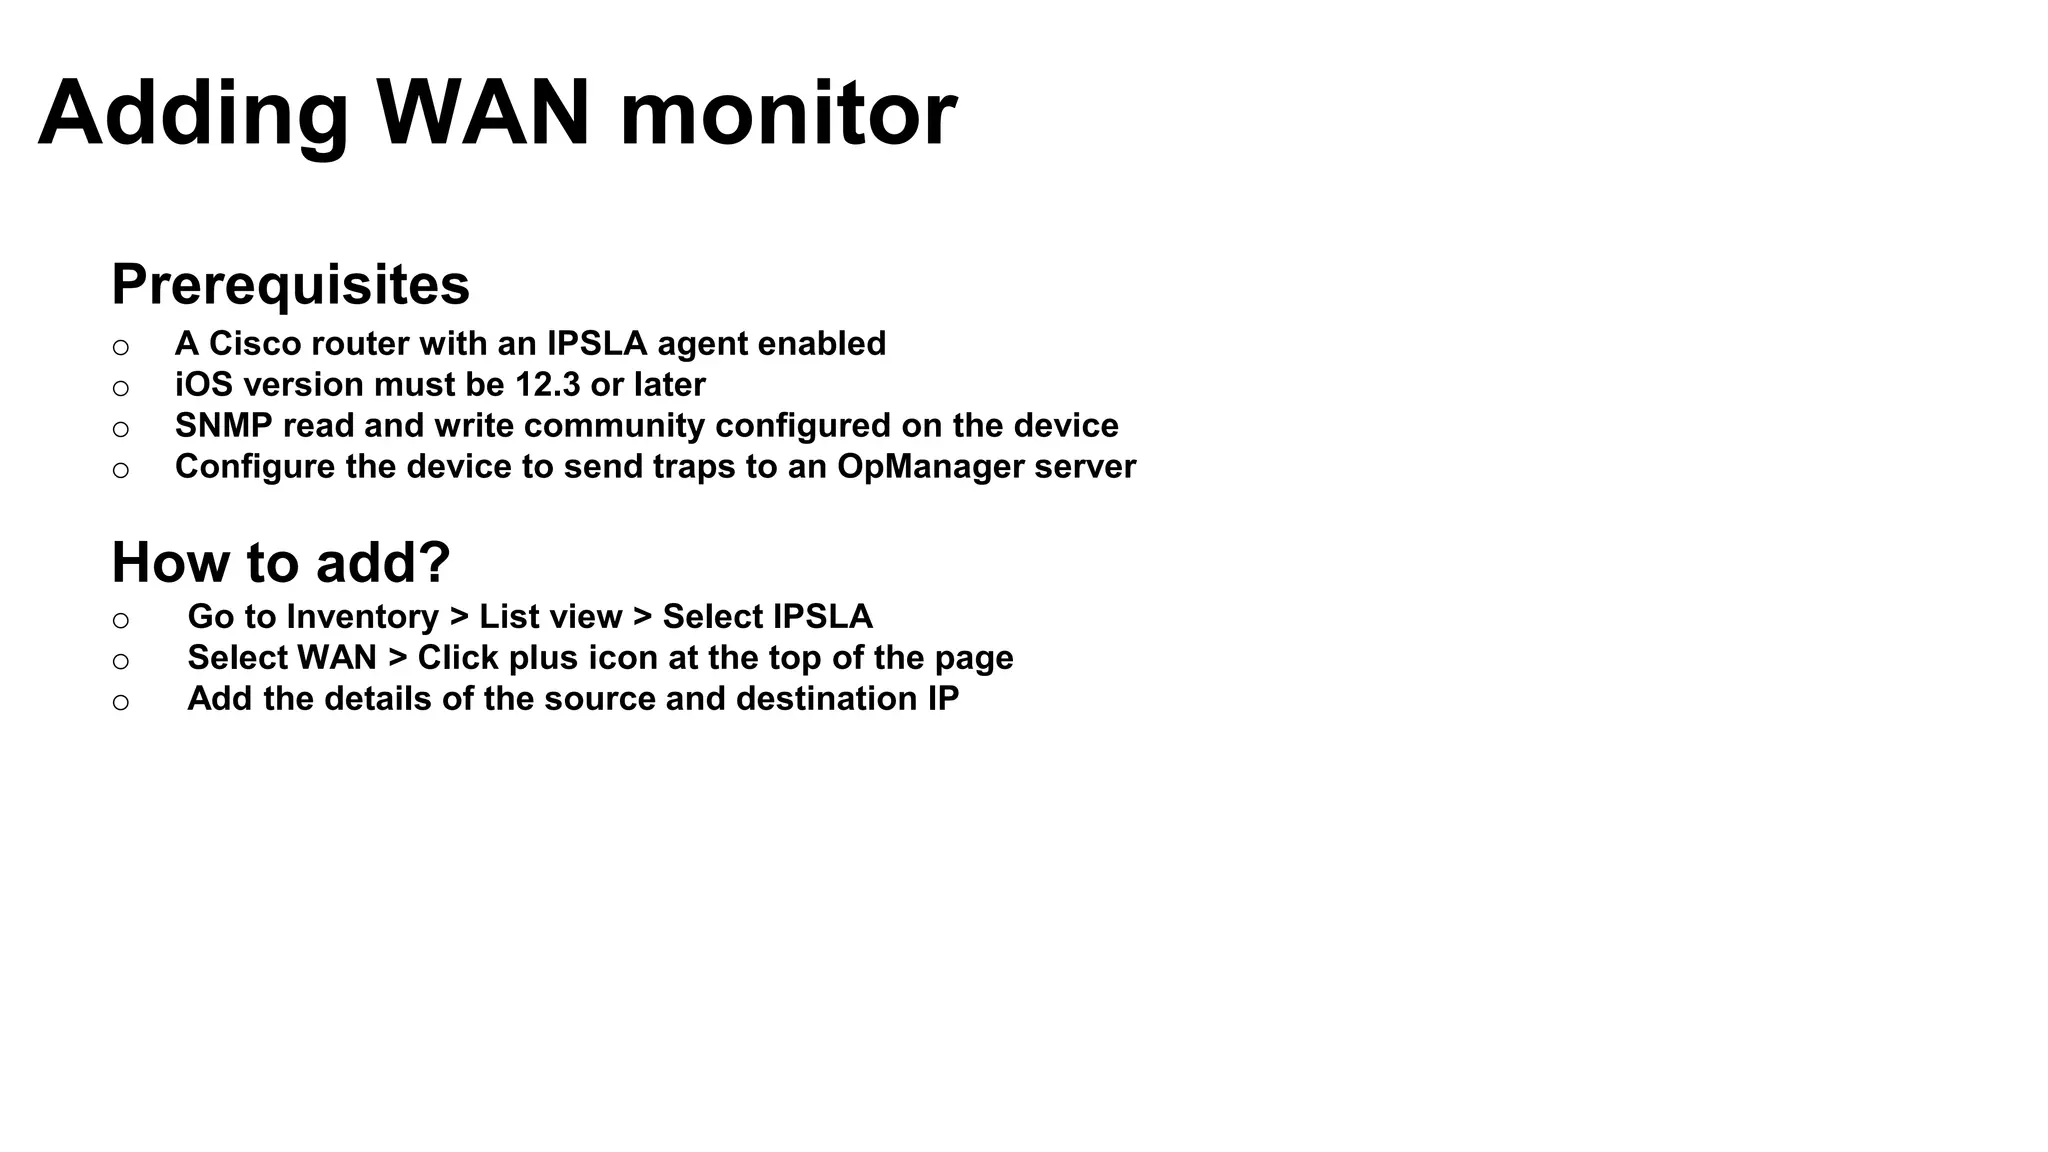
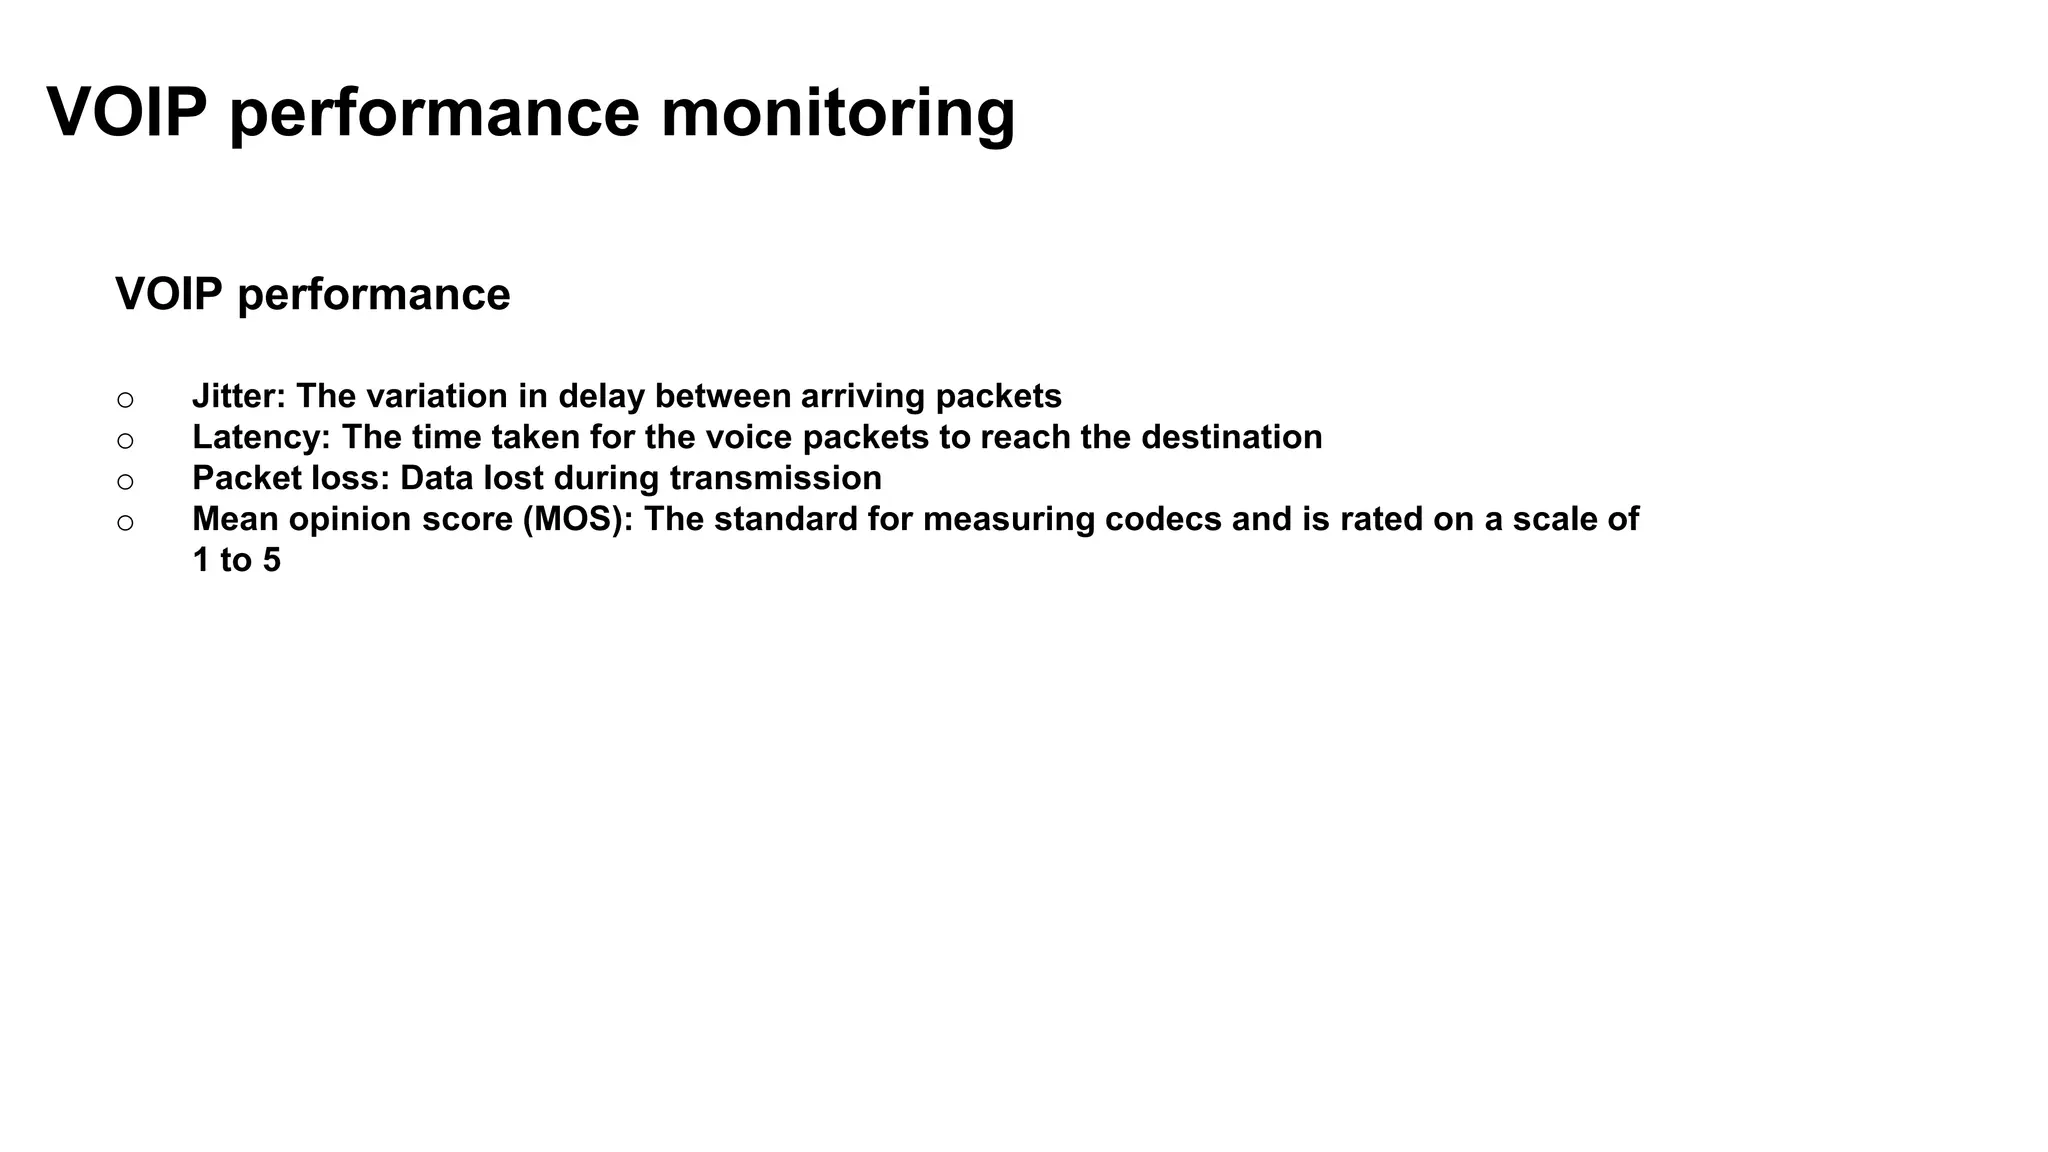
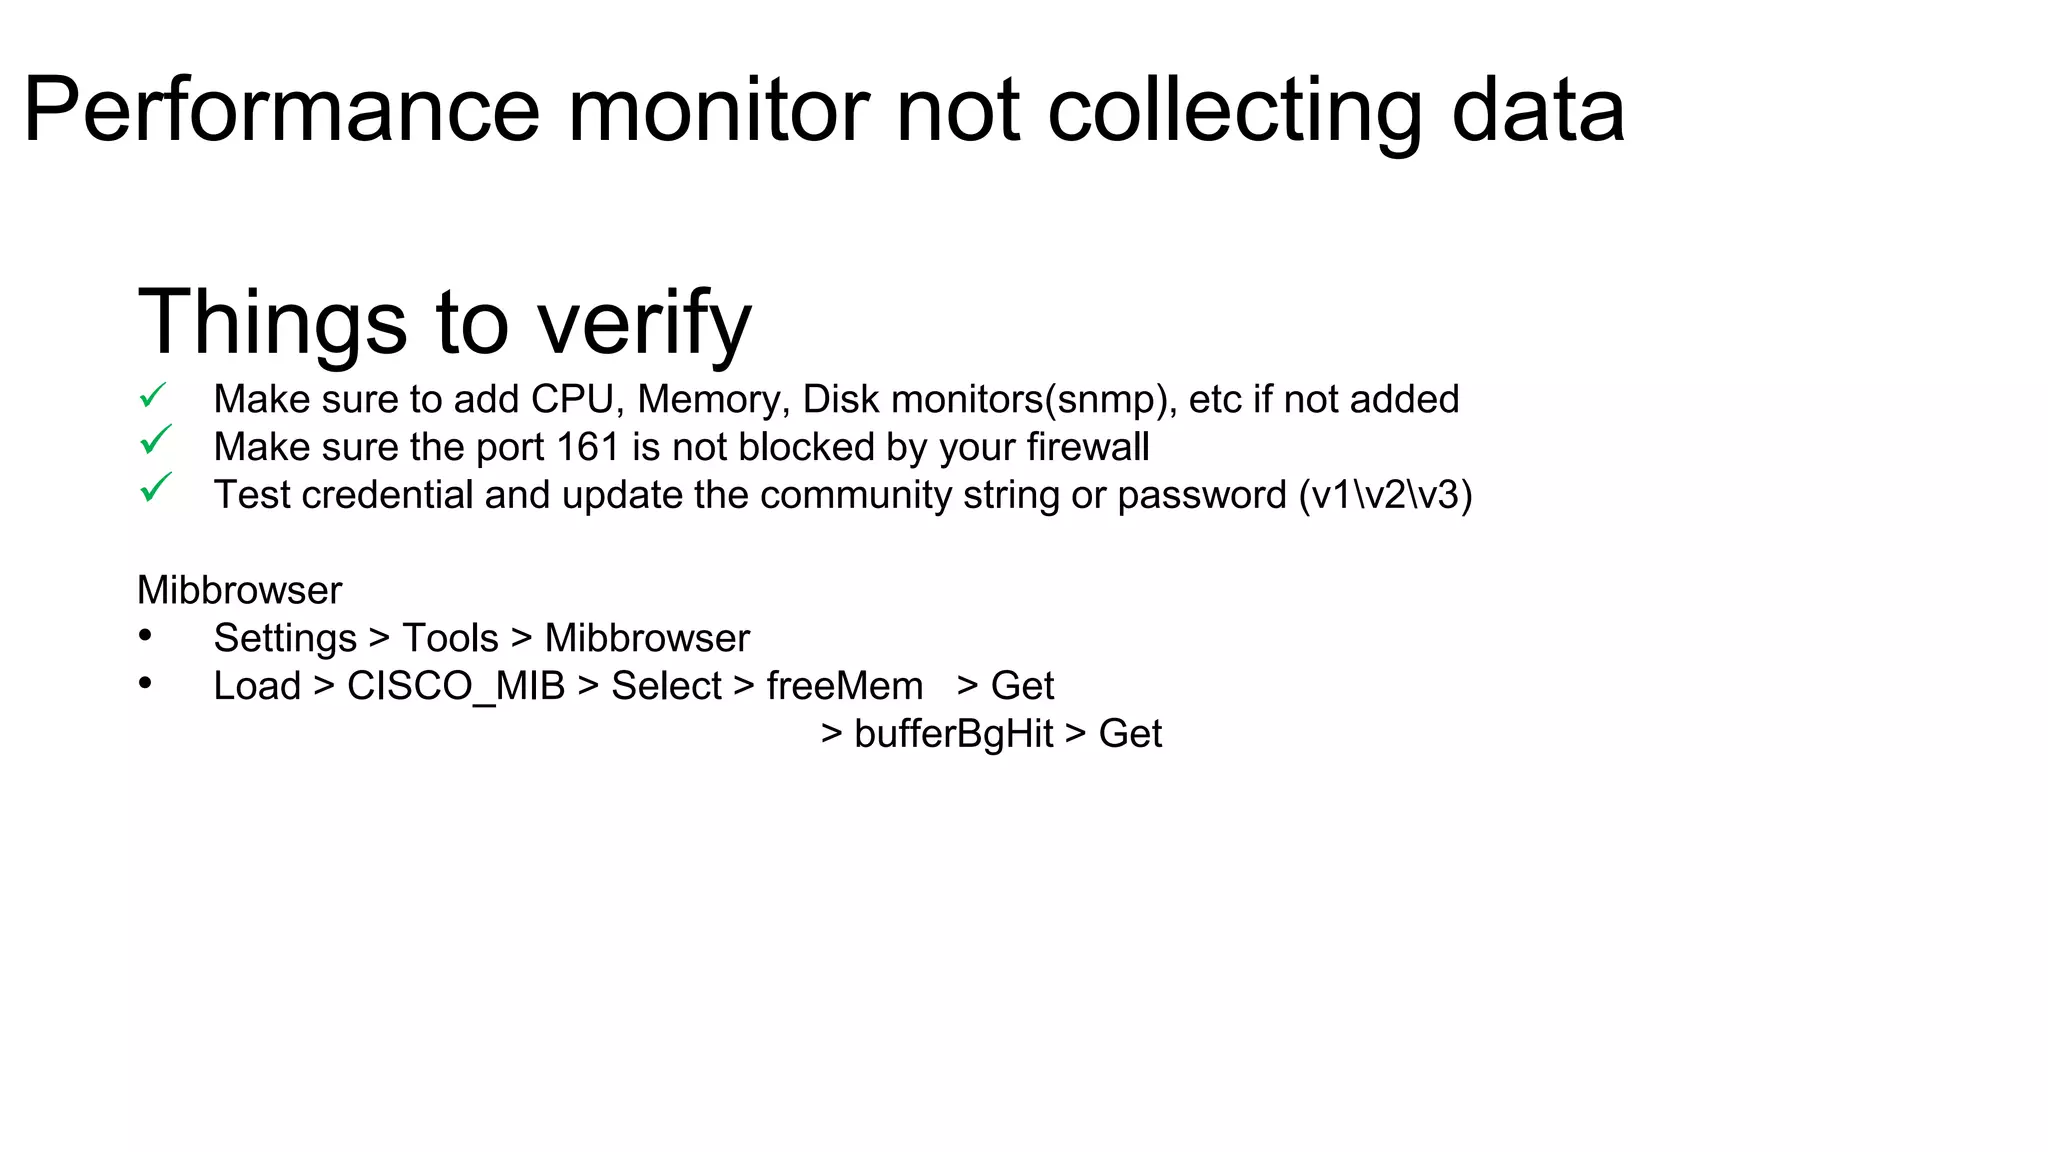
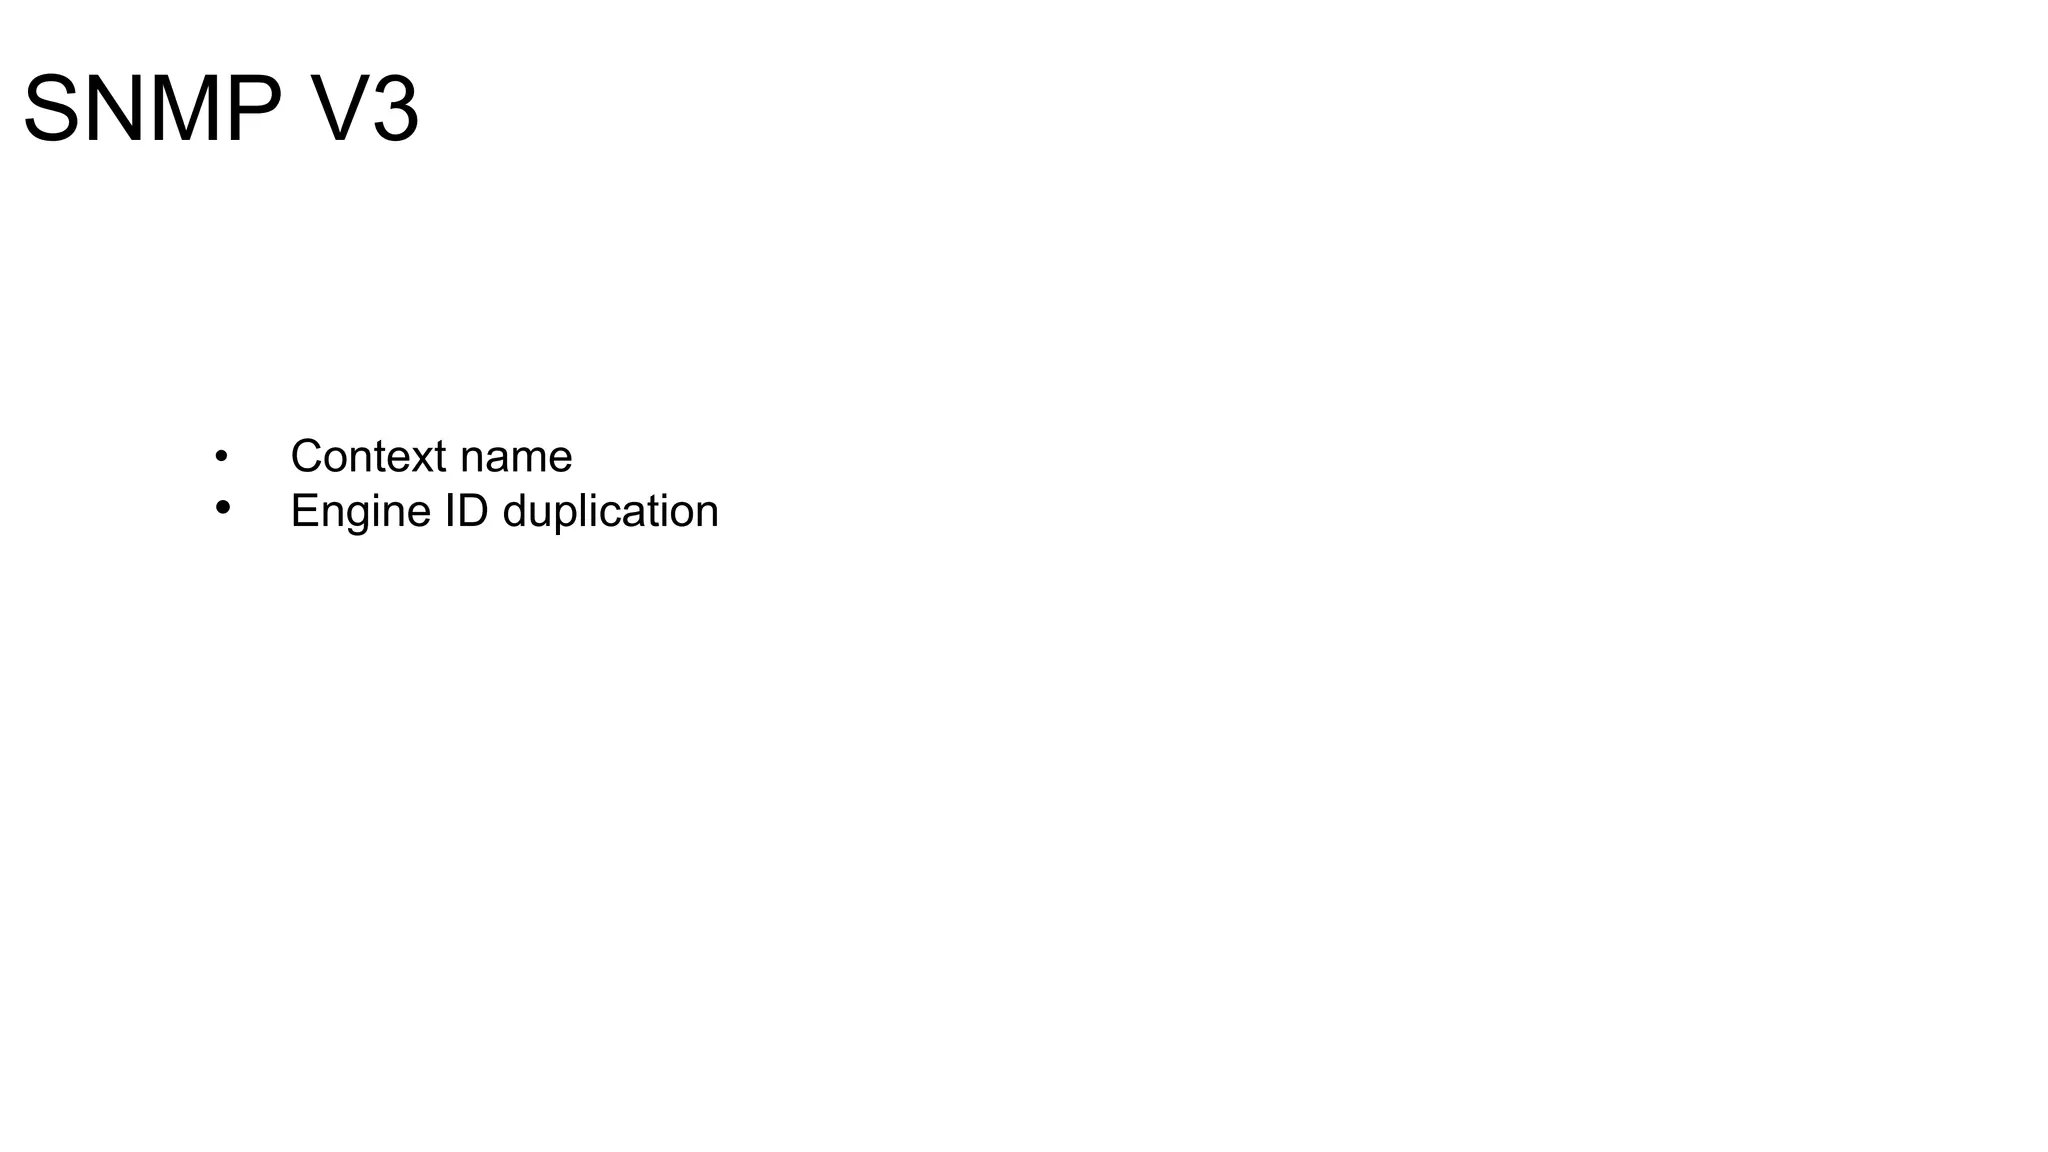
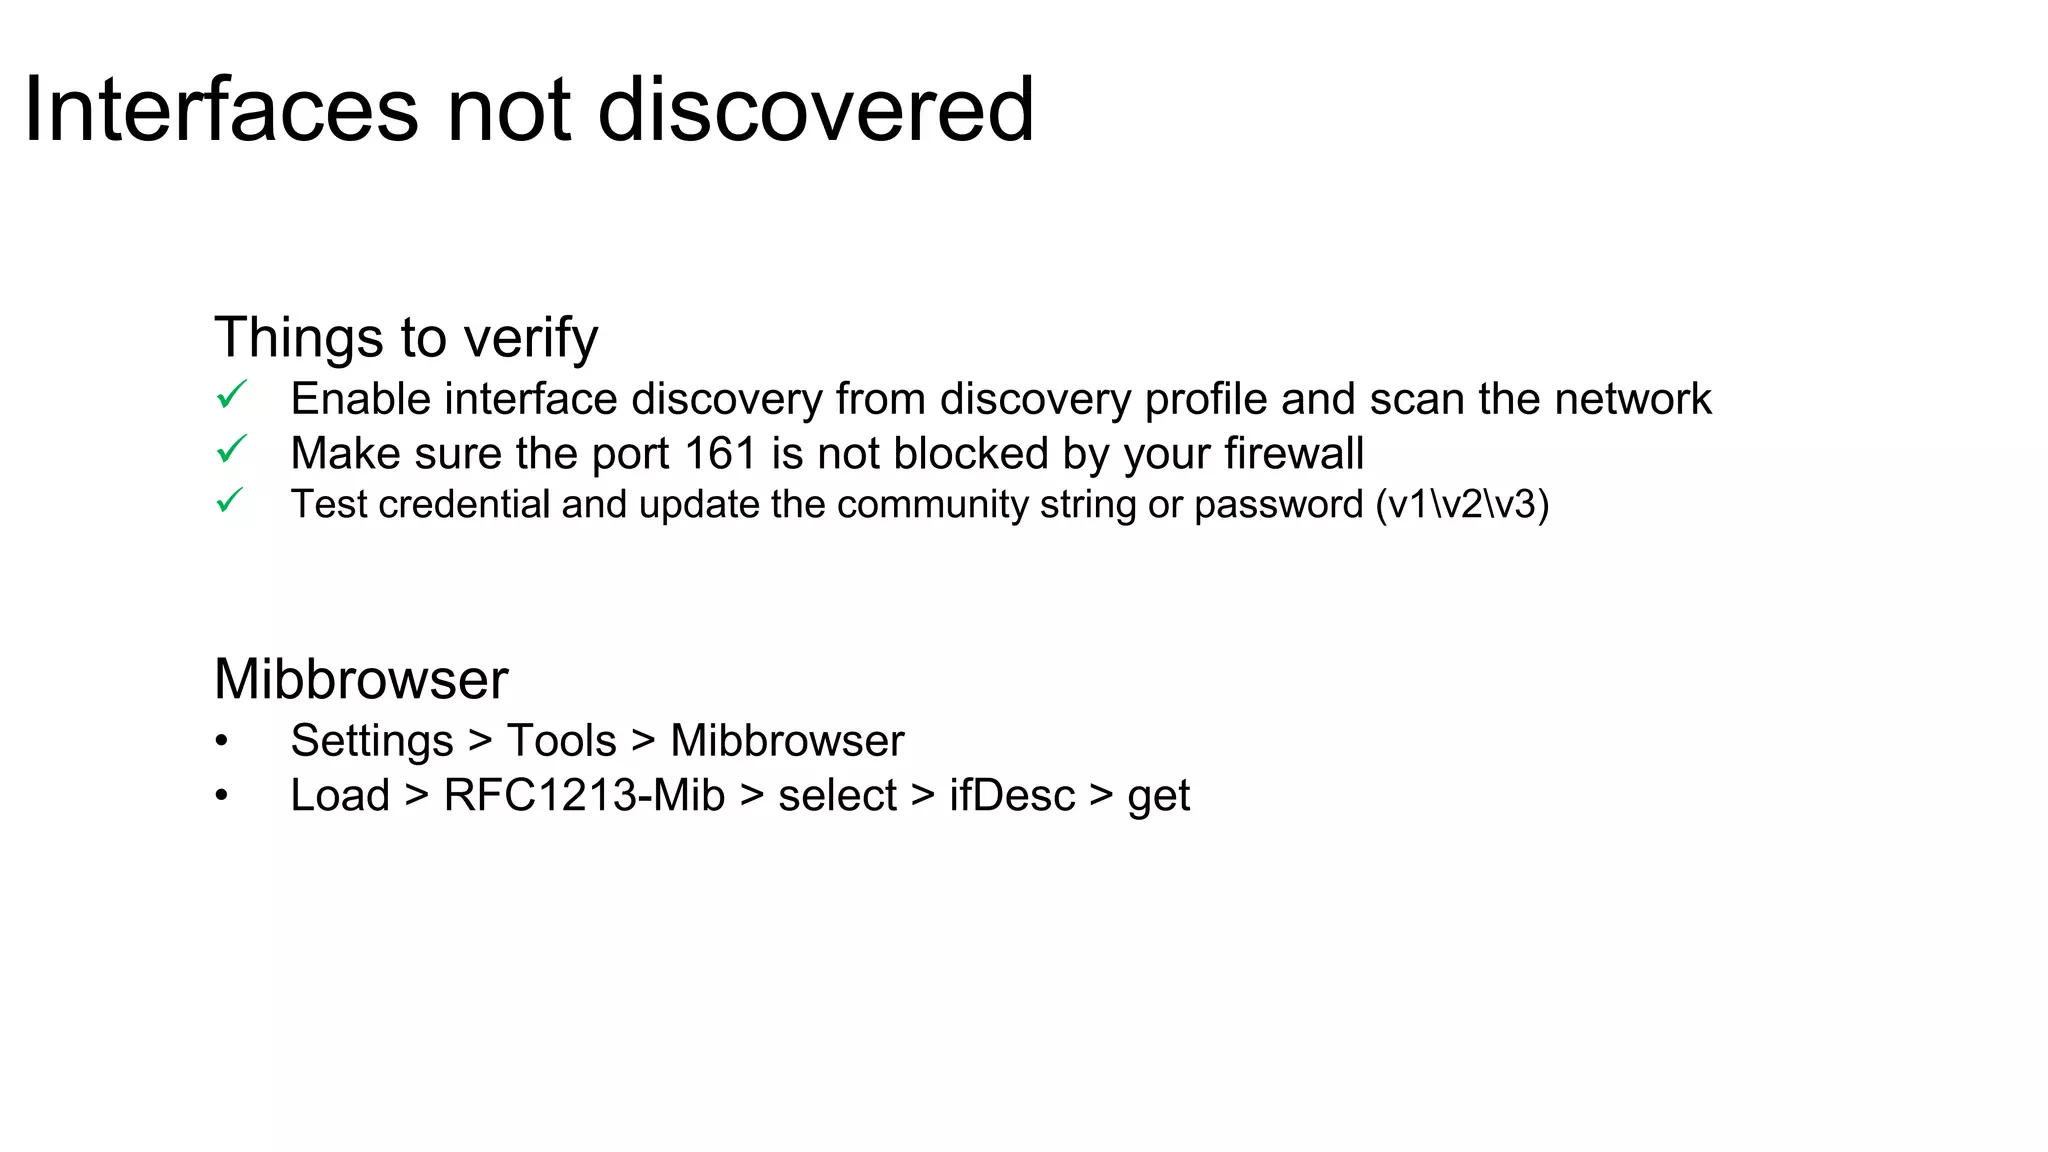
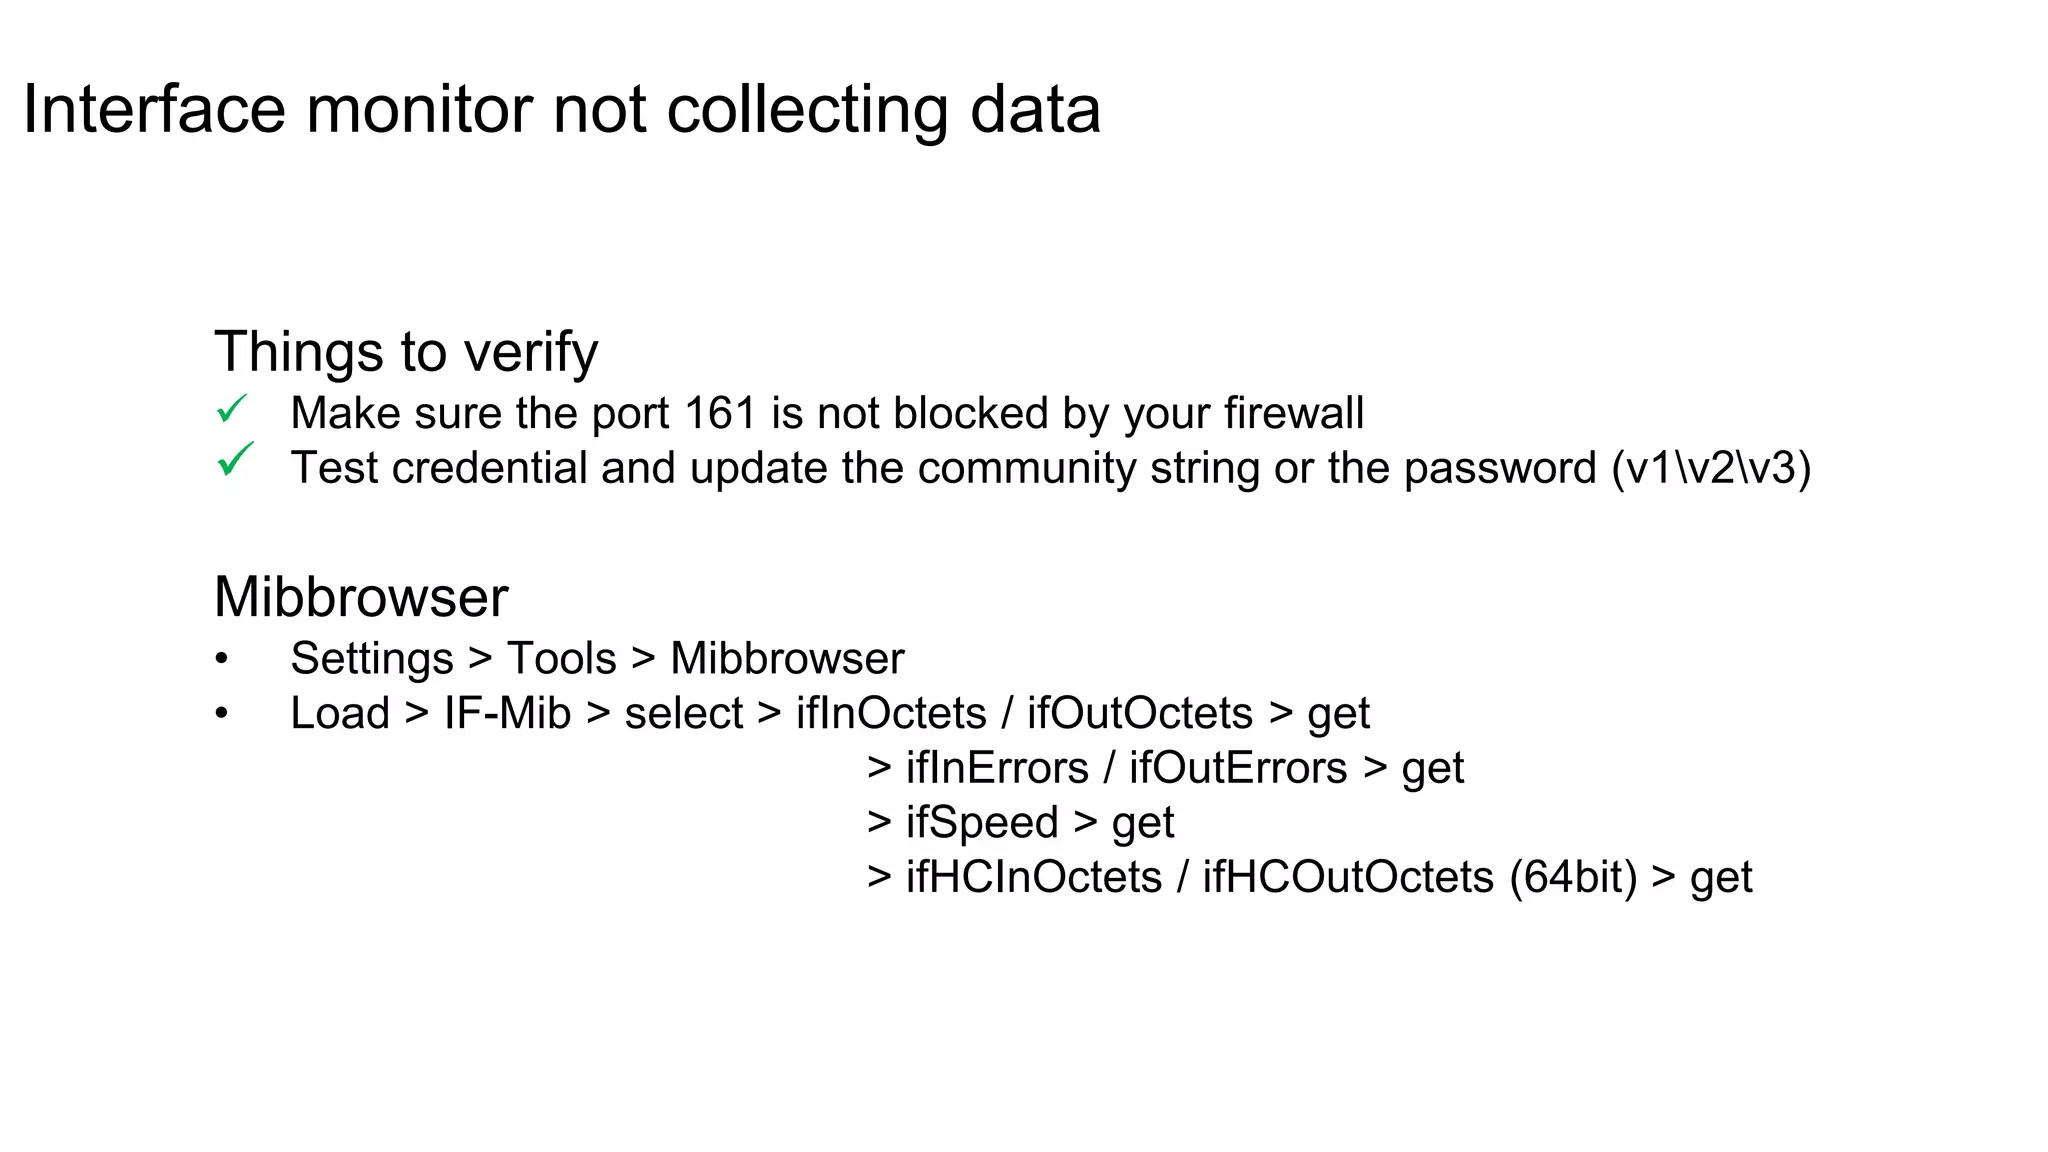
Part 3 - Monitoring Network Performance
Monitor the performance of your network, critical network devices like routers, switches, firewalls with OpManager
Manage the performance of physical and virtual servers using OpManager.
This is the second part of our five-part free training series. For more details visit https://www.manageengine.com/itom/free-training/network-monitoring.html
Free OpManager Training:
Part 1 - Discovery & Classification:
The first step in network monitoring is to discover and add devices to your network monitoring tool. Learn how to discover and add devices in OpManager, an integrated network monitoring & management tool.
Register here to attend the other sessions of our free OpManager training series.
https://www.manageengine.com/itom/free-training/?prd=opm-register
Learn how to view network maps, dashboards, and reports with OpManager.
This is the last training session of this season. You can view the training recordings of the entire season at https://www.manageengine.com/itom/free-training/network-monitoring.html#video
In this presentation, you'll learn on:
Monitoring network performance
Monitoring hardware sensor
Creating custom SNMP monitor
Monitoring WAN and VOIP links
Network reports
Troubleshooting tips
Learn the network and server performance monitoring using the network monitoring software, OpManager. Watch the video, read the questions and answers from here: https://www.manageengine.com/network-monitoring/training.html
Manage physical and virtual servers with OpManager. Monitor availability, health and performance while simultaneously planning for capacity and better resorce allocation.
This document summarizes a training session on fault management and IT automation using OpManager. It includes an agenda covering alarm severity levels, threshold violation alarms, alarms from event logs, SNMP traps, syslog alarms, and notifications. It also discusses using IT workflows to automate problem remediation.
Tips and tricks to monitor your network efficiently.
Through this training, learn more about:
1) Monitoring device availability
2) Monitoring server performance
3) Monitoring virtual server performance
4) Creating custom WMI monitor
5) Script monitoring
6) Troubleshooting tips
Learn how to customise OpManager's dashboard with widgets of your choice, layer 2 maps, business views, data center visual modeling and more. We would also discuss OpManager's various integrations and add-ons that would make your work easier.
In this presentation, learn how to configure the thresholds for each parameter, the violation alarms, notifications for each violation criteria and IT workflows & Automation for repetitive tasks.
This is the first part of our Free Training series.
The first step in monitoring your network and devices is to add them to your NMS. This training session covers how to add devices to OpManager.
Learn how to discover devices into NCM, automate & schedule configuration backups, real time change detection, & face network disasters with baseline configuration, startup-running config sync & export config.
Firewall Analyzer is a tool that provides visibility and management of firewall policies. It allows users to import firewall configurations, view and analyze existing rules, detect anomalies, optimize policies, and track configuration changes. The tool also helps with compliance auditing and provides reports. Some key capabilities mentioned include finding unused rules, reordering rules for performance, continuous monitoring of rule changes, and roll back of configurations. It supports various firewall brands including Checkpoint. The document discusses use cases such as onboarding new admins, detecting unauthorized changes, and ensuring compliance.
NCM is a network configuration management tool that allows users to discover devices, backup configurations, detect configuration changes, compare configurations, manage compliance policies, and generate detailed reports. It offers benefits such as being user friendly, easy to install and use, affordable pricing, and 24/7 technical support. NCM provides a complete solution for network configuration management.
The document provides an overview and agenda for a training on NetFlow Analyzer. It discusses initial setup steps including exporting flows from devices, viewing real-time traffic graphs, and configuring alerts. Common challenges are also addressed, such as mapping unknown applications or setting interface speed. Upcoming training will cover additional topics like alarms, customizing data storage, and traffic troubleshooting.
OpManager is integrated network management software that offers network monitoring, server monitoring, bandwidth analysis, configuration management, firewall log analysis, and IP & switch port management.
This document describes a network scanner project. The network scanner scans a network in real-time to explore connected computers and provide their status. It allows network administrators to efficiently analyze and monitor the network. Key features include classifying network components, bandwidth monitoring and control, and remote access capabilities. The project will be implemented in phases, beginning with a graphical user interface module and also including address calculation, bandwidth capturing, and remote access modules.
Firewall Analyzer allows monitoring of virtual firewalls by resolving DNS names, enabling logging by context or vdom, and selecting syslog format. It generates context or vdom specific firewall reports on compliance, changes, and unused rules by using credentials for the base firewall. For support, contact the listed website, email, or demo site.
Firewall Analyzer is a tool that analyzes firewall logs to generate various reports. It discusses how Firewall Analyzer helps meet challenges by tracking URL activities, user bandwidth, securing networks, and performing audits. The document outlines how to install, configure and import logs into Firewall Analyzer. It describes the different types of reports that can be generated for traffic analysis, security analysis, and device management. It also discusses how to set up alarms and notifications. Questions from users are addressed at the end regarding issues like seeing traffic bytes, VPN user details, and required hard drive space.
Real time network monitoring tracks network activity on a daily basis to indicate both immediate and future potential problems. It can be performed on both the GUI and command line, with the GUI providing more complete information at once. Common GUI monitoring applications include Observium, Ganglia, and Piecework. Command line network tools that can be used for monitoring include ping to test availability, tracert to check the path between computers, ipconfig to display IP addresses, nslookup to check DNS, net start to view running services, and netstat to view connections.
The document discusses several popular network monitoring tools, including SolarWinds Network Performance Monitor, Datadog Network Performance Monitoring, Paessler PRTG Network Monitor, Atera, Site24x7 Cloud Network Monitoring System, ManageEngine OpManager, Nagios Core, Zabbix, Icinga, and Spiceworks Connectivity Dashboard. For each tool, the document outlines their key features and provides an example screenshot of their monitoring dashboard interface. The tools generally utilize SNMP to monitor network devices and provide features like automatic device discovery, customizable dashboards, alerts, and reports.
This document summarizes the agenda and content for a free OpManager network monitoring training session. The training covers monitoring the performance of network devices, interfaces, hardware sensors, and WAN/VOIP links. It also discusses how to set up custom SNMP monitors, troubleshoot issues, and generate network reports. The session is part of a five-week training series on OpManager's network monitoring capabilities.
This document provides an overview of initial setup and configuration of NetFlow Analyzer. It discusses exporting network flow data, viewing traffic details in the inventory, and configuring alerts. The steps include:
1) Configuring flow export from network devices using manual commands or the Network Configuration Manager tool.
2) Viewing traffic statistics and details for devices, interfaces, applications and other groups in the inventory section.
3) Creating alert profiles to monitor thresholds and receive notifications for issues like interface overutilization or link downs.
The document summarizes the key features and capabilities of OpManager, a network monitoring software. It discusses how OpManager can be used to discover devices, monitor performance and availability, set alarms and notifications, create reports, and automate management tasks through its rule engine and workflows. The presentation provides examples of monitoring servers, applications, virtual infrastructure, networks, bandwidth and other IT components.
This document provides an overview and introduction to using the Wireshark network analysis tool. It discusses Wireshark basics and advanced features, including how to capture and filter network traffic, analyze protocols and packets, view statistics and conversations, and use Wireshark to troubleshoot network issues. Several case studies are presented showing how Wireshark can be used to analyze problems like slow connections, high load, and non-stable performance.
This document provides an overview of network state awareness and troubleshooting techniques. The agenda covers troubleshooting methodology, packet forwarding review, active and passive monitoring, quality of service, control plane, and routing protocol stability. It distinguishes between the control plane, which creates routing information based on aggregated data, and the data plane, which makes forwarding decisions based on packet details. Various troubleshooting tools are discussed like traceroute, interface statistics, NetFlow, and performance monitoring to analyze the network from the data plane perspective.
The objective of this OpManager POC is to provide step-by-step instructions about how to set up a stand-alone OpManager environment to be used for demonstrating the functions and features of
the products, using customer data, infrastructure and workloads.
OpManager is an integrated network management tool that helps you monitor your network, physical & virtual servers, bandwidth, configurations, firewall, switch ports and IP addresses
OpManager is network management software that provides increased visibility and control over networks. It offers monitoring of network and server performance, bandwidth analysis, firewall log analysis, configuration management, IP address management, and switch port management. OpManager allows for visualization of network performance through dashboards and maps, as well as fault management through alarms, notifications, and workflow automation. It also provides reports and easy deployment options.
This document summarizes the key features of OpManager v12 network management software. It provides increased visibility and control over networks through comprehensive monitoring, reporting, and automation capabilities. Some highlights include monitoring over 100 performance metrics for routers, switches and servers, bandwidth analysis, firewall log management, configuration management, and workflow automation to remediate issues. It aims to provide full visibility and control over IT infrastructure from a single centralized platform.
This document summarizes a presentation about network traffic monitoring and analysis. It discusses traditional monitoring tools like SNMP and newer tools that provide deeper traffic visibility. It explains how flow monitoring works and standards like NetFlow. The presentation also demonstrates how tools can analyze flow data to detect security issues, troubleshoot problems, and capture packets for forensic analysis. Real examples are shown of using these techniques to identify a malware infection and resolve a email delivery problem.
Network visibility and control using industry standard sFlow telemetrypphaal
• Find out about the sFlow instrumentation built into commodity data center network and server infrastructure.
• Understand how sFlow fits into the broader ecosystem of NetFlow, IPFIX, SNMP and DevOps monitoring technologies.
• Case studies demonstrate how sFlow telemetry combined with automation can lower costs, increase performance, and improve security of cloud infrastructure and applications.
SNMP OPC Server from Transcend AutomationBaiju P.S.
SNMP OPC Server will let your automation system both monitor and manage your automation infrastructure. In addition to monitoring your PLCs and Field Devices, you will be able to communicate with all the pieces that make up your automation network, the backbone of your plant.
Transcend Automation is the Authorized business partners for Kepware Technologies. We Market ,Promote, Integrate their products for customers in India
This document discusses network monitoring tools and techniques. It defines network monitoring as the process of collecting network activity statistics to inform management decisions. Regular monitoring is needed to troubleshoot problems, identify slow or failing components, and notify administrators of outages. Common diagnostic tools discussed include Ping, Traceroute, Ipconfig and Netstat which can test connectivity and determine device availability. The document also outlines some network monitoring platforms and utilities that can perform specialized tasks like protocol analysis, connectivity testing and log analysis.
The 3 aspects of network performance managementManageEngine
Do you think it is enough to monitor the device or link availability and performance to manage your network? But that is just the first step!
Go through this slide to understand the 3 aspects of network performance management.
Snmp Opc Server from Transcend Automationguestd1aebad0
Kepware is a privately held company established in 1995 that is located in Portland, Maine. It is the largest OPC server company in the world, delivering 100,000 units annually with over 50 employees. Kepware's SNMP OPC Server software allows automation engineers to easily integrate and monitor Ethernet network devices from their OPC client programs. It supports features like auto discovery, MIB importing, and generating tags to monitor both managed and unmanaged devices. The document provides information on the server's configuration process and contact details for Transcend Automation to address any questions.
The document provides an overview of the OSI model, TCP/IP protocols, Cisco IOS modes, router components, cabling, router management, LAN switching concepts, IP addressing, routing protocols, and IPv6 migration methods. It summarizes key topics for the CCNA exam in 10 sentences or less per section.
Similar to Monitoring network performance- Part 3_Free OpManager training (20)
Learn how analyzing key website metrics that are related to user interactions will help you make insightful improvements. Understand how replaying individual customer transactions and analyzing every element of your webpage will help drill down to the root causes issues and create better content strategies respectively.
Learn how to how to monitor and gain code-level insights into the performance of your Java, Node.js, PHP, and .NET Core applications in real-time with the help of ManageEngine Applications Manager.
Get a complete overview of NetFlow Analyzer. Learn about the basic initial settings, configuration, customization, alerts, reports, and the various other features of the product.
Learn how to monitor the operational status of servers and virtual machines across an organization's IT infrastructure, track the status of critical metrics, tackle hardware problems, and optimize resource allocation effectively with ManageEngine Applications Manager.
This document discusses monitoring various cloud infrastructure and applications using an end-to-end application performance monitoring solution. It covers monitoring metrics in AWS, GCP, Oracle Cloud Infrastructure, Hyperconverged infrastructure like Nutanix and Cisco UCS, Oracle Autonomous Database, and using trend analysis reports for forecasting and resource planning. Upcoming monitoring enhancements for additional cloud services on AWS, Azure, and GCP are also outlined through 2020.
Learn the various advanced monitoring, customization, troubleshooting and security features in Netflow Analyzer.
Agenda:
-Troubleshooting with forensics and ASAM
-Reporting and automation
-Traffic shaping
-Distributed Monitoring
Learn how to track key operational metrics of your Node.js and PHP infrastructure in real-time and get insight into the nuances of autonomous databases.
The document discusses the results of a study on the impact of COVID-19 lockdowns on air pollution. Researchers analyzed satellite data from NASA and the European Space Agency and found that nitrogen dioxide levels decreased significantly during lockdown periods in major cities across the world as traffic and industrial activities reduced. Overall, the temporary improvements in air quality during widespread lockdowns highlight the human-caused nature of poor air pollution but also show how collective changes in behavior can positively impact the environment.
NetFlow Analyzer captures flow data and monitors interface bandwidth usage in real-time. This product overview will help you get the most out of NetFlow Analyzer.
This document discusses monitoring cloud and hyperconverged infrastructure. It covers monitoring Amazon Web Services (AWS) by visualizing metrics for compute, storage, databases and other services. It also discusses monitoring Oracle Cloud Infrastructure and Google Cloud Platform, including compute metrics. Monitoring Nutanix hyperconverged infrastructure is covered, such as storage, virtual machines and alerts. The document concludes with the importance of capacity planning for cloud resources.
This document discusses website monitoring strategies including tracking key metrics of web servers like Apache, IIS and Nginx; optimizing individual URLs for user experience; using synthetic monitoring to simulate web transactions; and detecting unauthorized content changes. It provides overviews of monitoring various web servers and their key performance indicators. It also describes optimizing the user experience by monitoring URL sequences, implementing real browser monitoring, and using web transaction recording. Finally, it discusses monitoring website content to detect hacks and defacement.
This document summarizes a presentation about unlocking the value of big data infrastructure. It discusses key components of Apache Hadoop and Spark including HDFS, MapReduce, YARN, and Spark cores/RDDs. It also discusses leveraging graph databases for business, NoSQL databases in big data frameworks like MongoDB, Cassandra, and Redis. Finally, it discusses discovering and mapping issues, and forecasting utilization trends to plan capacity.
This document discusses implementing the right website monitoring strategy. It covers monitoring web servers like Apache, IIS, and Nginx to ensure performance and availability. It also discusses optimizing individual URLs, monitoring dynamic webpages through synthetic transactions, and detecting unauthorized changes to websites through content monitoring. The overall strategy aims to provide visibility, optimize user experience, and prevent hacks.
Having trouble with IP's and switches?
Overcome these troubles with ManageEngine OpUtils
Learn more about
- IP address and switch port management
-Rogue device detection
-Bandwidth monitor and config file manager
- Troubleshooting tools
What to do when you have a perfect model for your software but you are constrained by an imperfect business model?
This talk explores the challenges of bringing modelling rigour to the business and strategy levels, and talking to your non-technical counterparts in the process.
The Rising Future of CPaaS in the Middle East 2024Yara Milbes
Explore "The Rising Future of CPaaS in the Middle East in 2024" with this comprehensive PPT presentation. Discover how Communication Platforms as a Service (CPaaS) is transforming communication across various sectors in the Middle East.
WWDC 2024 Keynote Review: For CocoaCoders AustinPatrick Weigel
Overview of WWDC 2024 Keynote Address.
Covers: Apple Intelligence, iOS18, macOS Sequoia, iPadOS, watchOS, visionOS, and Apple TV+.
Understandable dialogue on Apple TV+
On-device app controlling AI.
Access to ChatGPT with a guest appearance by Chief Data Thief Sam Altman!
App Locking! iPhone Mirroring! And a Calculator!!
WMF 2024 - Unlocking the Future of Data Powering Next-Gen AI with Vector Data...Luigi Fugaro
Vector databases are transforming how we handle data, allowing us to search through text, images, and audio by converting them into vectors. Today, we'll dive into the basics of this exciting technology and discuss its potential to revolutionize our next-generation AI applications. We'll examine typical uses for these databases and the essential tools
developers need. Plus, we'll zoom in on the advanced capabilities of vector search and semantic caching in Java, showcasing these through a live demo with Redis libraries. Get ready to see how these powerful tools can change the game!
Orca: Nocode Graphical Editor for Container OrchestrationPedro J. Molina
Tool demo on CEDI/SISTEDES/JISBD2024 at A Coruña, Spain. 2024.06.18
"Orca: Nocode Graphical Editor for Container Orchestration"
by Pedro J. Molina PhD. from Metadev
Alluxio Webinar | 10x Faster Trino Queries on Your Data PlatformAlluxio, Inc.
Alluxio Webinar
June. 18, 2024
For more Alluxio Events: https://www.alluxio.io/events/
Speaker:
- Jianjian Xie (Staff Software Engineer, Alluxio)
As Trino users increasingly rely on cloud object storage for retrieving data, speed and cloud cost have become major challenges. The separation of compute and storage creates latency challenges when querying datasets; scanning data between storage and compute tiers becomes I/O bound. On the other hand, cloud API costs related to GET/LIST operations and cross-region data transfer add up quickly.
The newly introduced Trino file system cache by Alluxio aims to overcome the above challenges. In this session, Jianjian will dive into Trino data caching strategies, the latest test results, and discuss the multi-level caching architecture. This architecture makes Trino 10x faster for data lakes of any scale, from GB to EB.
What you will learn:
- Challenges relating to the speed and costs of running Trino in the cloud
- The new Trino file system cache feature overview, including the latest development status and test results
- A multi-level cache framework for maximized speed, including Trino file system cache and Alluxio distributed cache
- Real-world cases, including a large online payment firm and a top ridesharing company
- The future roadmap of Trino file system cache and Trino-Alluxio integration
Superpower Your Apache Kafka Applications Development with Complementary Open...Paul Brebner
Kafka Summit talk (Bangalore, India, May 2, 2024, https://events.bizzabo.com/573863/agenda/session/1300469 )
Many Apache Kafka use cases take advantage of Kafka’s ability to integrate multiple heterogeneous systems for stream processing and real-time machine learning scenarios. But Kafka also exists in a rich ecosystem of related but complementary stream processing technologies and tools, particularly from the open-source community. In this talk, we’ll take you on a tour of a selection of complementary tools that can make Kafka even more powerful. We’ll focus on tools for stream processing and querying, streaming machine learning, stream visibility and observation, stream meta-data, stream visualisation, stream development including testing and the use of Generative AI and LLMs, and stream performance and scalability. By the end you will have a good idea of the types of Kafka “superhero” tools that exist, which are my favourites (and what superpowers they have), and how they combine to save your Kafka applications development universe from swamploads of data stagnation monsters!
Unlock the Secrets to Effortless Video Creation with Invideo: Your Ultimate G...The Third Creative Media
"Navigating Invideo: A Comprehensive Guide" is an essential resource for anyone looking to master Invideo, an AI-powered video creation tool. This guide provides step-by-step instructions, helpful tips, and comparisons with other AI video creators. Whether you're a beginner or an experienced video editor, you'll find valuable insights to enhance your video projects and bring your creative ideas to life.
Boost Your Savings with These Money Management AppsJhone kinadey
A money management app can transform your financial life by tracking expenses, creating budgets, and setting financial goals. These apps offer features like real-time expense tracking, bill reminders, and personalized insights to help you save and manage money effectively. With a user-friendly interface, they simplify financial planning, making it easier to stay on top of your finances and achieve long-term financial stability.
Mobile App Development Company In Noida | Drona InfotechDrona Infotech
React.js, a JavaScript library developed by Facebook, has gained immense popularity for building user interfaces, especially for single-page applications. Over the years, React has evolved and expanded its capabilities, becoming a preferred choice for mobile app development. This article will explore why React.js is an excellent choice for the Best Mobile App development company in Noida.
Visit Us For Information: https://www.linkedin.com/pulse/what-makes-reactjs-stand-out-mobile-app-development-rajesh-rai-pihvf/
Baha Majid WCA4Z IBM Z Customer Council Boston June 2024.pdfBaha Majid
IBM watsonx Code Assistant for Z, our latest Generative AI-assisted mainframe application modernization solution. Mainframe (IBM Z) application modernization is a topic that every mainframe client is addressing to various degrees today, driven largely from digital transformation. With generative AI comes the opportunity to reimagine the mainframe application modernization experience. Infusing generative AI will enable speed and trust, help de-risk, and lower total costs associated with heavy-lifting application modernization initiatives. This document provides an overview of the IBM watsonx Code Assistant for Z which uses the power of generative AI to make it easier for developers to selectively modernize COBOL business services while maintaining mainframe qualities of service.
14 th Edition of International conference on computer visionShulagnaSarkar2
About the event
14th Edition of International conference on computer vision
Computer conferences organized by ScienceFather group. ScienceFather takes the privilege to invite speakers participants students delegates and exhibitors from across the globe to its International Conference on computer conferences to be held in the Various Beautiful cites of the world. computer conferences are a discussion of common Inventions-related issues and additionally trade information share proof thoughts and insight into advanced developments in the science inventions service system. New technology may create many materials and devices with a vast range of applications such as in Science medicine electronics biomaterials energy production and consumer products.
Nomination are Open!! Don't Miss it
Visit: computer.scifat.com
Award Nomination: https://x-i.me/ishnom
Conference Submission: https://x-i.me/anicon
For Enquiry: Computer@scifat.com
🏎️Tech Transformation: DevOps Insights from the Experts 👩💻campbellclarkson
Connect with fellow Trailblazers, learn from industry experts Glenda Thomson (Salesforce, Principal Technical Architect) and Will Dinn (Judo Bank, Salesforce Development Lead), and discover how to harness DevOps tools with Salesforce.
A neural network is a machine learning program, or model, that makes decisions in a manner similar to the human brain, by using processes that mimic the way biological neurons work together to identify phenomena, weigh options and arrive at conclusions.
Monitoring network performance- Part 3_Free OpManager training
1. OpManager
Performance monitoring, health monitoring, WAN
monitoring, workflow automation
Network Configuration Manager
Configuration management, change management,
compliance auditing, user activity tracking
OpUtils
IP address management, switch port management,
rogue detection, MAC IP mapping
IT operations management solutions
Netflow Analyzer
Bandwidth monitoring, forensics, traffic shaping,
DPI monitoring
Firewall Analyzer
Compliance management, firewall policy
management, log analysis, network forensic audits
Applications Manager
Agentless monitoring tool for all your applications
and servers (App servers, DBs, VMs, Web apps
etc.) including physical, virtual as well as your cloud
apps
3. Training schedule
Week Module Date Schedule Status
1st Discovery and classification February 21st 11:30am EDT Completed
2nd Server performance monitoring February 28th 11:30am EDT Completed
3rd Network performance monitoring March 7th 11:30am EDT In progress
4th Effective fault management and IT
automation
March 14th 11:30am EDT Upcoming
5th Network maps;network
management;network reports;best
practice; integration and add-ons
March 21st 11:30am EDT Upcoming
www.opmanager.com/training.html
5. Agenda
Monitoring network performance
o Monitoring the performance of Router, Switch, Firewall, Printer, etc
o Monitoring Bandwidth/ Traffic
o Hardware sensor monitor
o Creating a custom SNMP monitor
IPSLA Monitoring
o WAN performance monitoring
o VoIP performance monitoring
SNMP monitor not collecting data
o Performance monitor not collecting data
o Interfaces not discovered
o Interface monitor not collecting data
Network reports
Questions
7. Performance monitors Protocol
CPU, memory, temperature, etc. SNMP
Cisco UCS UCS API
Network devices/ other infrastructure
devices such as printer, UPS, etc.
SNMP
WAN latency check IPSLA (Cisco devices only)
VOIP latency check, mos, jitter, etc. IPSLA (Cisco devices only)
*Configure SNMP on the network devices
8. Monitoring Router performance
o CPU/memory usage
o Temperature, etc.
o Setting up threshold for the performance monitors
Monitoring network performance
Monitoring Switch performance
o CPU/memory usage
o Back plane utilization, etc
Monitoring Firewall performance
o CPU/memory usage
o Active session count, etc
Monitoring Printer performance
o Paper jam, low paper or no paper
o Low toner or no toner, etc
9. Monitoring bandwidth/traffic
Interface performance counters
• Bandwidth usage
• Errors/discards
• Received and transmitted traffic
• Total bytes received
• Total bytes transferred
• Real time interface monitors
*SNMP based monitoring
10. 1. Enable or disable monitoring for specific
interface type
2. Configuring monitoring interval for the
interface type
3. Configuring thresholds for utilization, errors
and discards
4. Enable or disable interface status polling
10
Interface templates 1
2
3
4
12. Setting up hardware monitoring
• Go to Settings > System Settings > Hardware monitor
o Enable Hardware monitor
o Suppress Hardware Alarms
o Monitor interval
o Hardware health report
13. Creating a custom SNMP monitor
Prerequisites
• SNMP-enabled device
• Vendor MIBs
o OpManagermibs
• Mib-browser
o Valid SNMP OIDs
Mibs
• What is a mib file?
• How to obtain the mib file?
• Uploading the mib files in OpManager
• Identifying the valid OID's
Examples
1. Creating a custom monitor for 'Palo Alto Networks 7000 series firewall' (active session
and active tunnels)
2. Multiple OID's with arithmetic operation/calculation
3. String to numeric
16. WAN performance
o Identify the network paths with high round trip time
o Identify where the outage happened by viewing the hop-wise latency graph
o Collect the IPSLA traps for events such as connection loss, threshold violation for RTT, average
payload, timeout, etc.
WAN performance monitoring
17. Prerequisites
o A Cisco router with an IPSLA agent enabled
o iOS version must be 12.3 or later
o SNMP read and write community configured on the device
o Configure the device to send traps to an OpManager server
How to add?
o Go to Inventory > List view > Select IPSLA
o Select WAN > Click plus icon at the top of the page
o Add the details of the source and destination IP
Adding WAN monitor
18. VOIP performance
o Jitter: The variation in delay between arriving packets
o Latency: The time taken for the voice packets to reach the destination
o Packet loss: Data lost during transmission
o Mean opinion score (MOS): The standard for measuring codecs and is rated on a scale of
1 to 5
VOIP performance monitoring
20. Things to verify
Make sure to add CPU, Memory, Disk monitors(snmp), etc if not added
Make sure the port 161 is not blocked by your firewall
Test credential and update the community string or password (v1v2v3)
Mibbrowser
• Settings > Tools > Mibbrowser
• Load > CISCO_MIB > Select > freeMem > Get
> bufferBgHit > Get
Performance monitor not collecting data
22. Interfaces not discovered
Mibbrowser
• Settings > Tools > Mibbrowser
• Load > RFC1213-Mib > select > ifDesc > get
Things to verify
Enable interface discovery from discovery profile and scan the network
Make sure the port 161 is not blocked by your firewall
Test credential and update the community string or password (v1v2v3)
23. Interface monitor not collecting data
Mibbrowser
• Settings > Tools > Mibbrowser
• Load > IF-Mib > select > ifInOctets / ifOutOctets > get
> ifInErrors / ifOutErrors > get
> ifSpeed > get
> ifHCInOctets / ifHCOutOctets (64bit) > get
Things to verify
Make sure the port 161 is not blocked by your firewall
Test credential and update the community string or the password (v1v2v3)
25. Network reports
• Router / Switch health report
• Identify devices with high packet loss or response time
• Interfaces availability report
• Identify overloaded devices with high cpu, memory etc
• Identify devices with heavy incoming and outgoing traffic
• Identify interfaces with high incoming and outgoing errors or discards