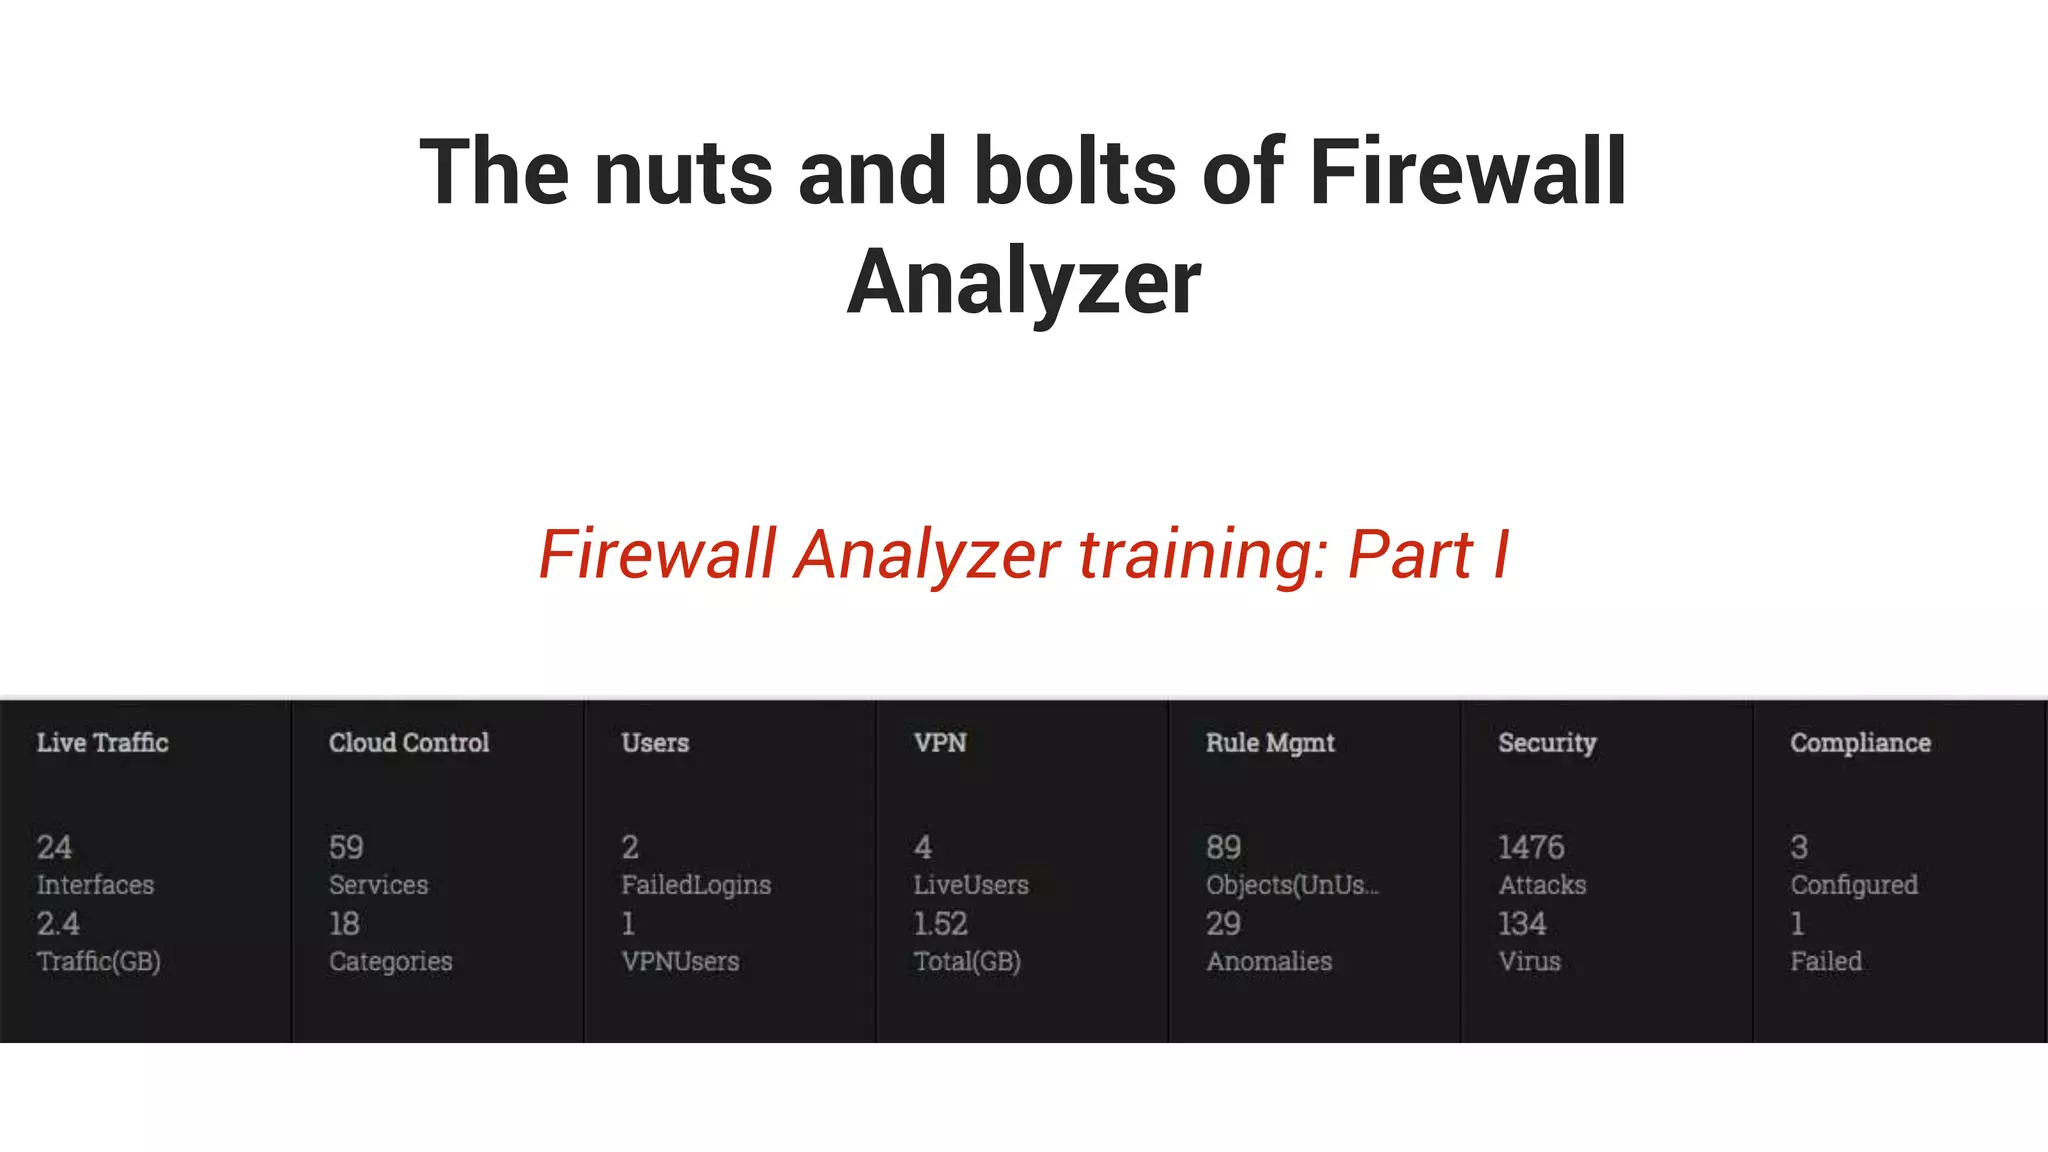
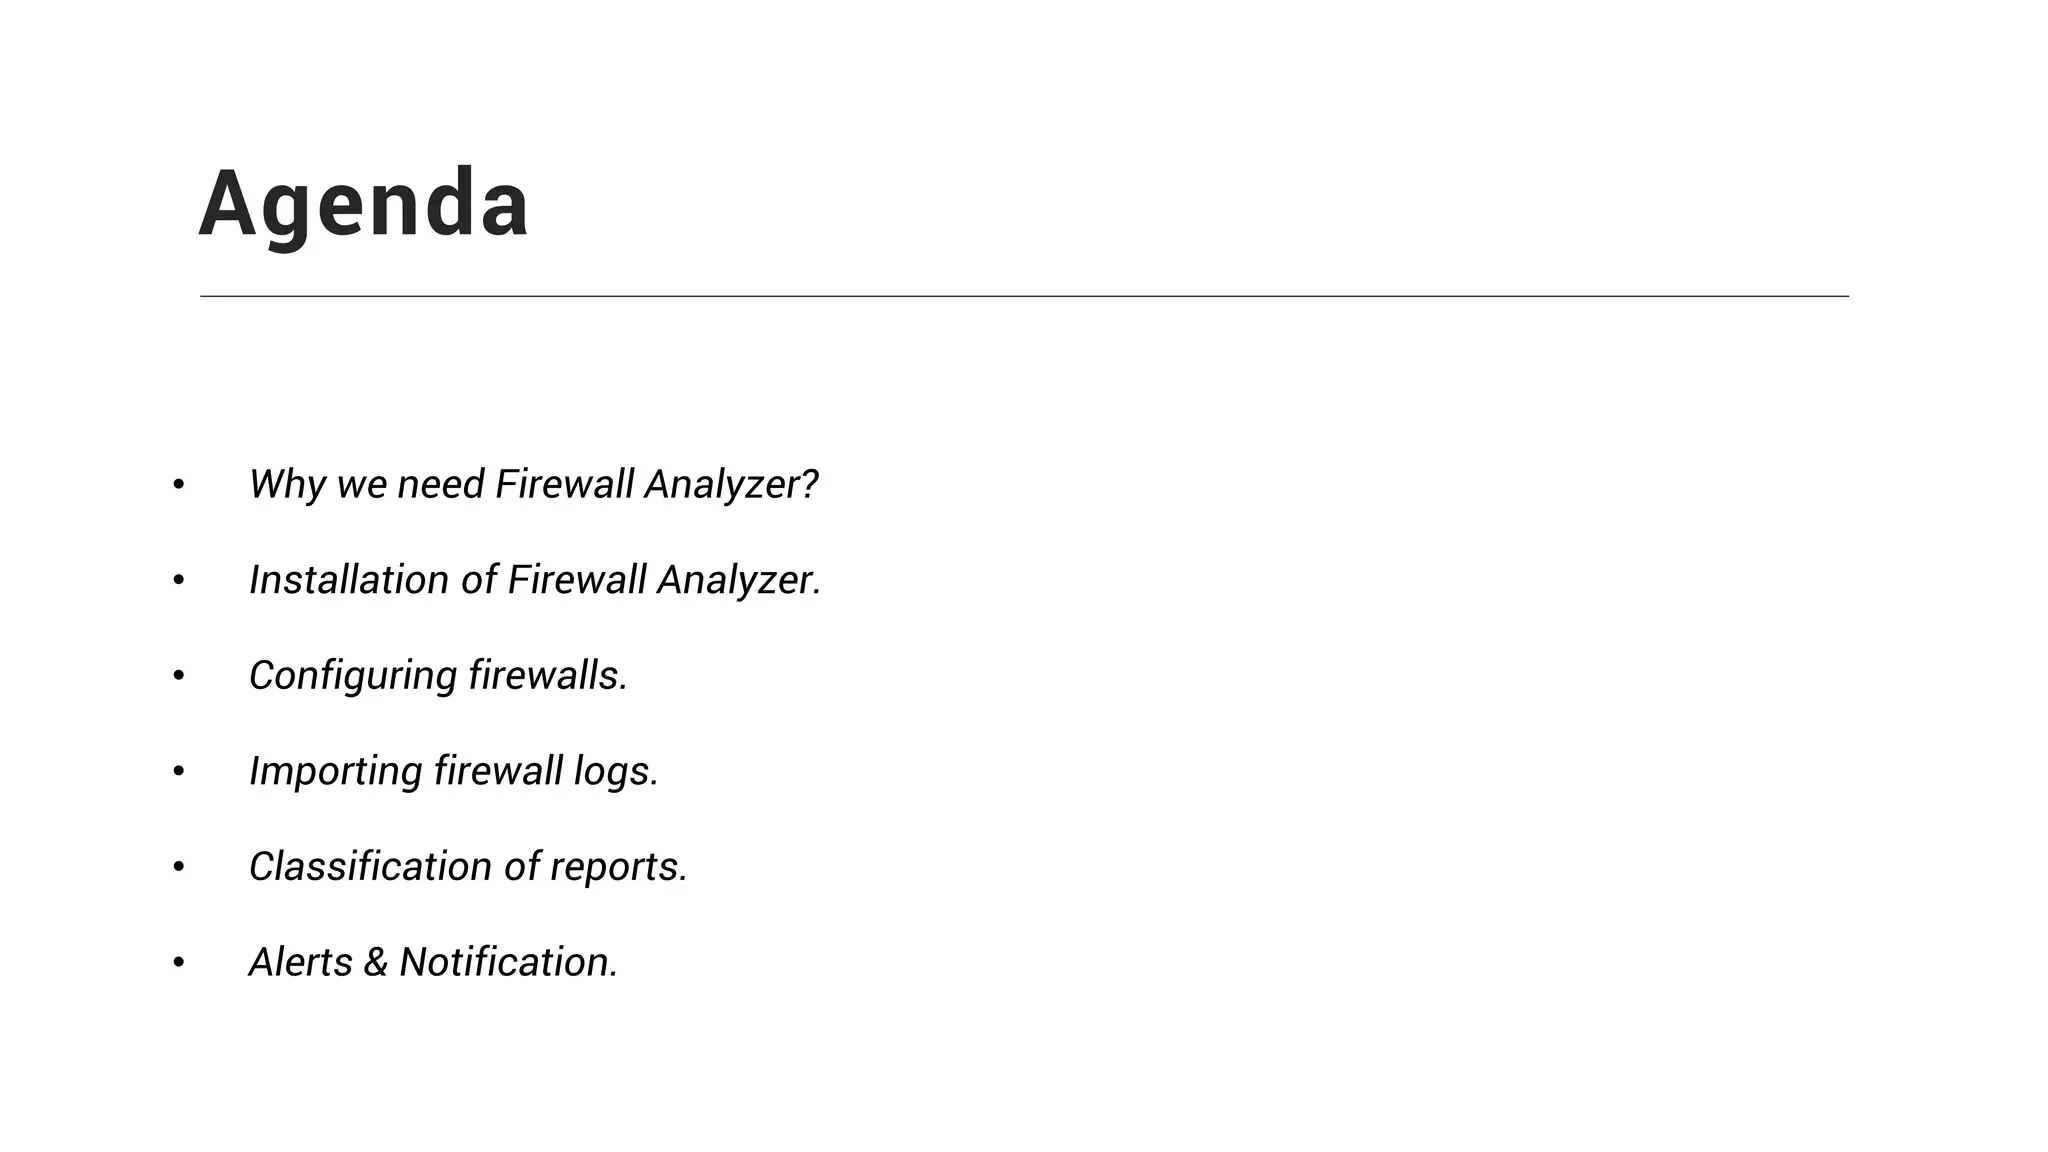
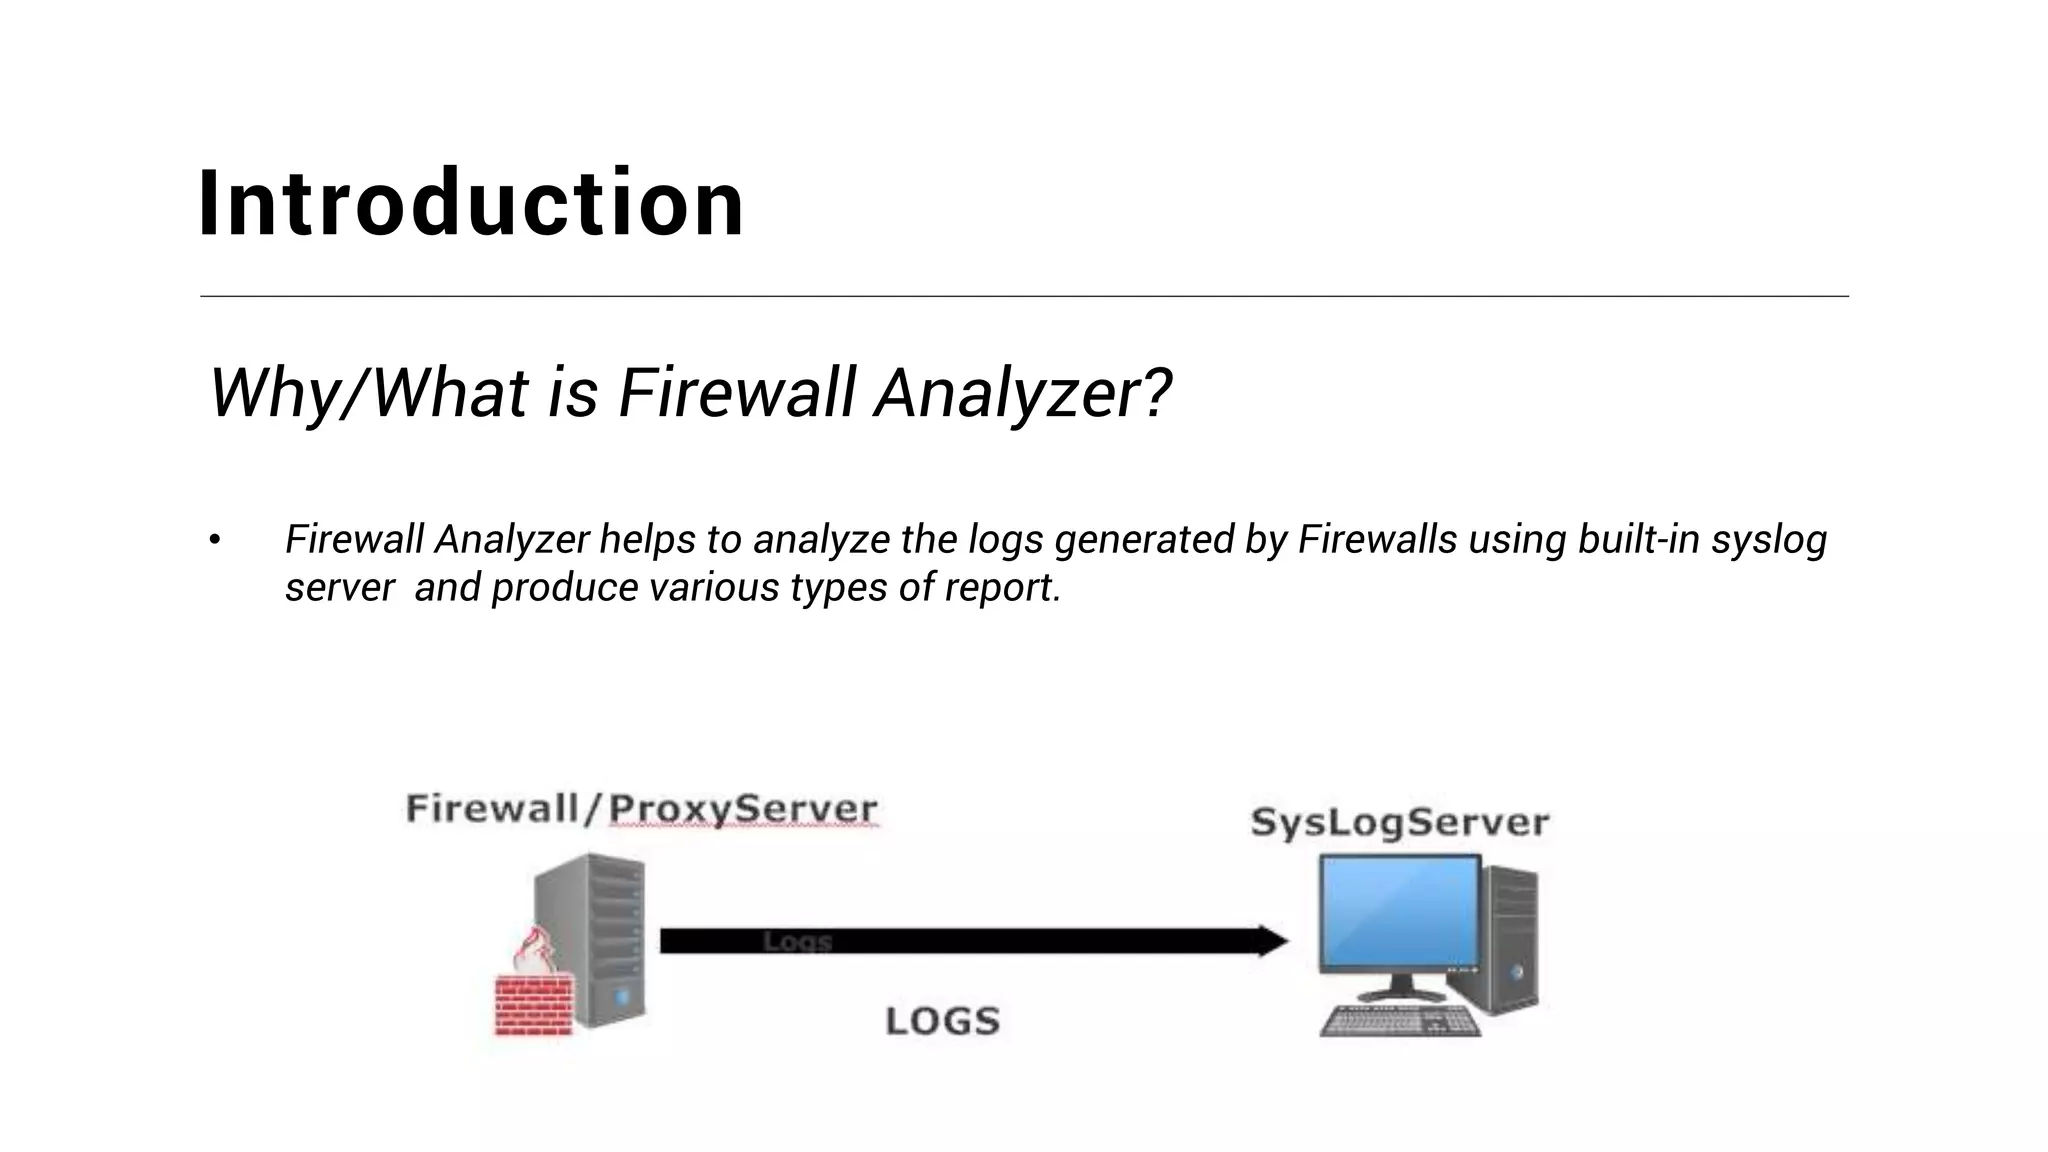
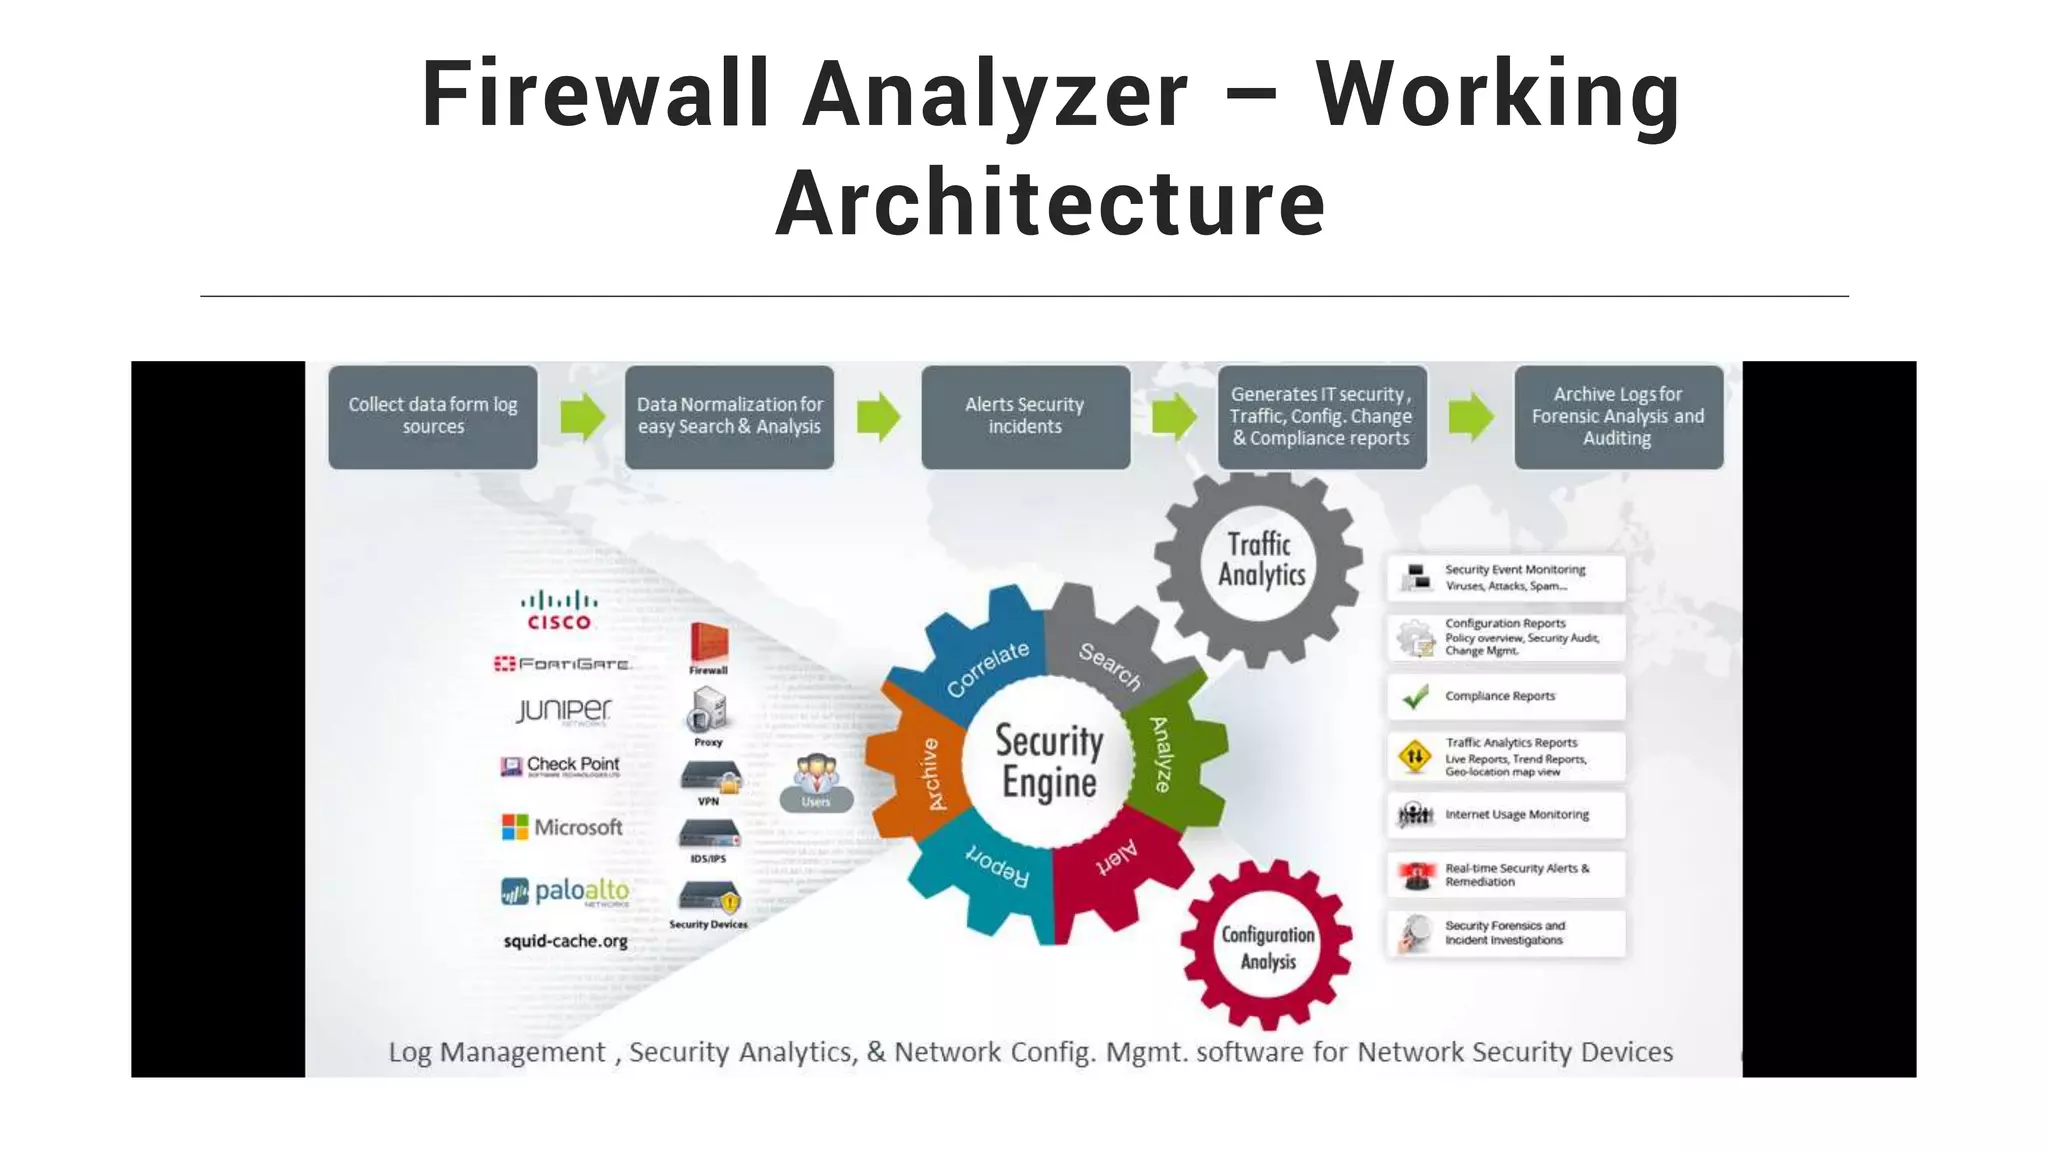
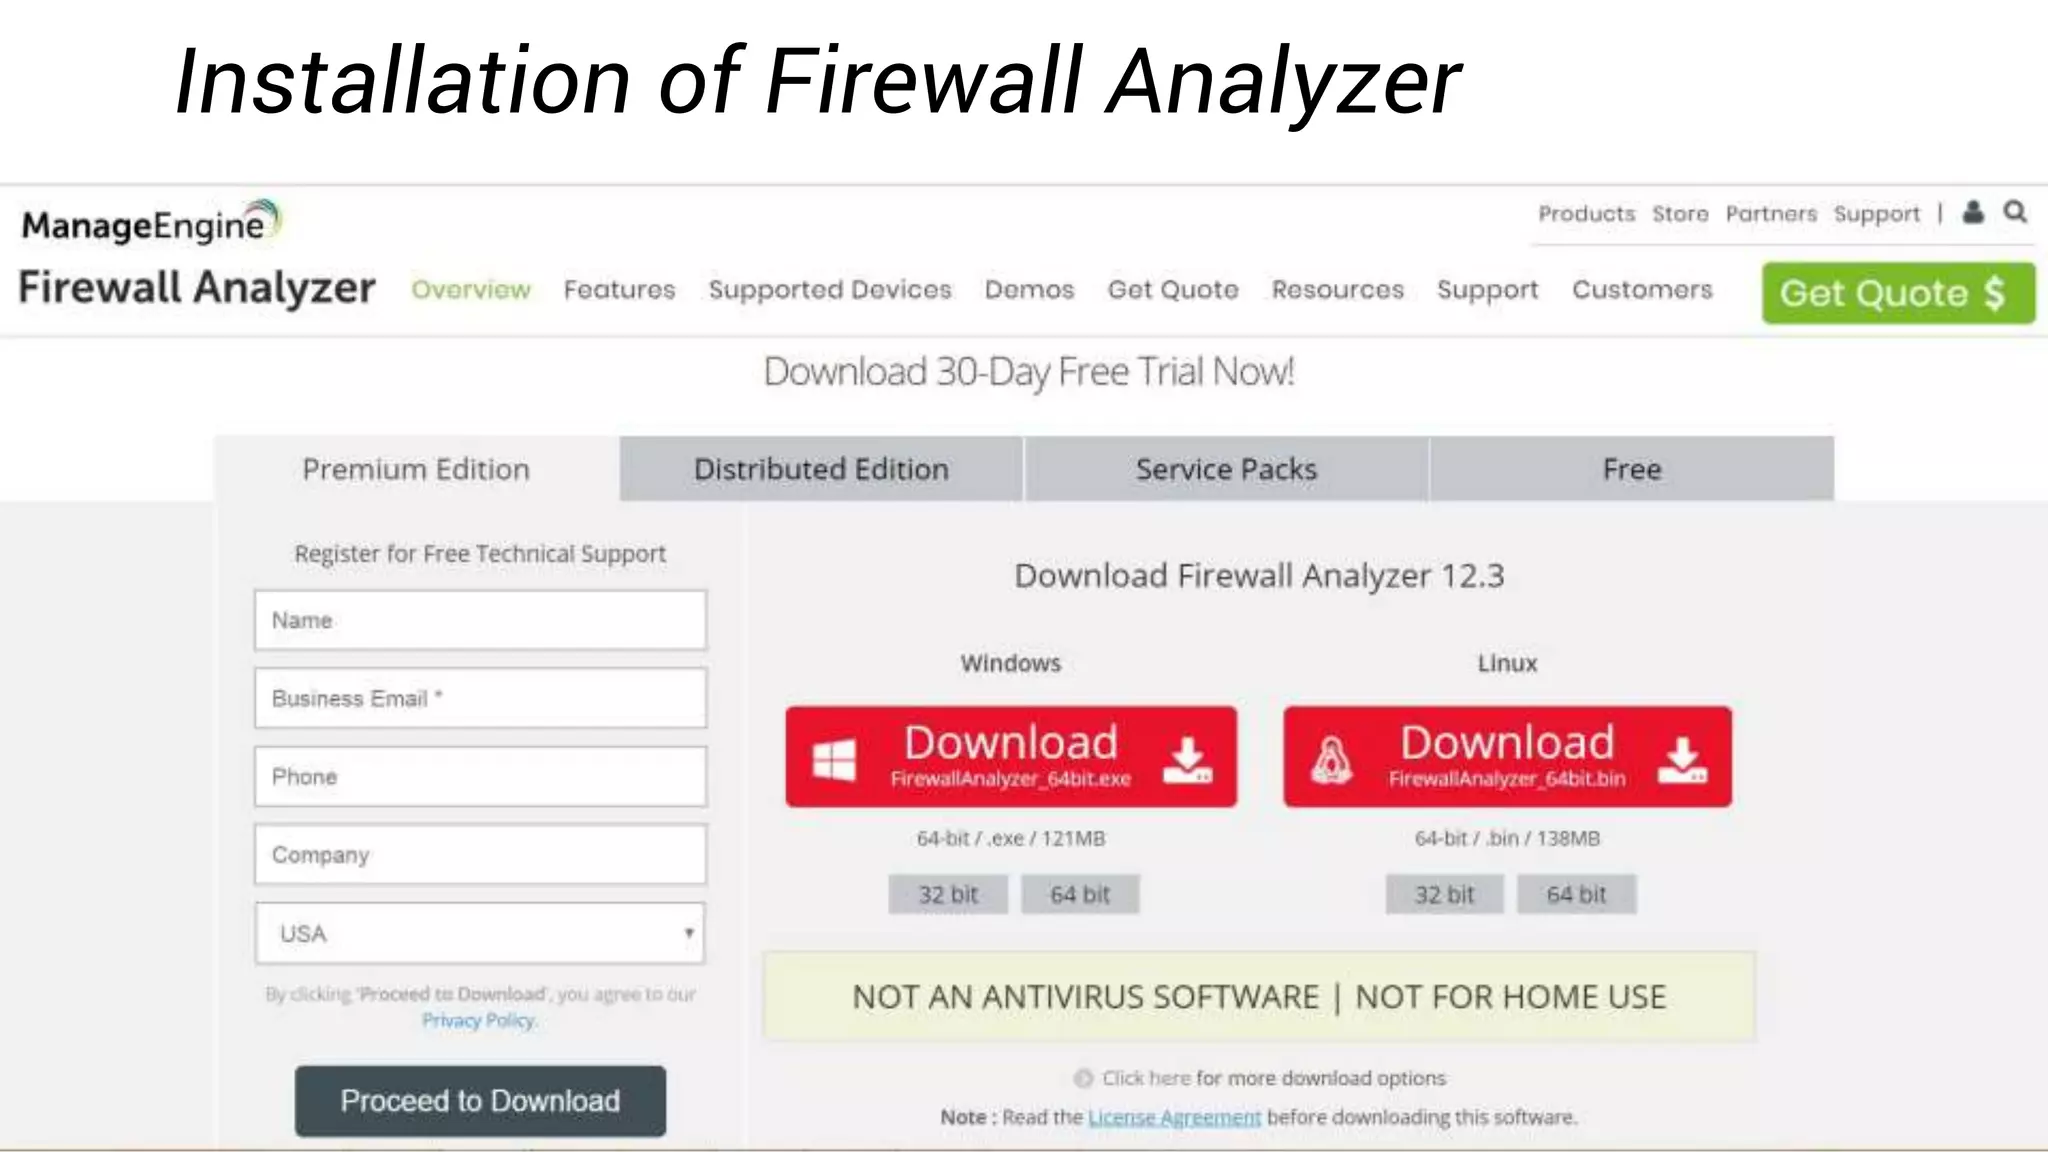
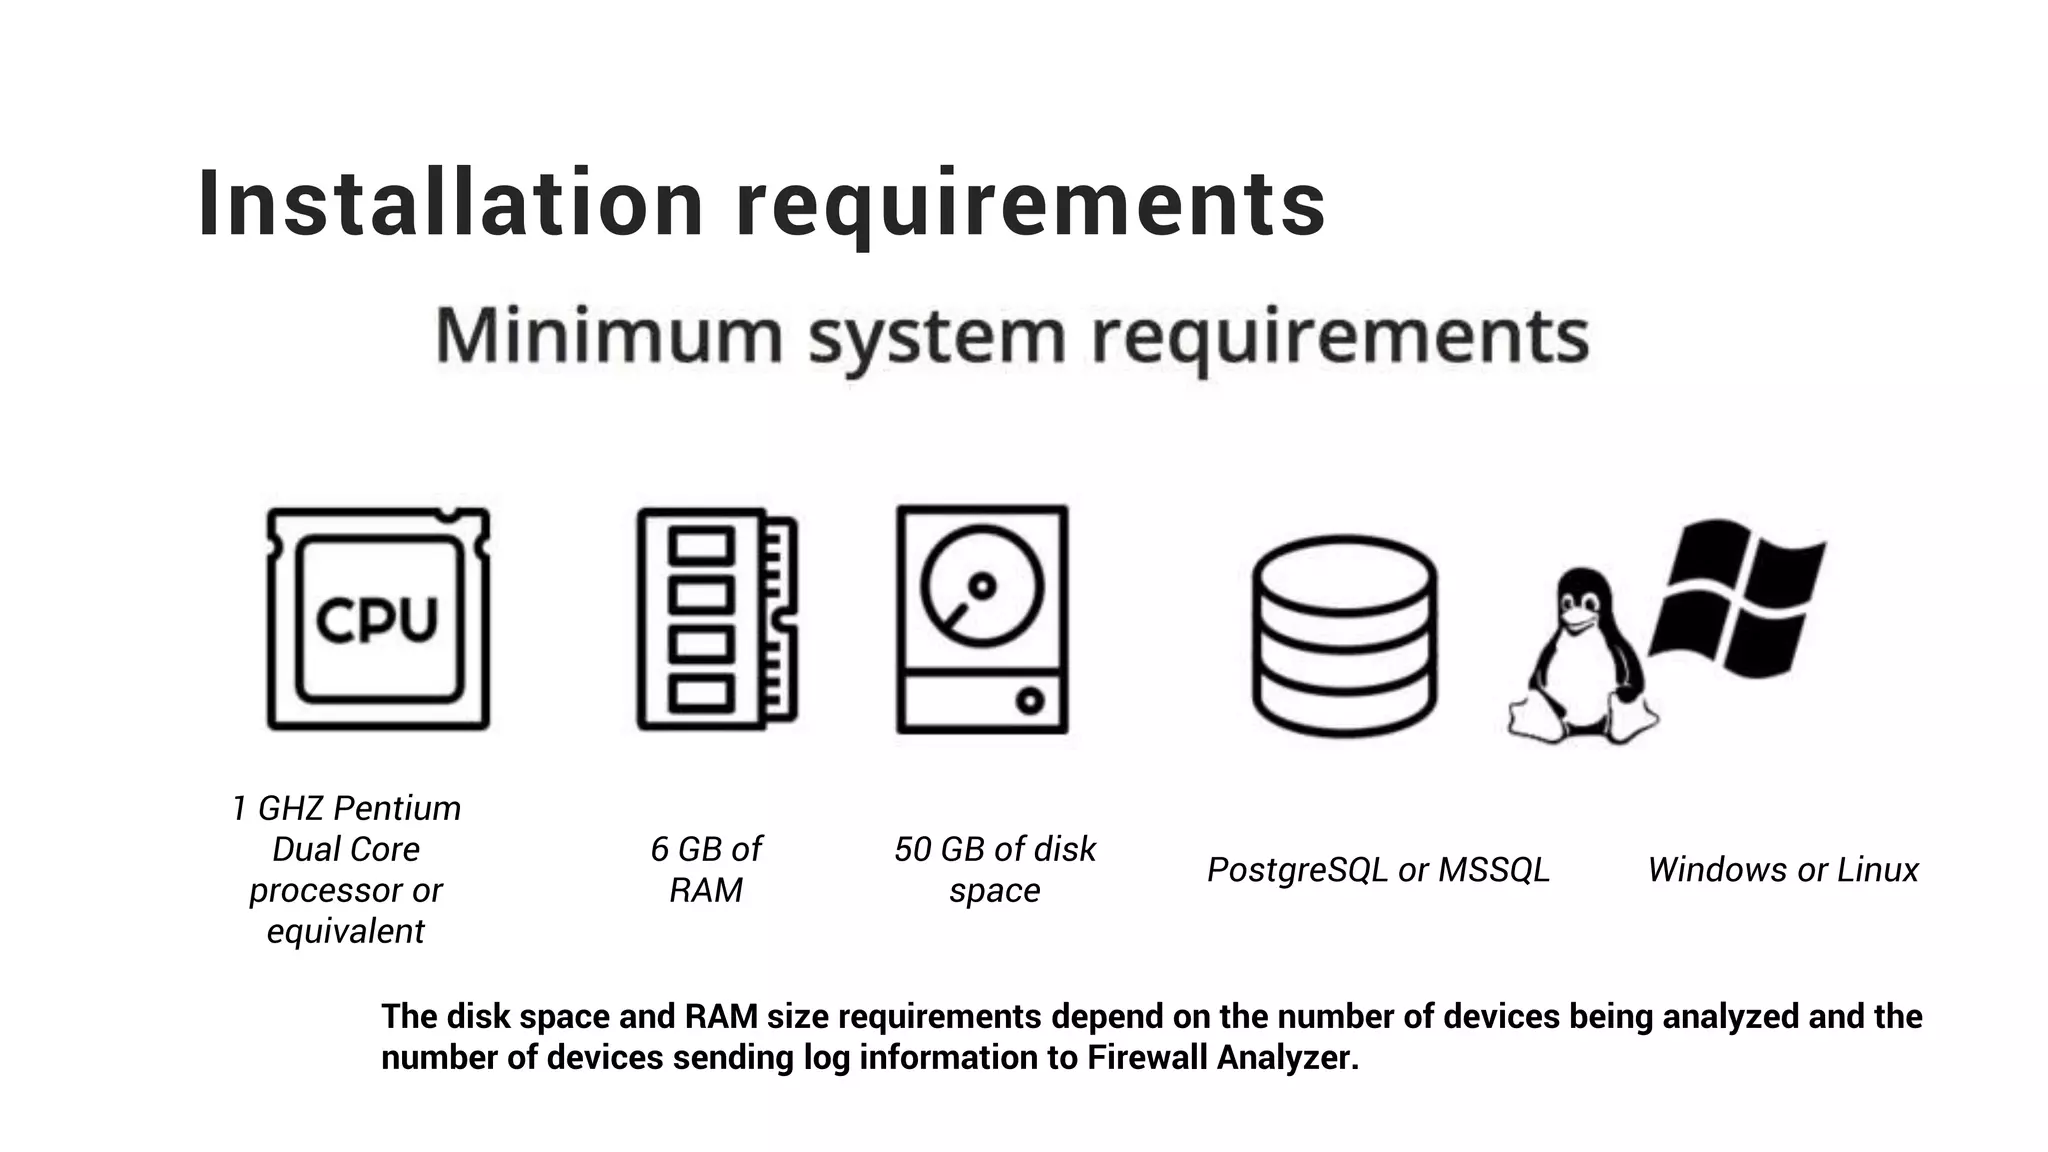
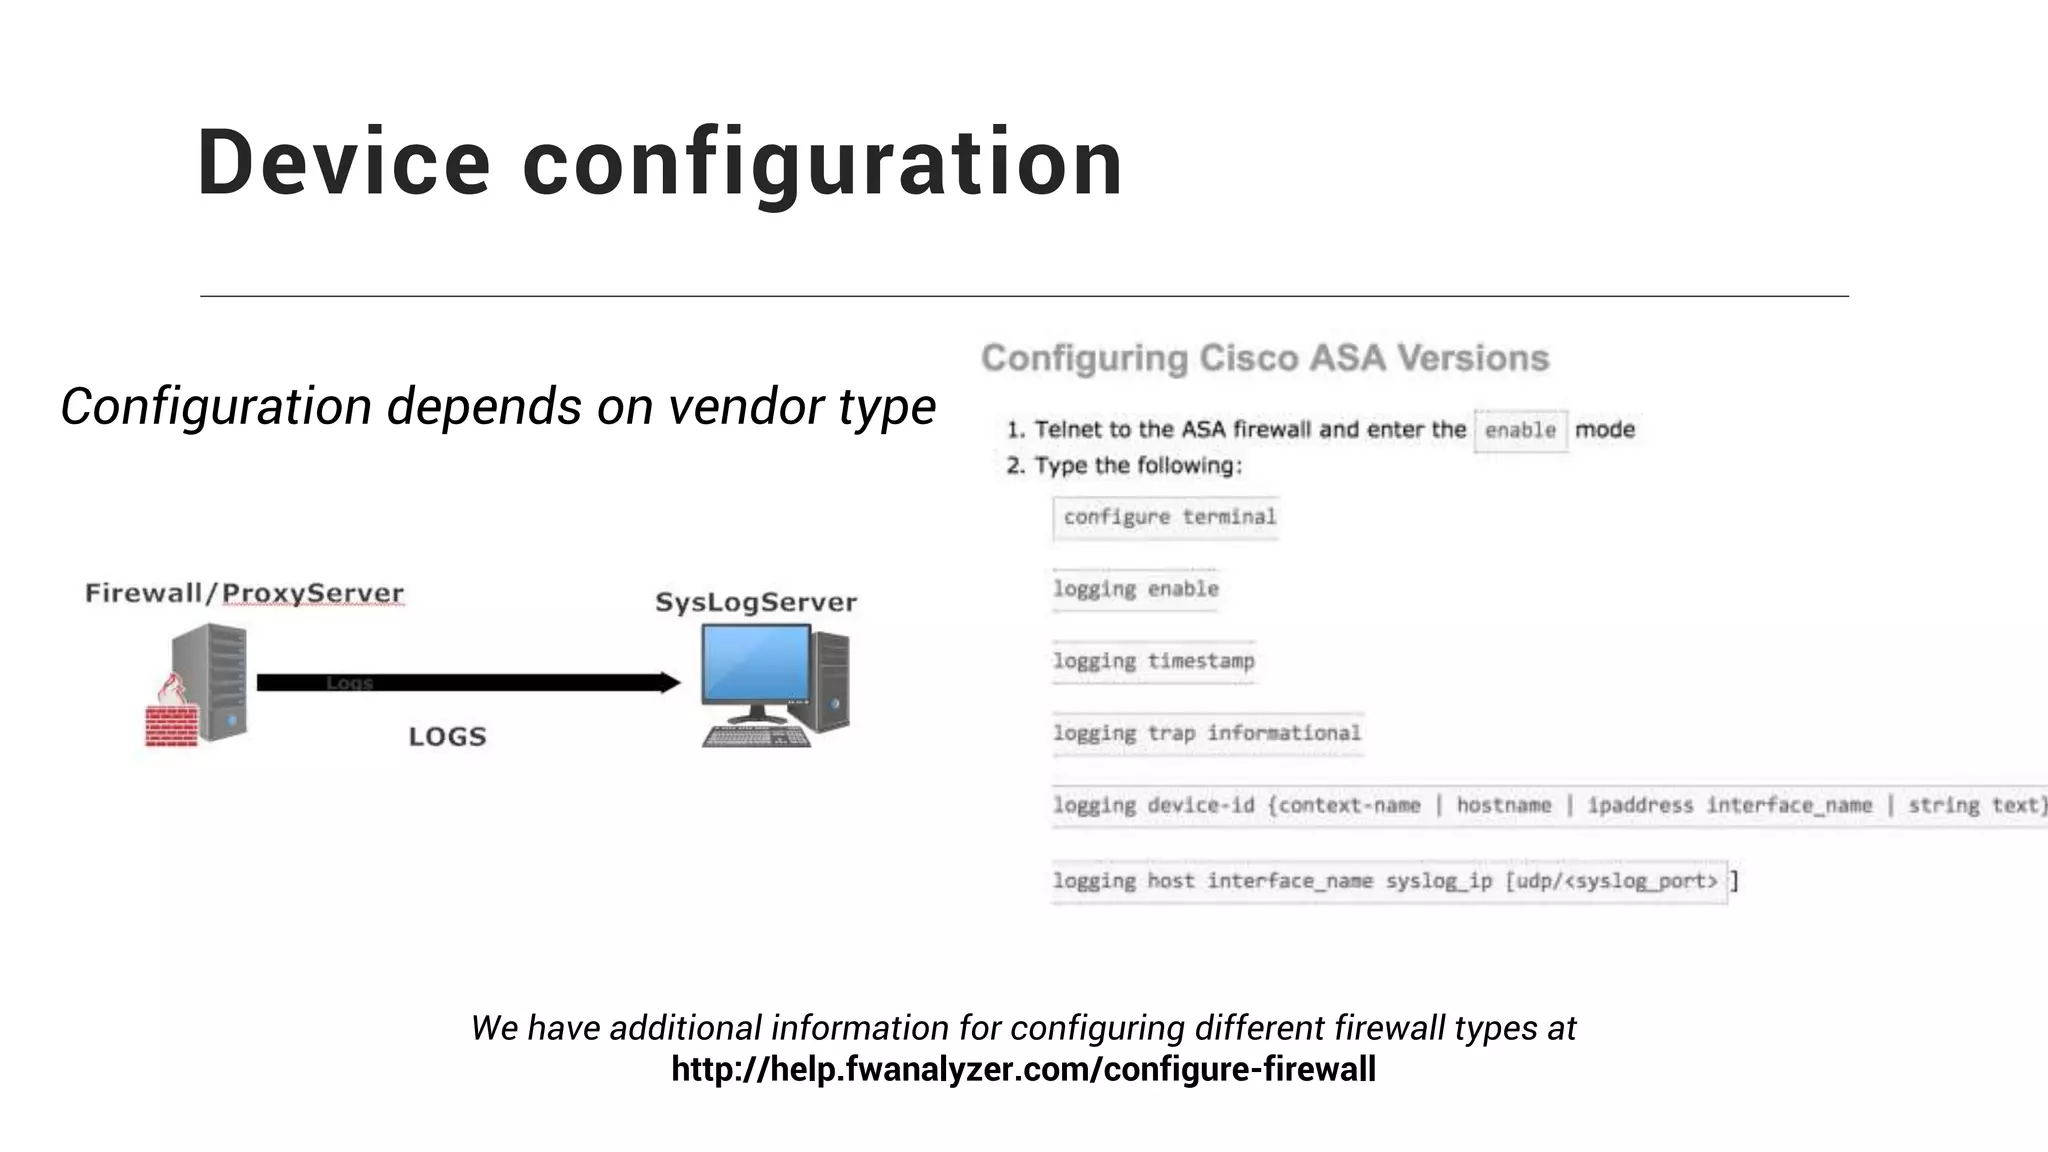
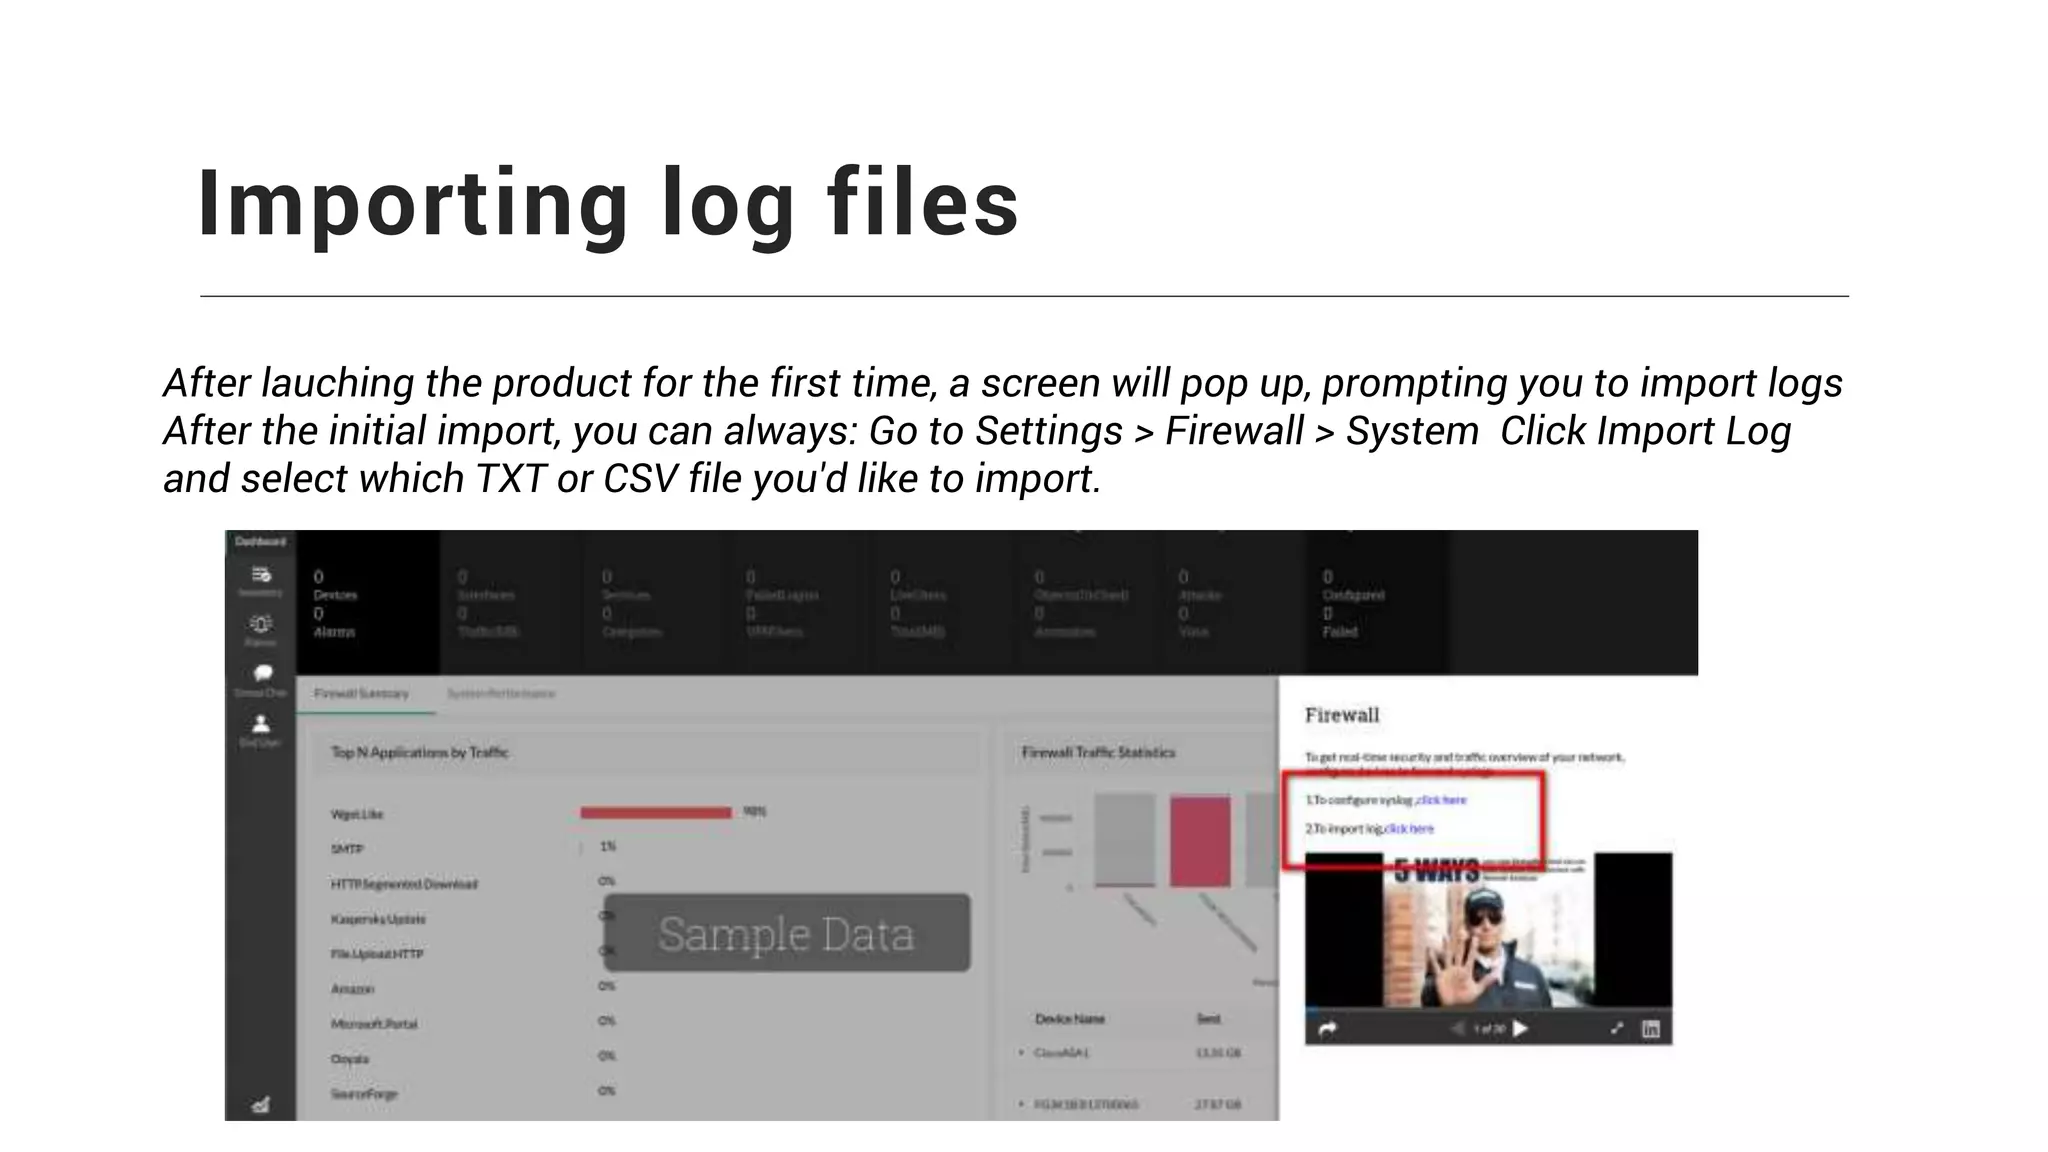
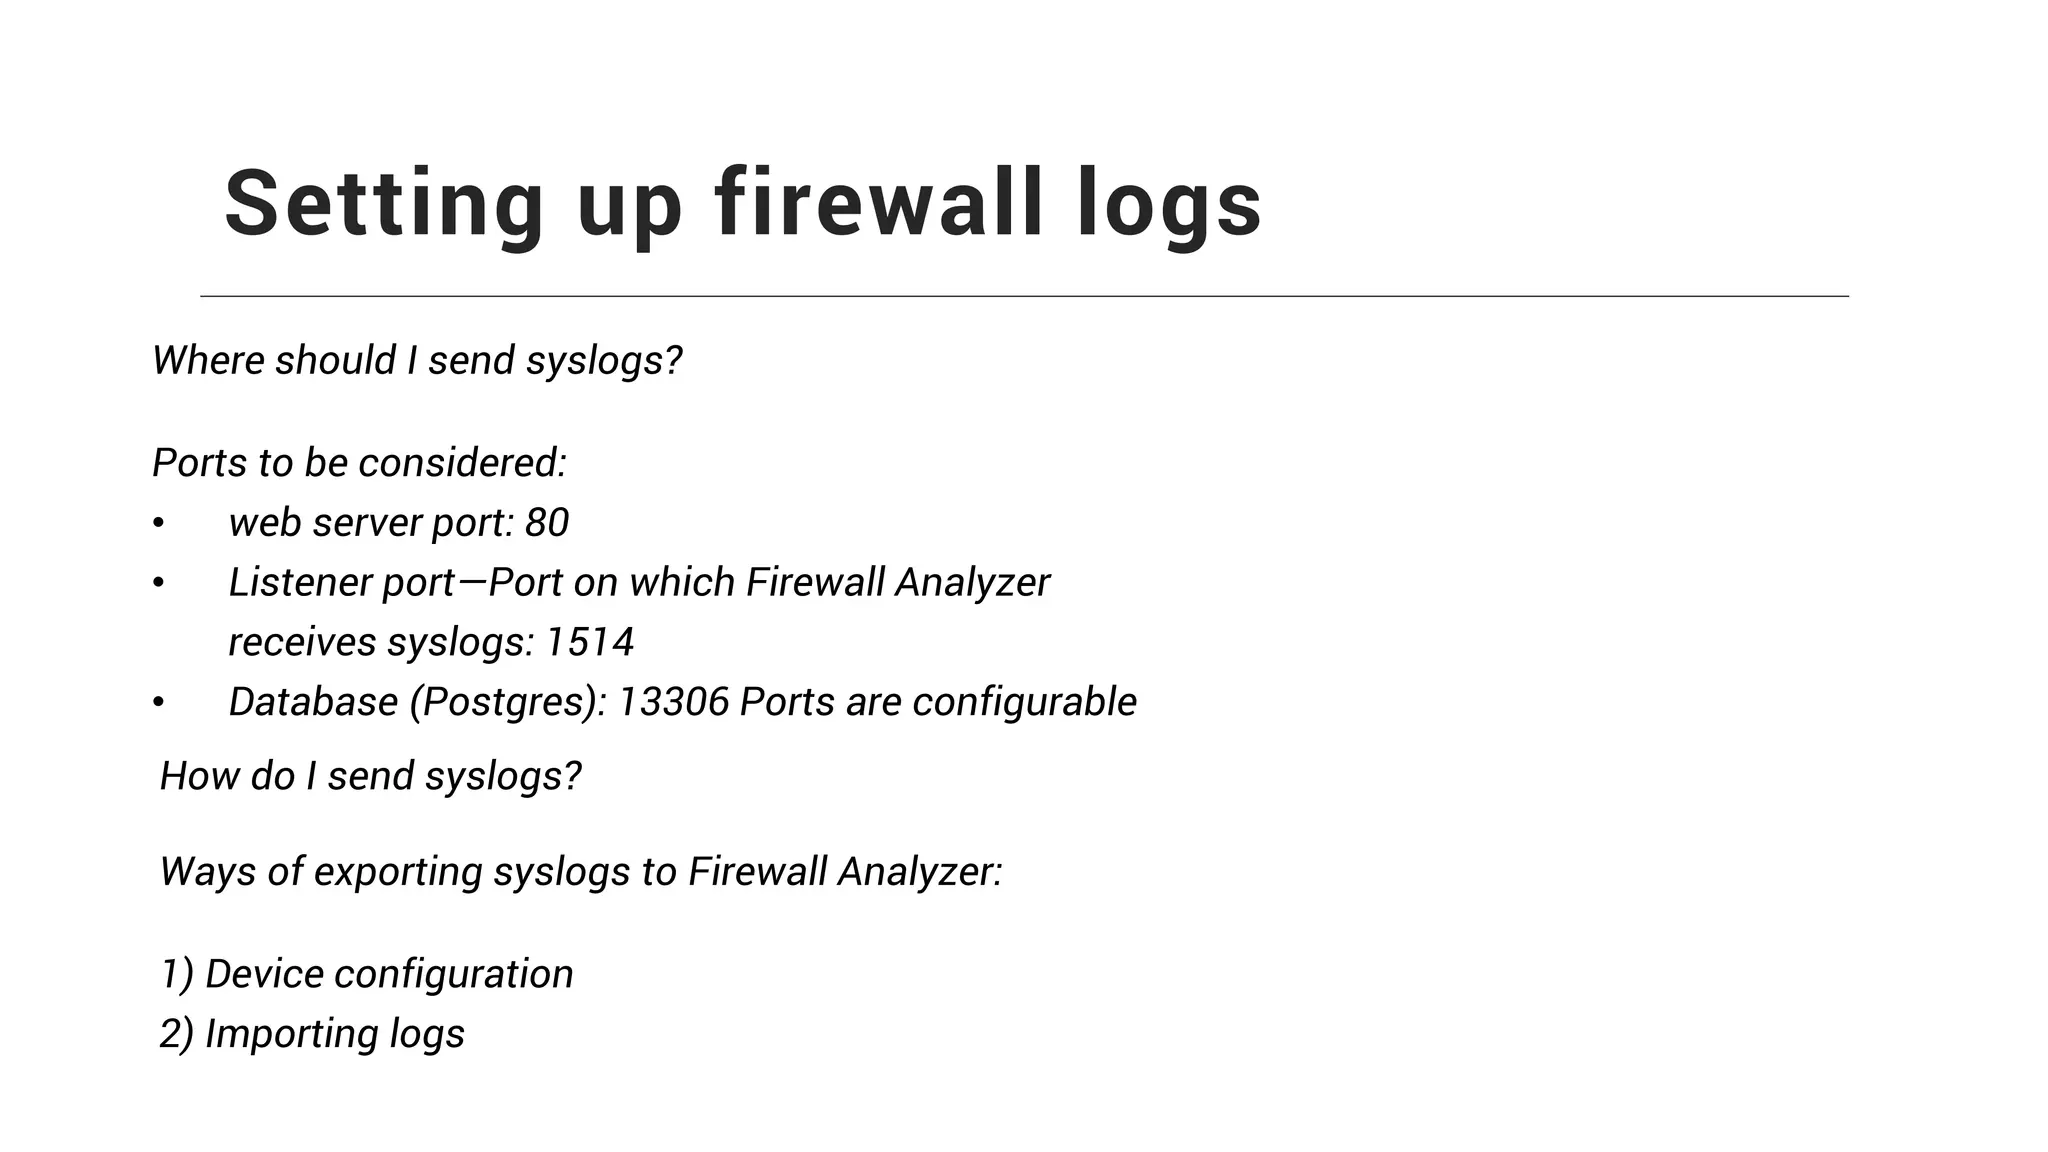
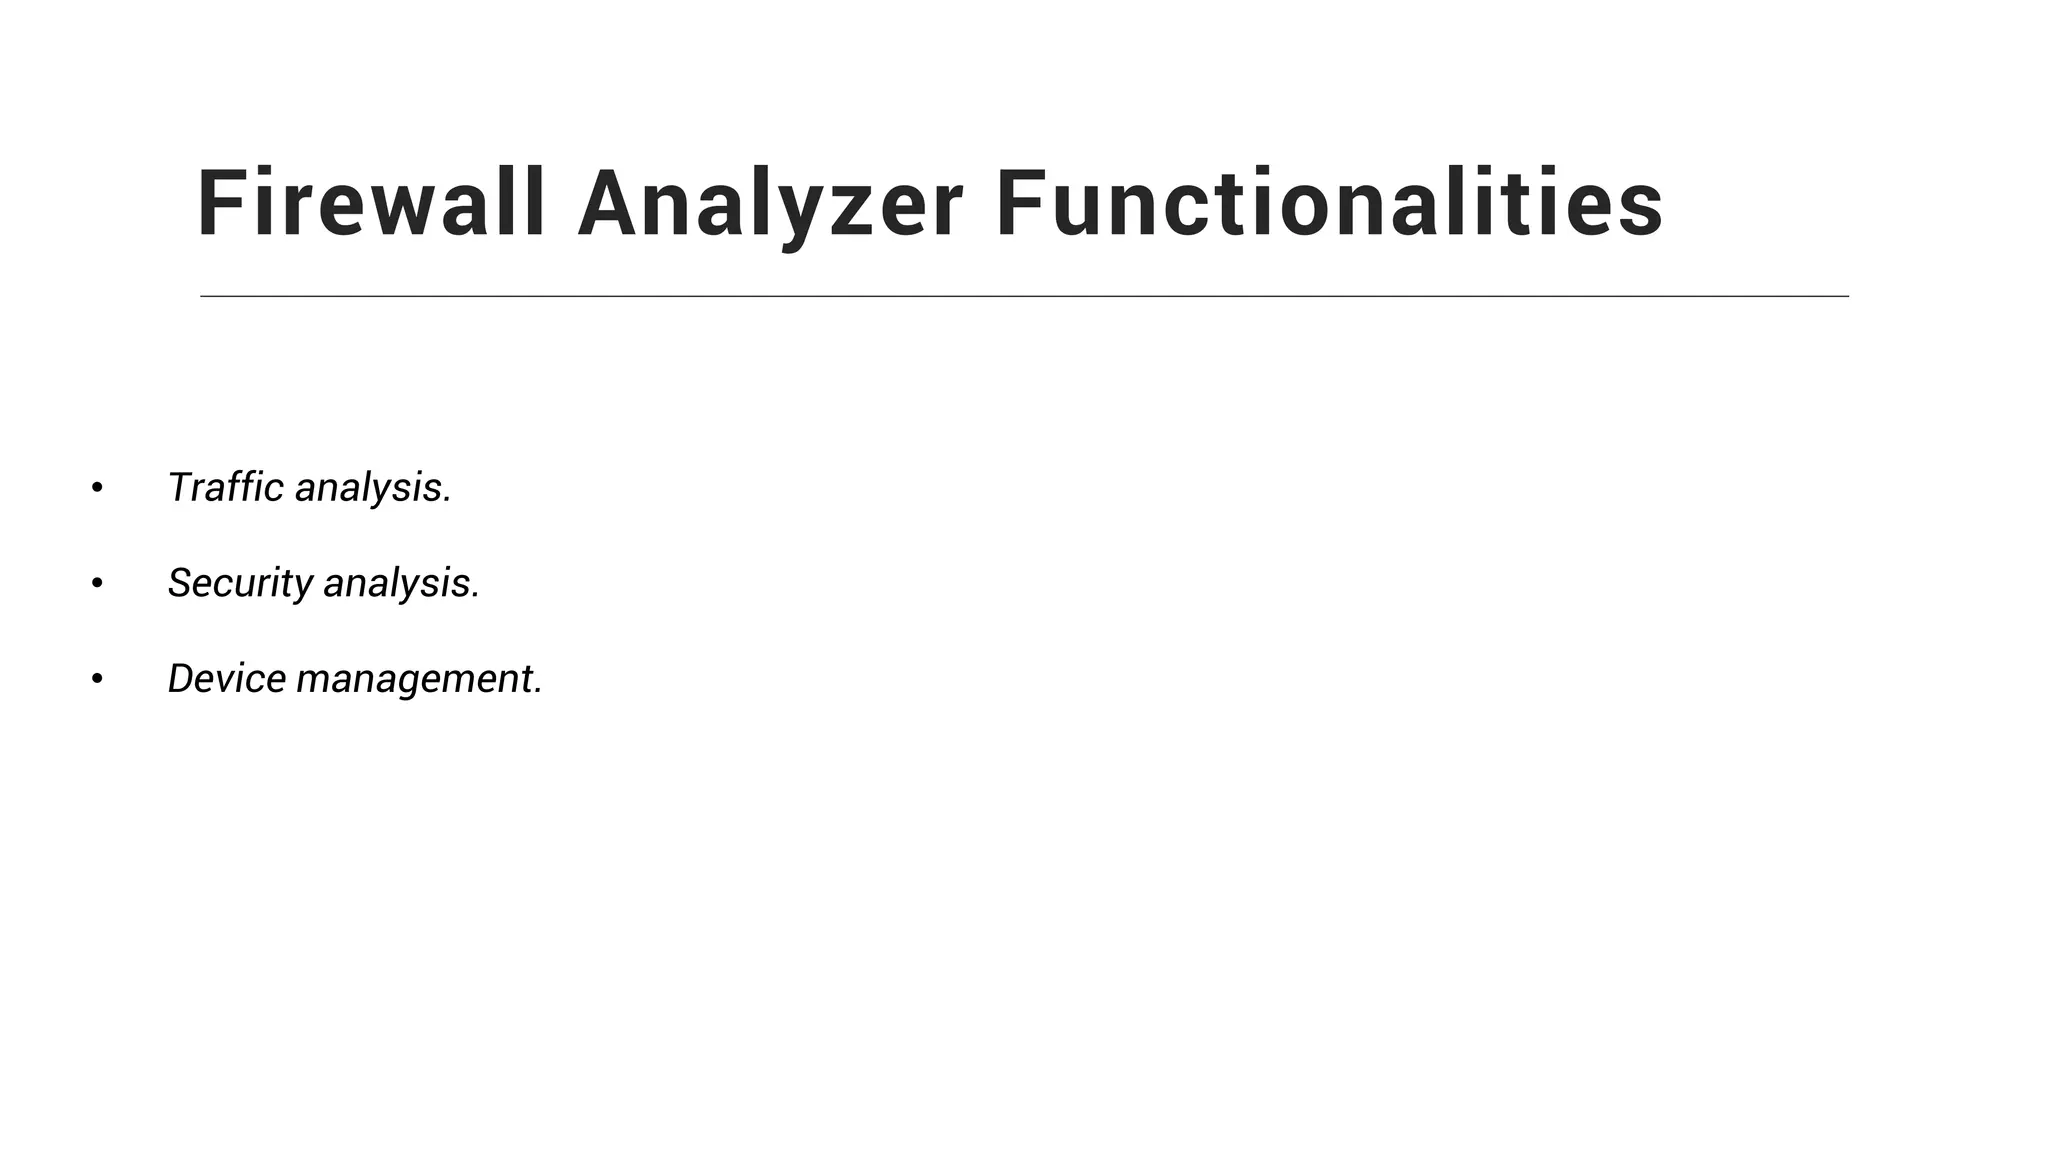
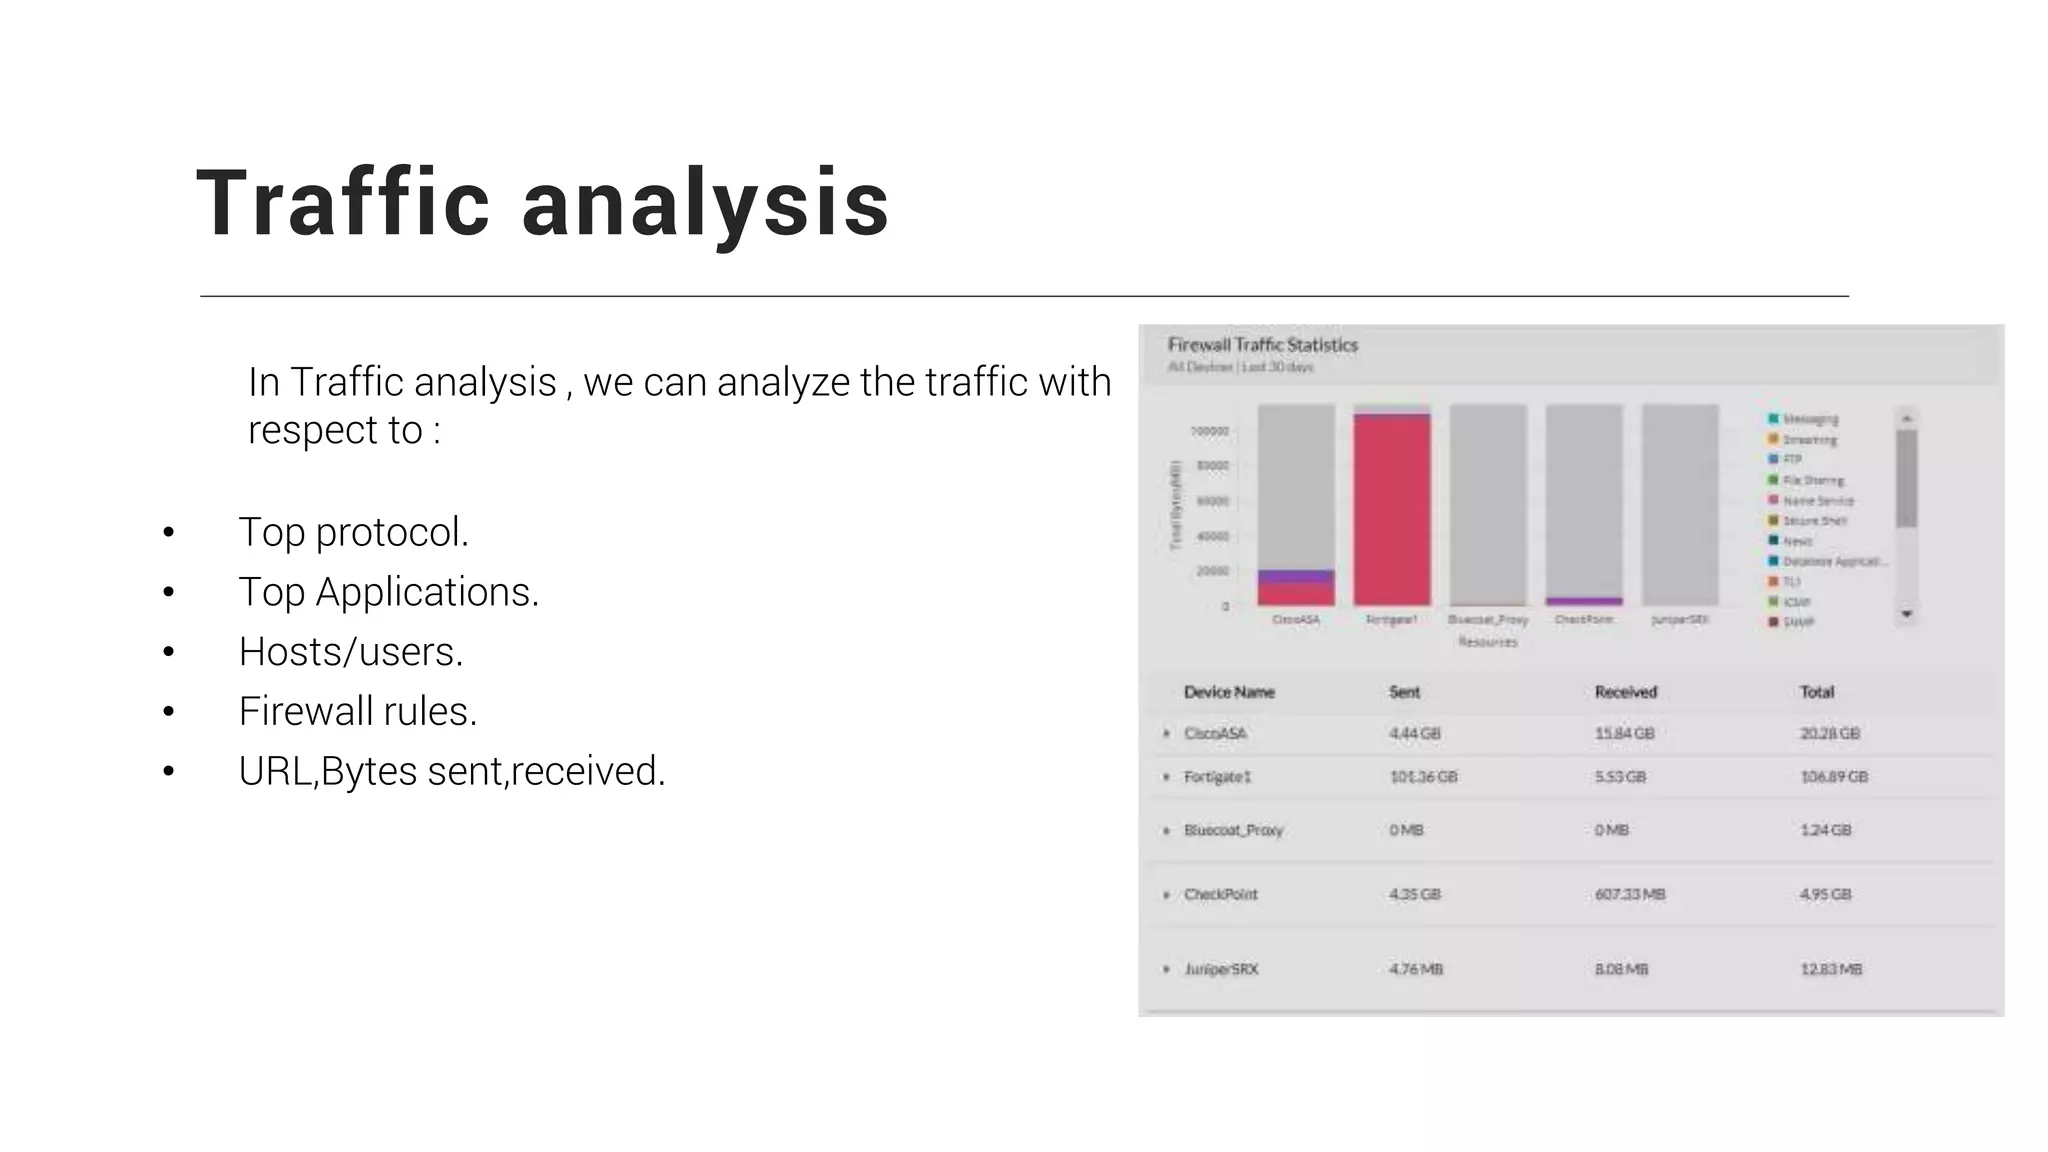
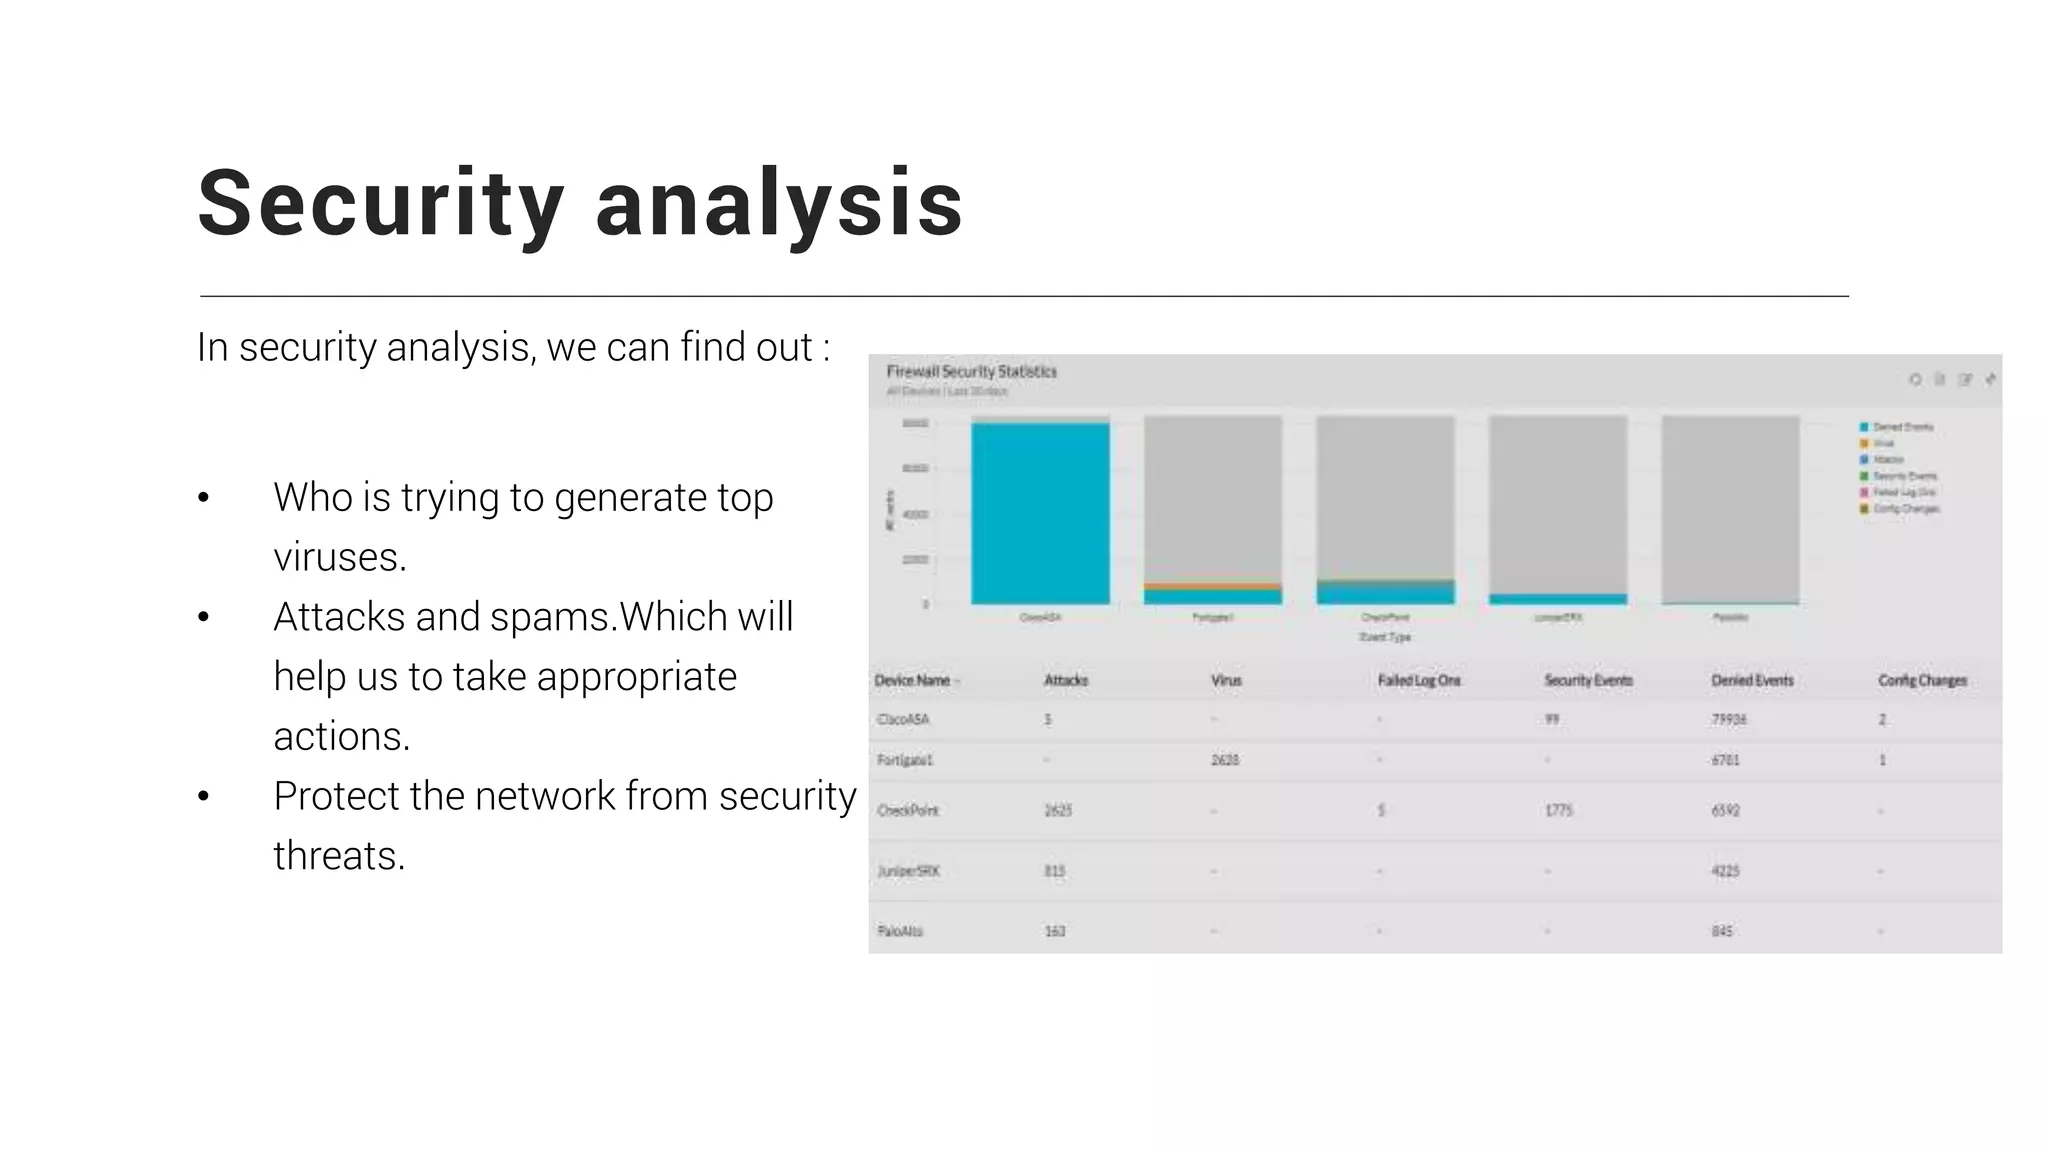
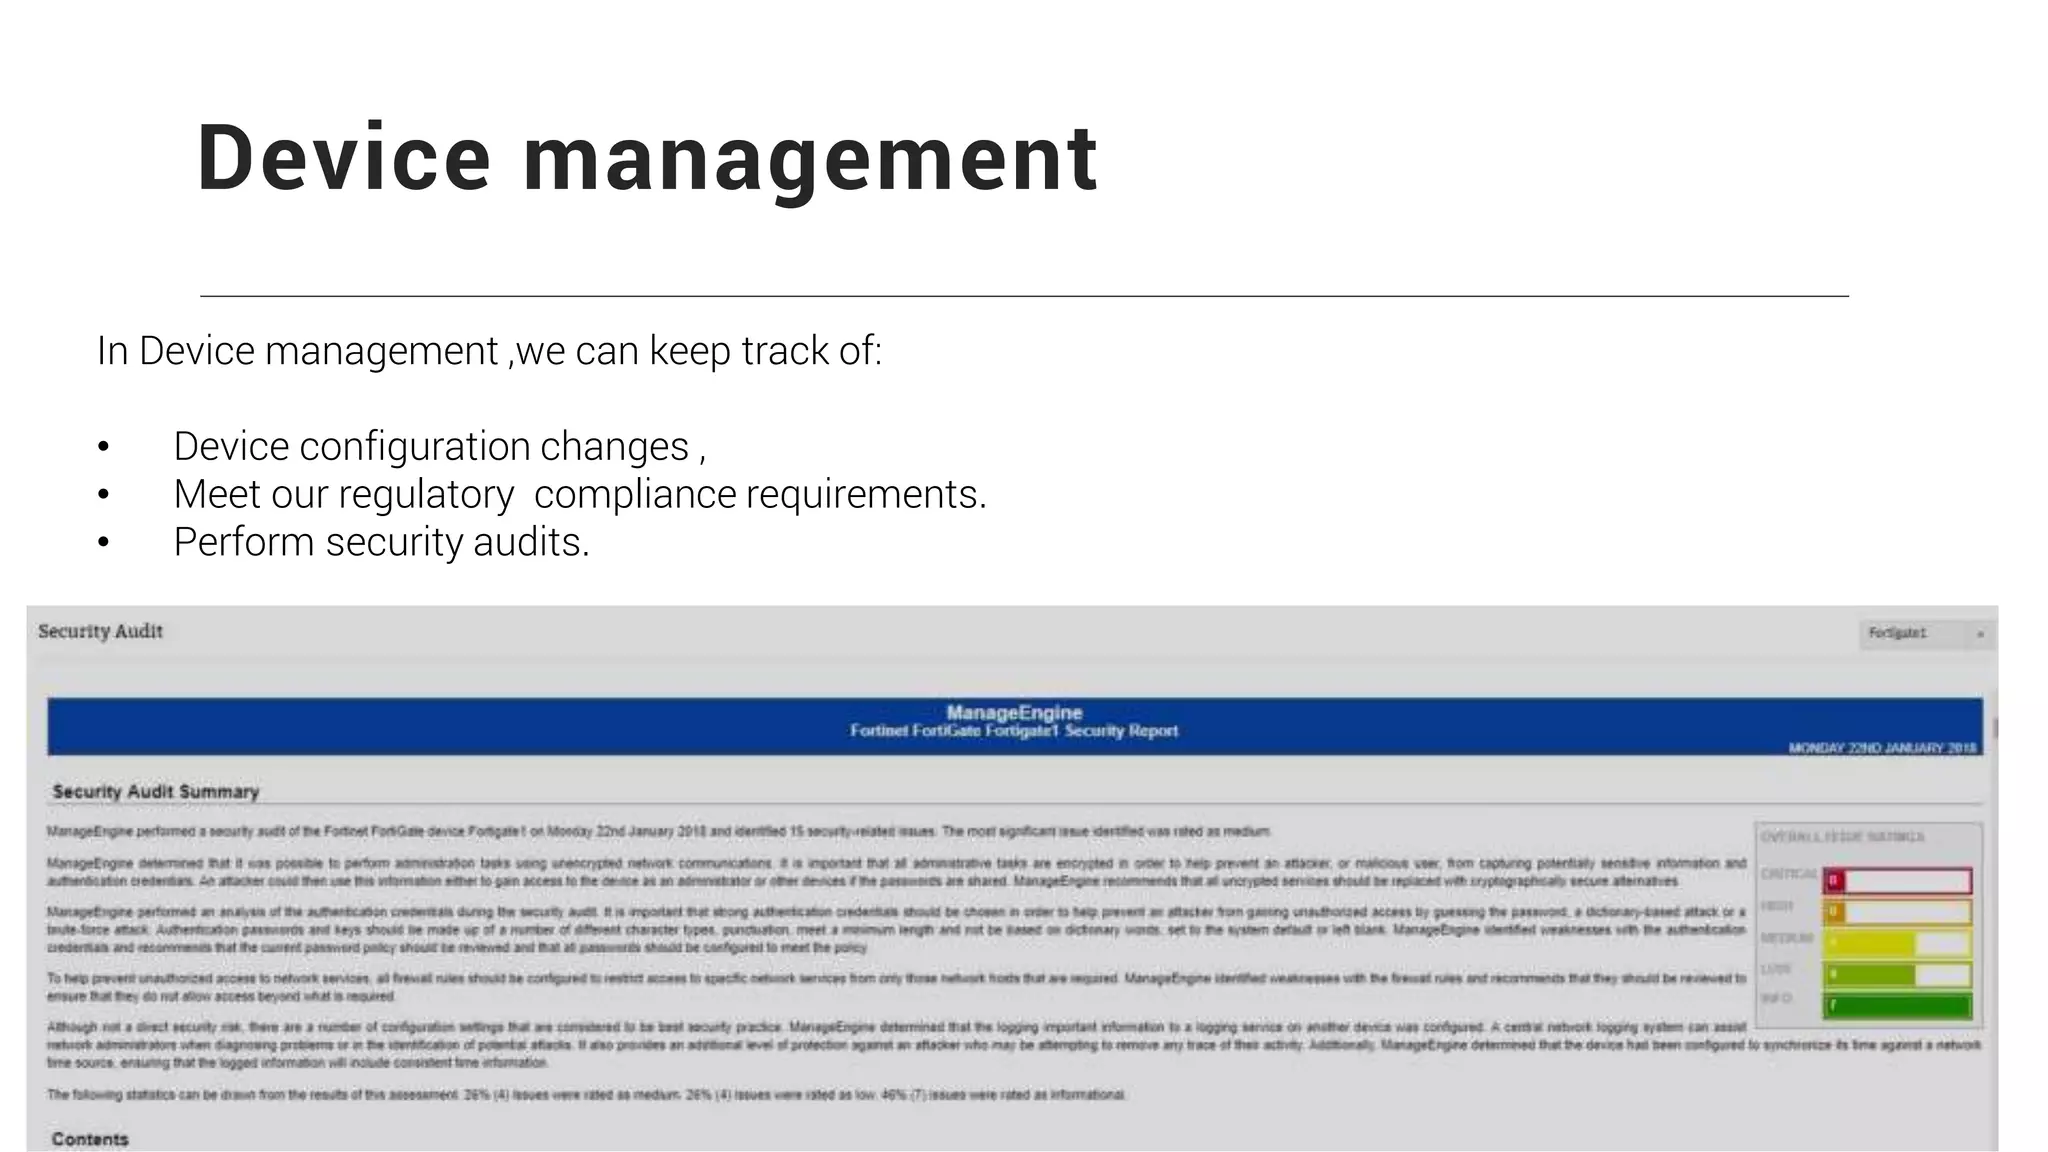
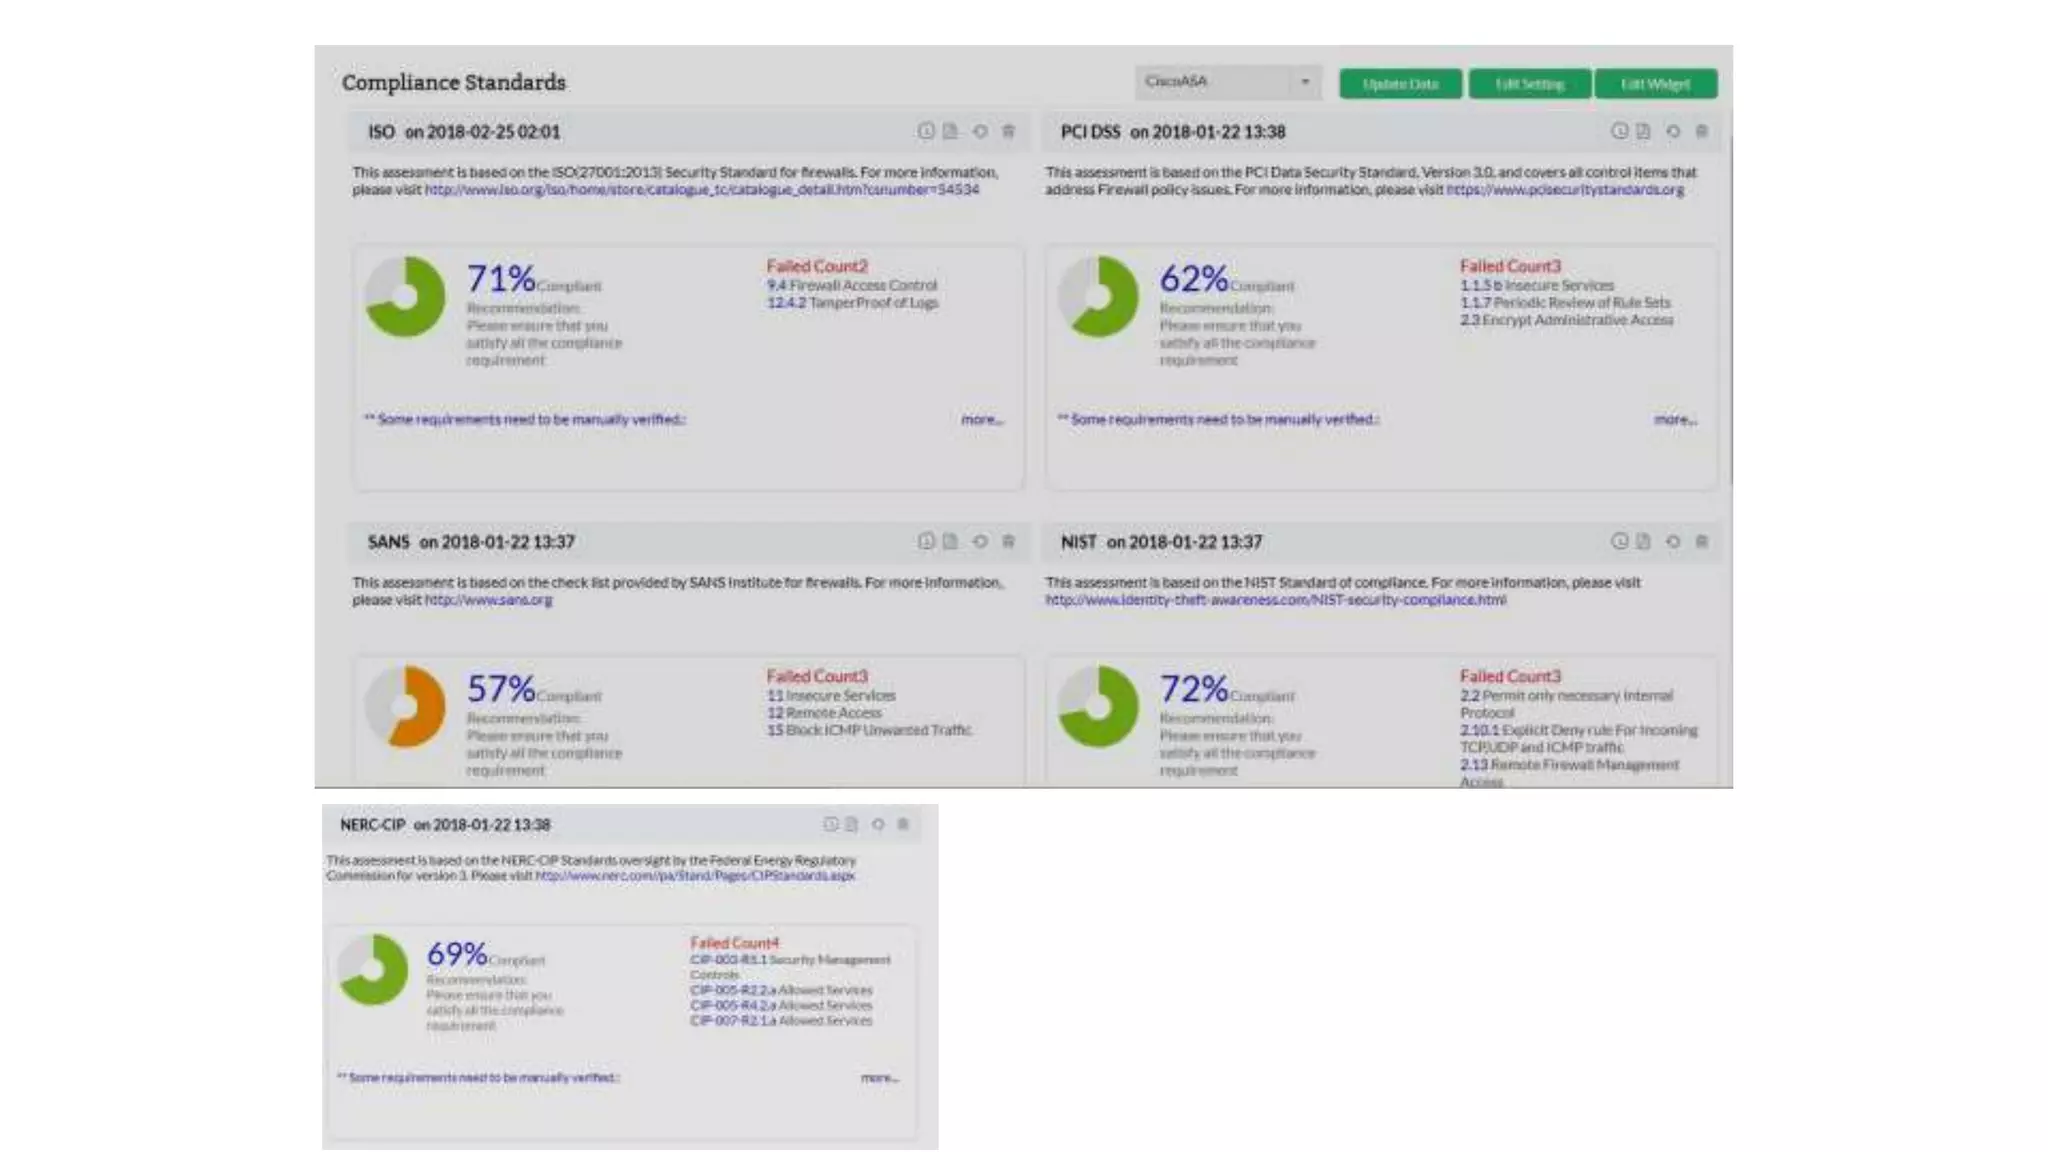
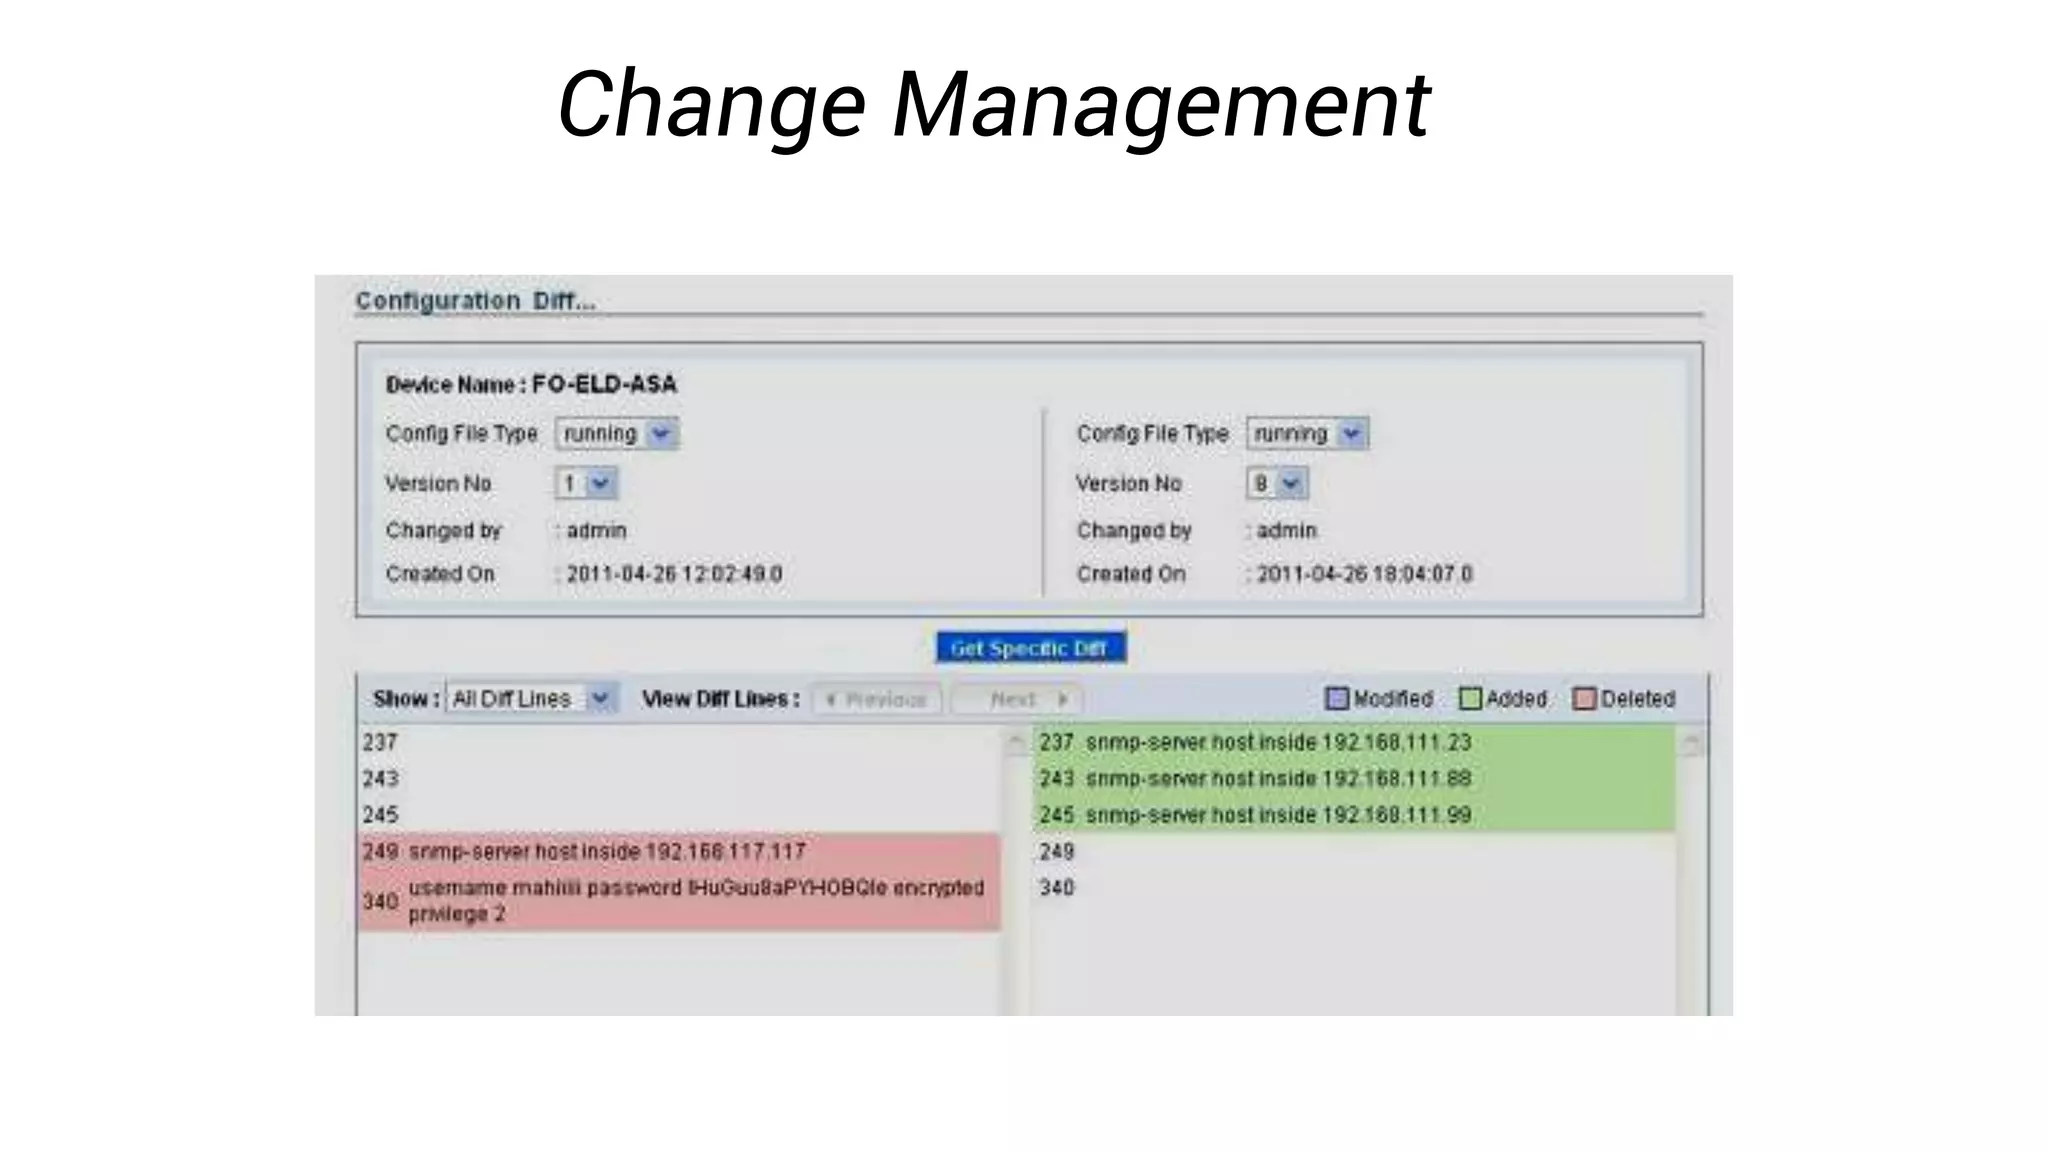
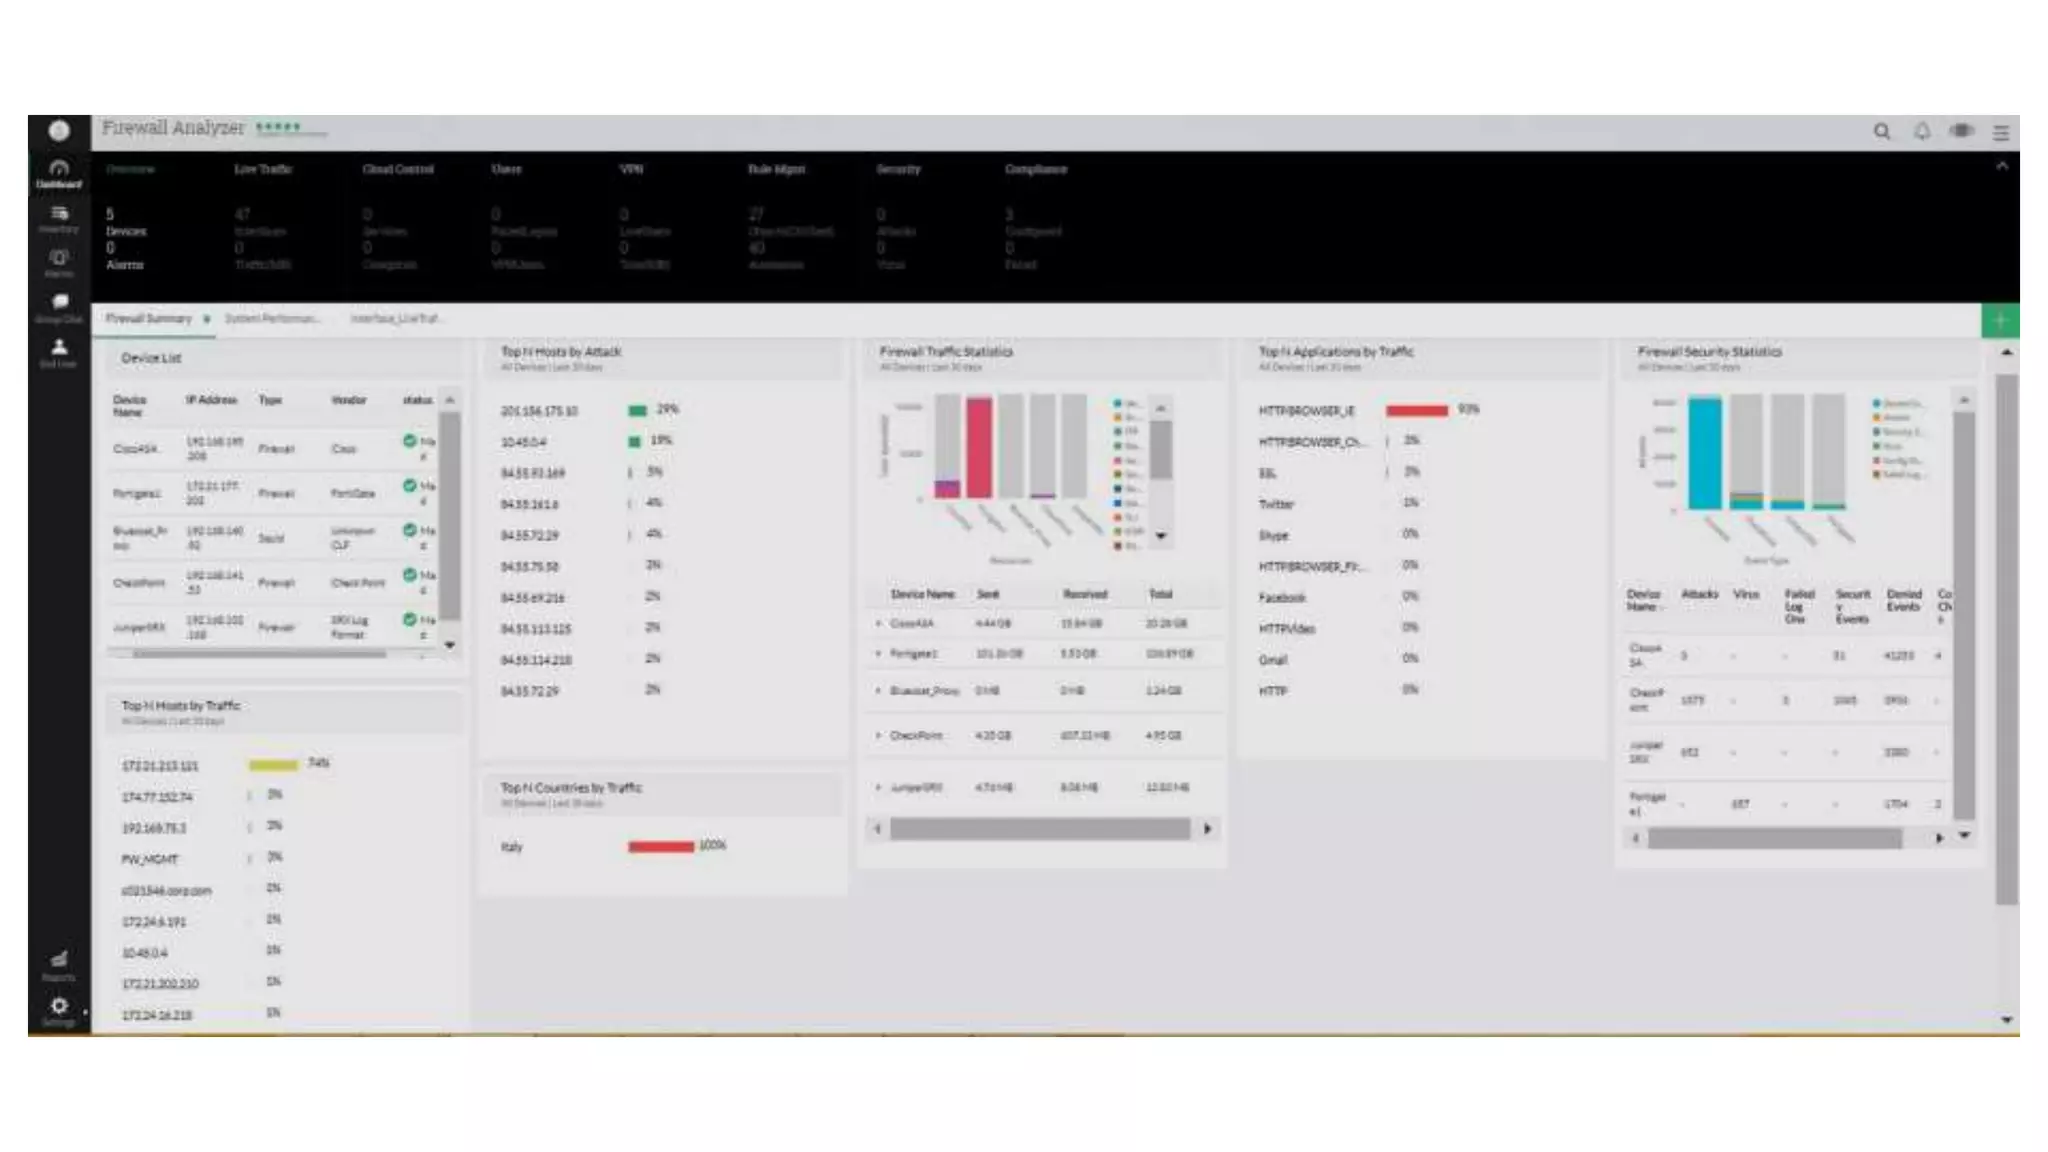
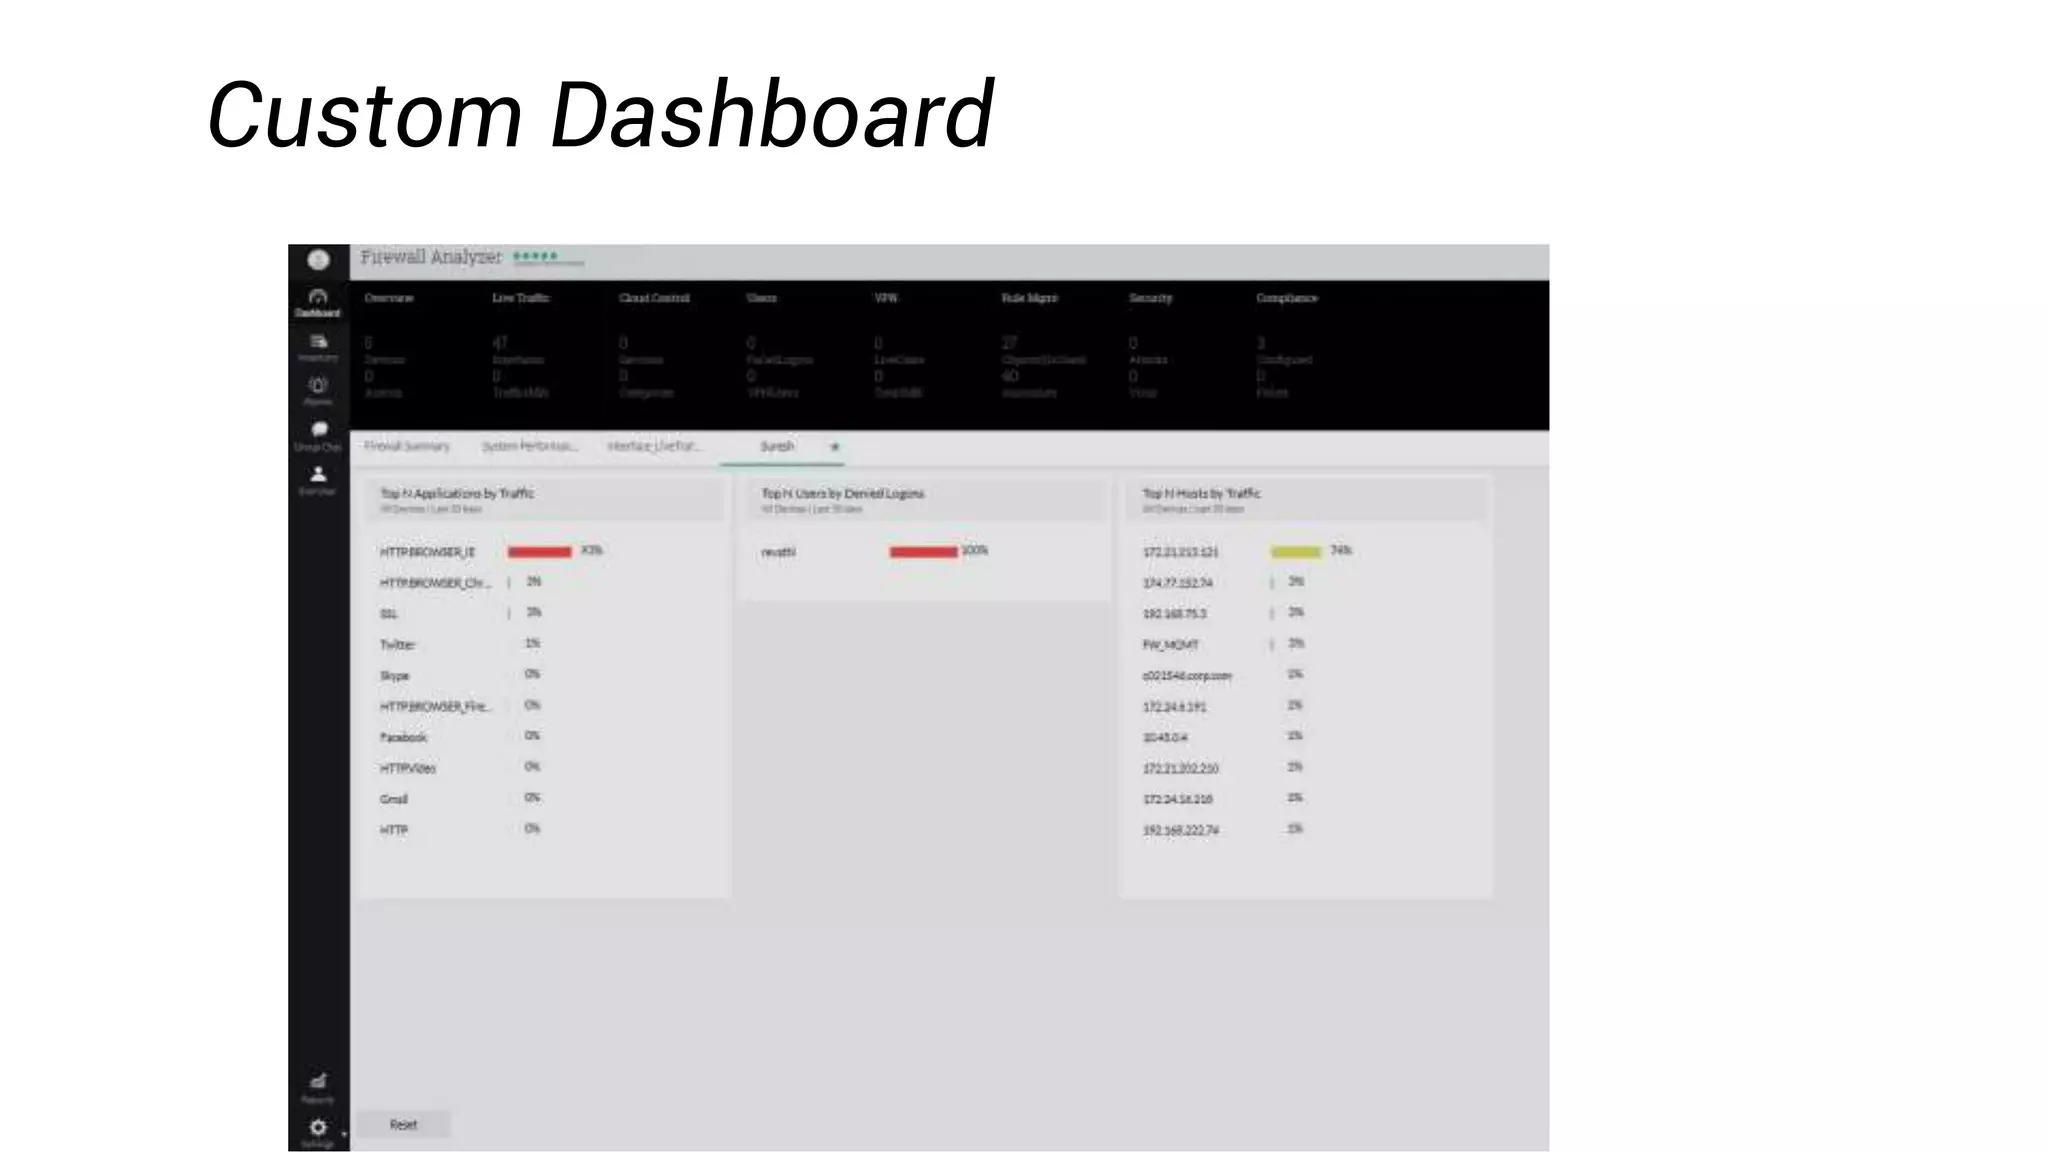
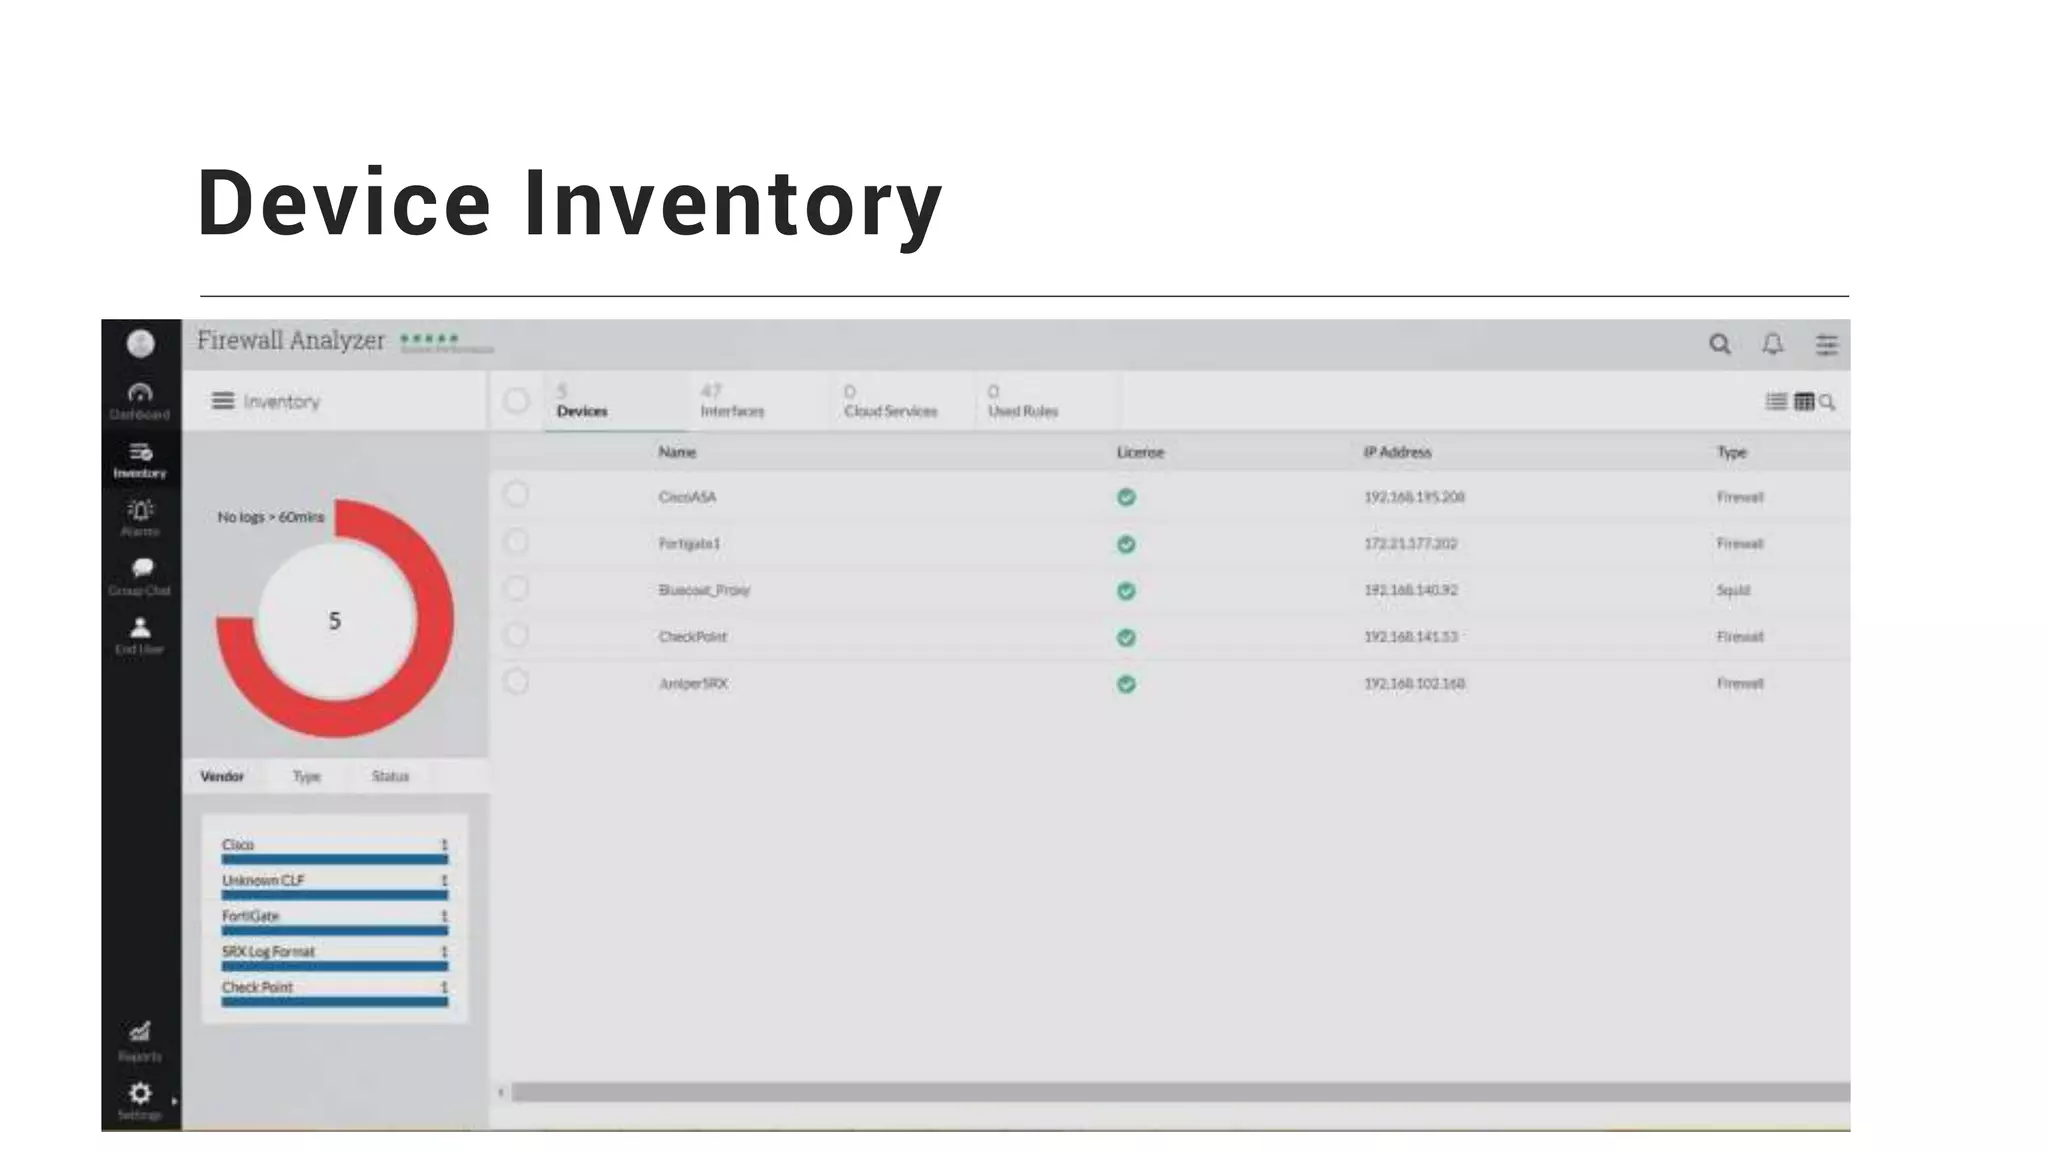
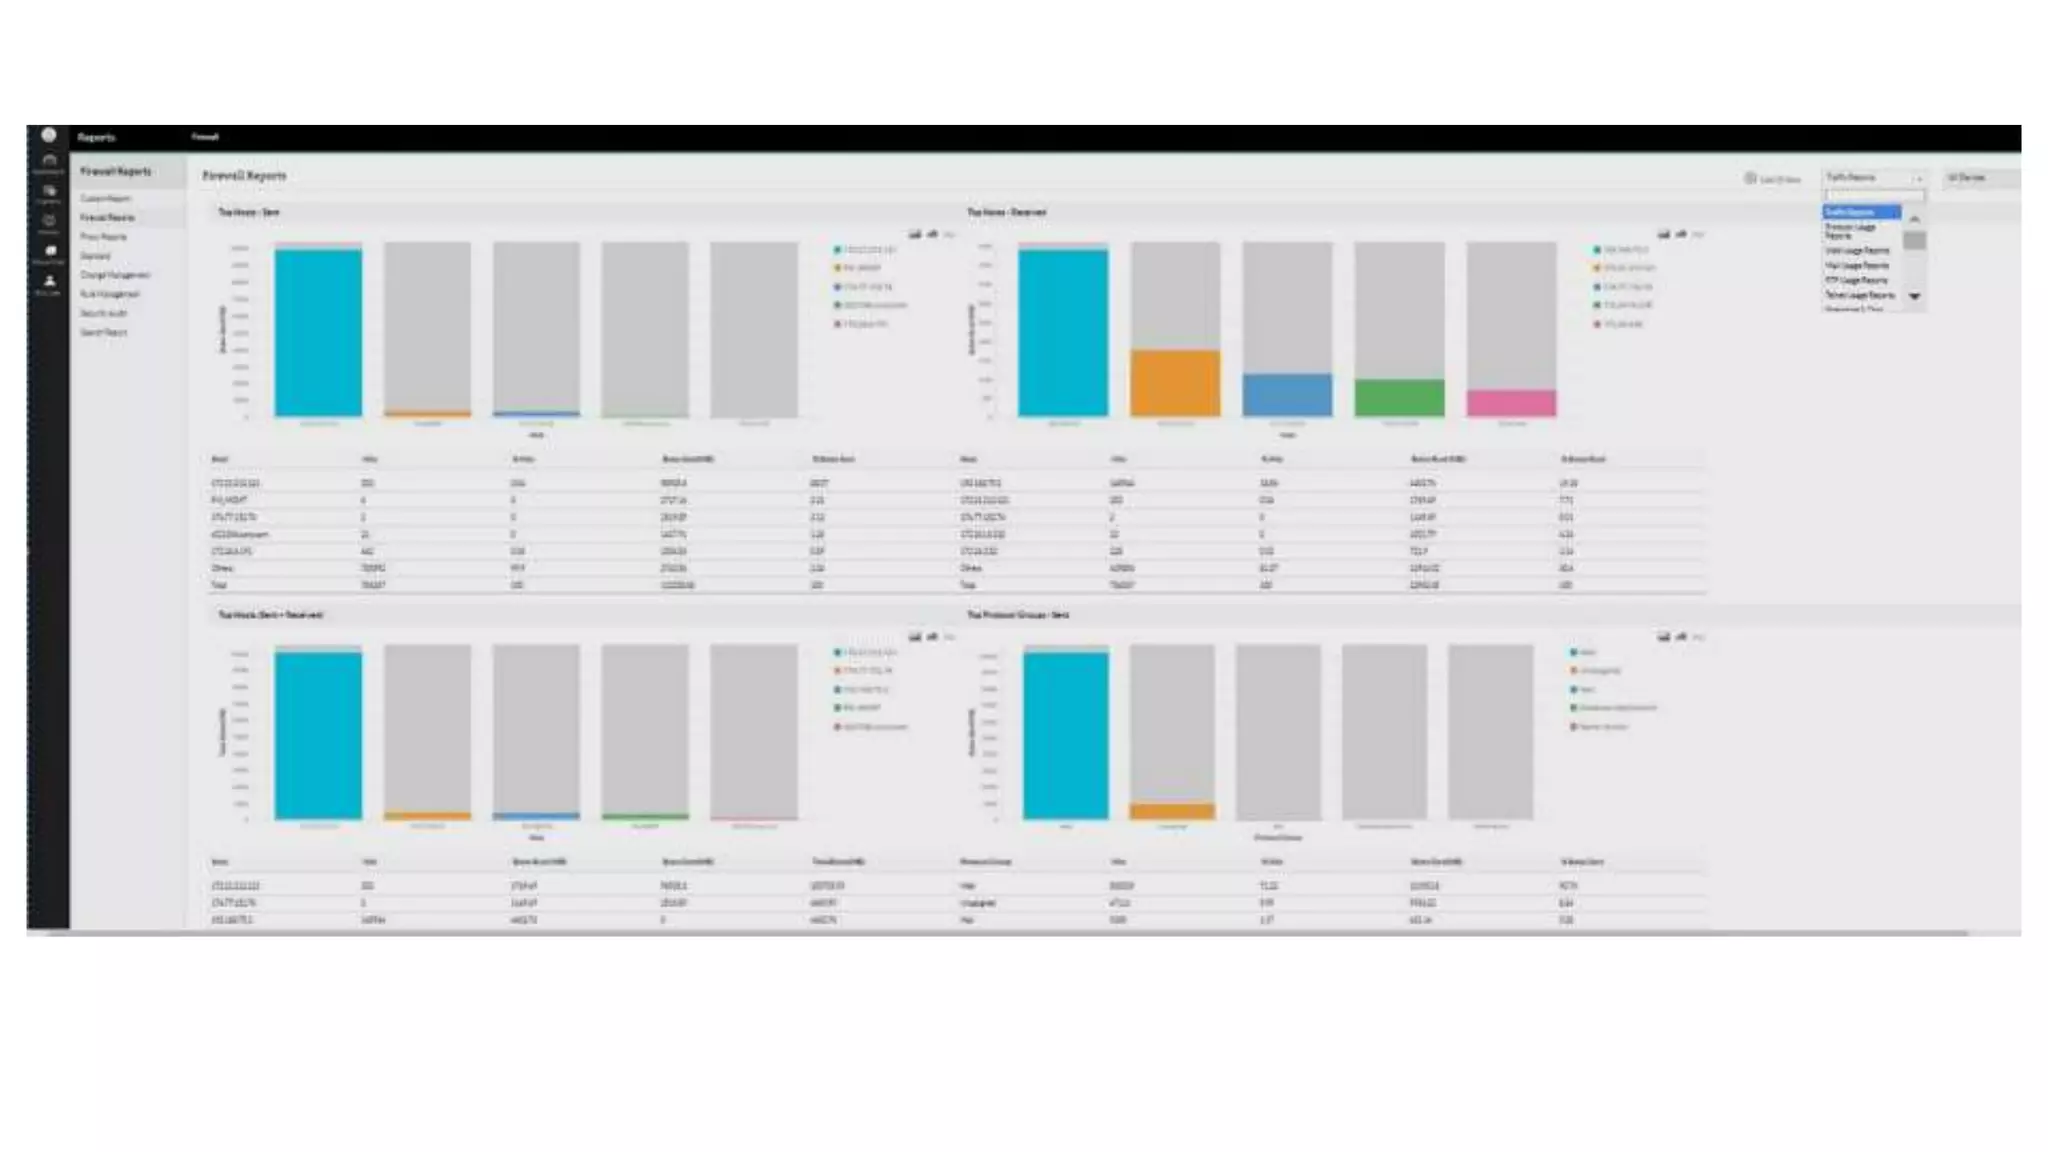
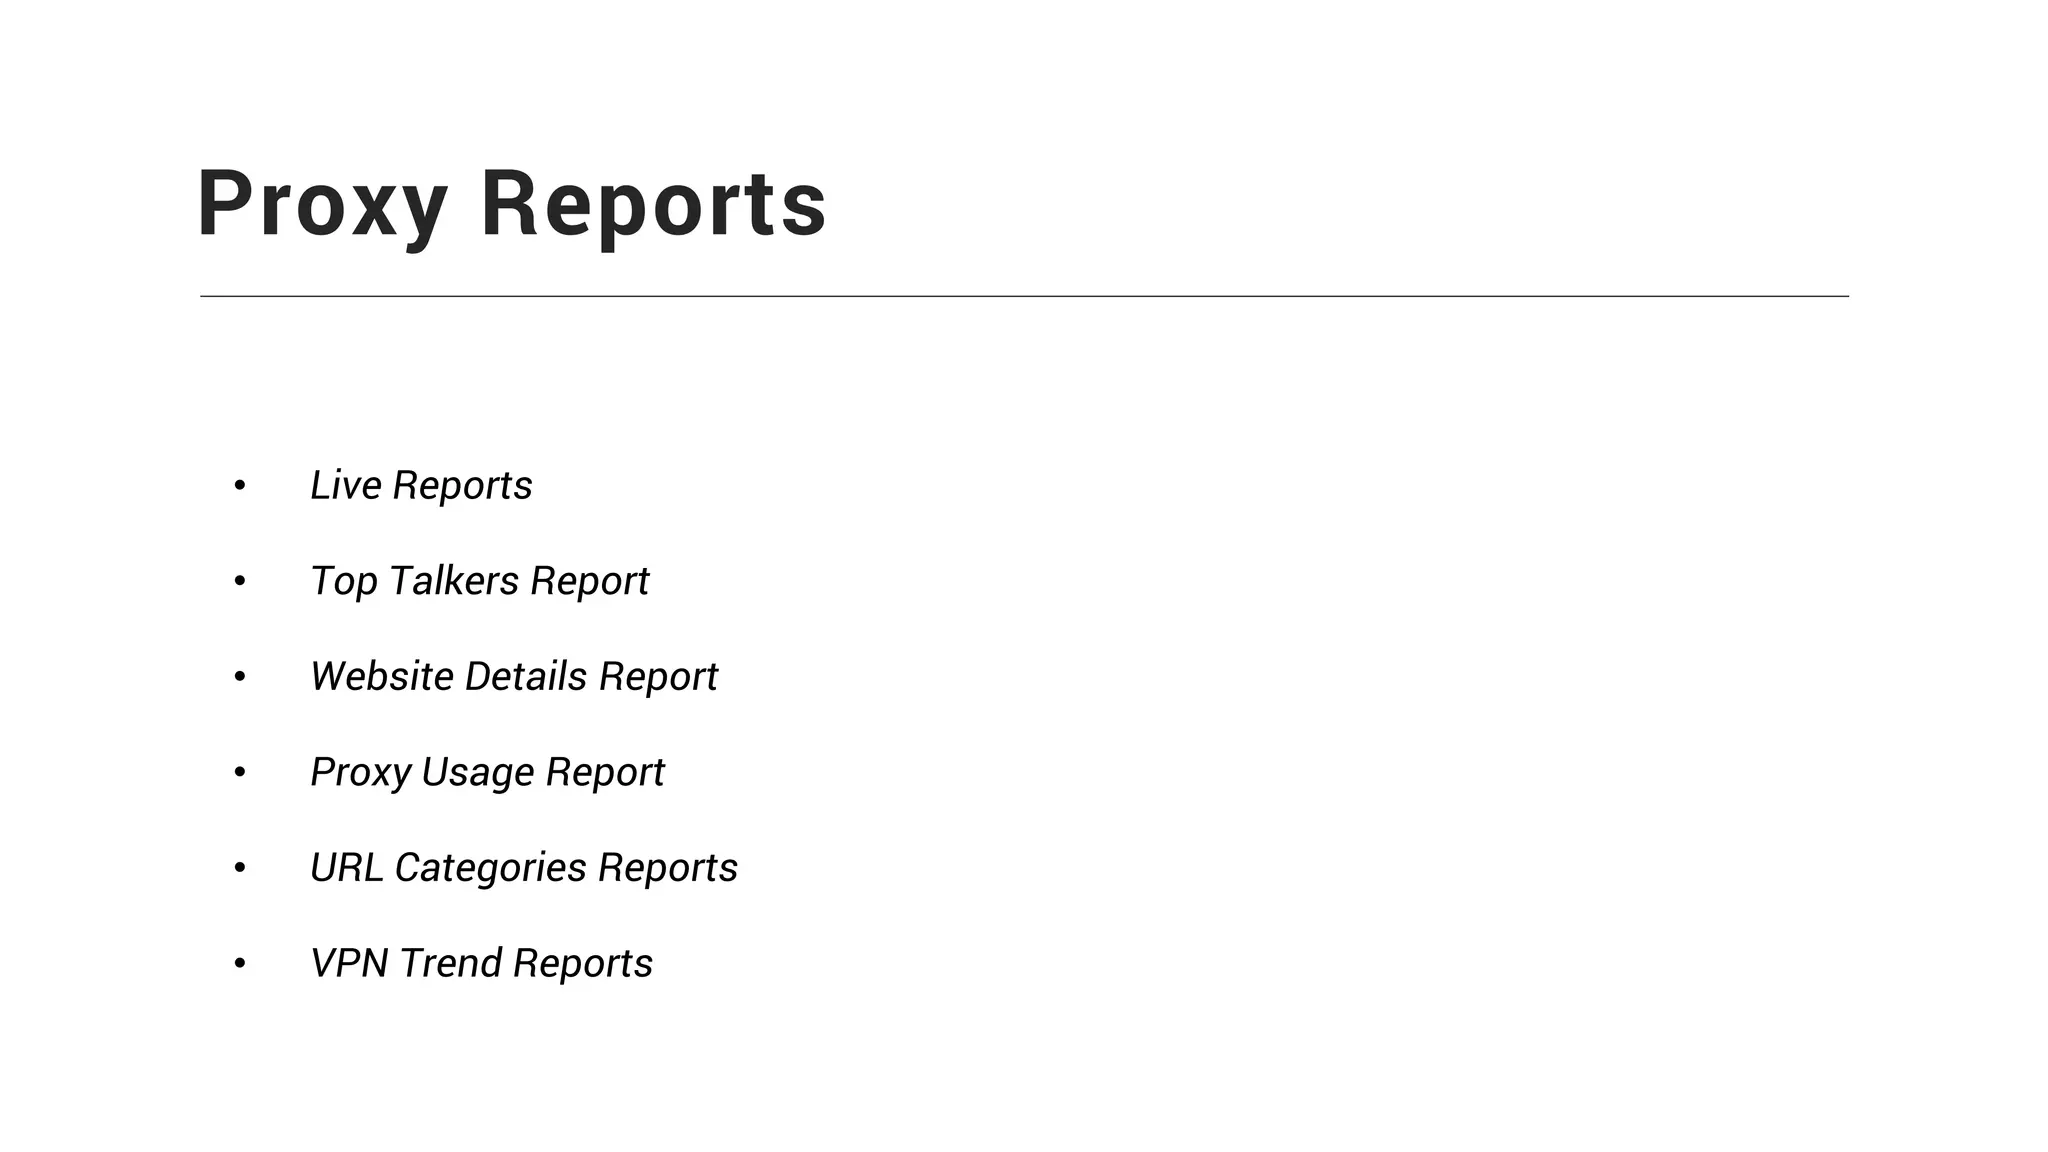
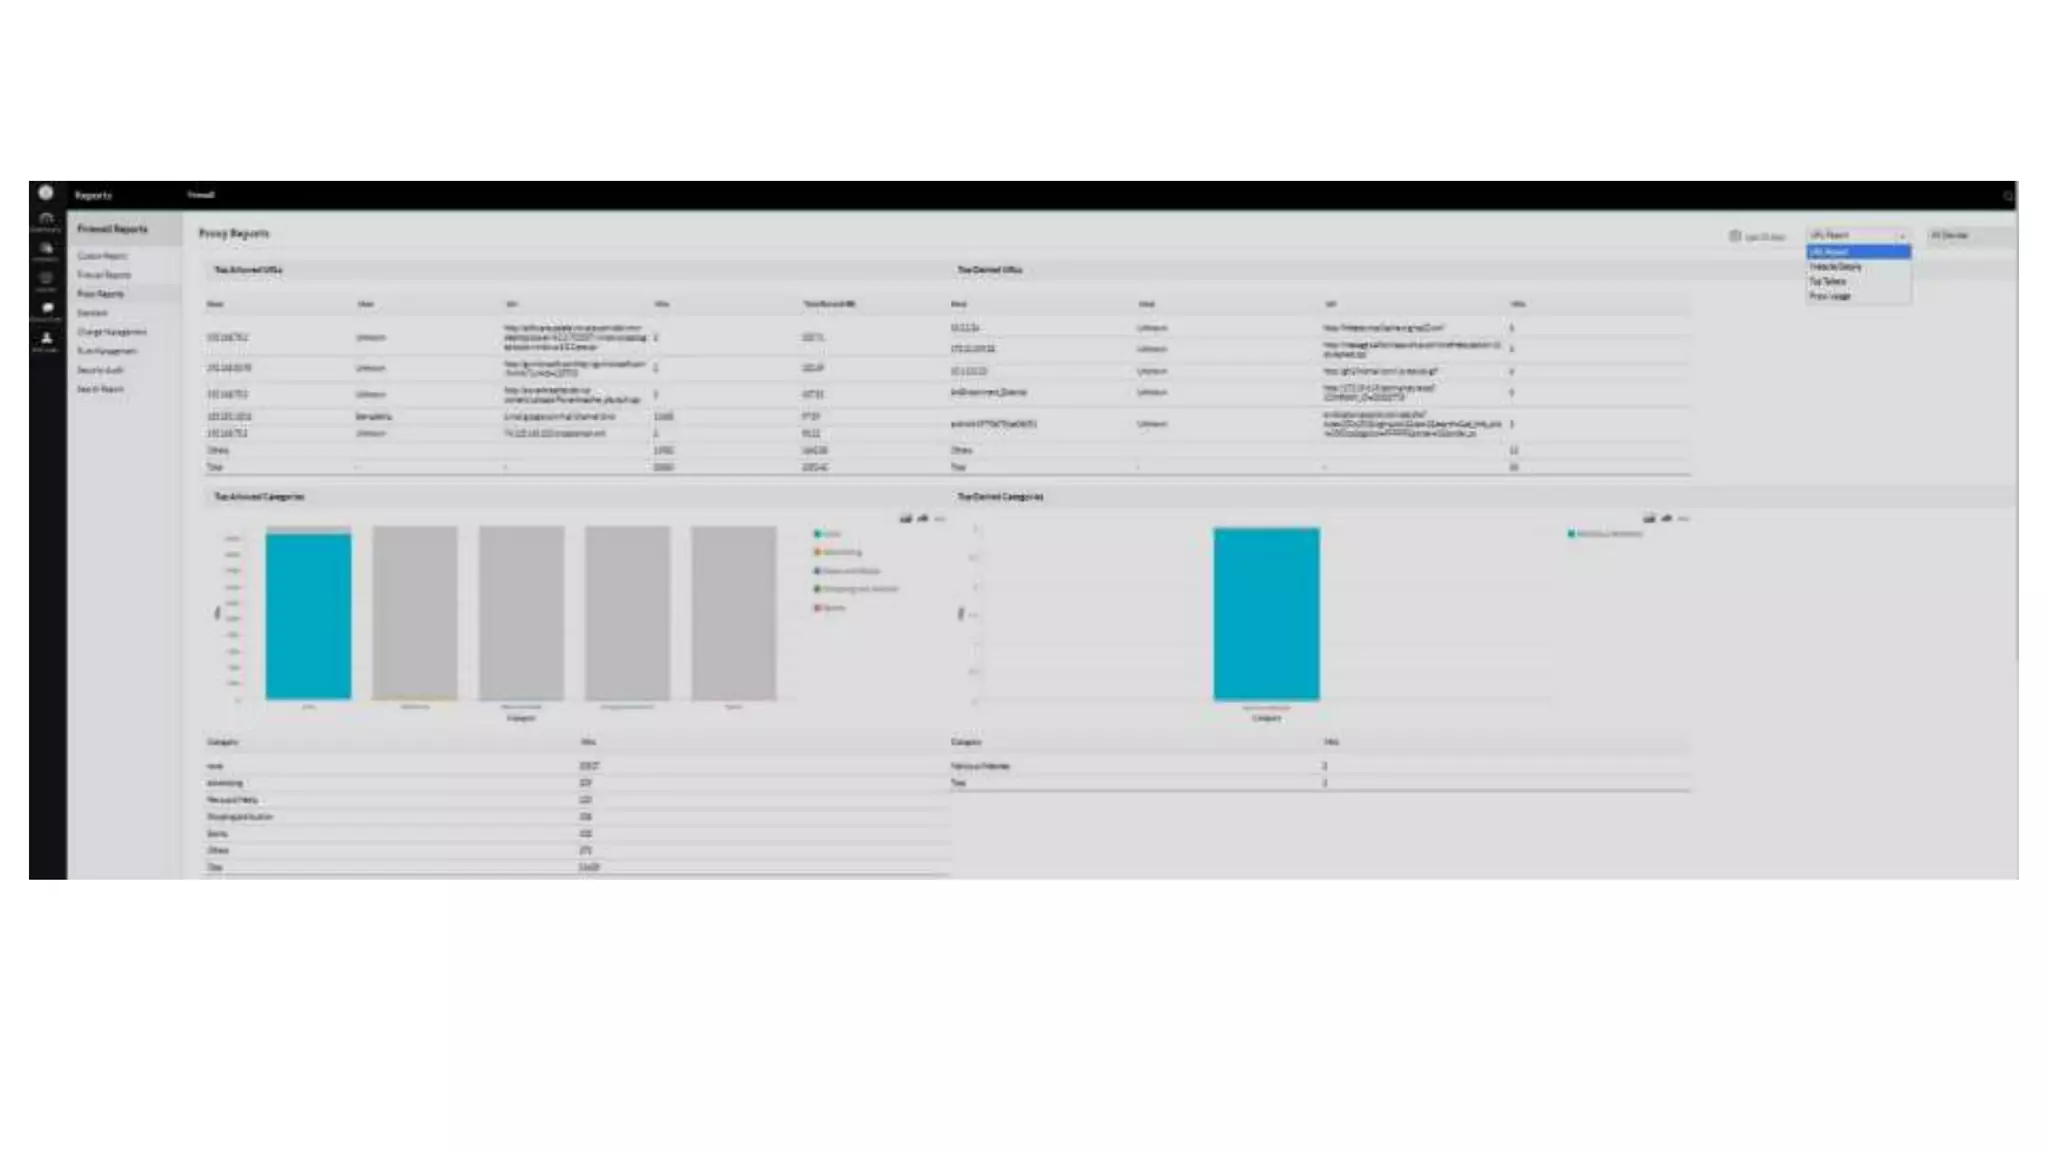
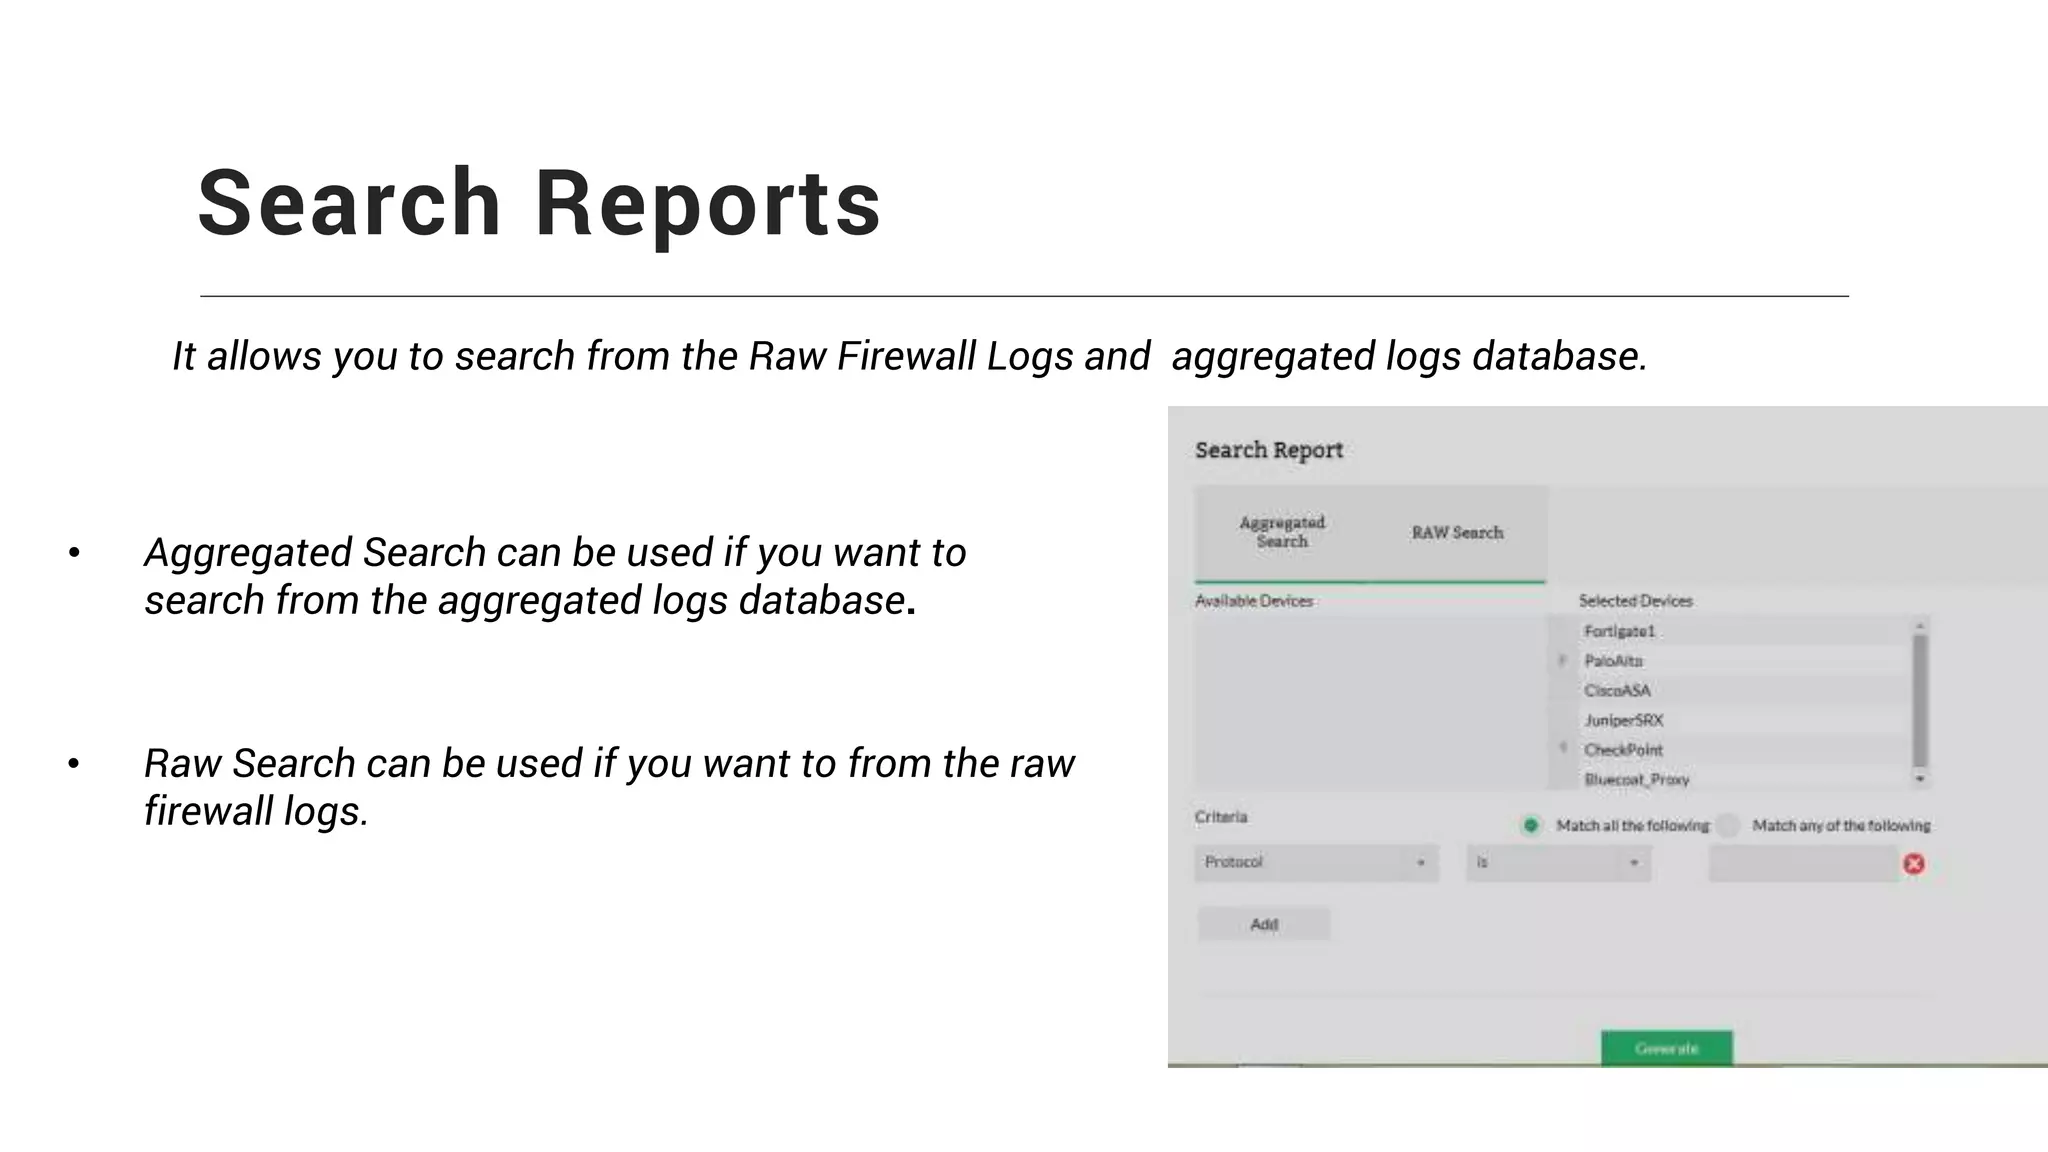
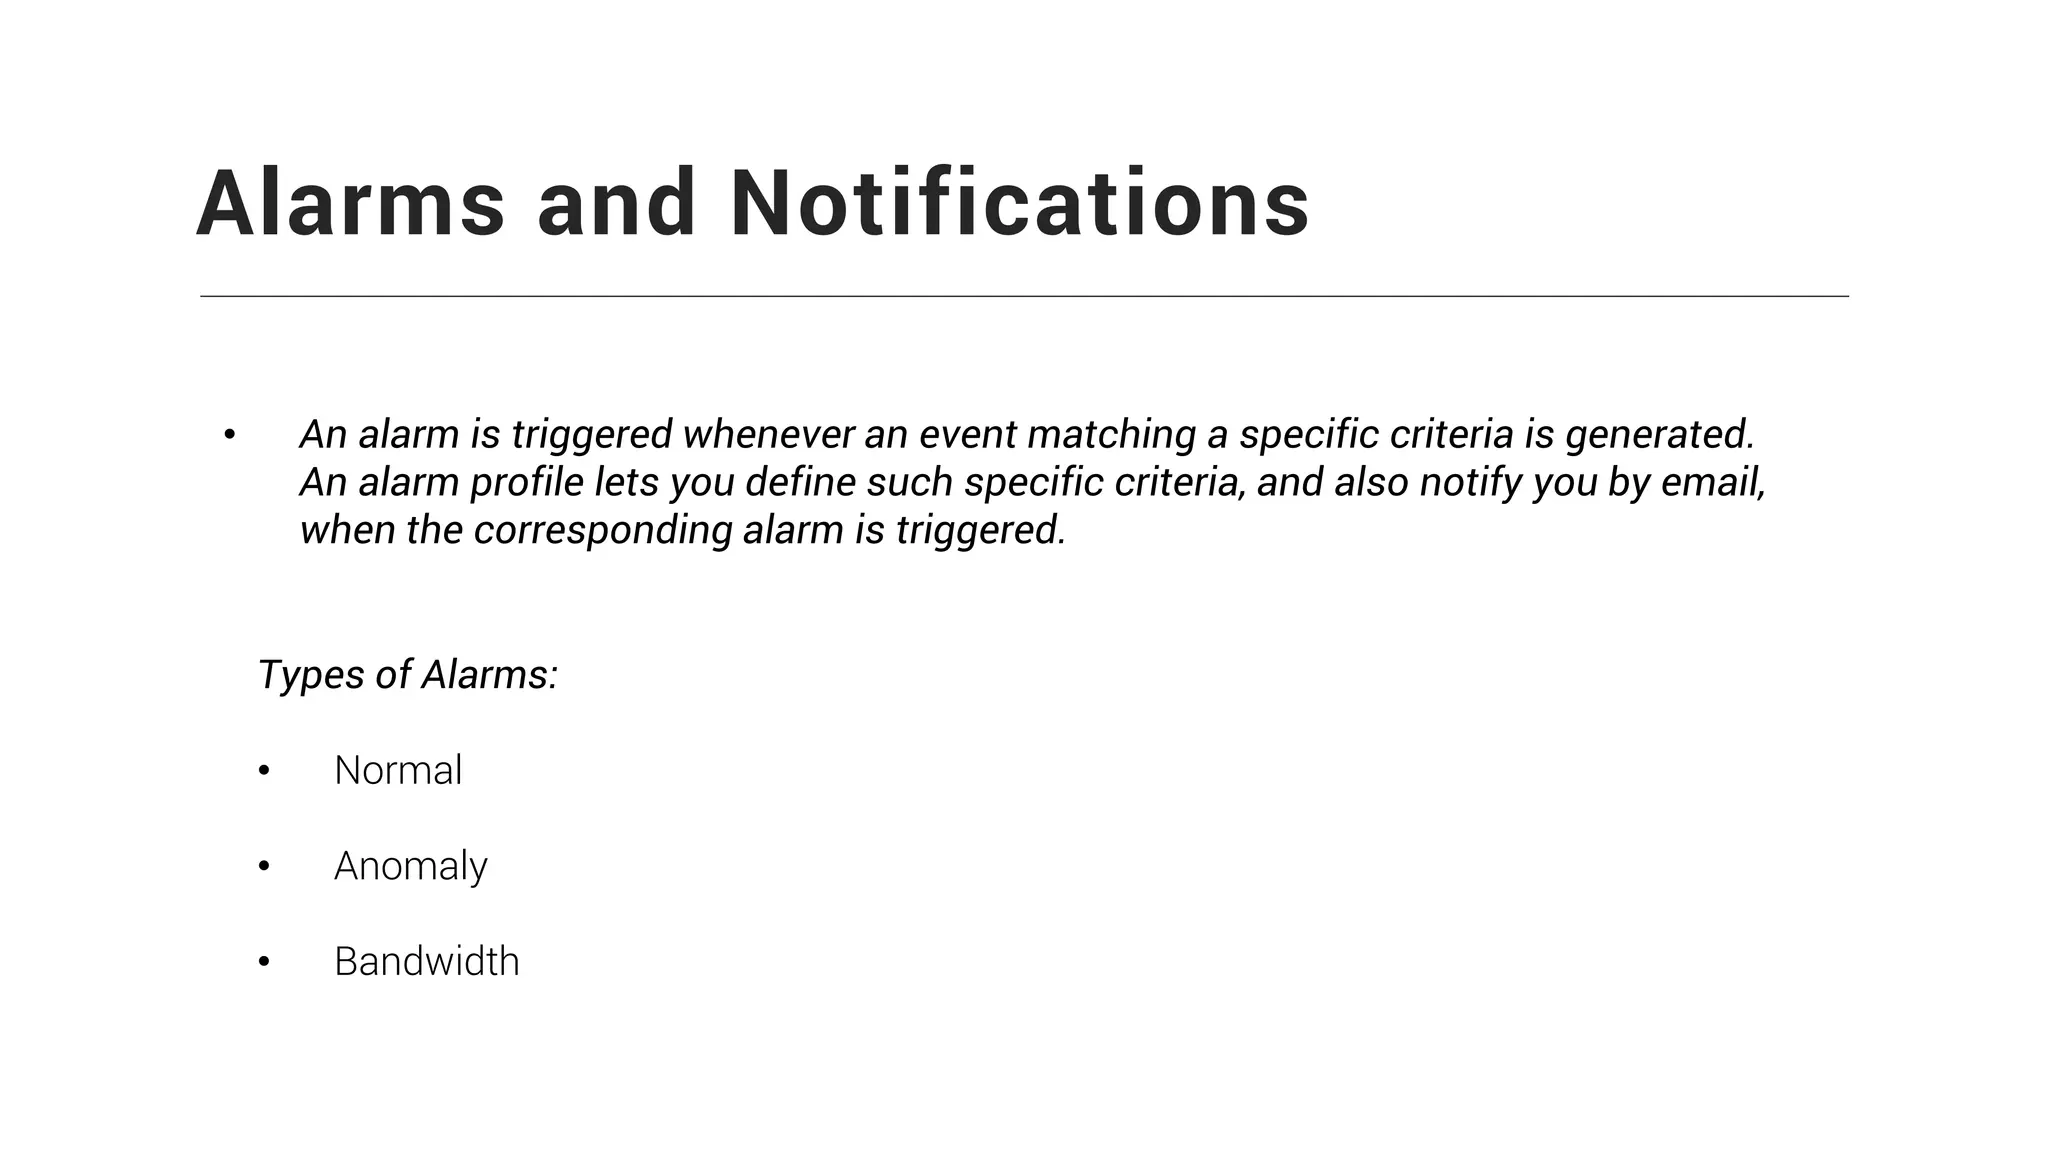
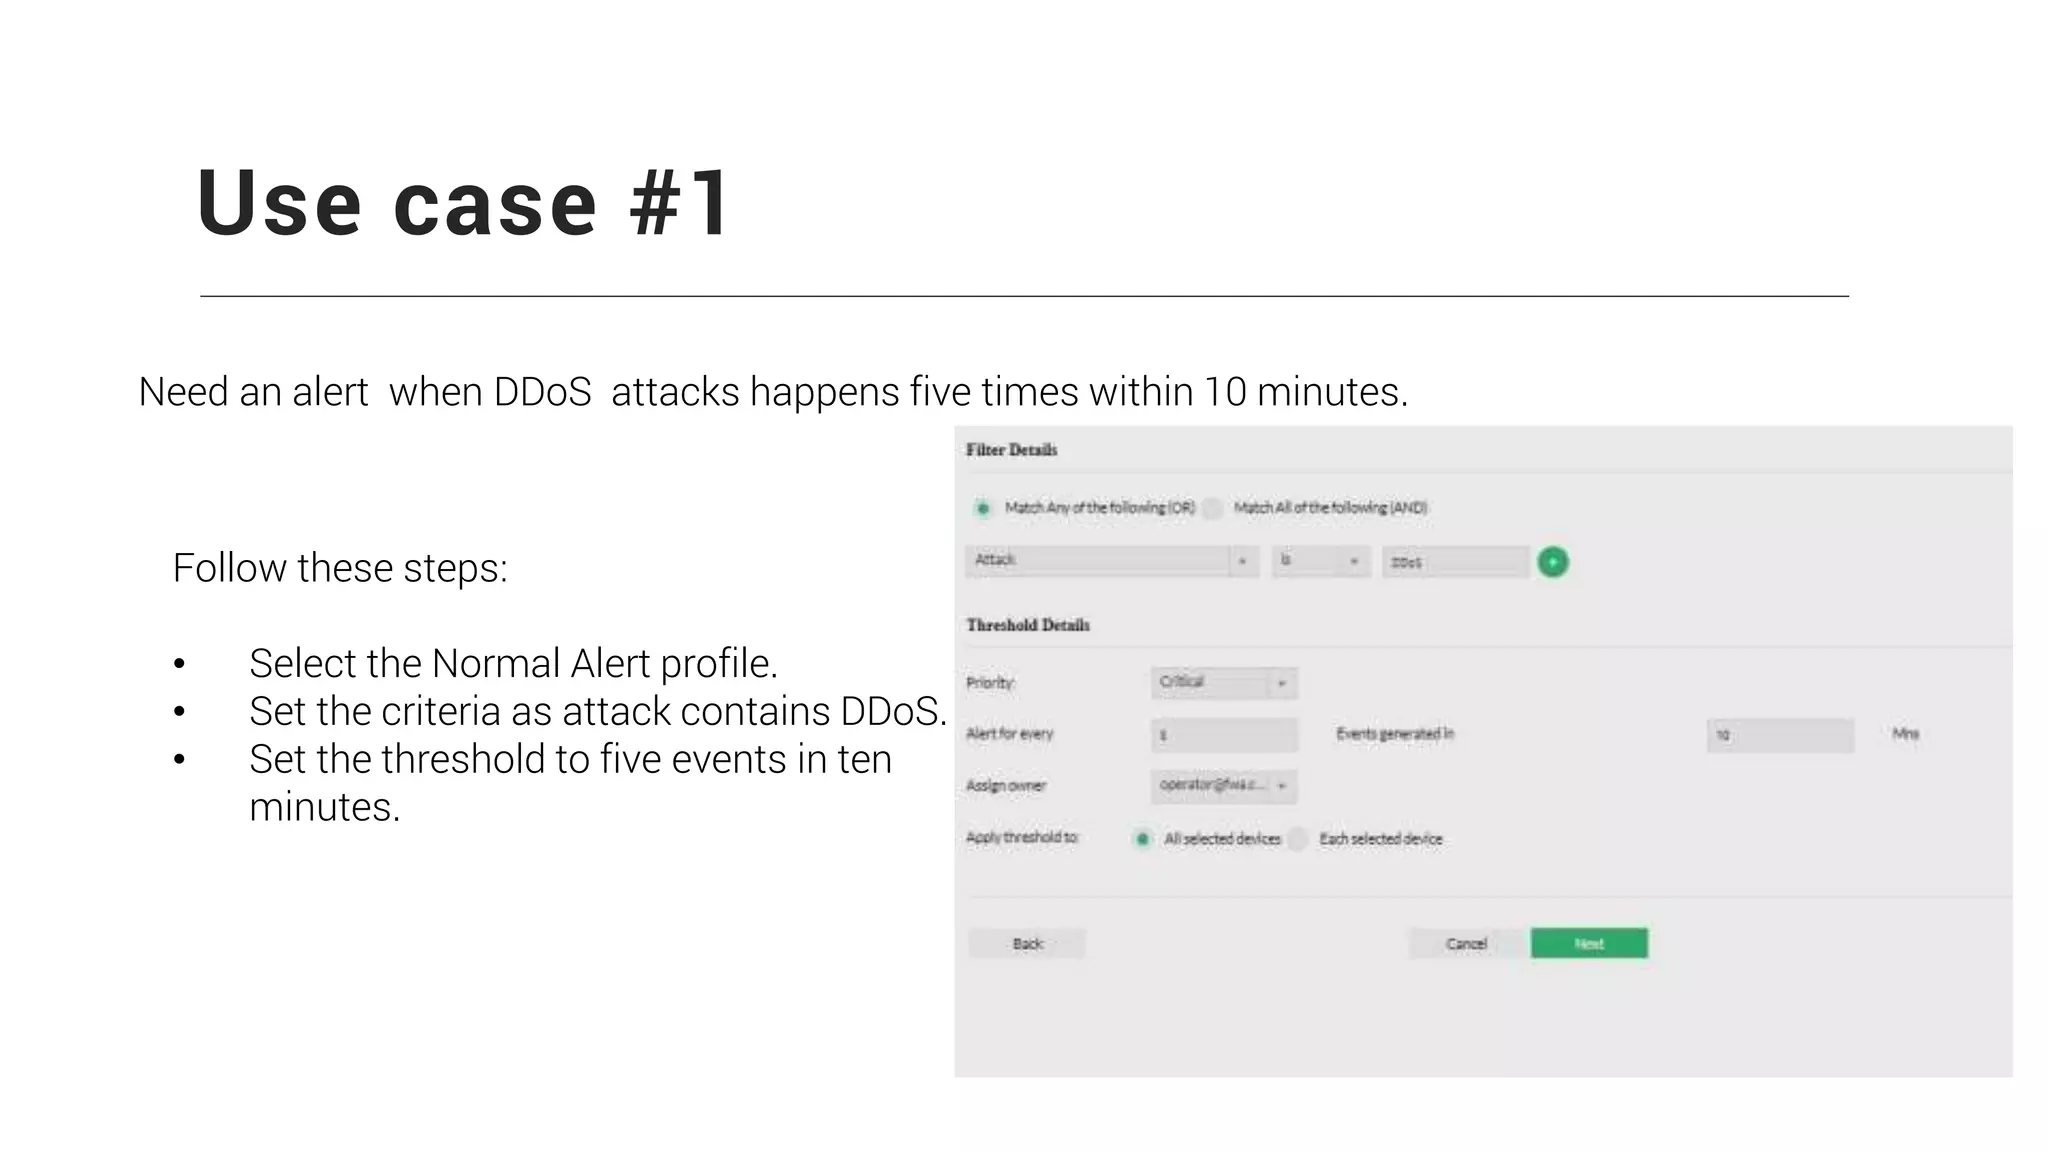
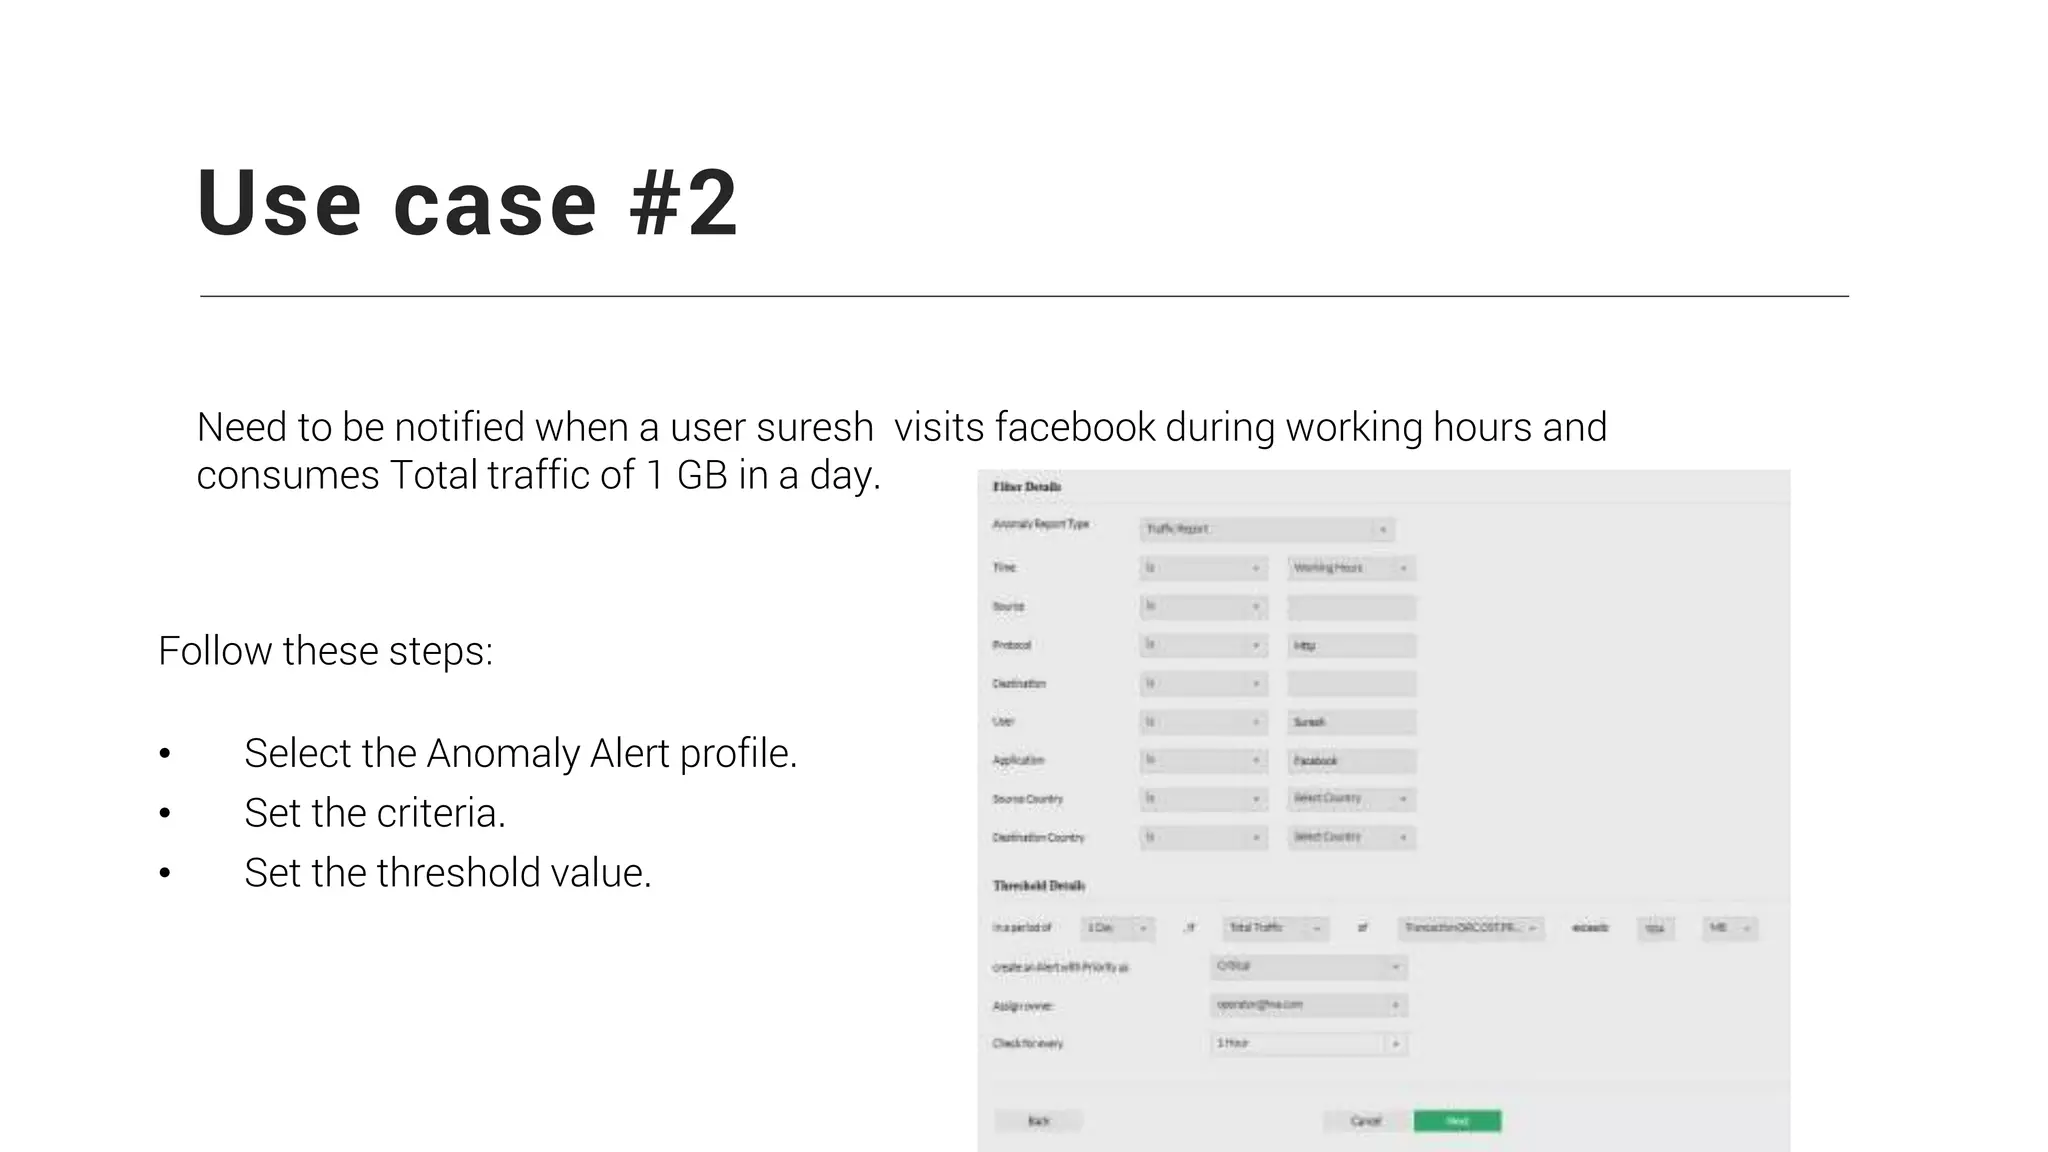
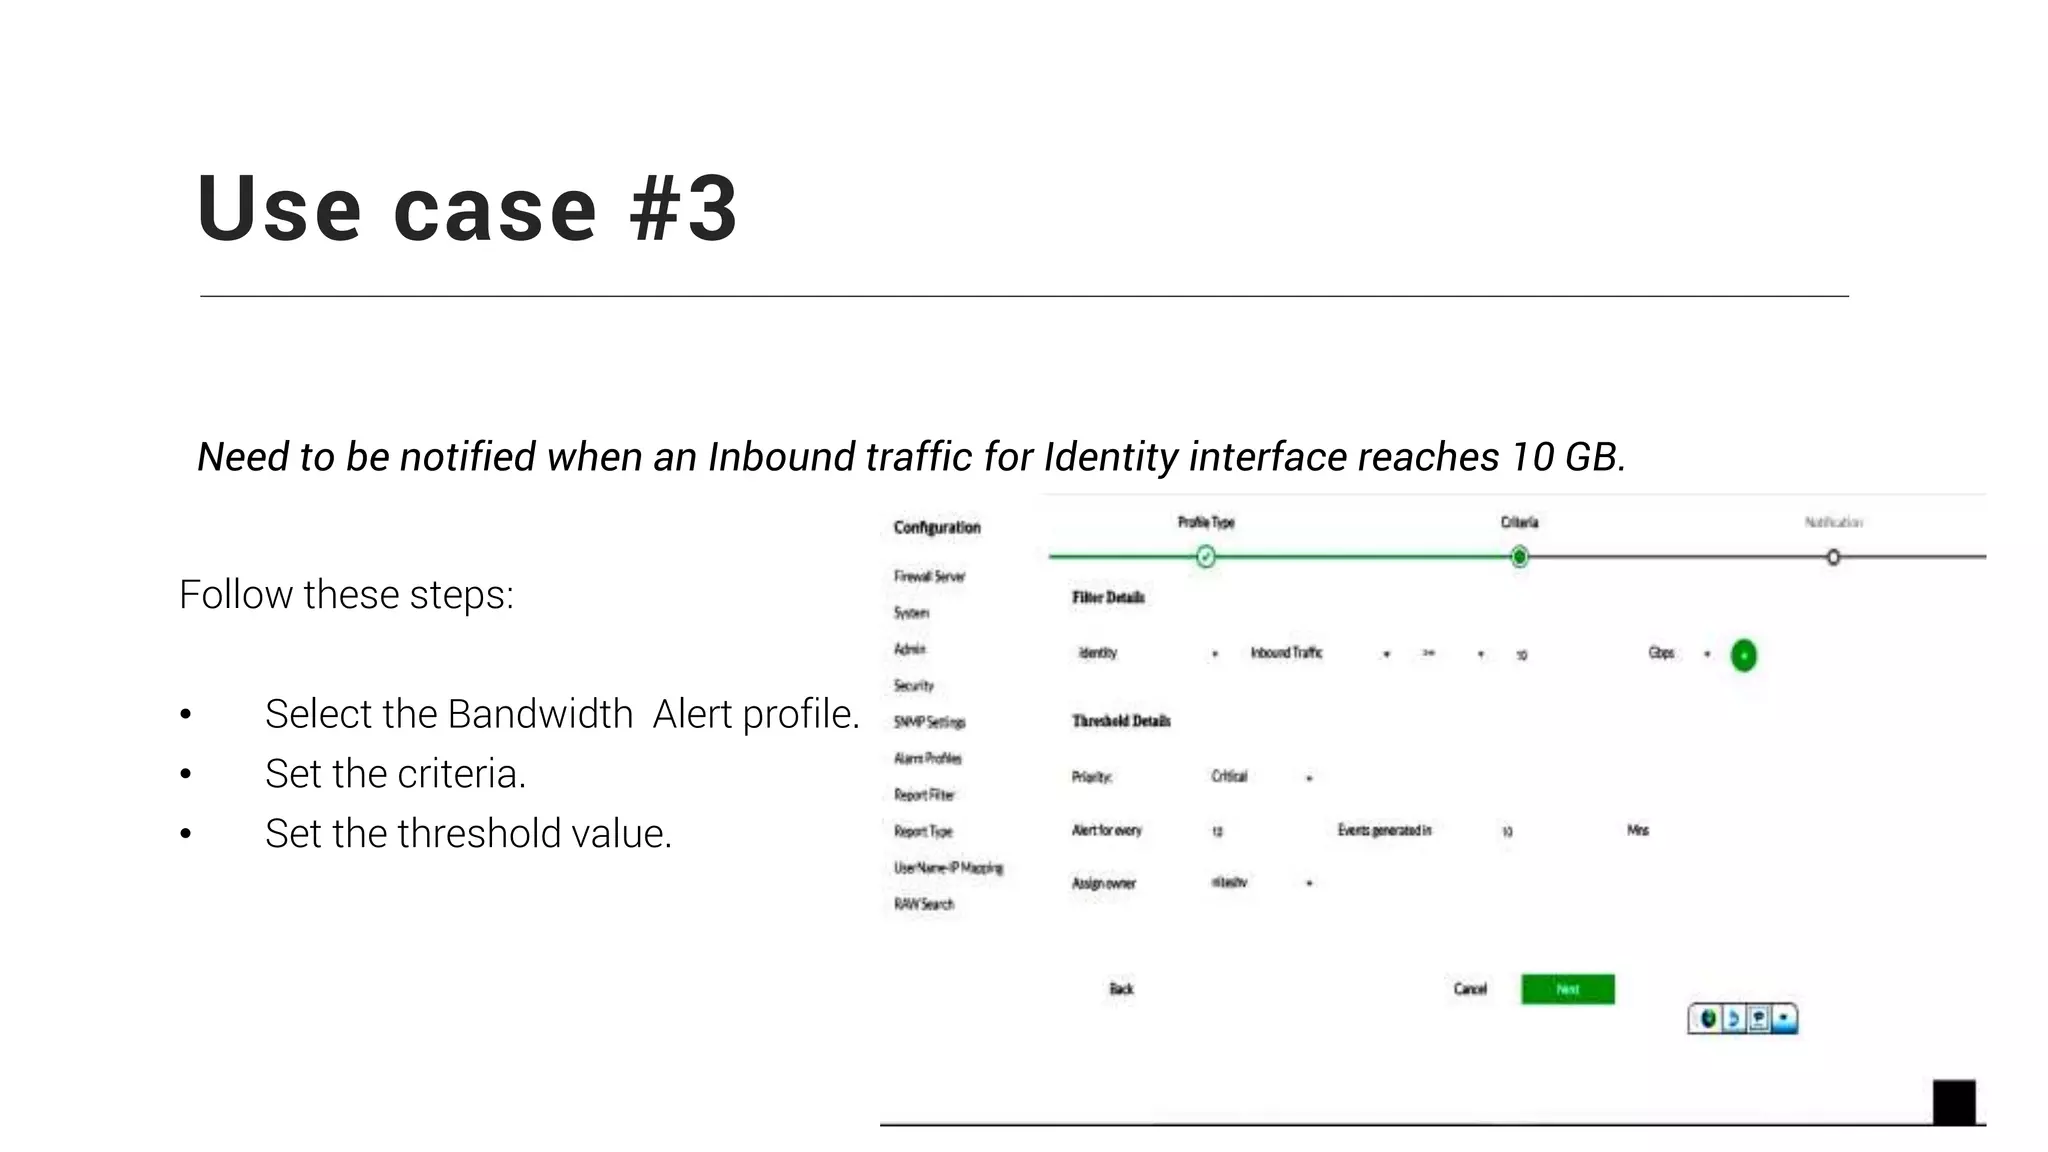
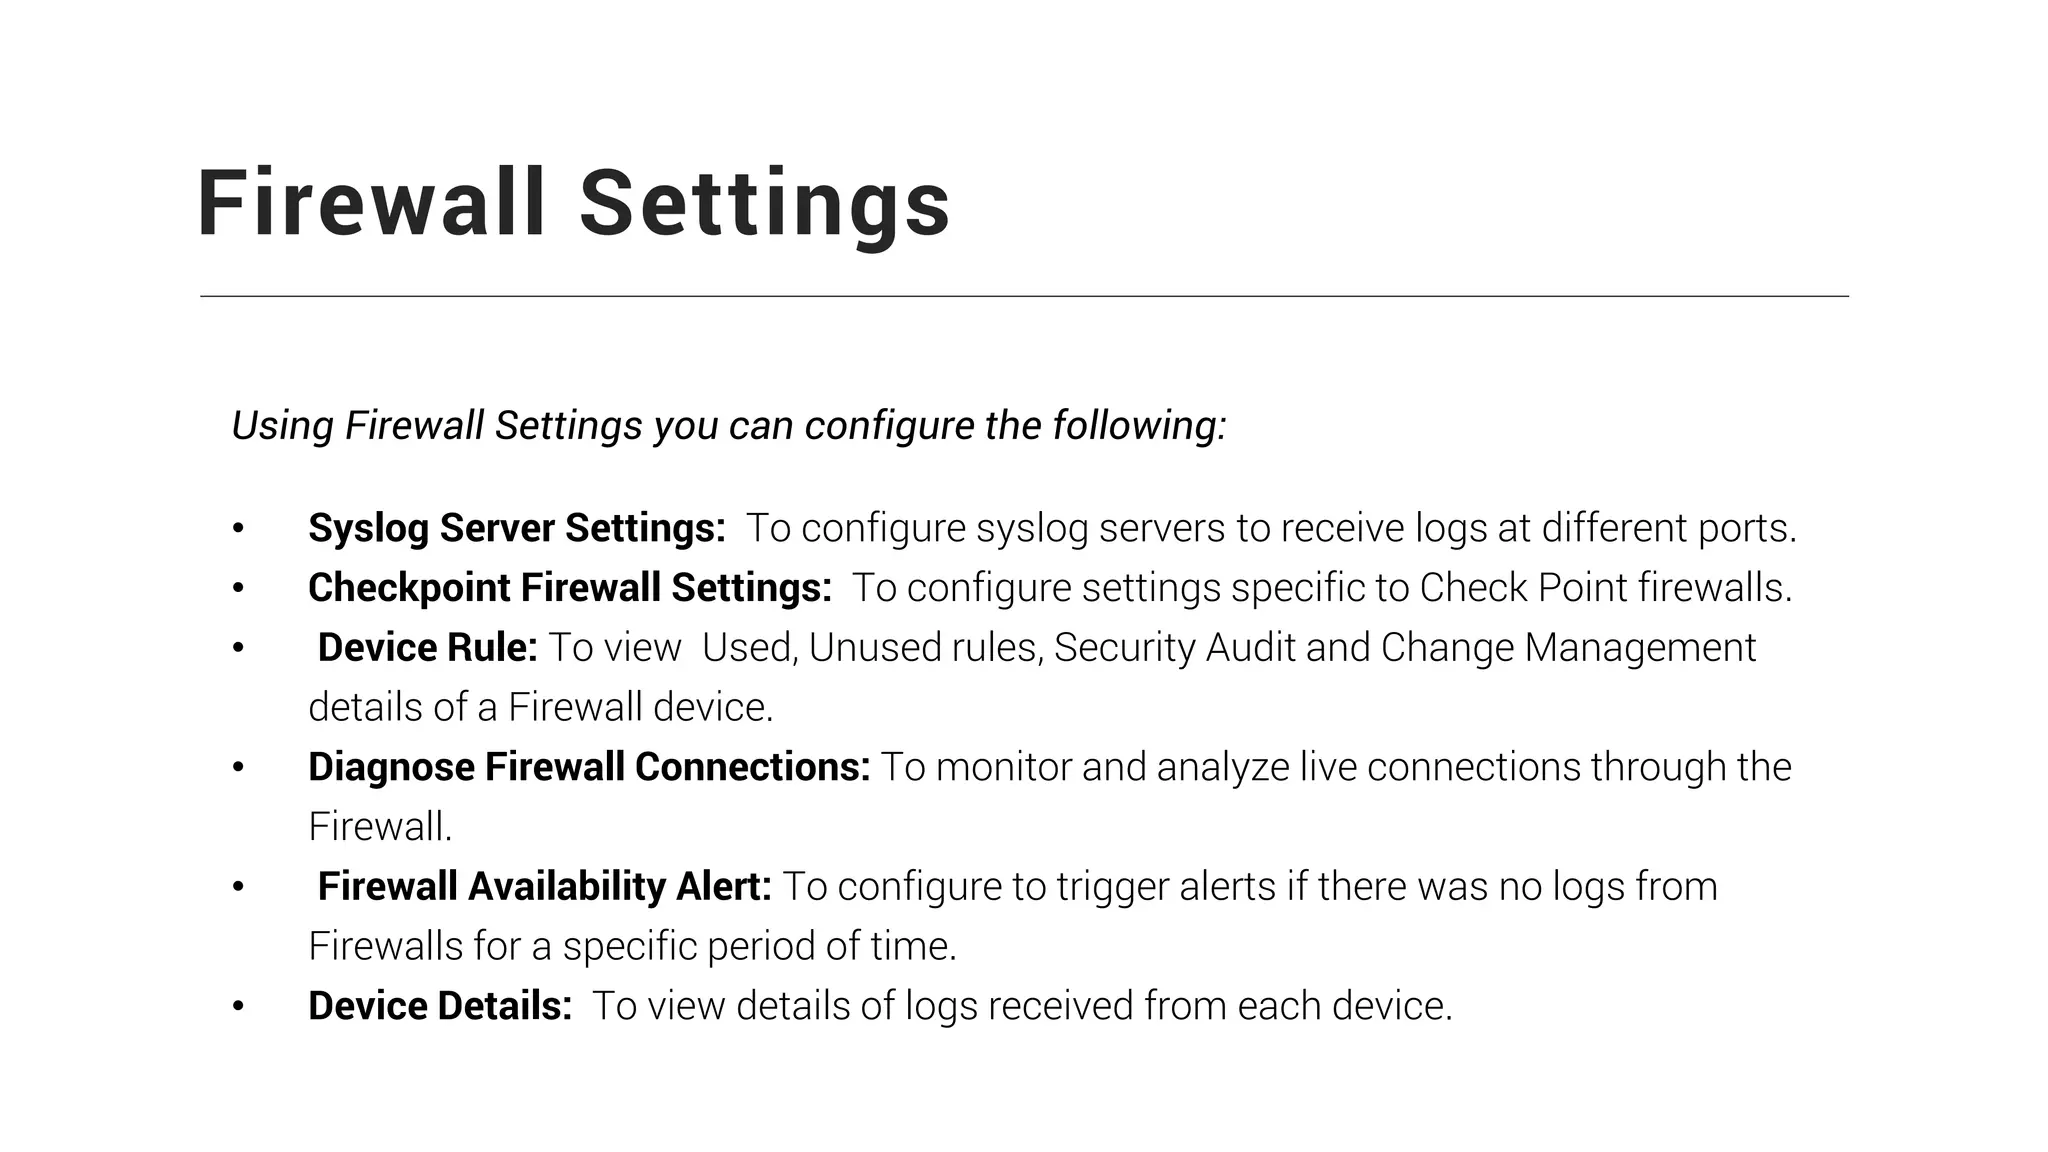
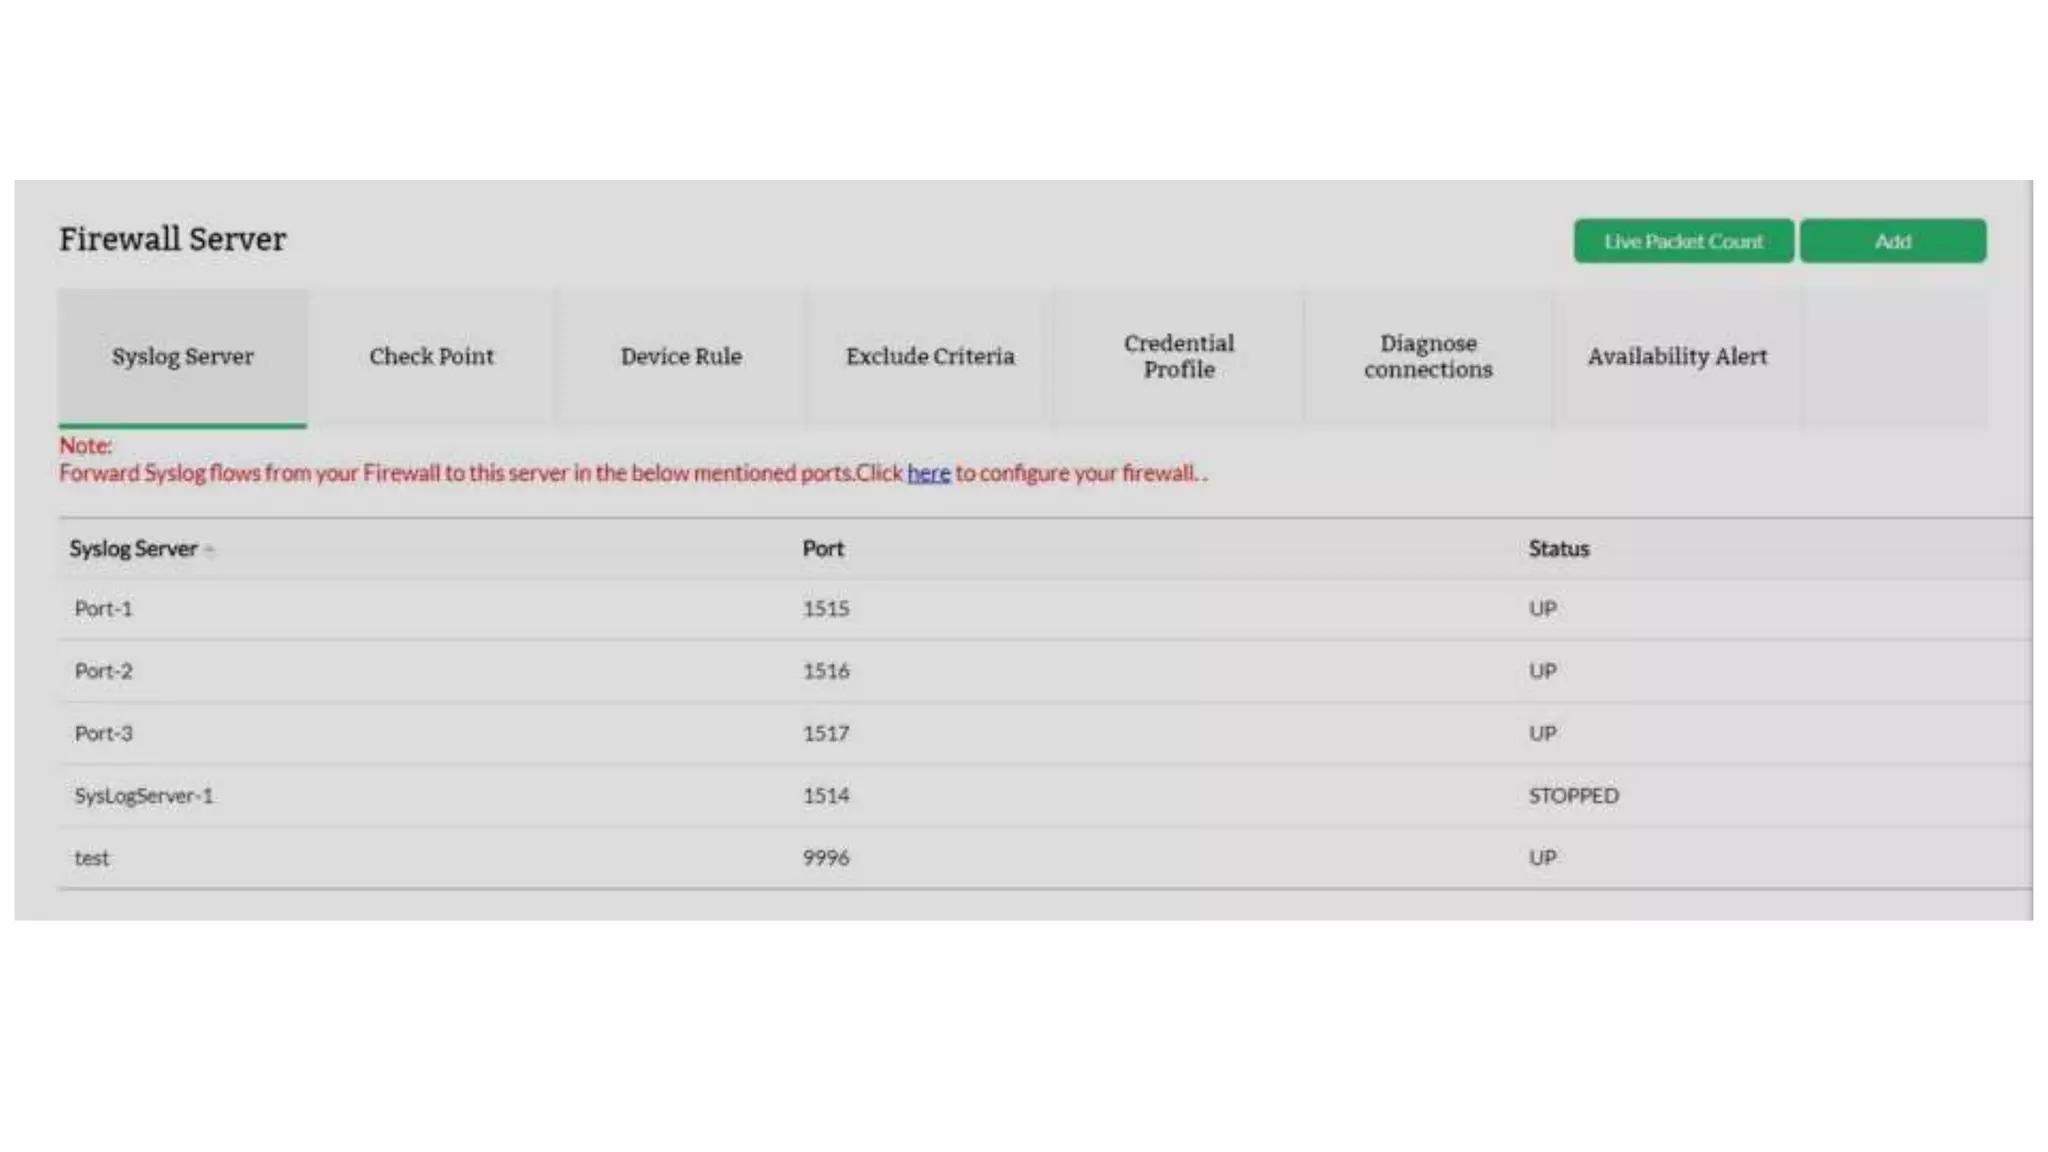
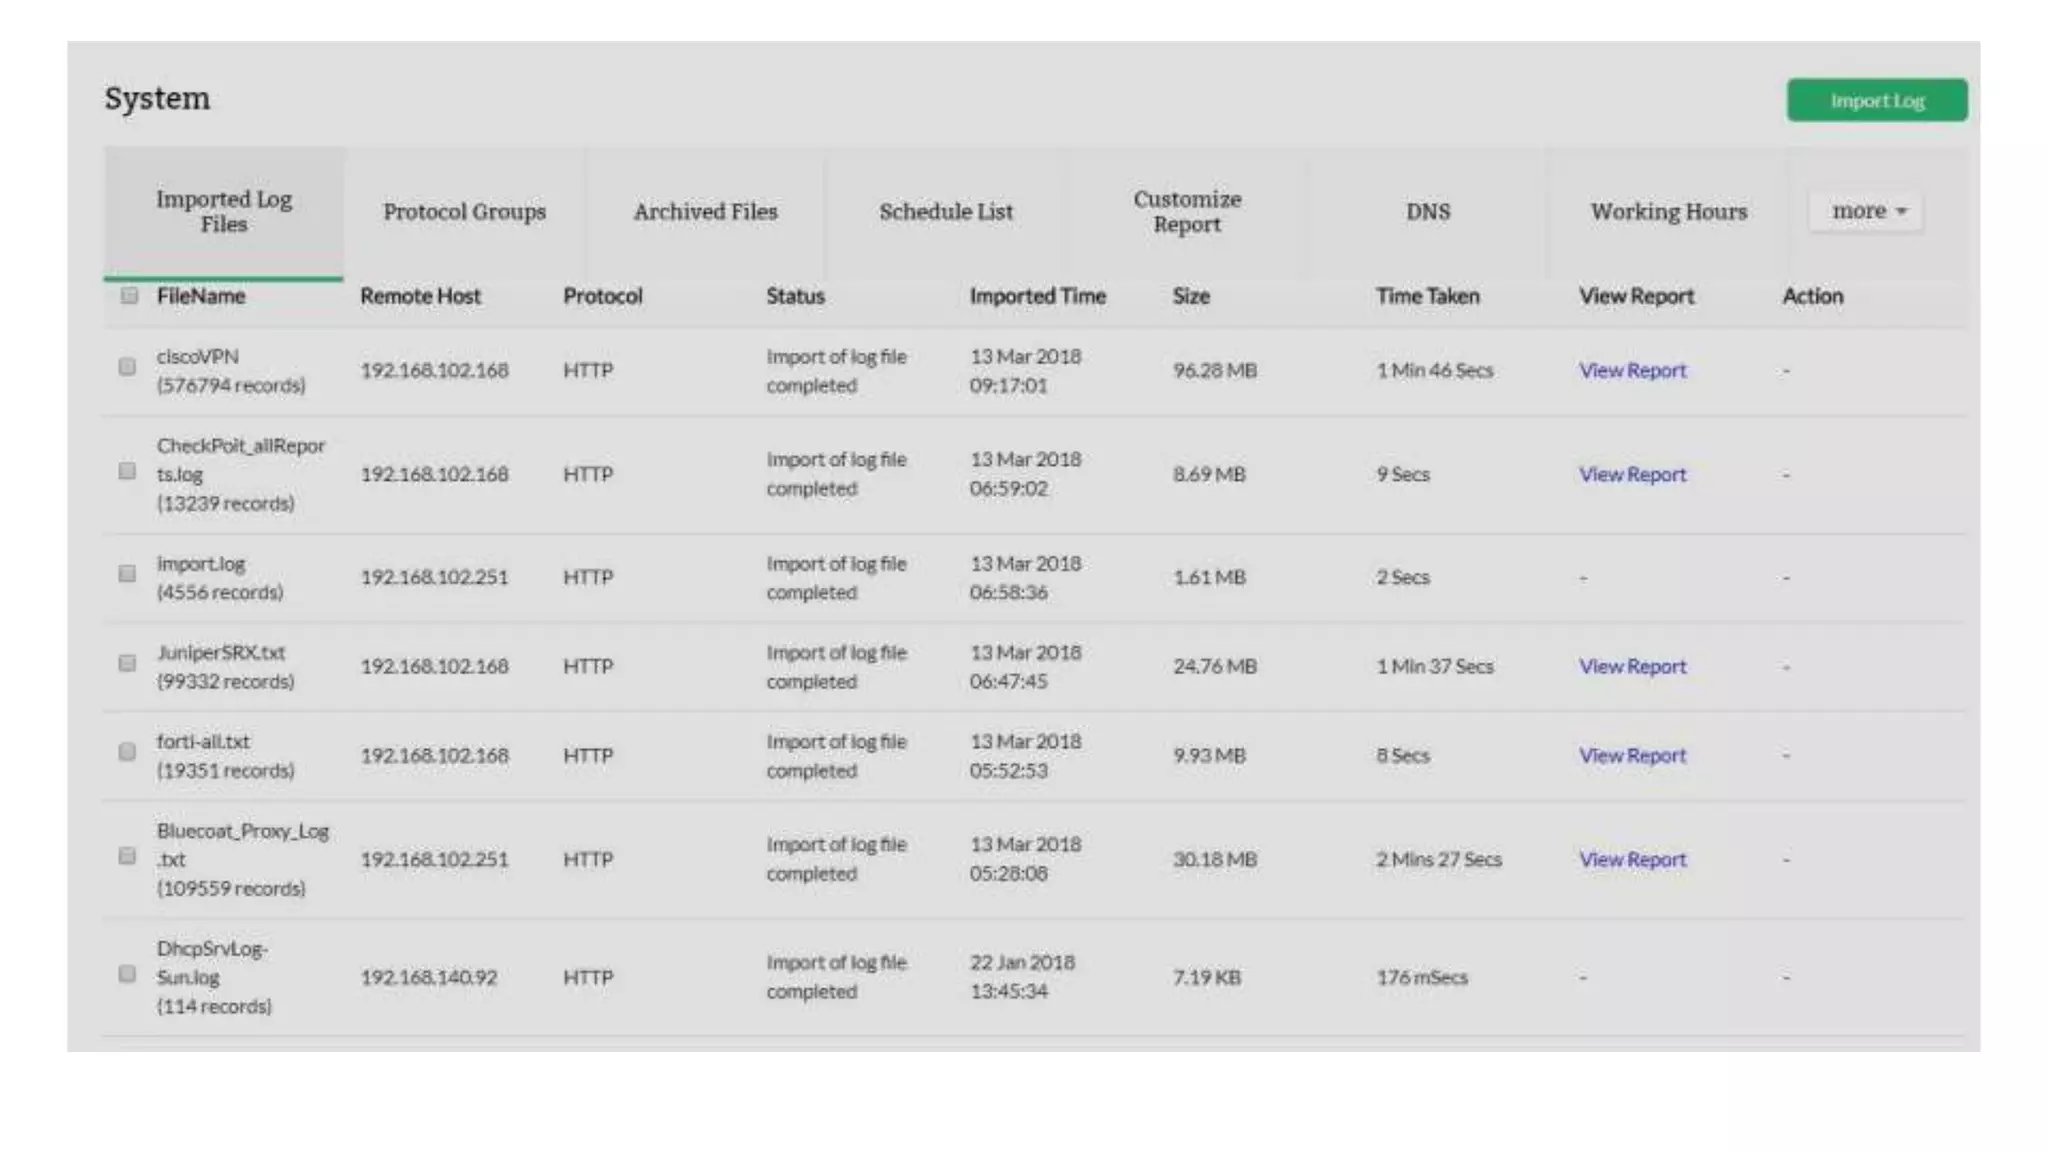
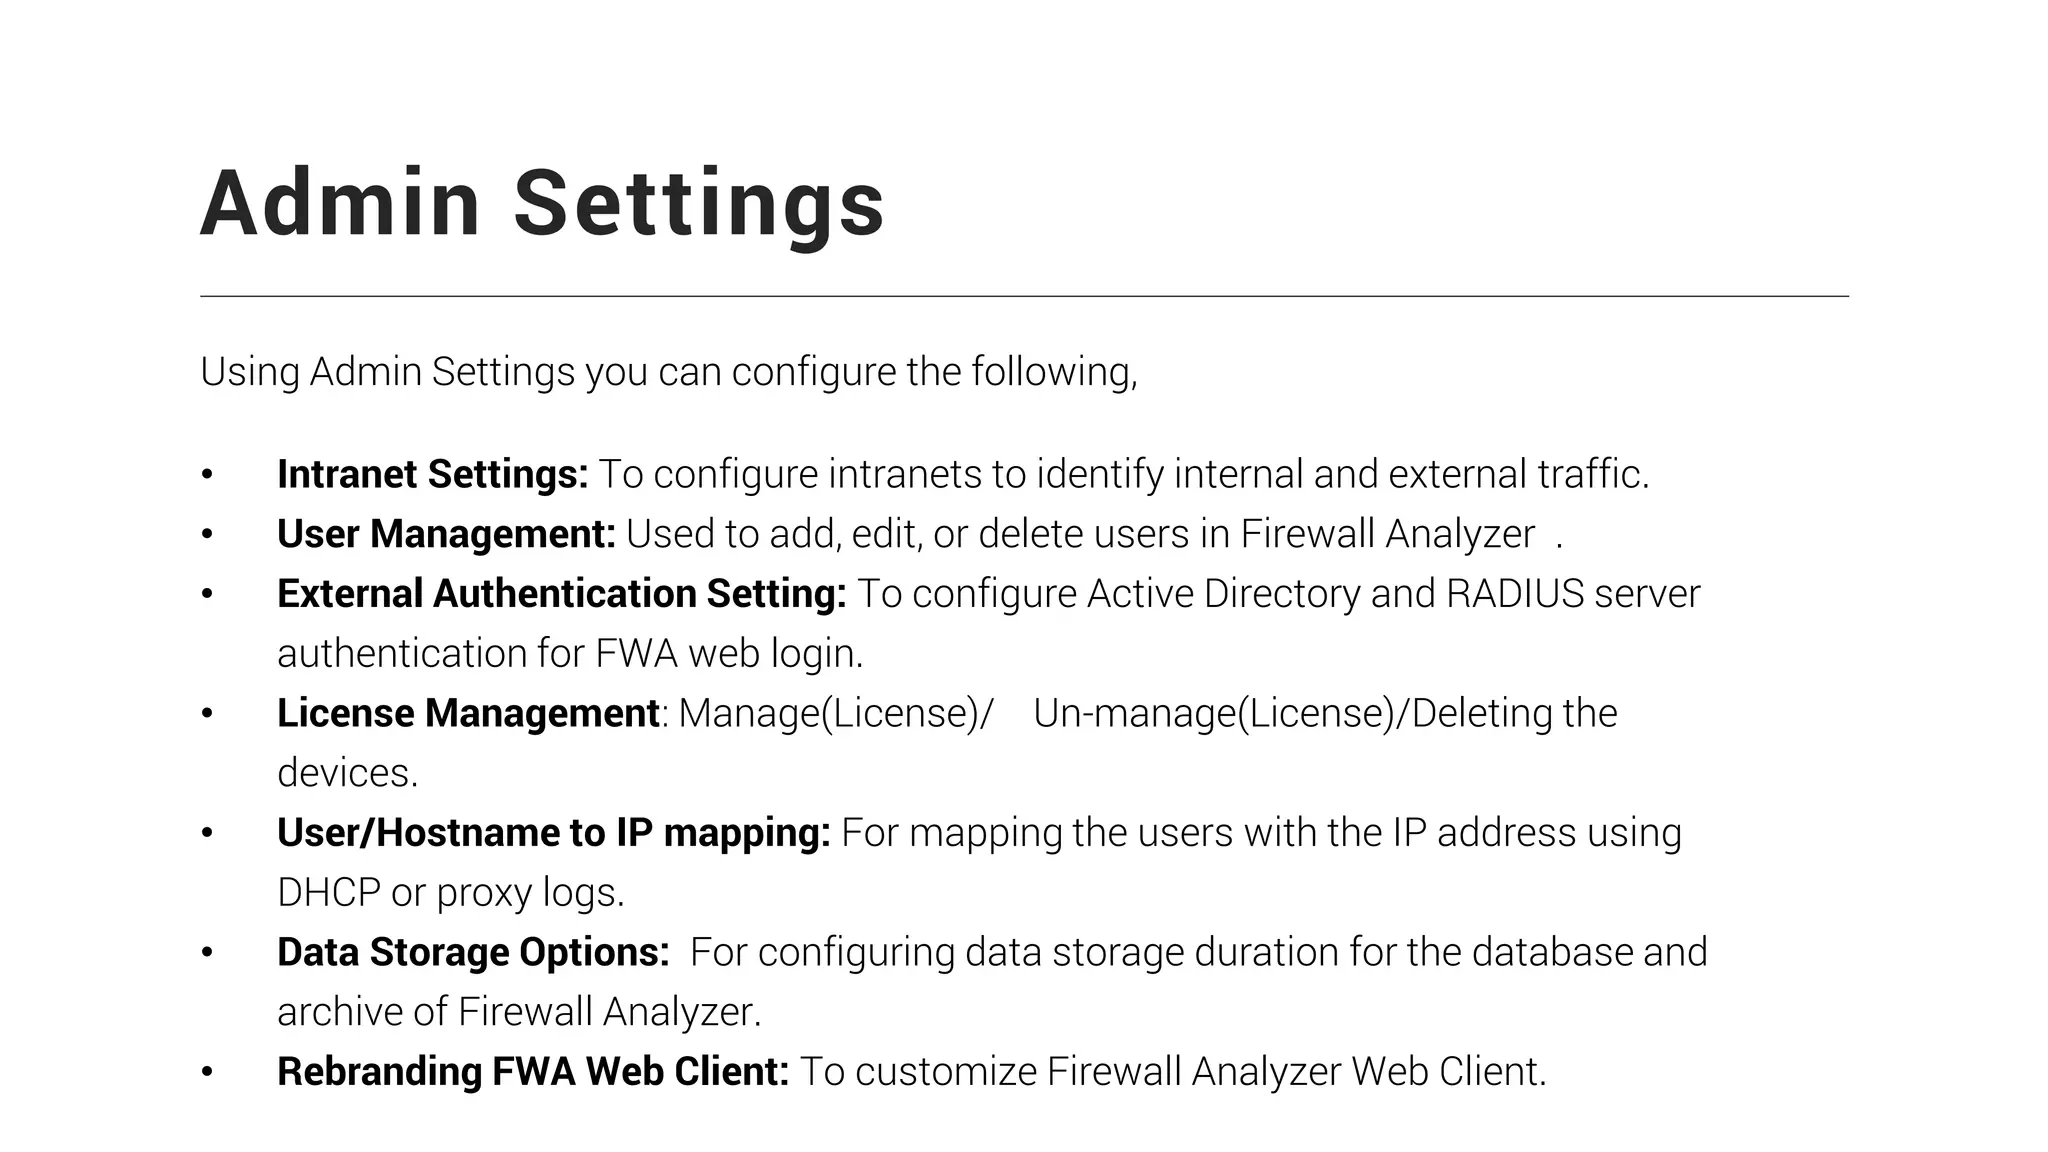
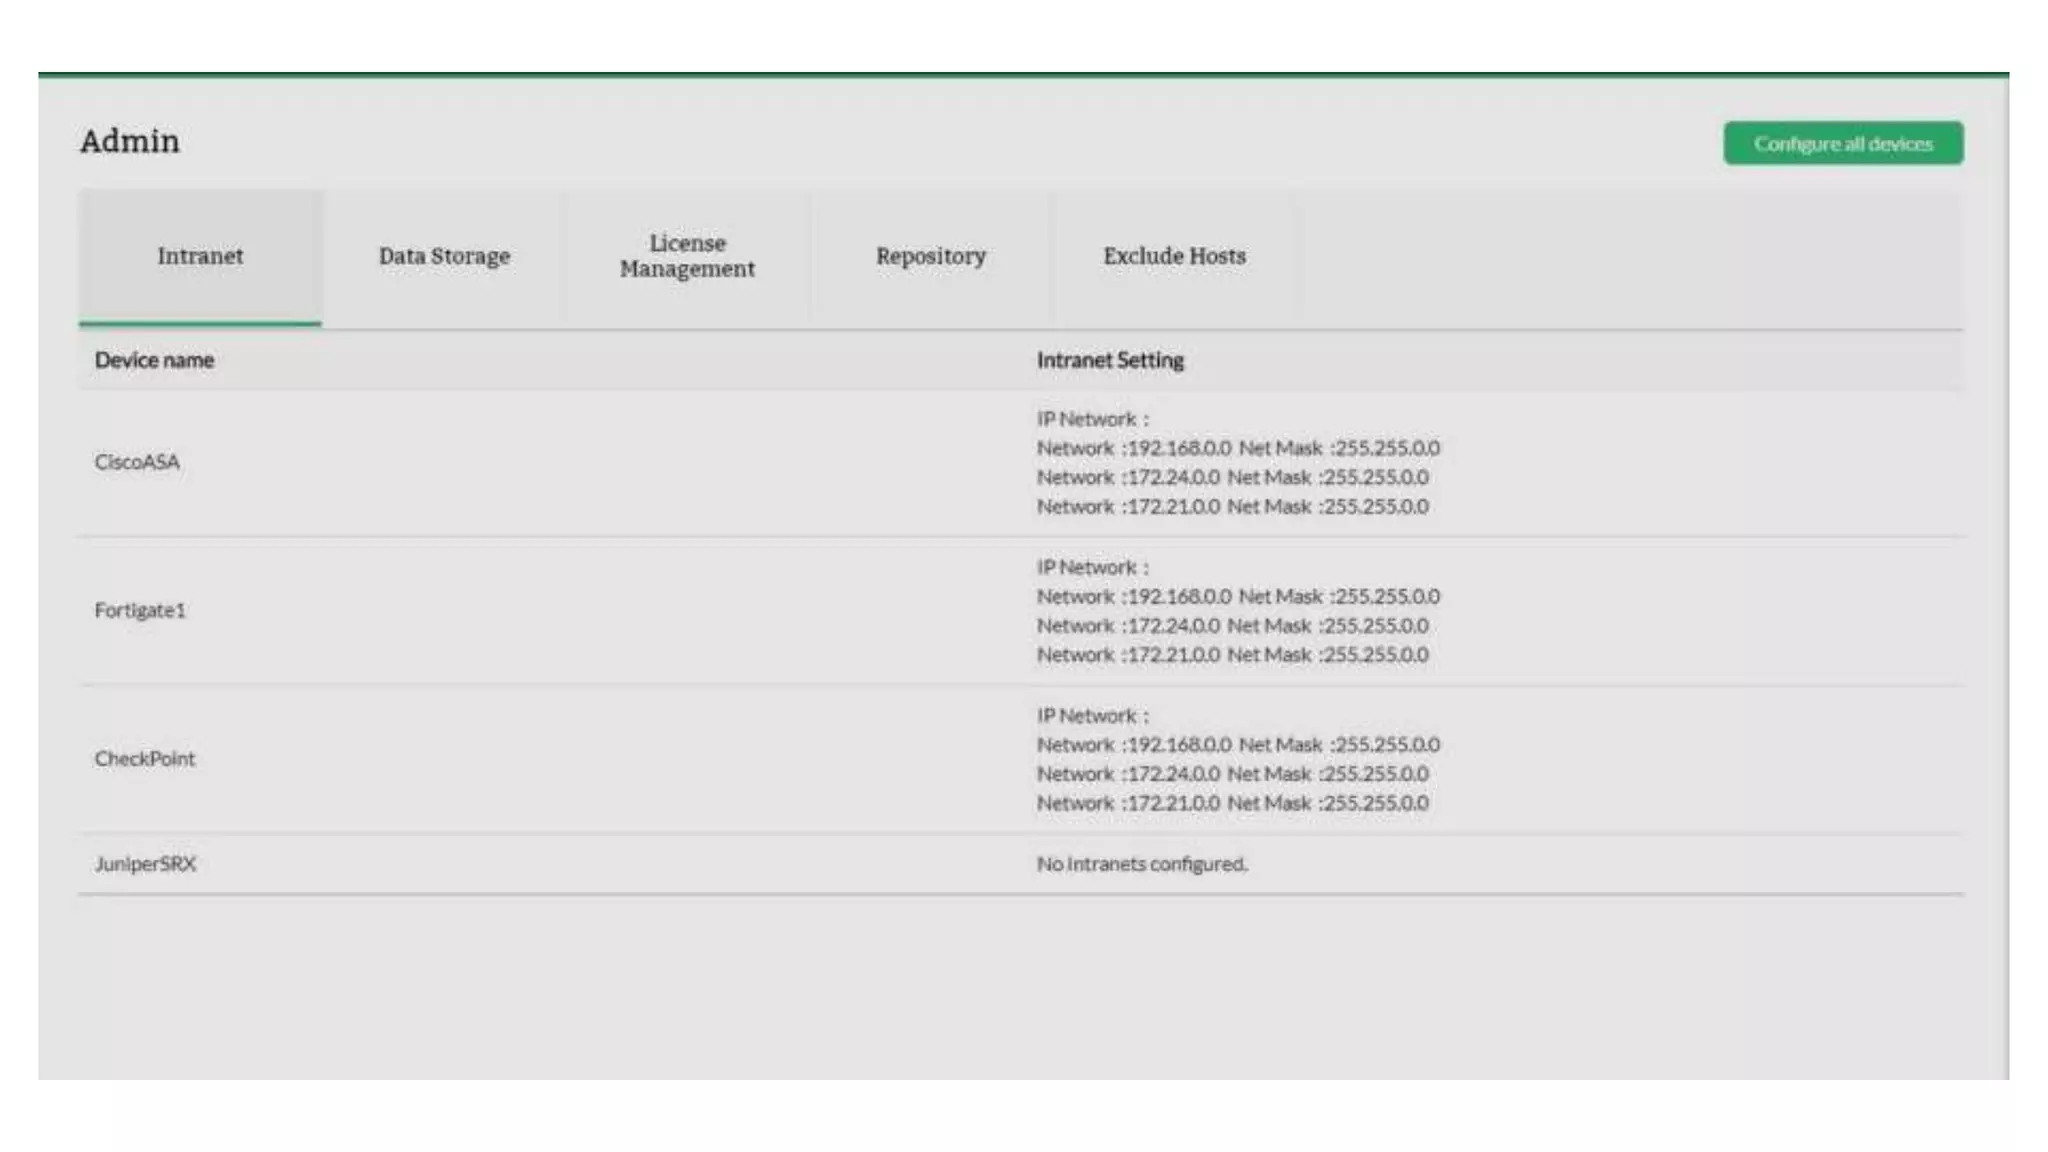
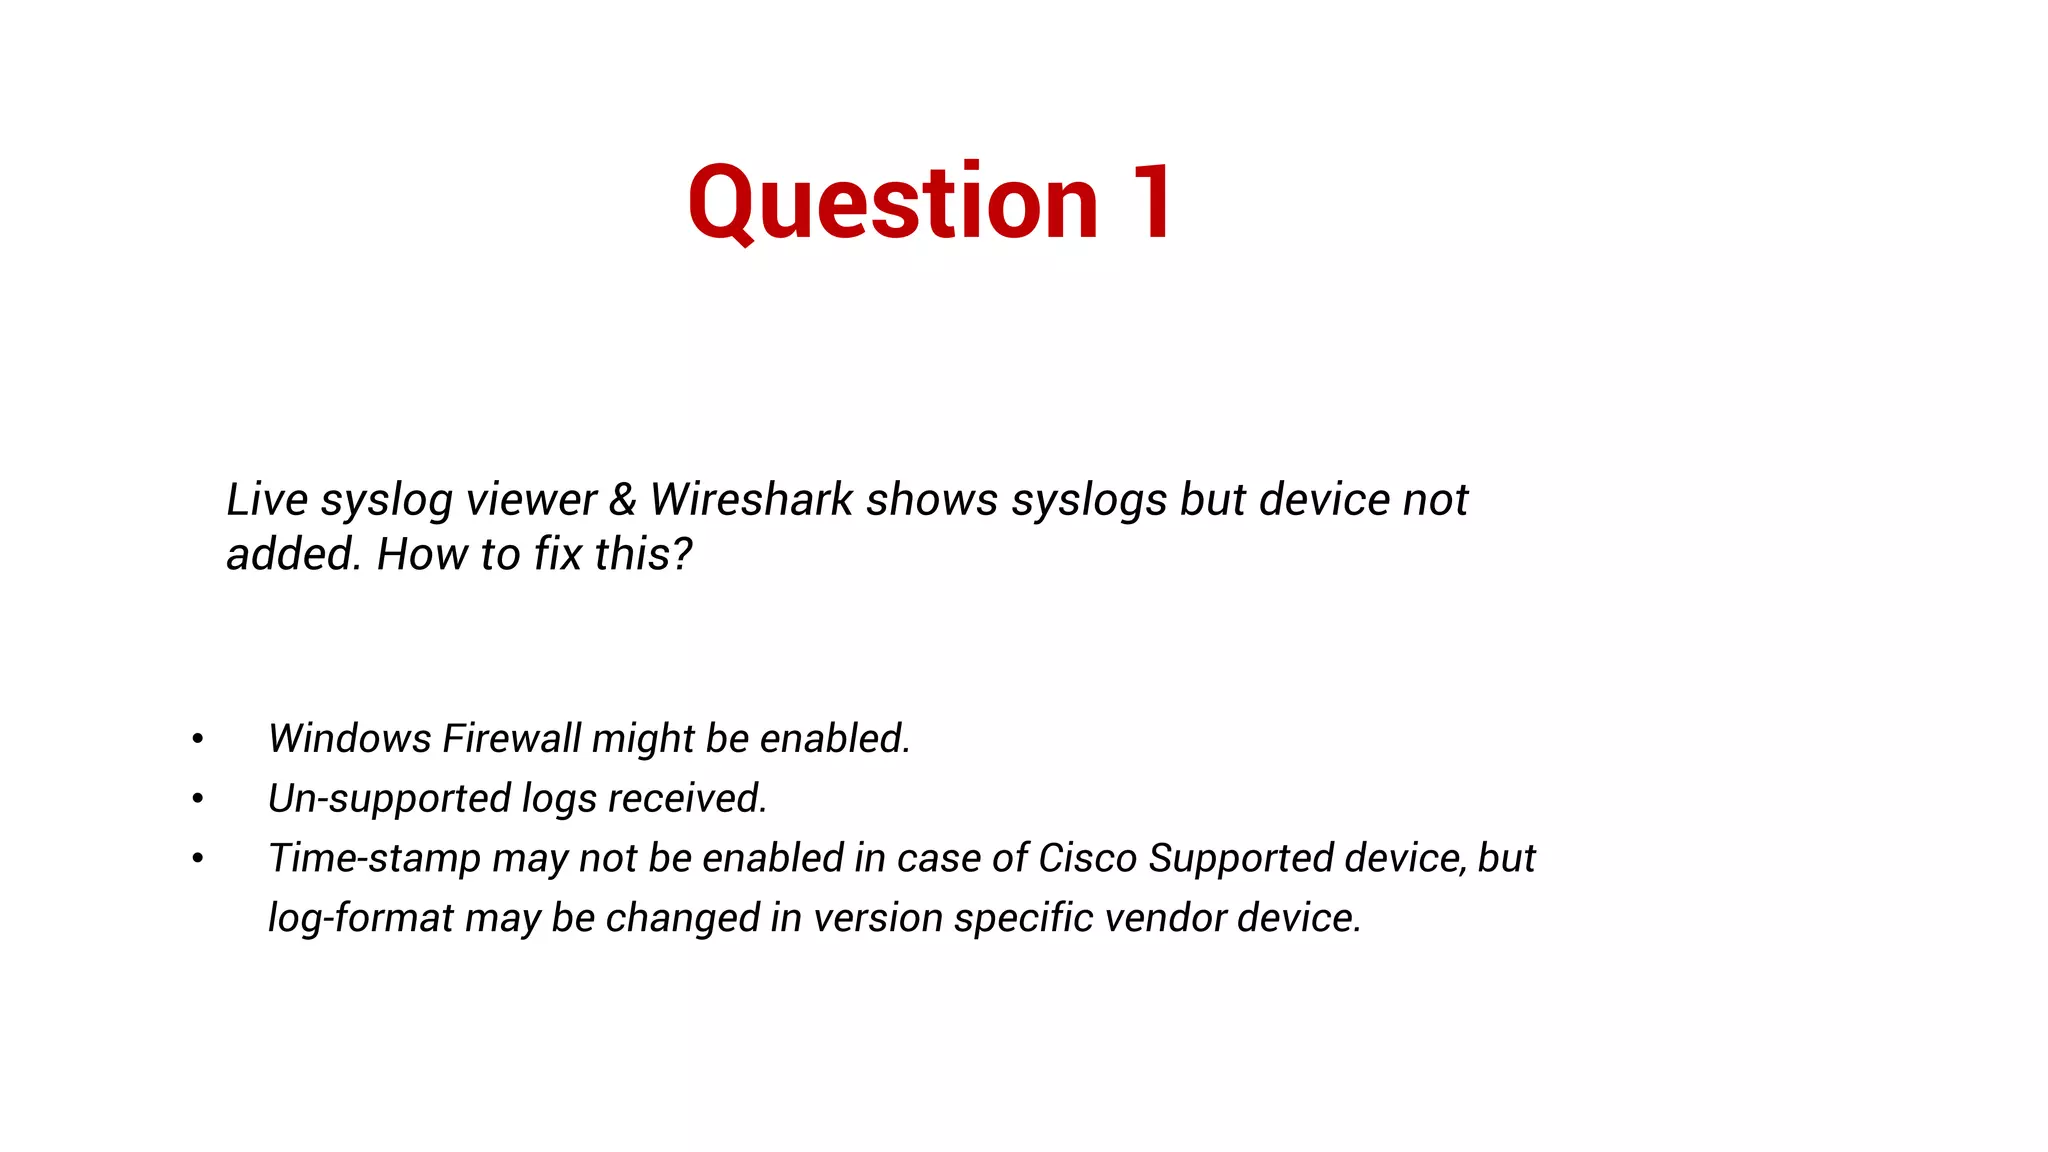
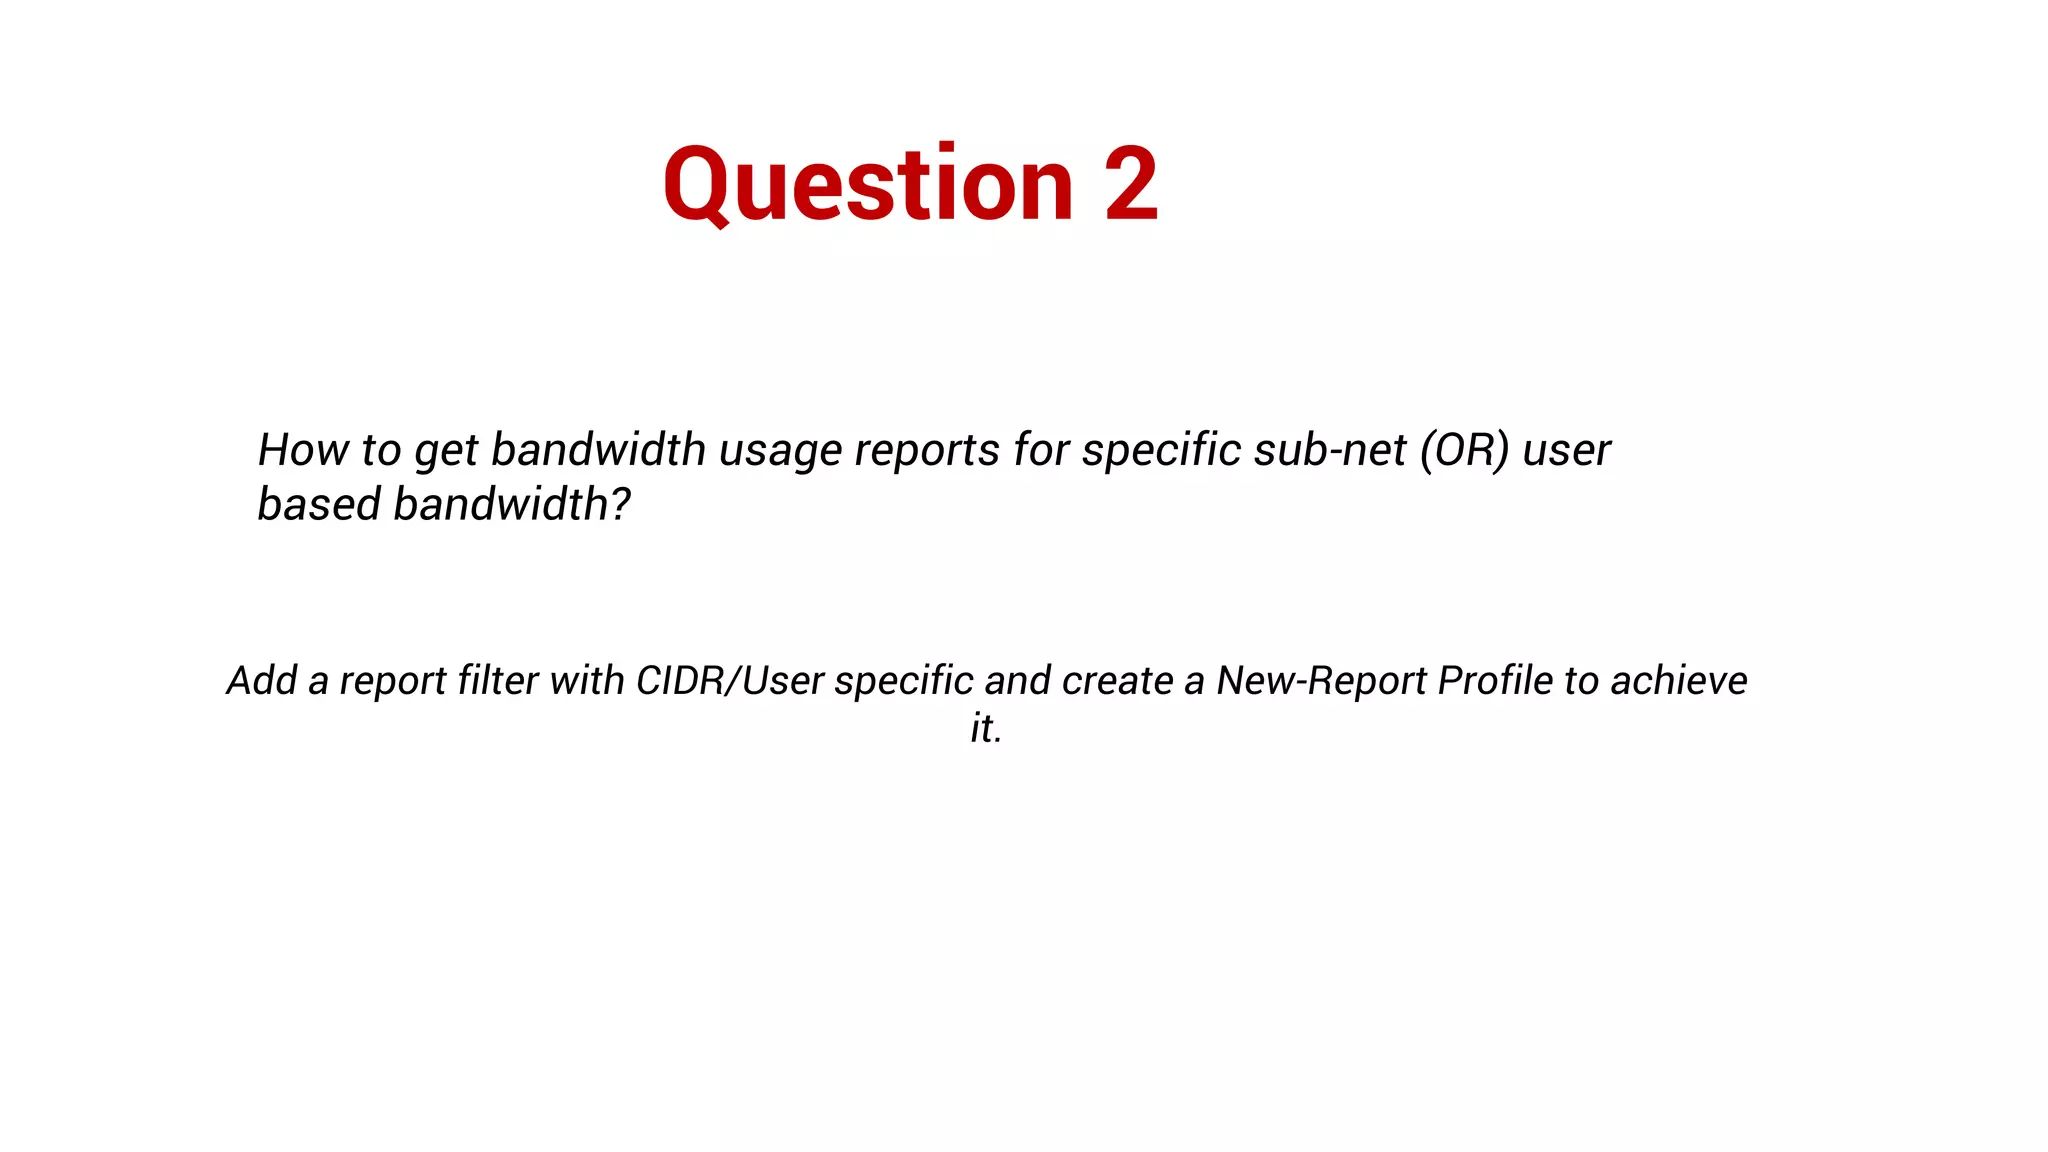
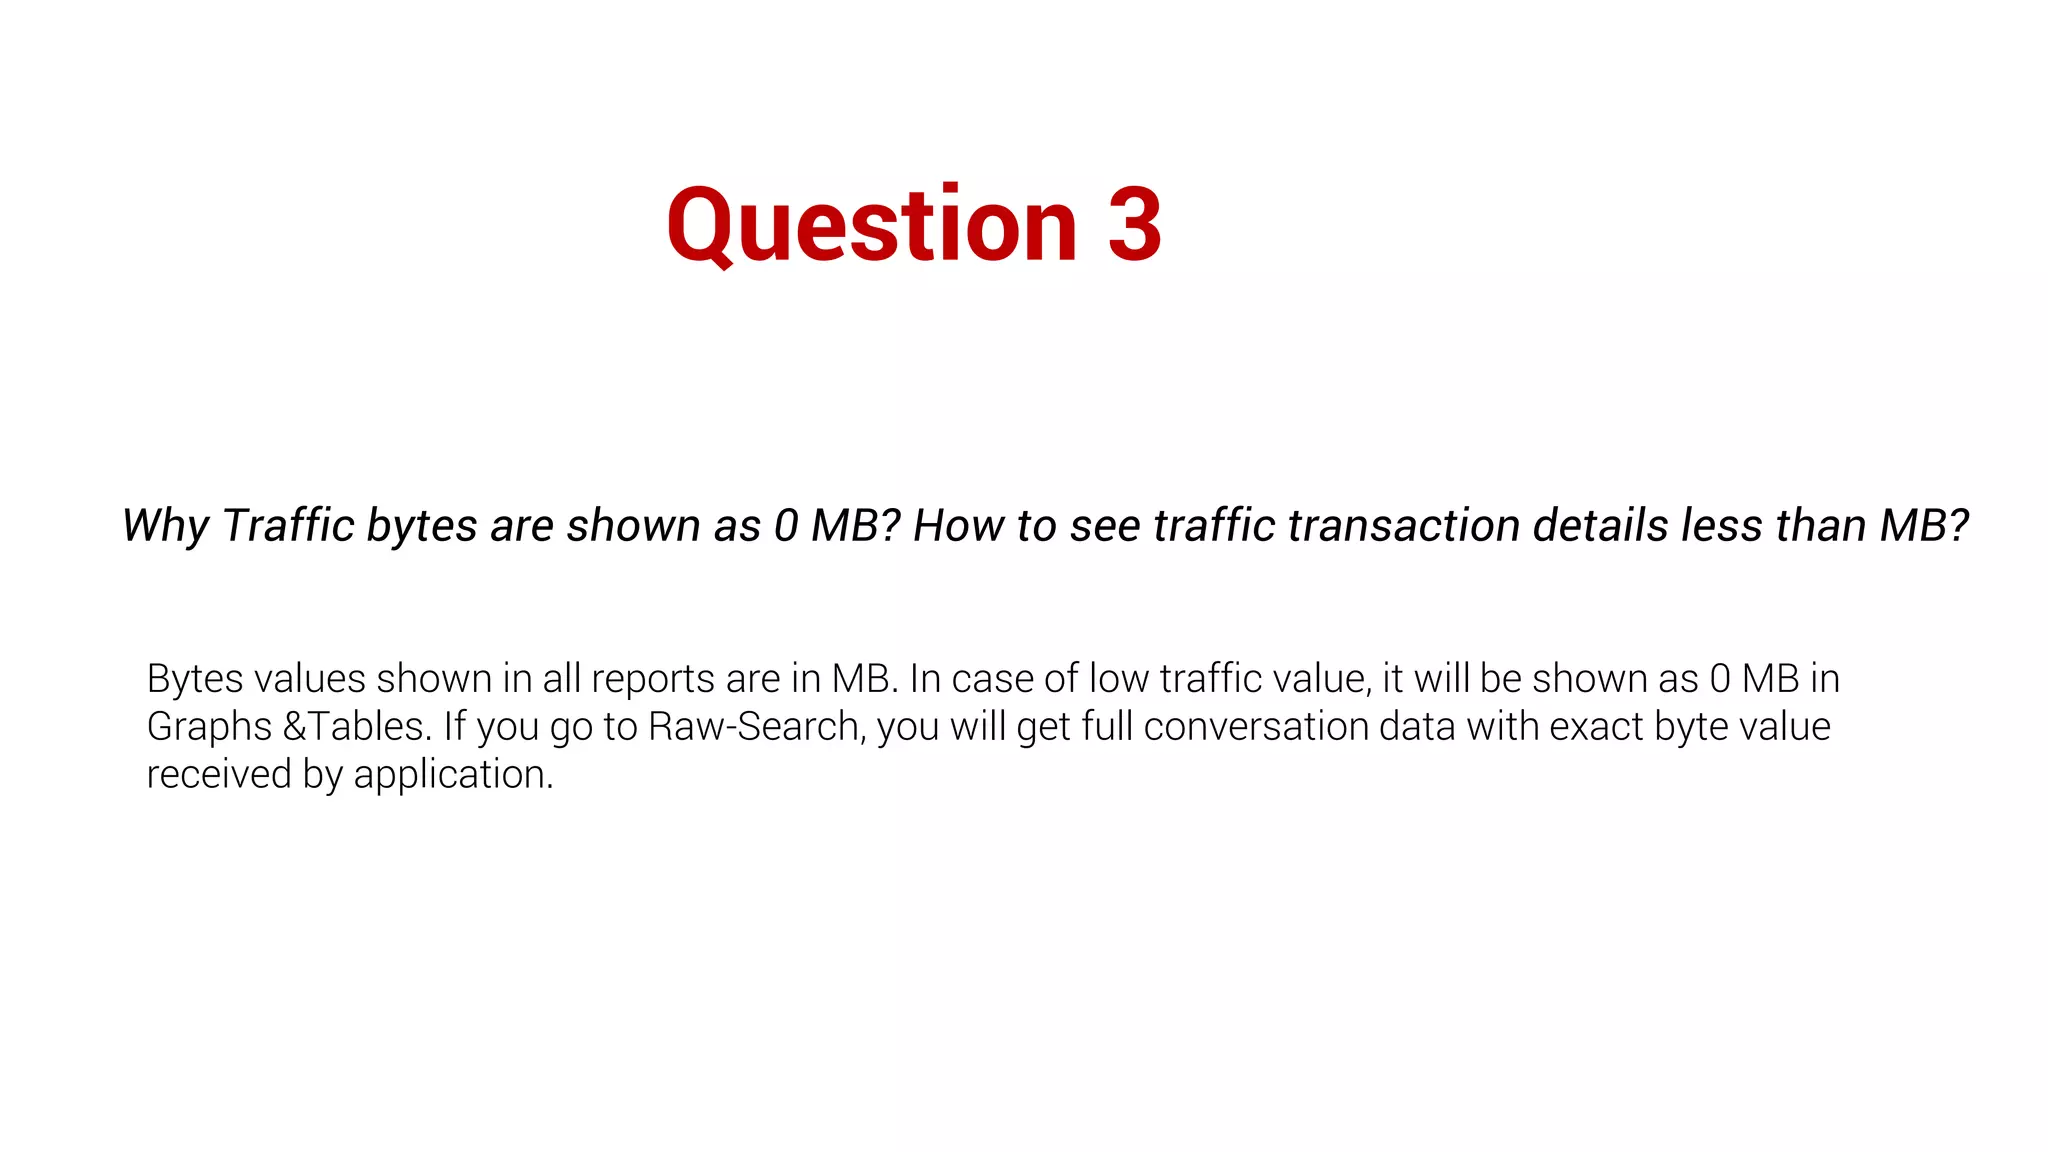
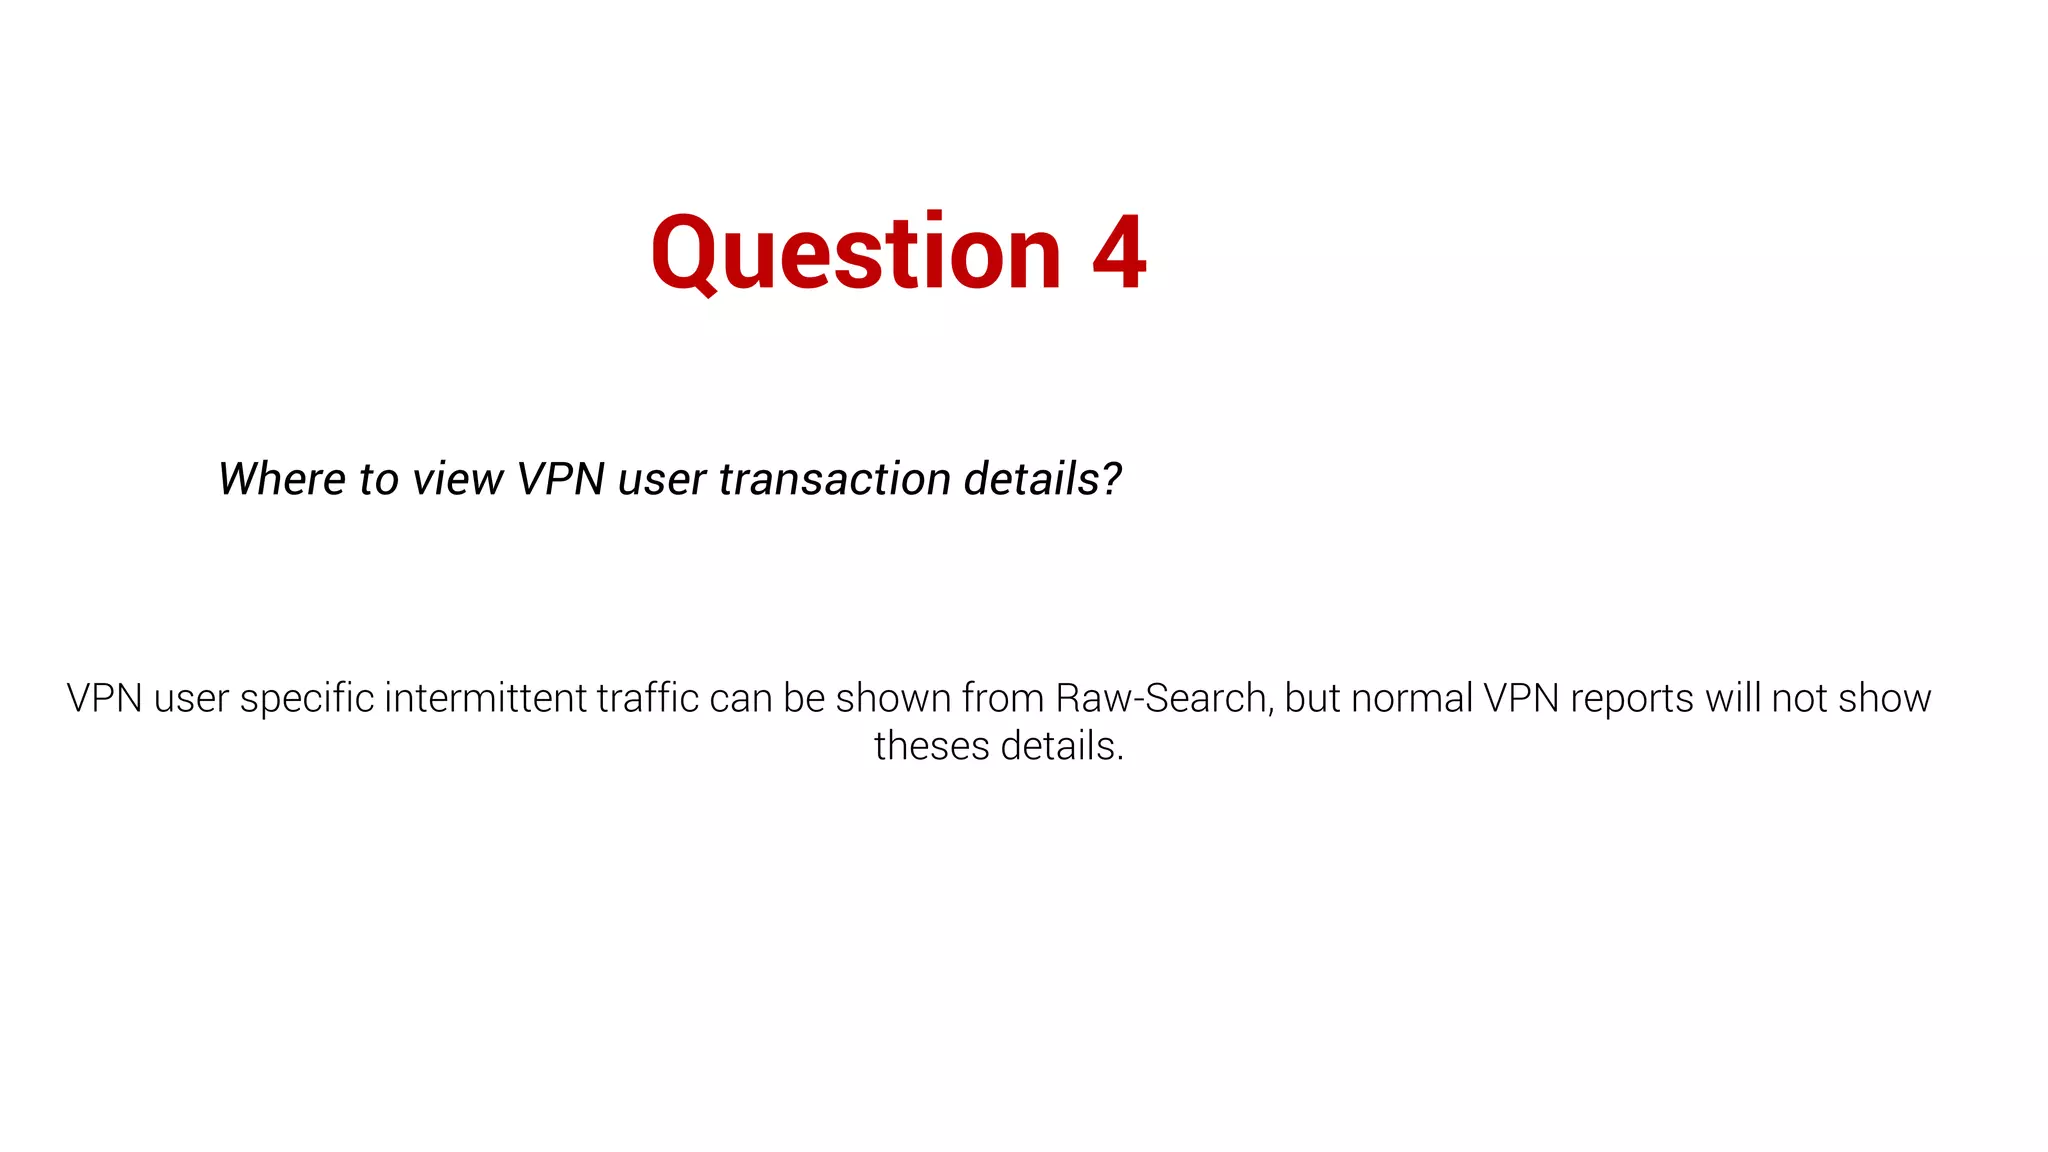
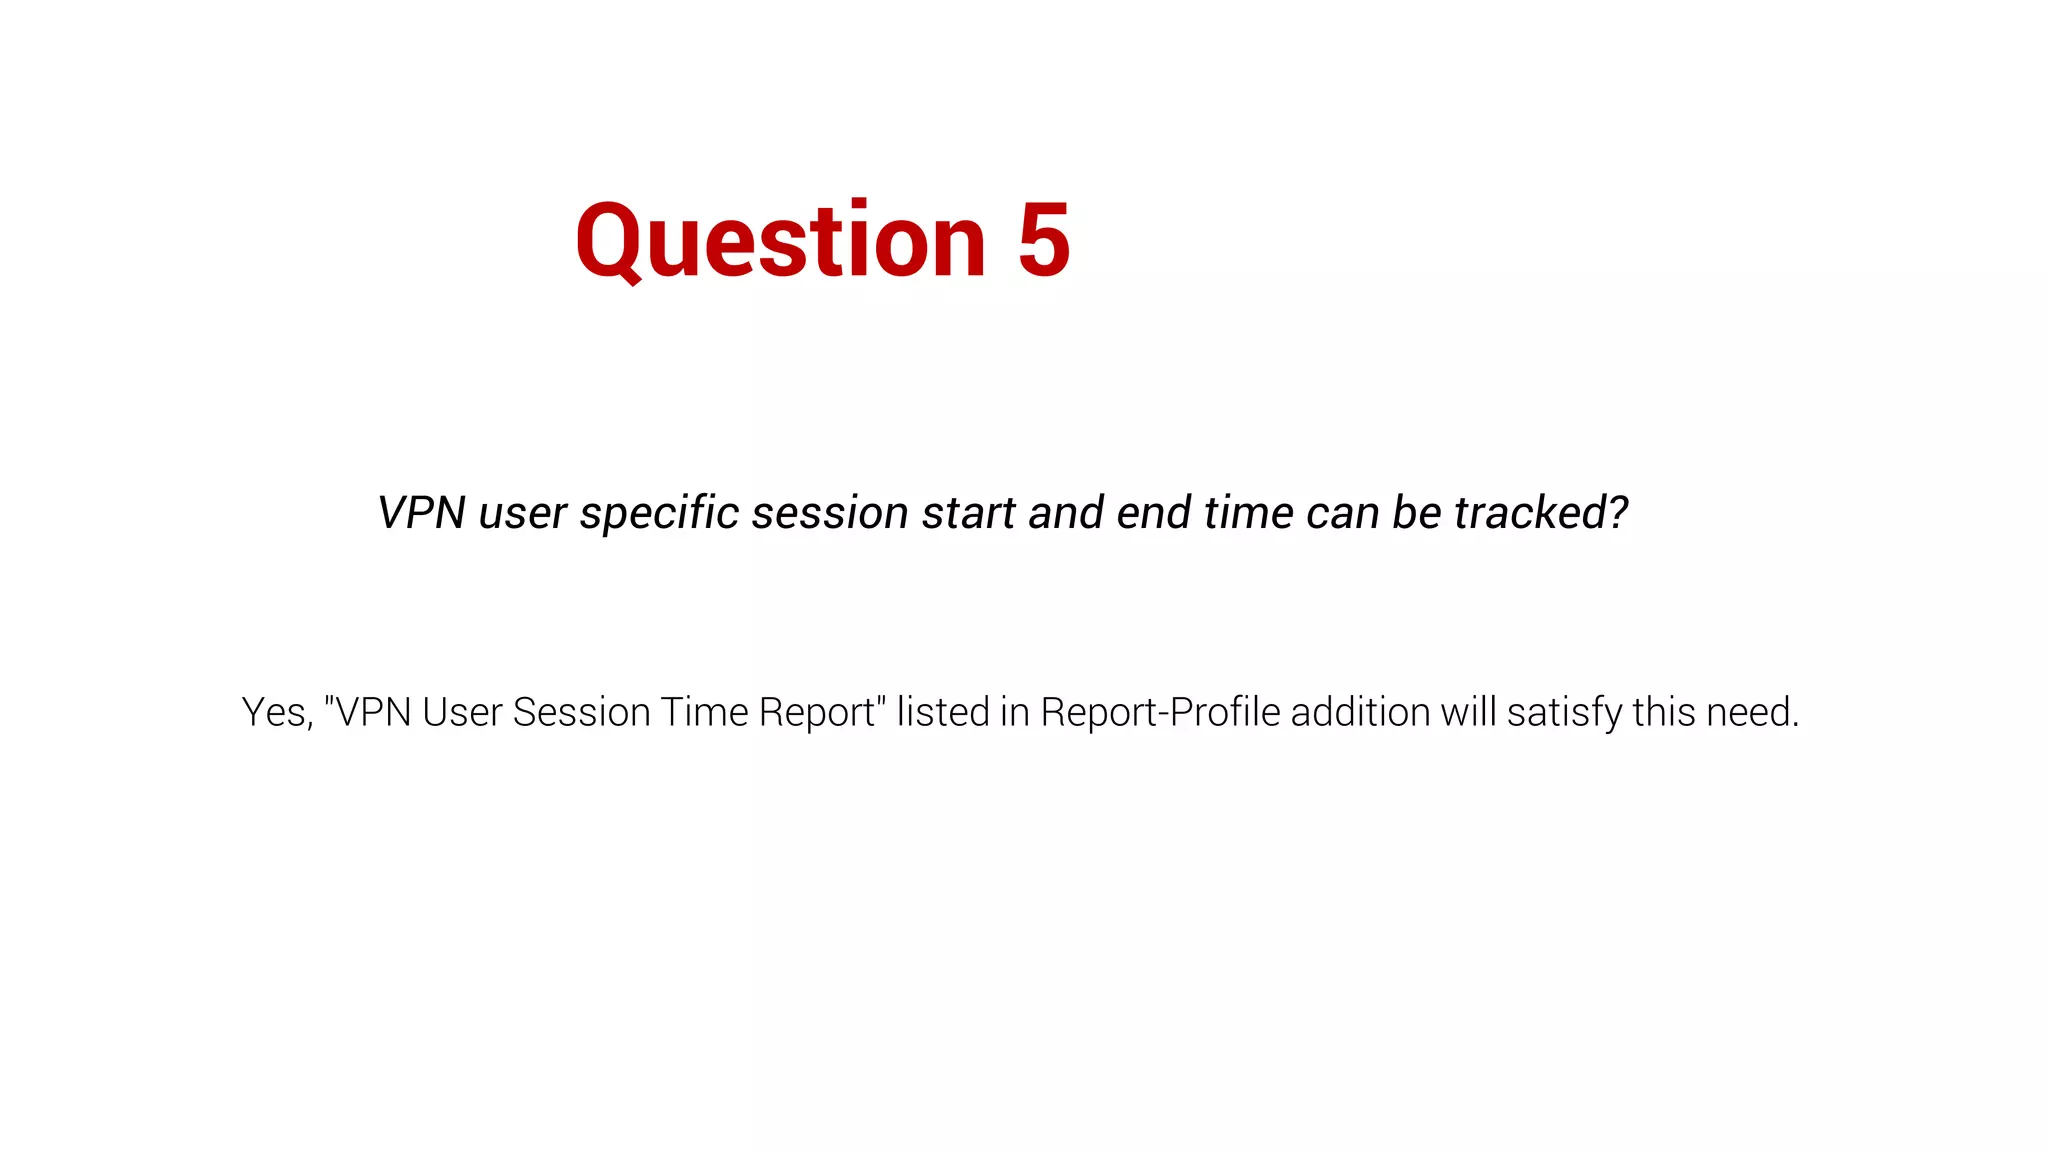
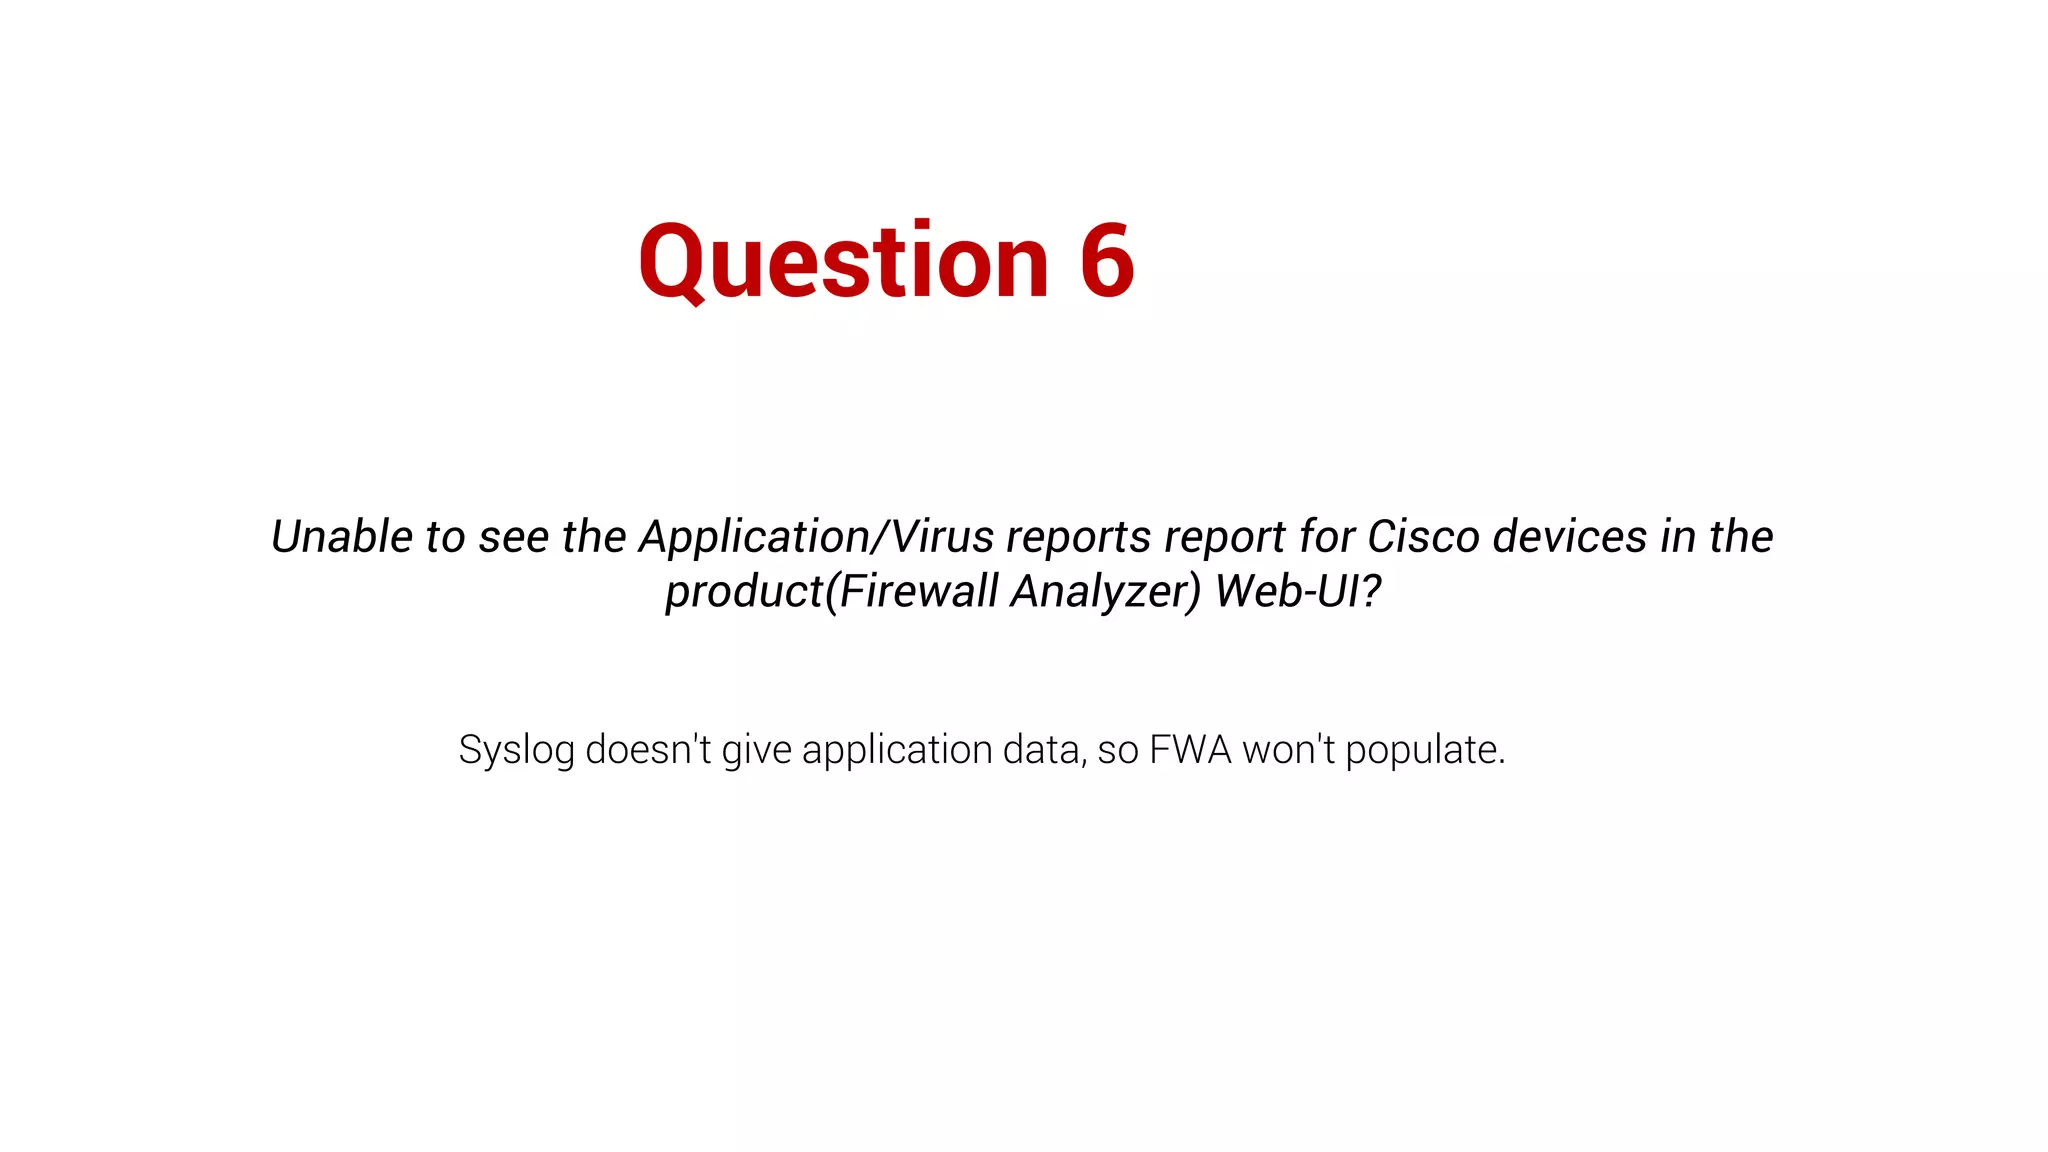
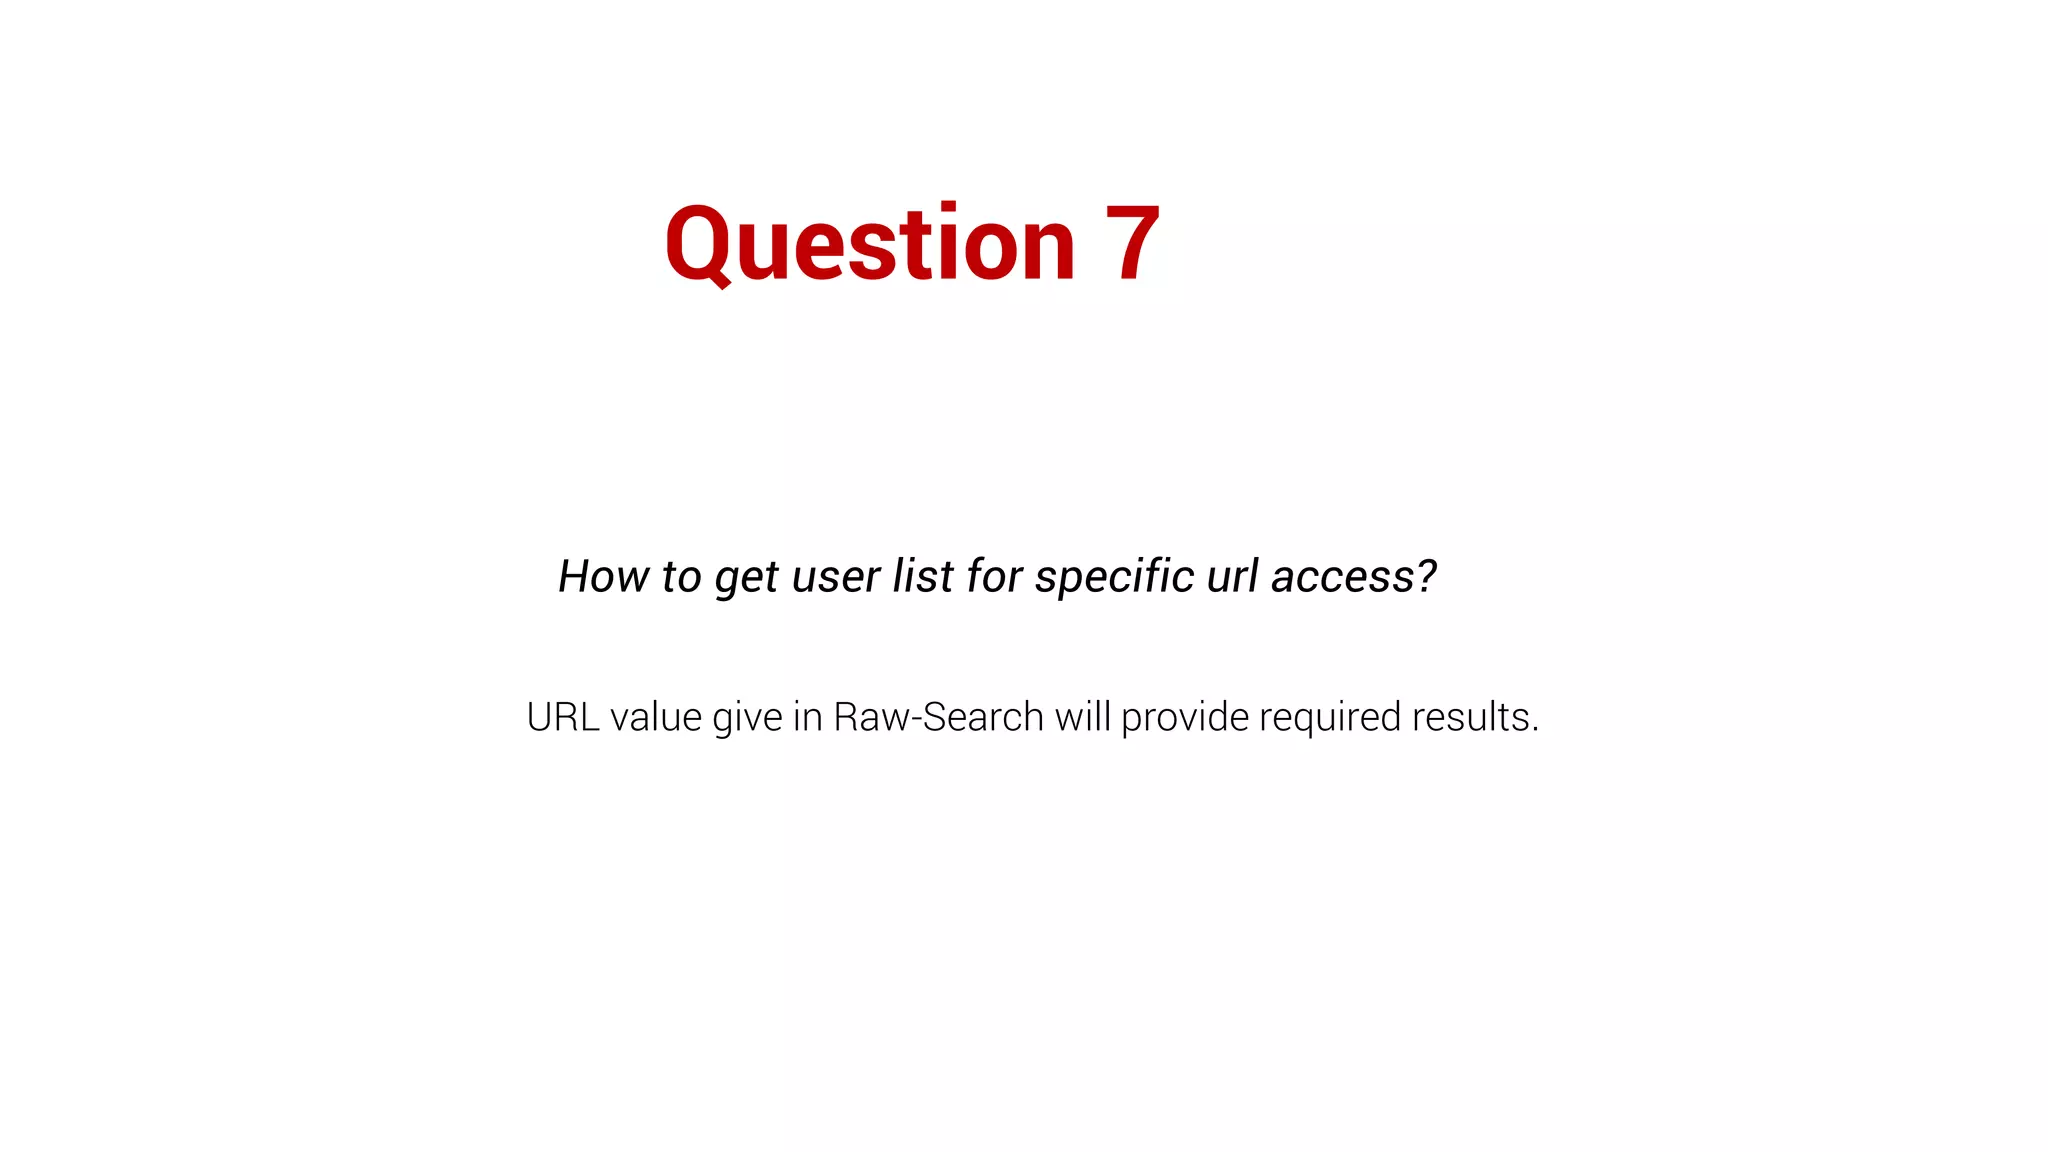
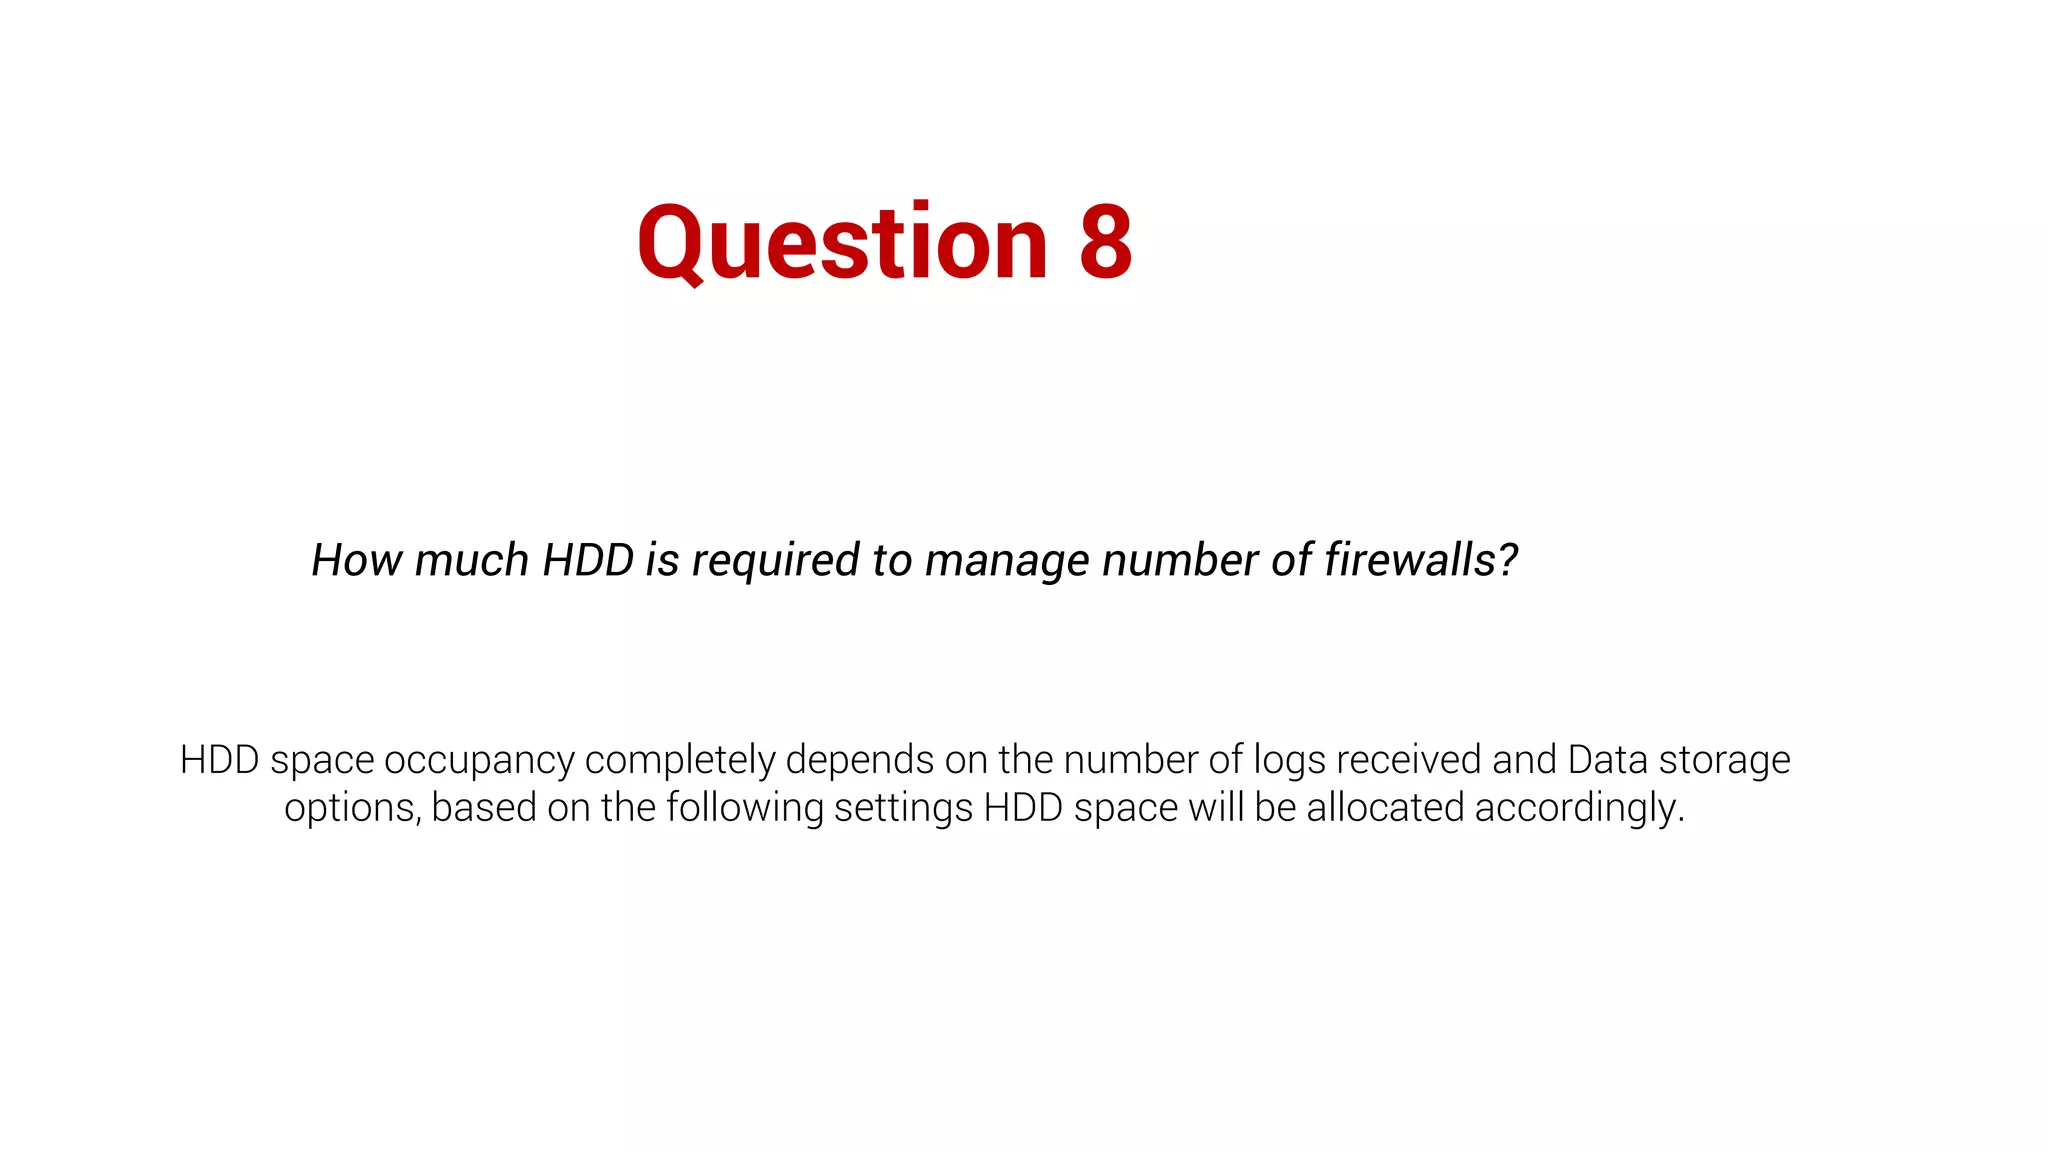
The nuts and bolts of Firewall
Analyzer
Firewall Analyzer training: Part I
Presenter
Can you hear me?
Can you see the presentation?
Please confirm by commenting in the chat panel
Agenda
• Why we need Firewall Analyzer?
• Installation of Firewall Analyzer.
• Configuring firewalls.
• Importing firewall logs.
• Classification of reports.
• Alerts & Notification.
Introduction
Why/What is Firewall Analyzer?
• Firewall Analyzer helps to analyze the logs generated by Firewalls using built-in syslog
server and produce various types of report.
Firewall Analyzer – Working
Architecture
Challenges
• Users complaining about Network Connectivity.
• Bandwidth utilization issues.
• Security Threats.
• Identifying & Preventing Security loop holes.
How Firewall Analyzer helpful to meet
Challenges
Firewall Analyzer is a Web based monitoring tool using which we can track the :
• URL activities.
• User based bandwidth.
• Secure networks before security threats arise.
• Meet the Compliance standards.
• Perform Security Audit.
• Do a capacity planning which will improve the performance of the network and
helpful to meet the challenges.
Installation of Firewall Analyzer
Installation requirements
1 GHZ Pentium
Dual Core
processor or
equivalent
6 GB of
RAM
50 GB of disk
space
PostgreSQL or MSSQL Windows or Linux
The disk space and RAM size requirements depend on the number of devices being analyzed and the
number of devices sending log information to Firewall Analyzer.
Device configuration
Configuration depends on vendor type
We have additional information for configuring different firewall types at
http://help.fwanalyzer.com/configure-firewall
Importing log files
After lauching the product for the first time, a screen will pop up, prompting you to import logs
After the initial import, you can always: Go to Settings > Firewall > System Click Import Log
and select which TXT or CSV file you'd like to import.
Setting up firewall logs
Where should I send syslogs?
Ports to be considered:
• web server port: 80
• Listener port—Port on which Firewall Analyzer
receives syslogs: 1514
• Database (Postgres): 13306 Ports are configurable
How do I send syslogs?
Ways of exporting syslogs to Firewall Analyzer:
1) Device configuration
2) Importing logs
Firewall Analyzer Functionalities
• Traffic analysis.
• Security analysis.
• Device management.
Traffic analysis
In Traffic analysis , we can analyze the traffic with
respect to :
• Top protocol.
• Top Applications.
• Hosts/users.
• Firewall rules.
• URL,Bytes sent,received.
Security analysis
In security analysis, we can find out :
• Who is trying to generate top
viruses.
• Attacks and spams.Which will
help us to take appropriate
actions.
• Protect the network from security
threats.
Device management
In Device management ,we can keep track of:
• Device configuration changes ,
• Meet our regulatory compliance requirements.
• Perform security audits.
Change Management
Dashboard overview
• Flexibility to create custom dashboards.
• One click option to change the default dashboard at login.
• Categorized for Traffic statistics, Security statistics,
Application, Attacks.
Custom Dashboard
Device Inventory
Classification of reports
• Traffic reports
• Security reports
• Admin Reports
• VPN reports
• URL Reports
• Internet reports
• Intranet reports
• Streaming and Chat Sites Reports
• Country Reports
• Inbound Outbound Reports
• Attack Reports
• Web Usage Reports
• Virus Reports and more.
Proxy Reports
• Live Reports
• Top Talkers Report
• Website Details Report
• Proxy Usage Report
• URL Categories Reports
• VPN Trend Reports
Search Reports
It allows you to search from the Raw Firewall Logs and aggregated logs database.
• Aggregated Search can be used if you want to
search from the aggregated logs database.
• Raw Search can be used if you want to from the raw
firewall logs.
Alarms and Notifications
• An alarm is triggered whenever an event matching a specific criteria is generated.
An alarm profile lets you define such specific criteria, and also notify you by email,
when the corresponding alarm is triggered.
Types of Alarms:
• Normal
• Anomaly
• Bandwidth
Alert use cases
Use case #1
Need an alert when DDoS attacks happens five times within 10 minutes.
Follow these steps:
• Select the Normal Alert profile.
• Set the criteria as attack contains DDoS.
• Set the threshold to five events in ten
minutes.
Use case #2
Need to be notified when a user suresh visits facebook during working hours and
consumes Total traffic of 1 GB in a day.
Follow these steps:
• Select the Anomaly Alert profile.
• Set the criteria.
• Set the threshold value.
Use case #3
Need to be notified when an Inbound traffic for Identity interface reaches 10 GB.
Follow these steps:
• Select the Bandwidth Alert profile.
• Set the criteria.
• Set the threshold value.
Settings
The settings section allows you to configure several system settings from the server running
Firewall Analyzer.
Types of Settings:
• Firewall Settings
• System Settings
• Administration Settings
Firewall Settings
Using Firewall Settings you can configure the following:
• Syslog Server Settings: To configure syslog servers to receive logs at different ports.
• Checkpoint Firewall Settings: To configure settings specific to Check Point firewalls.
• Device Rule: To view Used, Unused rules, Security Audit and Change Management
details of a Firewall device.
• Diagnose Firewall Connections: To monitor and analyze live connections through the
Firewall.
• Firewall Availability Alert: To configure to trigger alerts if there was no logs from
Firewalls for a specific period of time.
• Device Details: To view details of logs received from each device.
System Settings
Using System Settings you can configure the following,
• Import log Files: Used to import log files from the local machine or by FTP.
• Protocol Groups: For managing protocol groups .
• Archived Files: For configuring archiving intervals, or load an archived file into the
database.
• Schedule Listing: Contains the list of reports scheduled.
• Mail Server Settings: For configuring the mail server for reports & alerts.
• Configure Dns: For resolving DNS globally for all the reports.
• Customize Report: Customize the device reports to be shown in Device list.
• Database Console: To execute queries for trouble shooting.
Admin Settings
Using Admin Settings you can configure the following,
• Intranet Settings: To configure intranets to identify internal and external traffic.
• User Management: Used to add, edit, or delete users in Firewall Analyzer .
• External Authentication Setting: To configure Active Directory and RADIUS server
authentication for FWA web login.
• License Management: Manage(License)/ Un-manage(License)/Deleting the
devices.
• User/Hostname to IP mapping: For mapping the users with the IP address using
DHCP or proxy logs.
• Data Storage Options: For configuring data storage duration for the database and
archive of Firewall Analyzer.
• Rebranding FWA Web Client: To customize Firewall Analyzer Web Client.
Support for more than 50 vendors
Firewall Analyzer is a technology partner with :
Technology partnerships
What our partner has to say about us:
"This integration offers administrators an incredible amount of visibility into firewall systems. Application control
goes deeper with detailed usage reports, while change management, security reporting, event trends, and a detailed
compliance report for firewall configuration creates an immediate ROI for customers to present back to their
stakeholders." — Ben Oster, WatchGuard
Need more help?
youtube.com/opmanagertechvideos
help.fwanalyzer.com
forums.manageengine.com/fwanalyzer
fwanalyzer-support@manageengine.com
+1 (888) 720-9500 / +1 (408) 916 - 9595
Upcoming training on May 3rd
Understanding firewall policies and their effectiveness in defending against
network threats.
During this training, you'll learn about:
• Firewall policies.
• Optimizing firewall policies.
• Policy classification reports.
Q&A
Question 1
Live syslog viewer & Wireshark shows syslogs but device not
added. How to fix this?
• Windows Firewall might be enabled.
• Un-supported logs received.
• Time-stamp may not be enabled in case of Cisco Supported device, but
log-format may be changed in version specific vendor device.
Question 2
How to get bandwidth usage reports for specific sub-net (OR) user
based bandwidth?
Add a report filter with CIDR/User specific and create a New-Report Profile to achieve
it.
Question 3
Why Traffic bytes are shown as 0 MB? How to see traffic transaction details less than MB?
Bytes values shown in all reports are in MB. In case of low traffic value, it will be shown as 0 MB in
Graphs &Tables. If you go to Raw-Search, you will get full conversation data with exact byte value
received by application.
Question 4
Where to view VPN user transaction details?
VPN user specific intermittent traffic can be shown from Raw-Search, but normal VPN reports will not show
theses details.
Question 5
VPN user specific session start and end time can be tracked?
Yes, "VPN User Session Time Report" listed in Report-Profile addition will satisfy this need.
Question 6
Unable to see the Application/Virus reports report for Cisco devices in the
product(Firewall Analyzer) Web-UI?
Syslog doesn't give application data, so FWA won't populate.
Question 7
How to get user list for specific url access?
URL value give in Raw-Search will provide required results.
Question 8
How much HDD is required to manage number of firewalls?
HDD space occupancy completely depends on the number of logs received and Data storage
options, based on the following settings HDD space will be allocated accordingly.
Thank you!
fwanalyzer-support@manageengine.com

Copy of learn_the_art_of_firewall_security(1)

  • 1.
    The nuts andbolts of Firewall Analyzer Firewall Analyzer training: Part I
  • 2.
  • 3.
    Can you hearme? Can you see the presentation? Please confirm by commenting in the chat panel
  • 4.
    Agenda • Why weneed Firewall Analyzer? • Installation of Firewall Analyzer. • Configuring firewalls. • Importing firewall logs. • Classification of reports. • Alerts & Notification.
  • 5.
    Introduction Why/What is FirewallAnalyzer? • Firewall Analyzer helps to analyze the logs generated by Firewalls using built-in syslog server and produce various types of report.
  • 6.
    Firewall Analyzer –Working Architecture
  • 7.
    Challenges • Users complainingabout Network Connectivity. • Bandwidth utilization issues. • Security Threats. • Identifying & Preventing Security loop holes.
  • 8.
    How Firewall Analyzerhelpful to meet Challenges Firewall Analyzer is a Web based monitoring tool using which we can track the : • URL activities. • User based bandwidth. • Secure networks before security threats arise. • Meet the Compliance standards. • Perform Security Audit. • Do a capacity planning which will improve the performance of the network and helpful to meet the challenges.
  • 9.
  • 10.
    Installation requirements 1 GHZPentium Dual Core processor or equivalent 6 GB of RAM 50 GB of disk space PostgreSQL or MSSQL Windows or Linux The disk space and RAM size requirements depend on the number of devices being analyzed and the number of devices sending log information to Firewall Analyzer.
  • 11.
    Device configuration Configuration dependson vendor type We have additional information for configuring different firewall types at http://help.fwanalyzer.com/configure-firewall
  • 12.
    Importing log files Afterlauching the product for the first time, a screen will pop up, prompting you to import logs After the initial import, you can always: Go to Settings > Firewall > System Click Import Log and select which TXT or CSV file you'd like to import.
  • 13.
    Setting up firewalllogs Where should I send syslogs? Ports to be considered: • web server port: 80 • Listener port—Port on which Firewall Analyzer receives syslogs: 1514 • Database (Postgres): 13306 Ports are configurable How do I send syslogs? Ways of exporting syslogs to Firewall Analyzer: 1) Device configuration 2) Importing logs
  • 14.
    Firewall Analyzer Functionalities •Traffic analysis. • Security analysis. • Device management.
  • 15.
    Traffic analysis In Trafficanalysis , we can analyze the traffic with respect to : • Top protocol. • Top Applications. • Hosts/users. • Firewall rules. • URL,Bytes sent,received.
  • 16.
    Security analysis In securityanalysis, we can find out : • Who is trying to generate top viruses. • Attacks and spams.Which will help us to take appropriate actions. • Protect the network from security threats.
  • 17.
    Device management In Devicemanagement ,we can keep track of: • Device configuration changes , • Meet our regulatory compliance requirements. • Perform security audits.
  • 19.
  • 20.
    Dashboard overview • Flexibilityto create custom dashboards. • One click option to change the default dashboard at login. • Categorized for Traffic statistics, Security statistics, Application, Attacks.
  • 22.
  • 23.
  • 24.
    Classification of reports •Traffic reports • Security reports • Admin Reports • VPN reports • URL Reports • Internet reports • Intranet reports • Streaming and Chat Sites Reports • Country Reports • Inbound Outbound Reports • Attack Reports • Web Usage Reports • Virus Reports and more.
  • 26.
    Proxy Reports • LiveReports • Top Talkers Report • Website Details Report • Proxy Usage Report • URL Categories Reports • VPN Trend Reports
  • 28.
    Search Reports It allowsyou to search from the Raw Firewall Logs and aggregated logs database. • Aggregated Search can be used if you want to search from the aggregated logs database. • Raw Search can be used if you want to from the raw firewall logs.
  • 29.
    Alarms and Notifications •An alarm is triggered whenever an event matching a specific criteria is generated. An alarm profile lets you define such specific criteria, and also notify you by email, when the corresponding alarm is triggered. Types of Alarms: • Normal • Anomaly • Bandwidth
  • 30.
  • 31.
    Use case #1 Needan alert when DDoS attacks happens five times within 10 minutes. Follow these steps: • Select the Normal Alert profile. • Set the criteria as attack contains DDoS. • Set the threshold to five events in ten minutes.
  • 32.
    Use case #2 Needto be notified when a user suresh visits facebook during working hours and consumes Total traffic of 1 GB in a day. Follow these steps: • Select the Anomaly Alert profile. • Set the criteria. • Set the threshold value.
  • 33.
    Use case #3 Needto be notified when an Inbound traffic for Identity interface reaches 10 GB. Follow these steps: • Select the Bandwidth Alert profile. • Set the criteria. • Set the threshold value.
  • 34.
    Settings The settings sectionallows you to configure several system settings from the server running Firewall Analyzer. Types of Settings: • Firewall Settings • System Settings • Administration Settings
  • 35.
    Firewall Settings Using FirewallSettings you can configure the following: • Syslog Server Settings: To configure syslog servers to receive logs at different ports. • Checkpoint Firewall Settings: To configure settings specific to Check Point firewalls. • Device Rule: To view Used, Unused rules, Security Audit and Change Management details of a Firewall device. • Diagnose Firewall Connections: To monitor and analyze live connections through the Firewall. • Firewall Availability Alert: To configure to trigger alerts if there was no logs from Firewalls for a specific period of time. • Device Details: To view details of logs received from each device.
  • 37.
    System Settings Using SystemSettings you can configure the following, • Import log Files: Used to import log files from the local machine or by FTP. • Protocol Groups: For managing protocol groups . • Archived Files: For configuring archiving intervals, or load an archived file into the database. • Schedule Listing: Contains the list of reports scheduled. • Mail Server Settings: For configuring the mail server for reports & alerts. • Configure Dns: For resolving DNS globally for all the reports. • Customize Report: Customize the device reports to be shown in Device list. • Database Console: To execute queries for trouble shooting.
  • 39.
    Admin Settings Using AdminSettings you can configure the following, • Intranet Settings: To configure intranets to identify internal and external traffic. • User Management: Used to add, edit, or delete users in Firewall Analyzer . • External Authentication Setting: To configure Active Directory and RADIUS server authentication for FWA web login. • License Management: Manage(License)/ Un-manage(License)/Deleting the devices. • User/Hostname to IP mapping: For mapping the users with the IP address using DHCP or proxy logs. • Data Storage Options: For configuring data storage duration for the database and archive of Firewall Analyzer. • Rebranding FWA Web Client: To customize Firewall Analyzer Web Client.
  • 41.
    Support for morethan 50 vendors
  • 42.
    Firewall Analyzer isa technology partner with : Technology partnerships What our partner has to say about us: "This integration offers administrators an incredible amount of visibility into firewall systems. Application control goes deeper with detailed usage reports, while change management, security reporting, event trends, and a detailed compliance report for firewall configuration creates an immediate ROI for customers to present back to their stakeholders." — Ben Oster, WatchGuard
  • 43.
  • 44.
    Upcoming training onMay 3rd Understanding firewall policies and their effectiveness in defending against network threats. During this training, you'll learn about: • Firewall policies. • Optimizing firewall policies. • Policy classification reports.
  • 45.
  • 46.
    Question 1 Live syslogviewer & Wireshark shows syslogs but device not added. How to fix this? • Windows Firewall might be enabled. • Un-supported logs received. • Time-stamp may not be enabled in case of Cisco Supported device, but log-format may be changed in version specific vendor device.
  • 47.
    Question 2 How toget bandwidth usage reports for specific sub-net (OR) user based bandwidth? Add a report filter with CIDR/User specific and create a New-Report Profile to achieve it.
  • 48.
    Question 3 Why Trafficbytes are shown as 0 MB? How to see traffic transaction details less than MB? Bytes values shown in all reports are in MB. In case of low traffic value, it will be shown as 0 MB in Graphs &Tables. If you go to Raw-Search, you will get full conversation data with exact byte value received by application.
  • 49.
    Question 4 Where toview VPN user transaction details? VPN user specific intermittent traffic can be shown from Raw-Search, but normal VPN reports will not show theses details.
  • 50.
    Question 5 VPN userspecific session start and end time can be tracked? Yes, "VPN User Session Time Report" listed in Report-Profile addition will satisfy this need.
  • 51.
    Question 6 Unable tosee the Application/Virus reports report for Cisco devices in the product(Firewall Analyzer) Web-UI? Syslog doesn't give application data, so FWA won't populate.
  • 52.
    Question 7 How toget user list for specific url access? URL value give in Raw-Search will provide required results.
  • 53.
    Question 8 How muchHDD is required to manage number of firewalls? HDD space occupancy completely depends on the number of logs received and Data storage options, based on the following settings HDD space will be allocated accordingly.
  • 54.