Downloaded 16 times
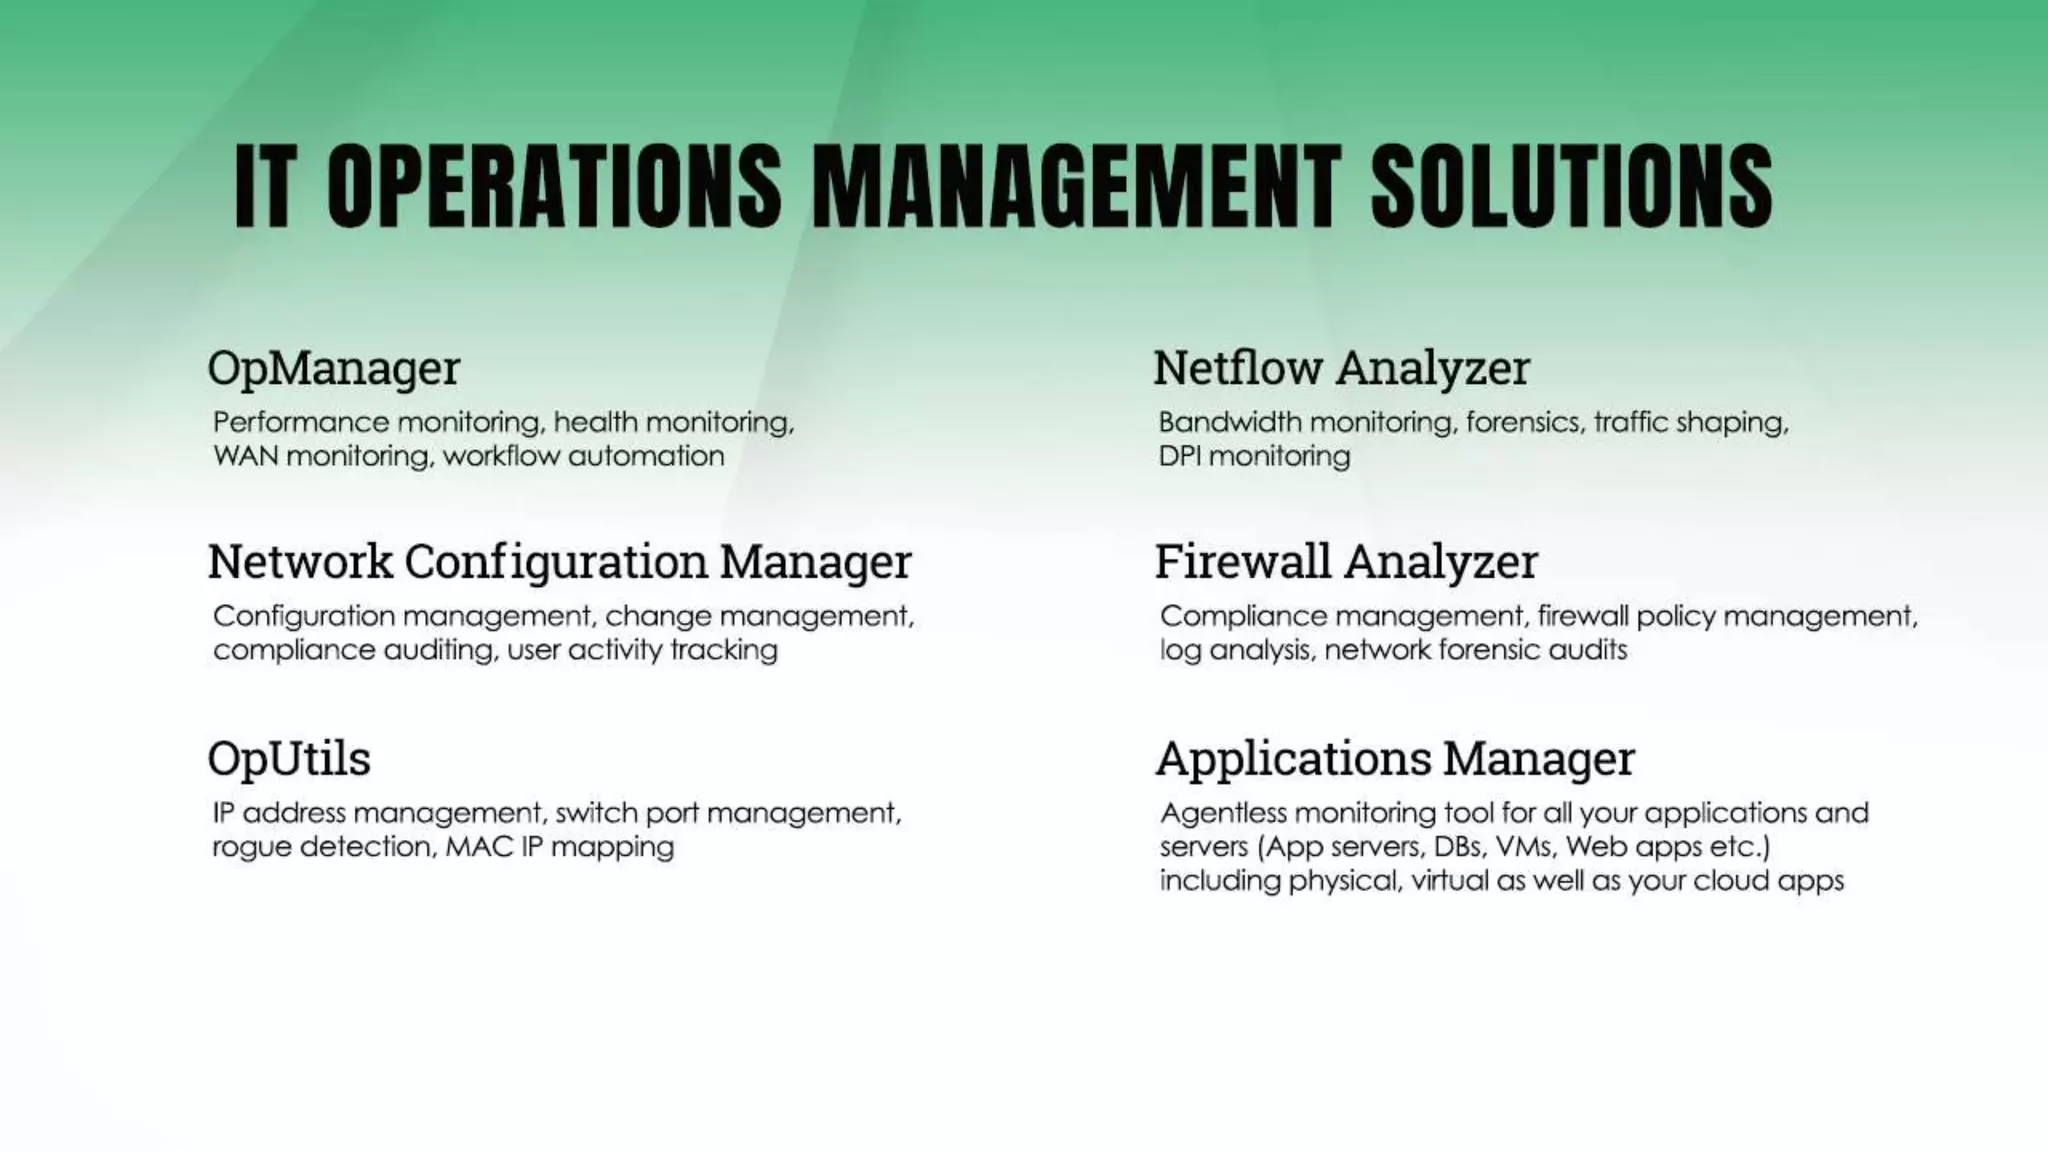


This document covers a free training session on monitoring network performance using OpManager, focusing on various aspects such as hardware sensors, SNMP monitors, WAN and VoIP links, and creating custom SNMP monitors. It provides details on monitoring specific devices like routers, switches, and firewalls, as well as performance analytics such as latency, jitter, and bandwidth usage. Additionally, it discusses configuring network maps and customizing dashboards for efficient network management.
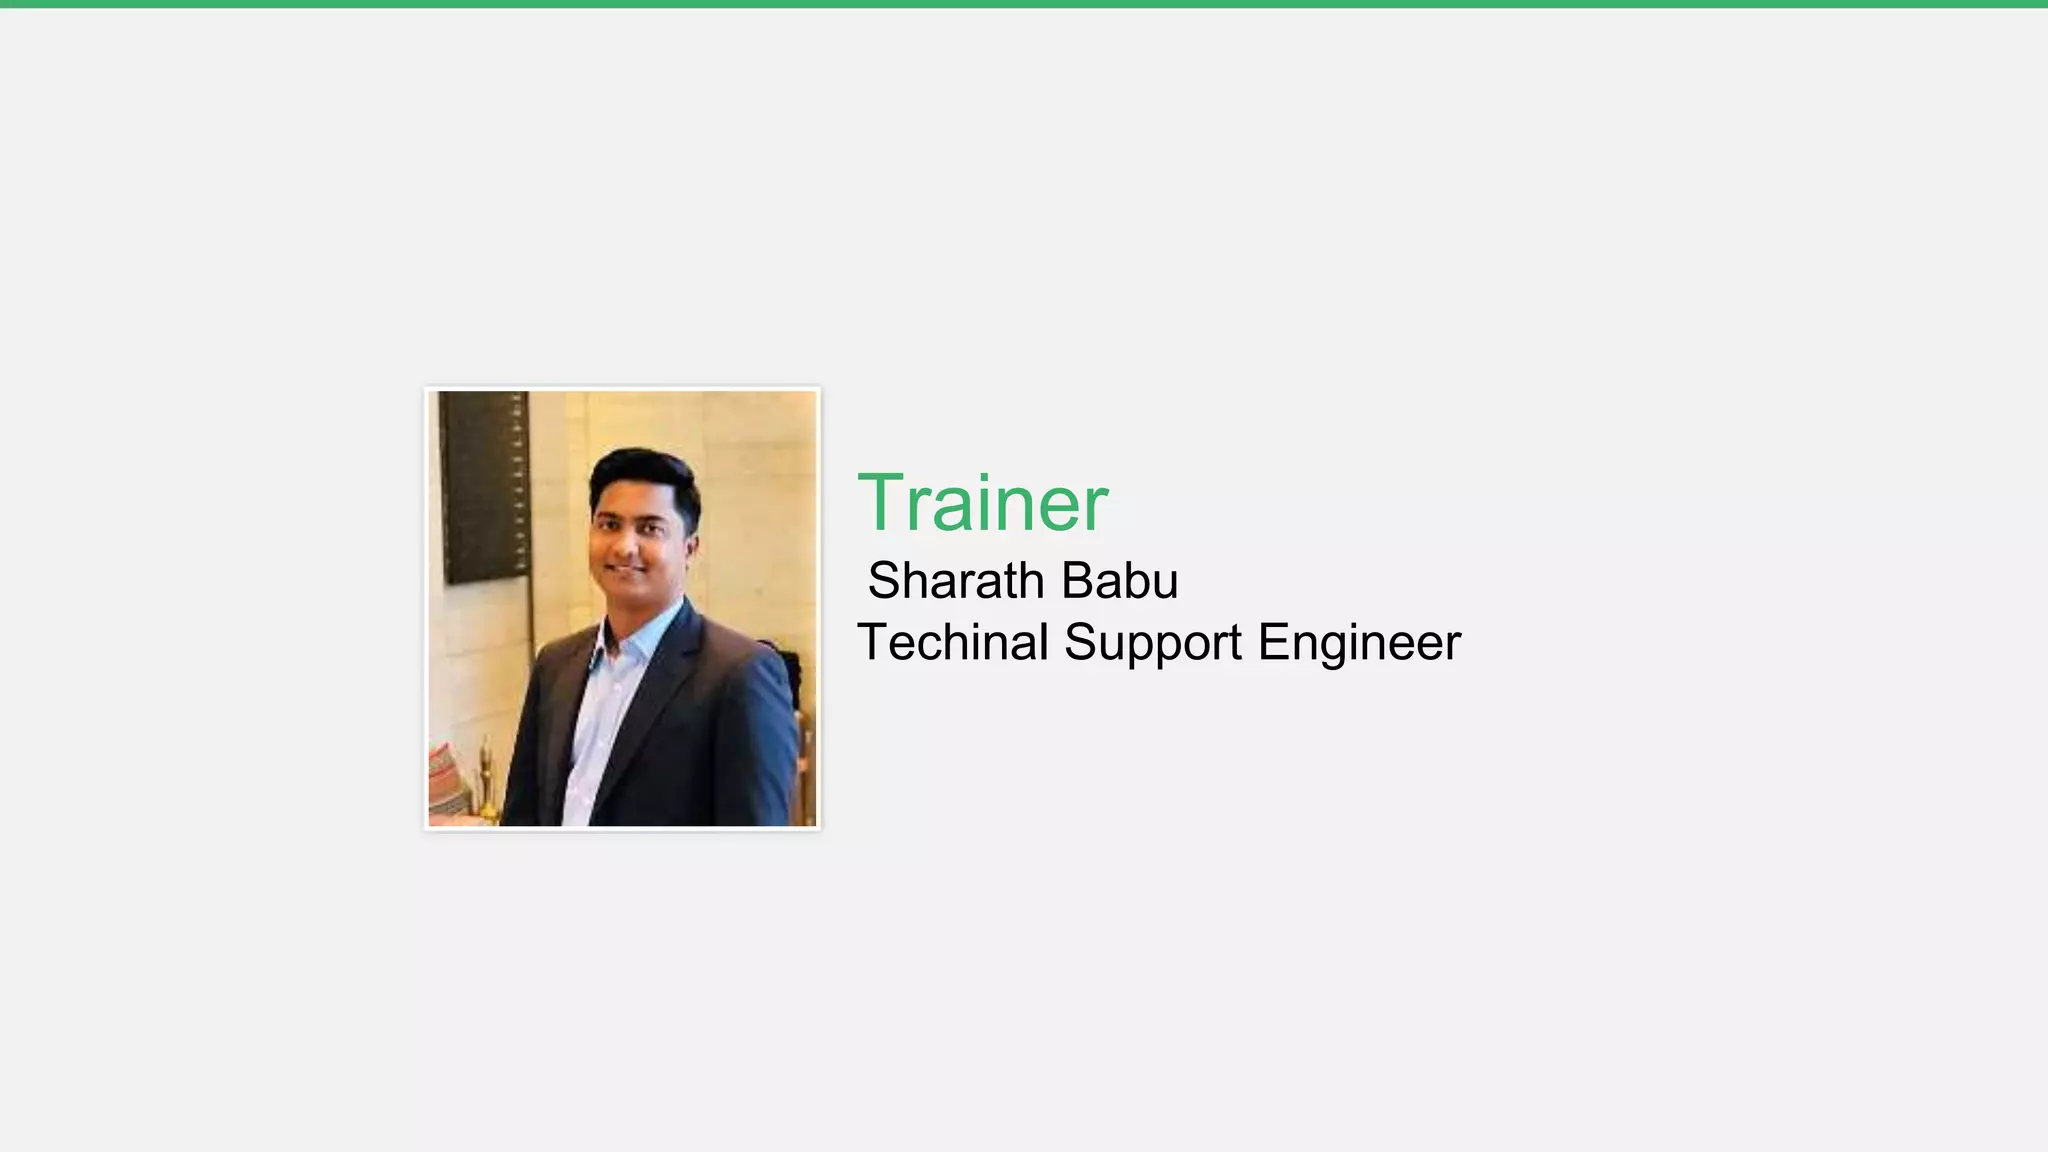
Welcome to a training session on OpManager led by Sharath Babu, Technical Support Engineer.
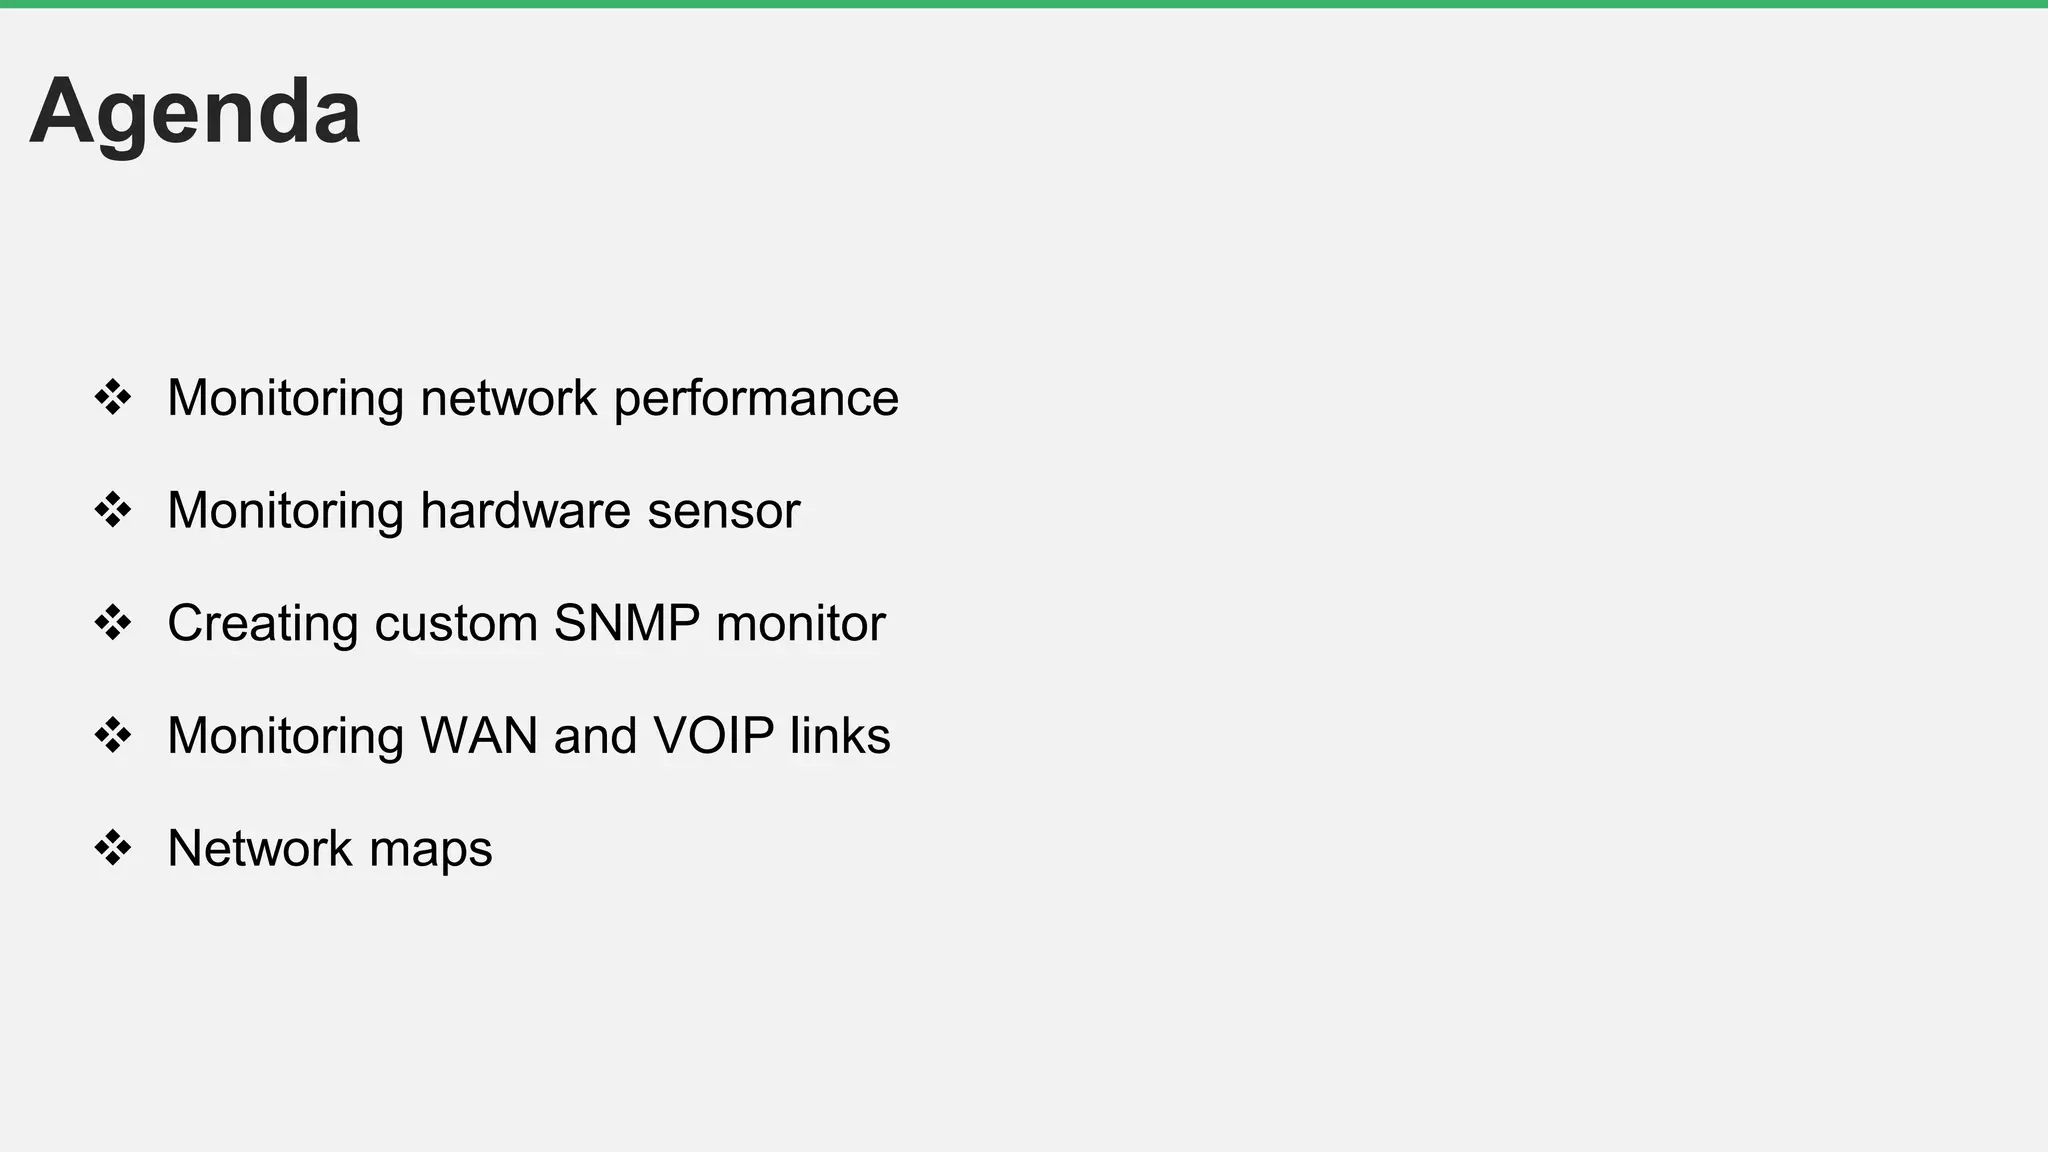
Topics include monitoring network performance, hardware sensors, custom SNMP monitoring, WAN, VOIP links, and network maps.
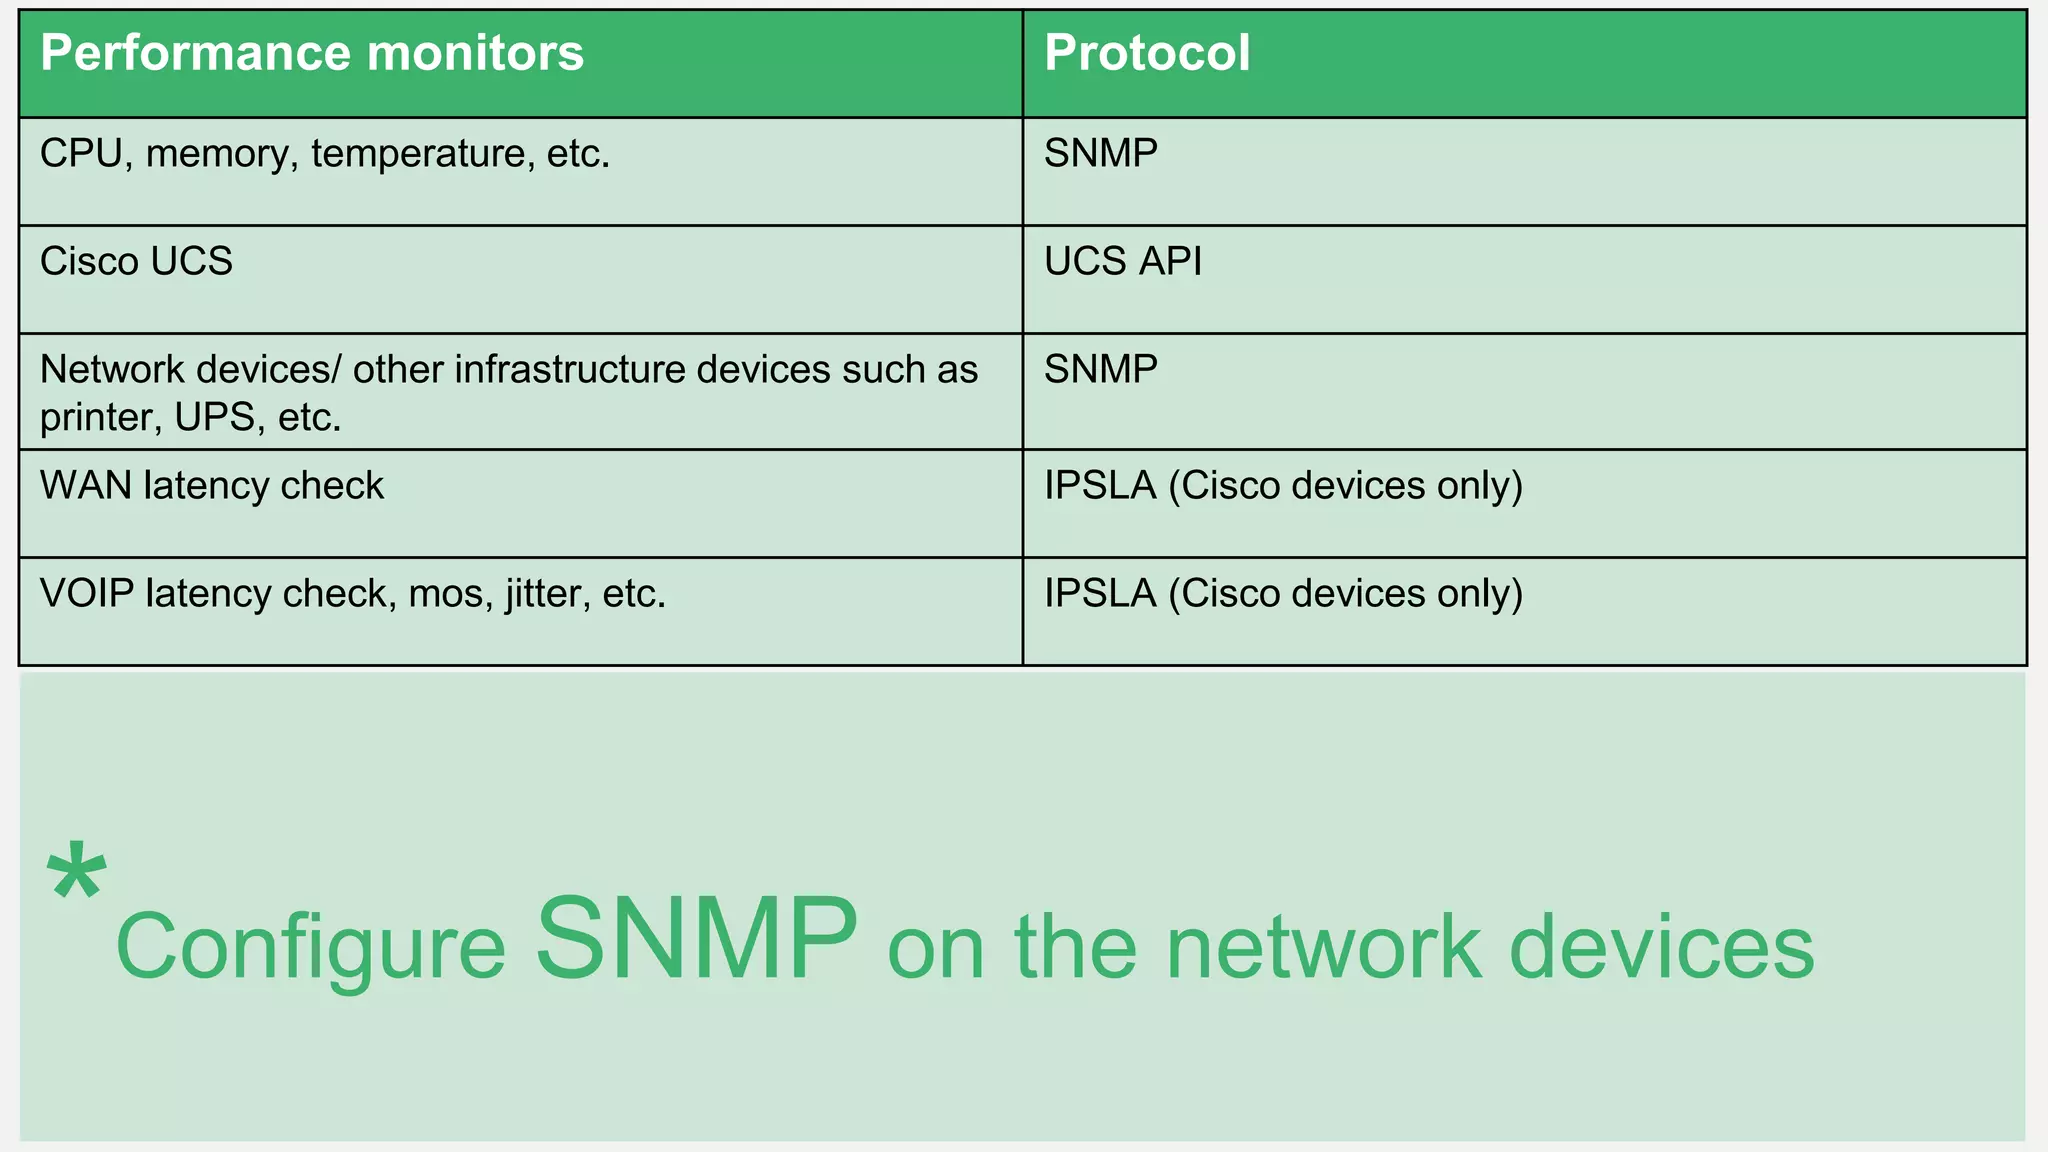
Monitoring protocols include CPU, memory, SNMP, IPSLA for Cisco devices, and the importance of configuring SNMP on network devices.
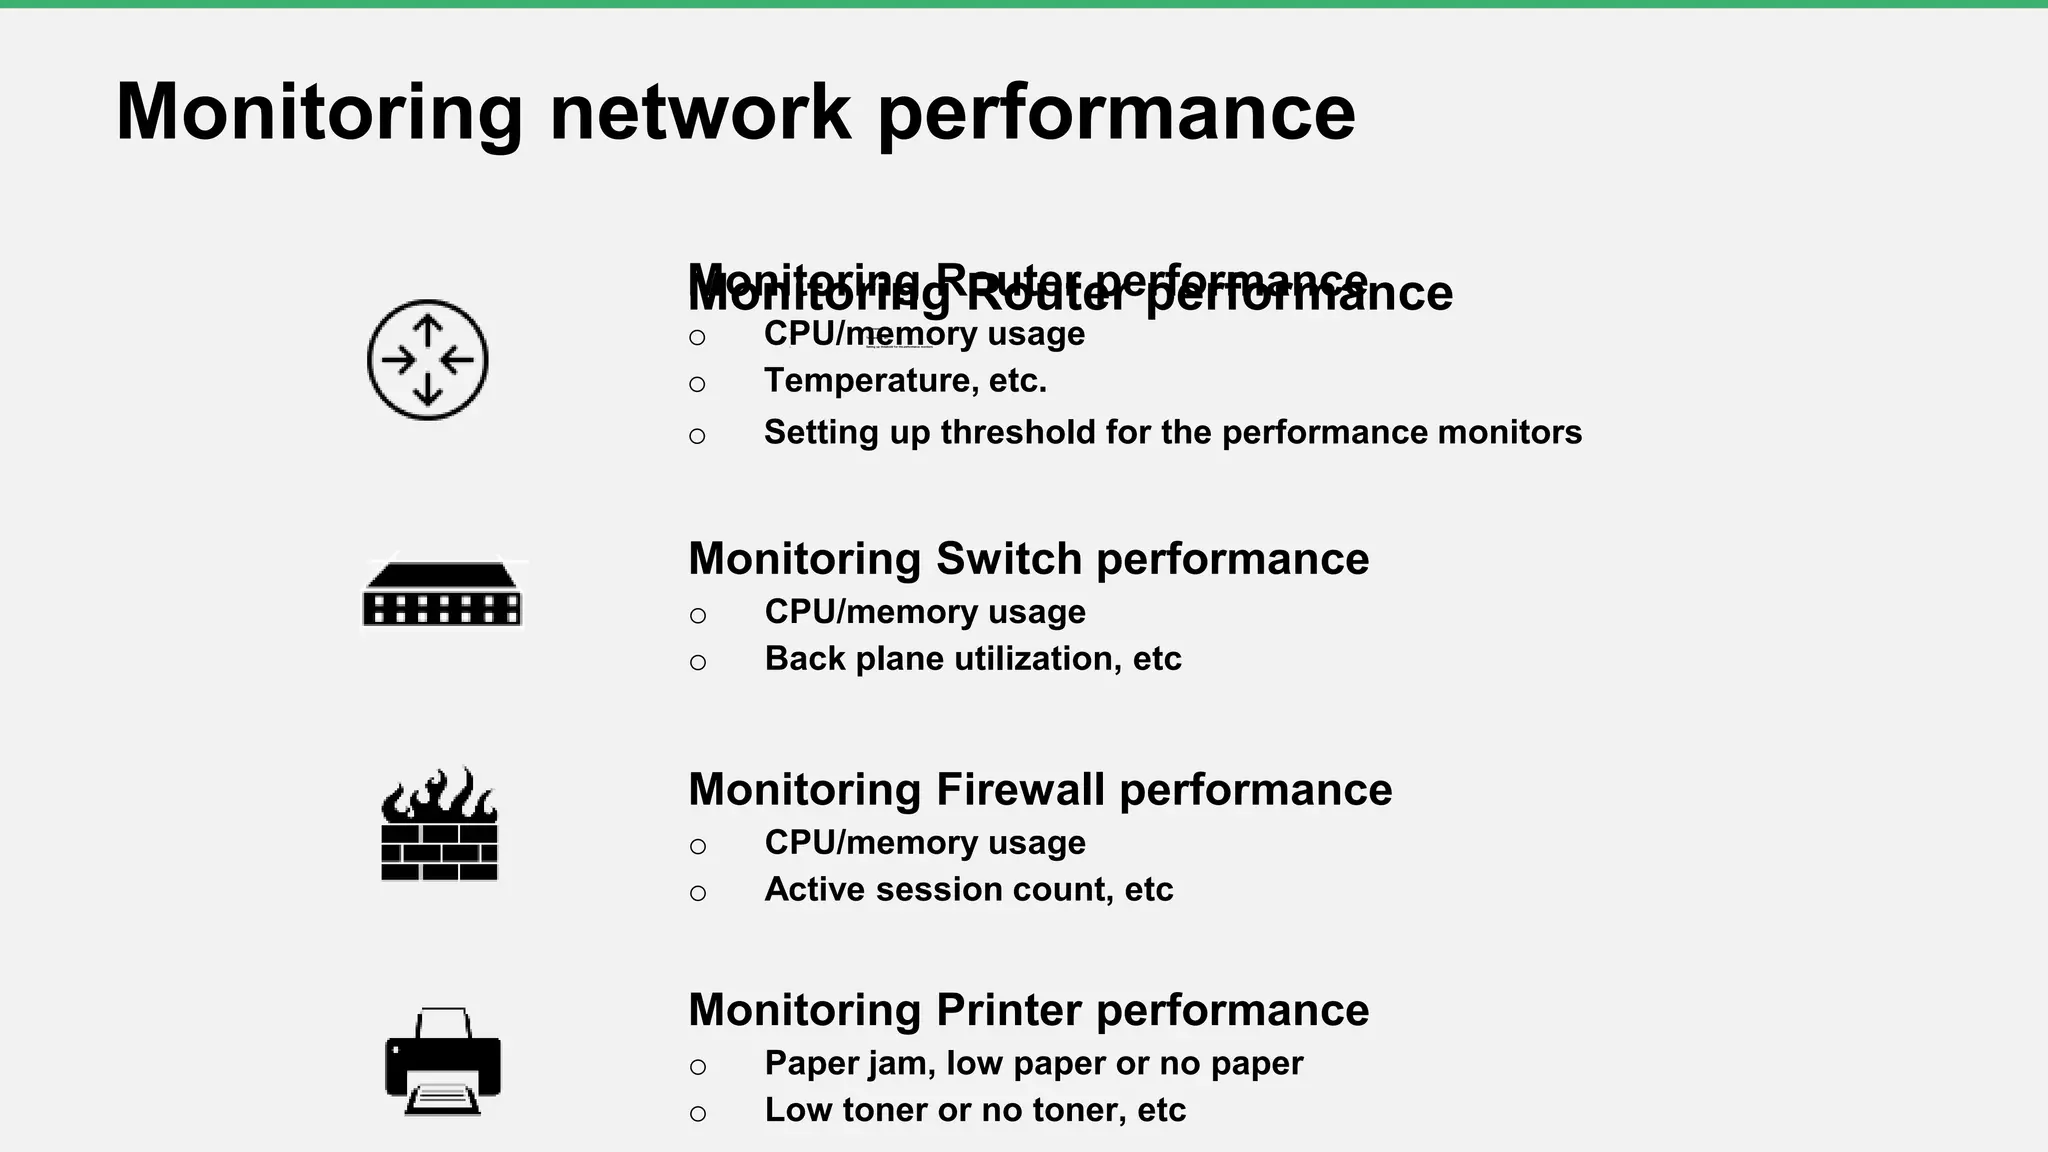
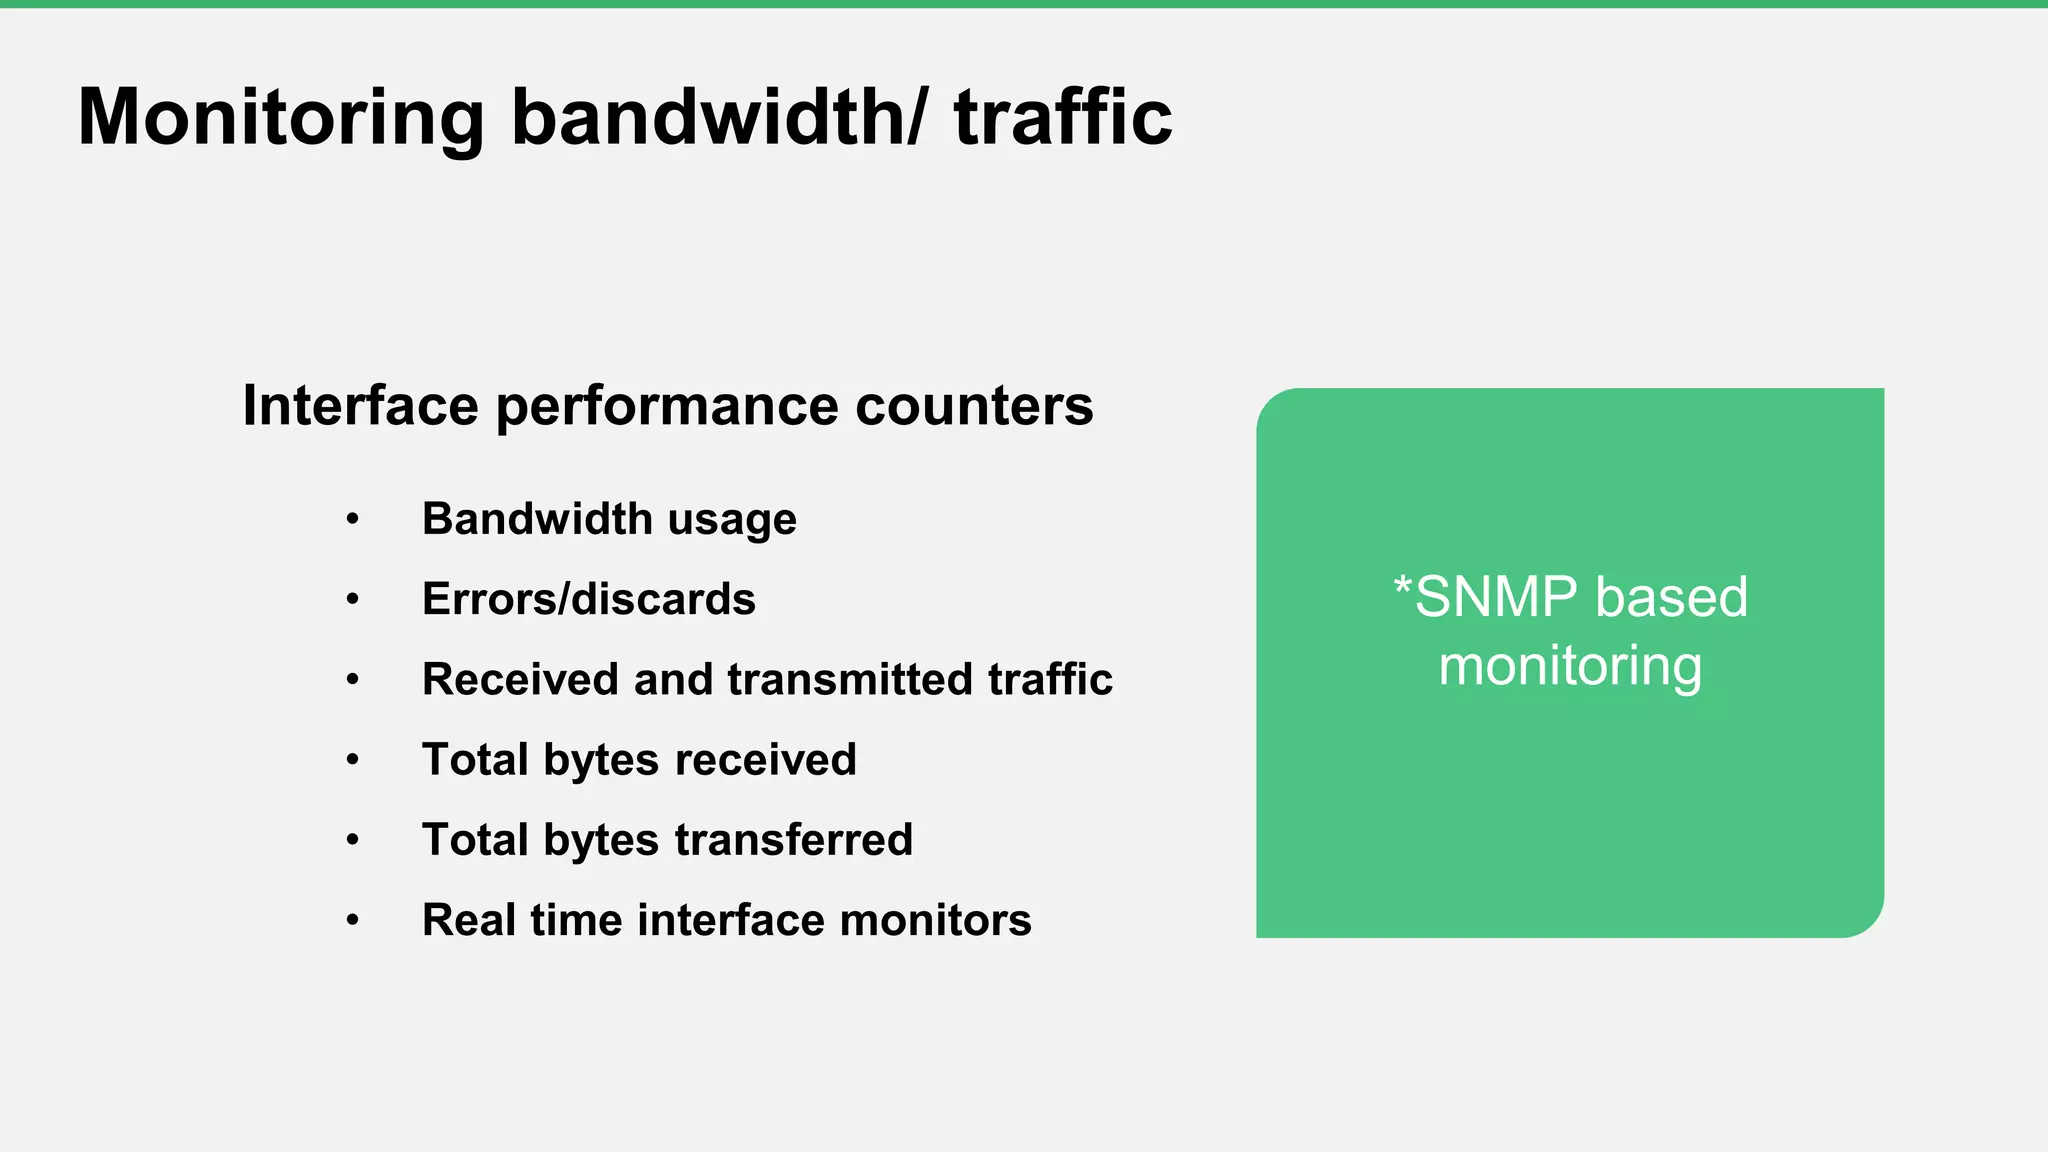
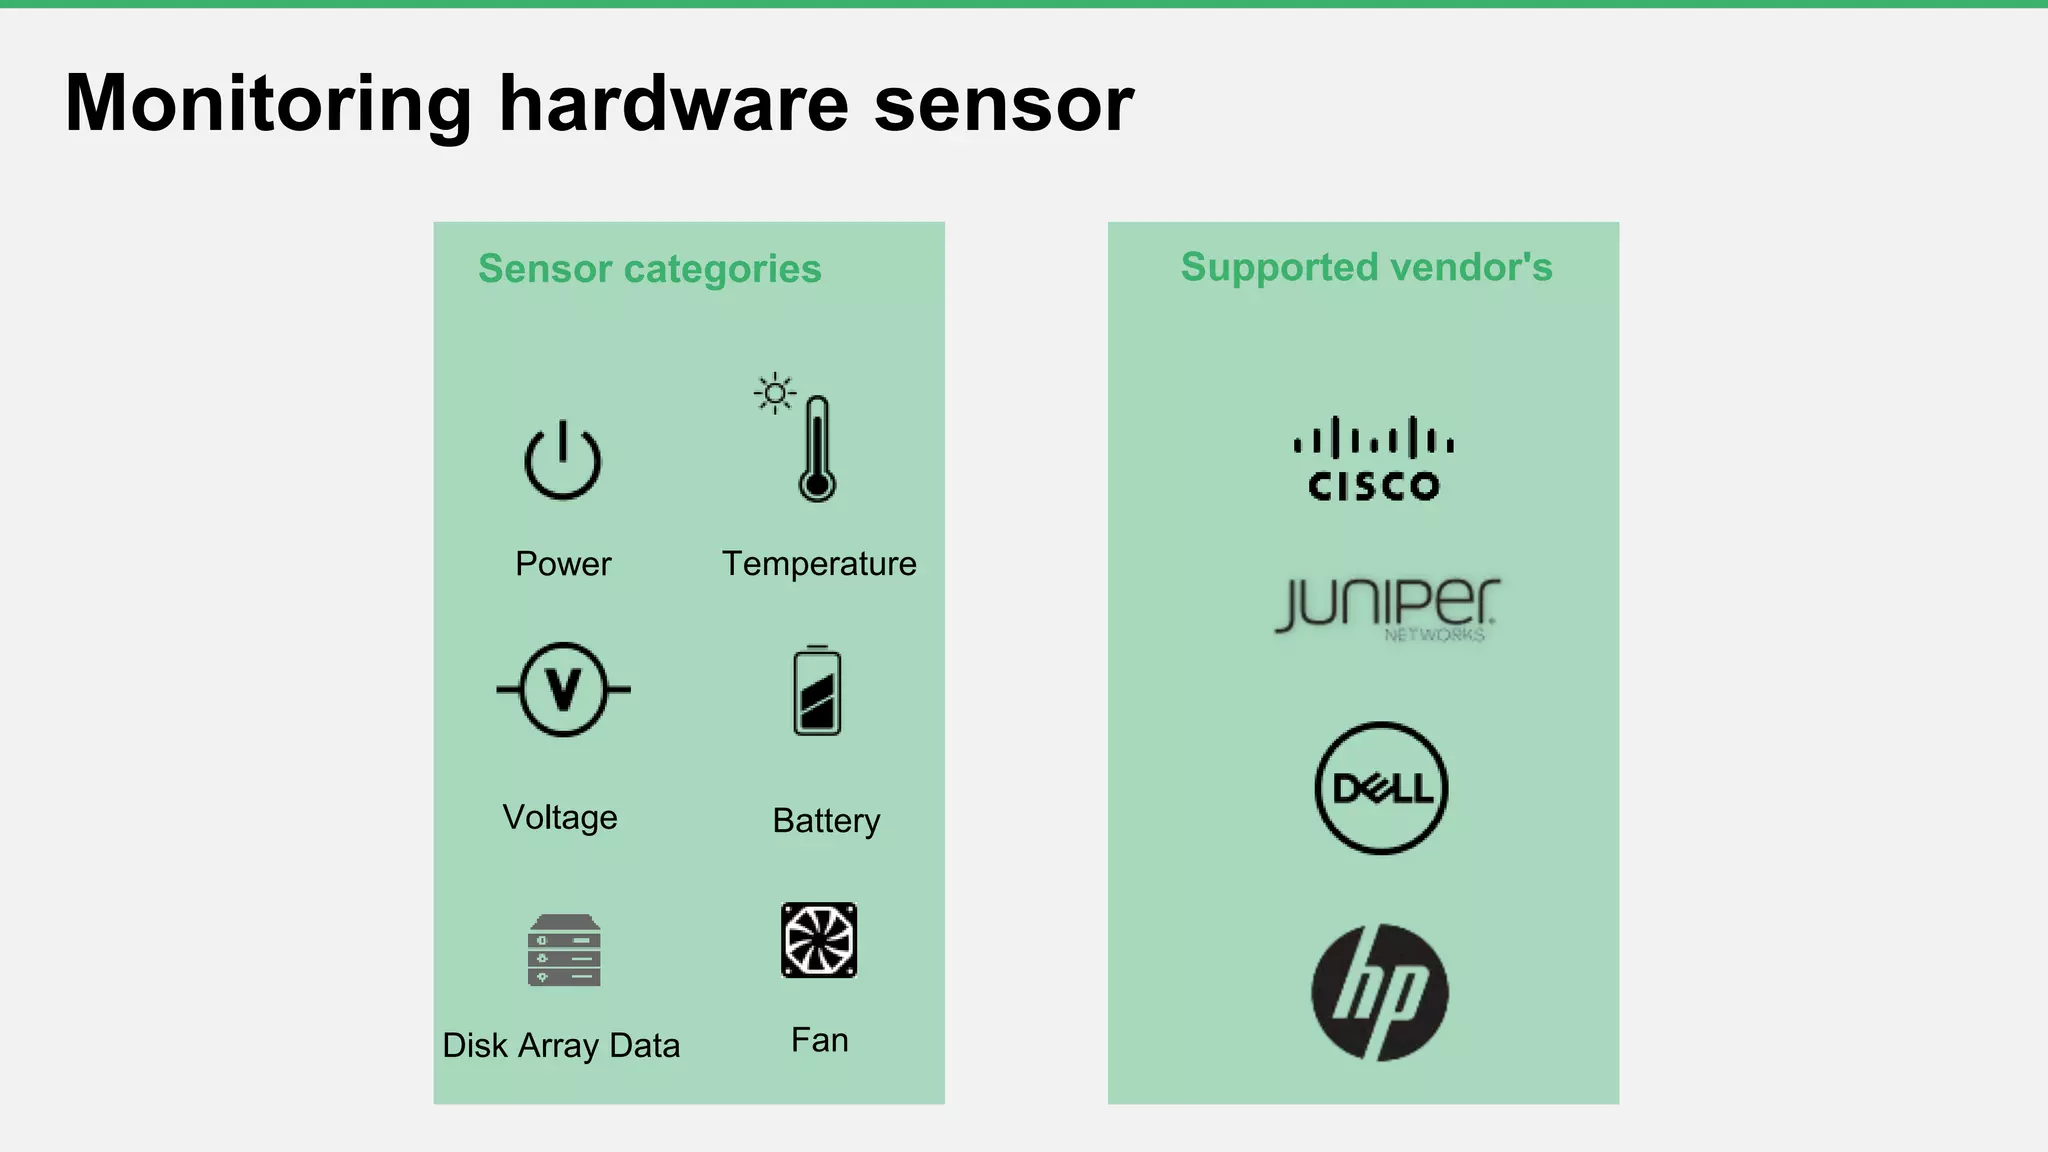
Monitoring specifics for routers, switches, firewalls, and printers; includes performance metrics like CPU/memory usage and hardware sensors.
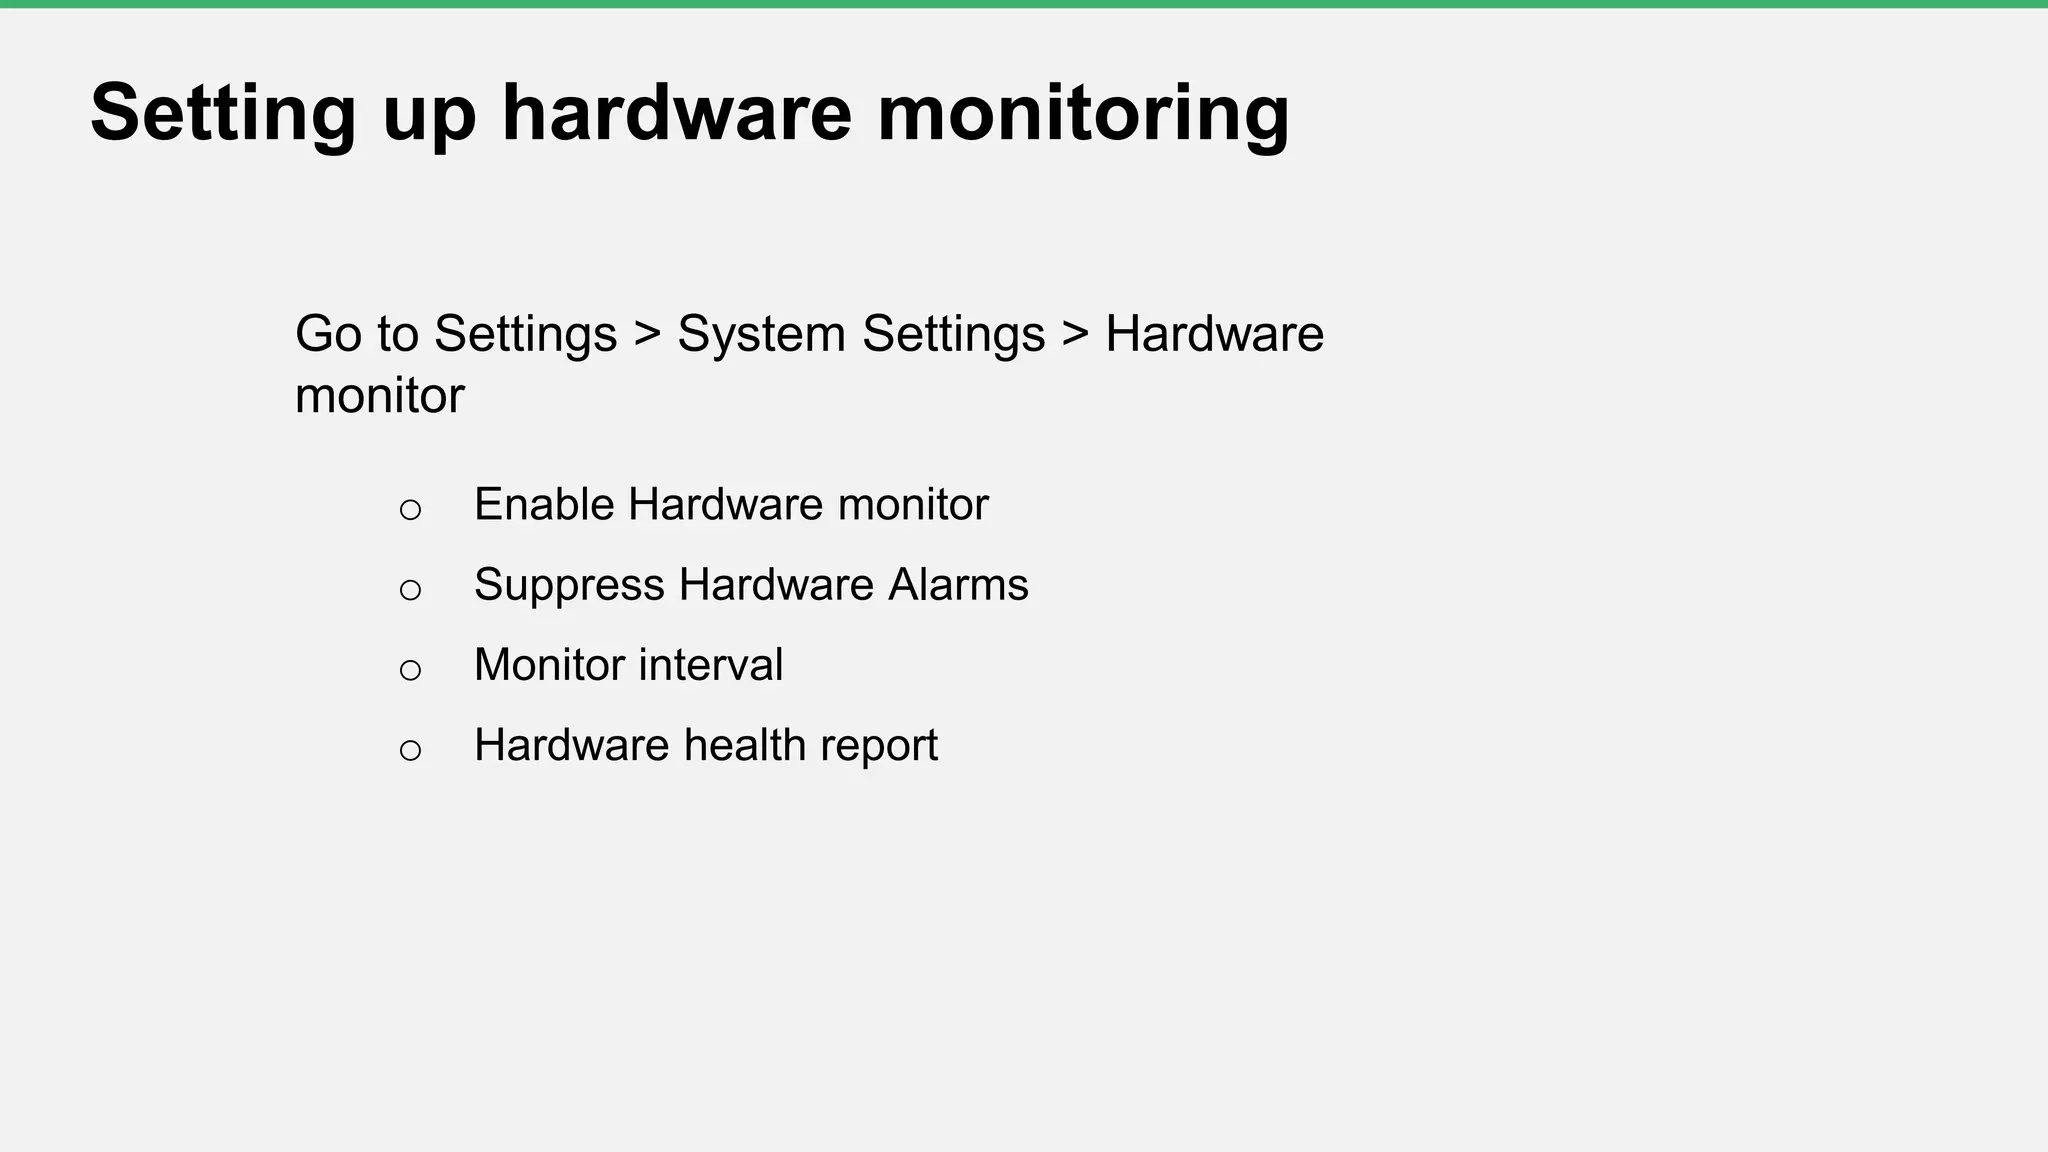
Instructions for enabling hardware monitoring, including settings for alarms and health reports.
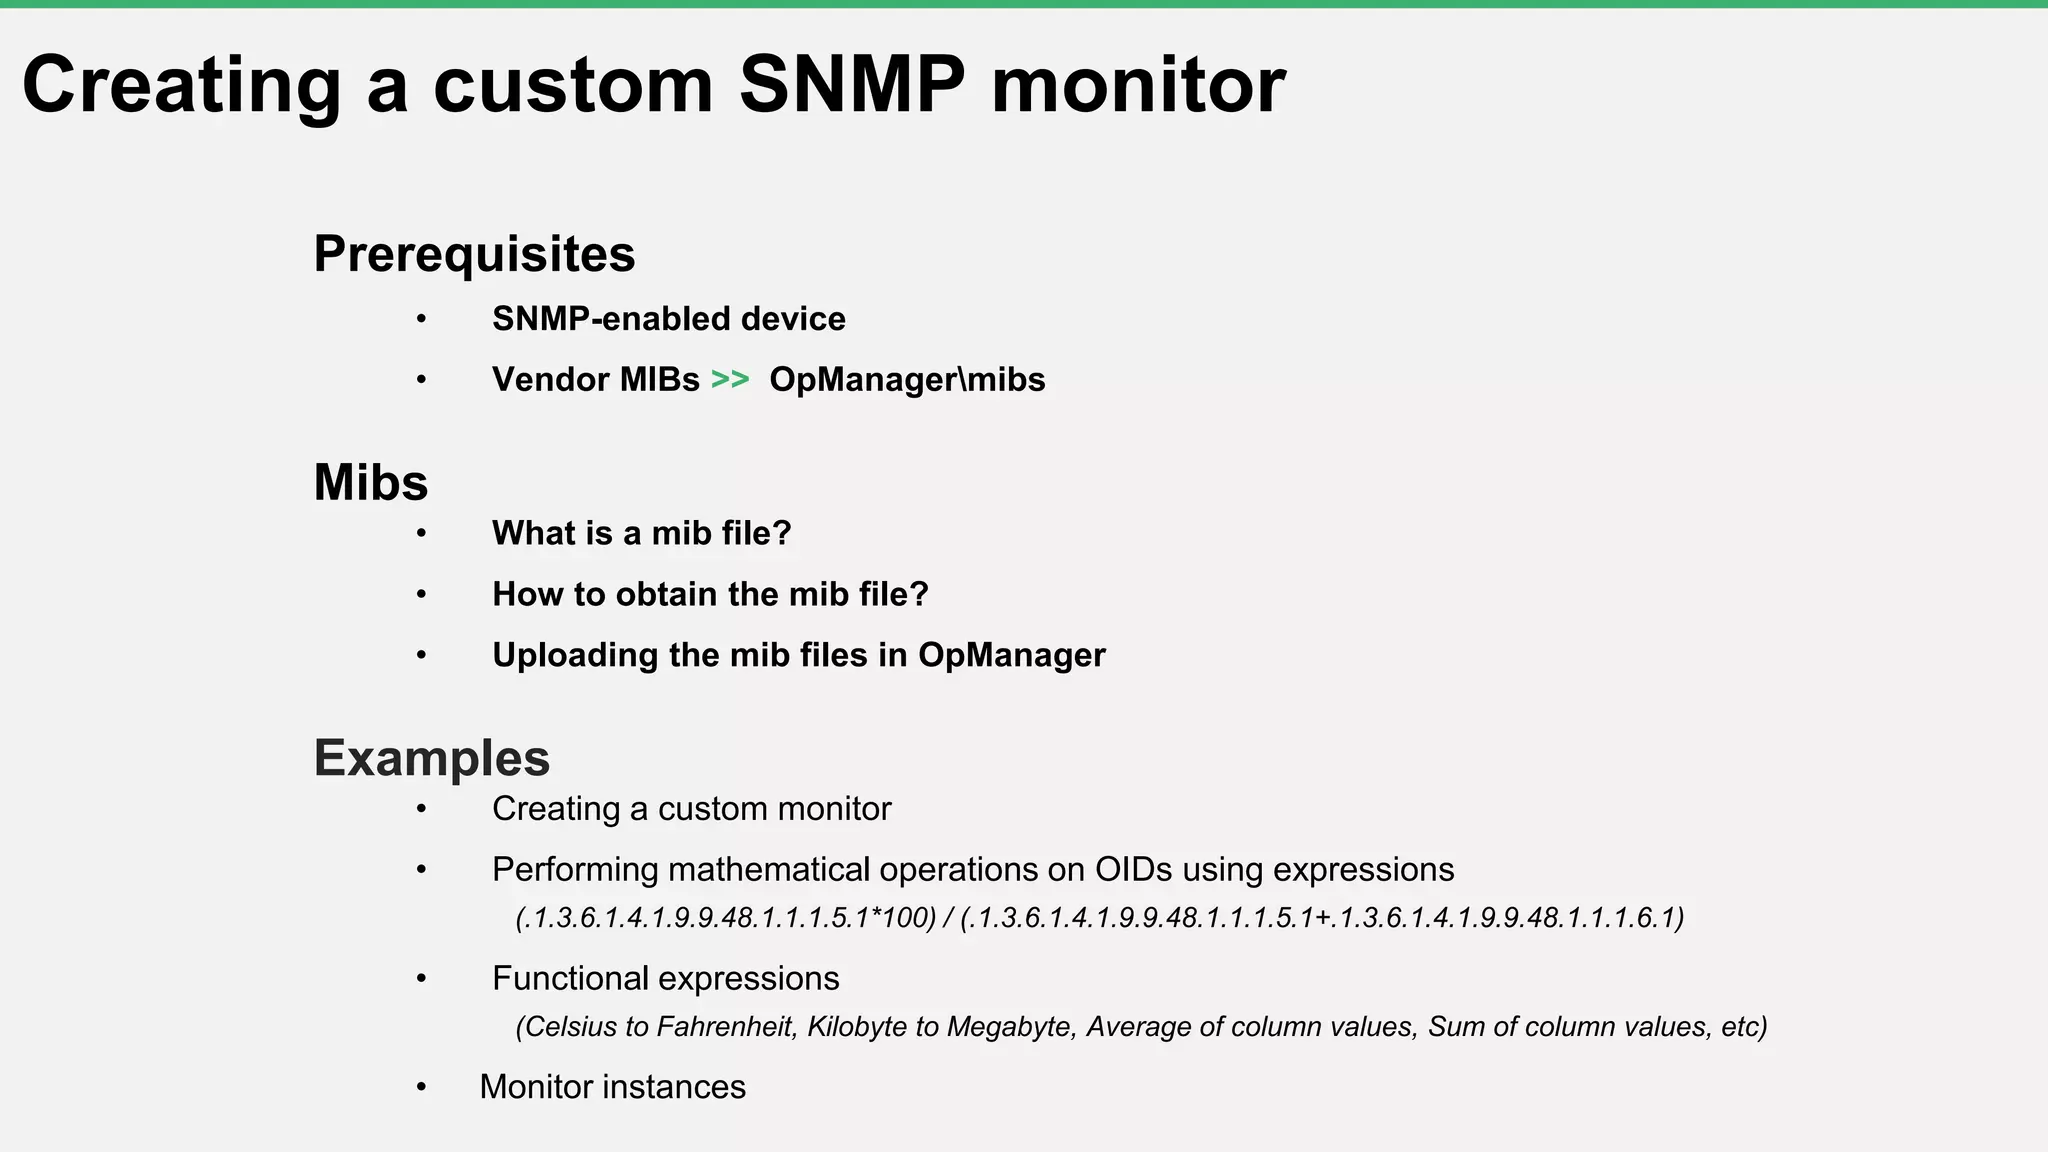
Steps to create a custom SNMP monitor, including prerequisites like SNMP-enabled devices and vendor MIBs.
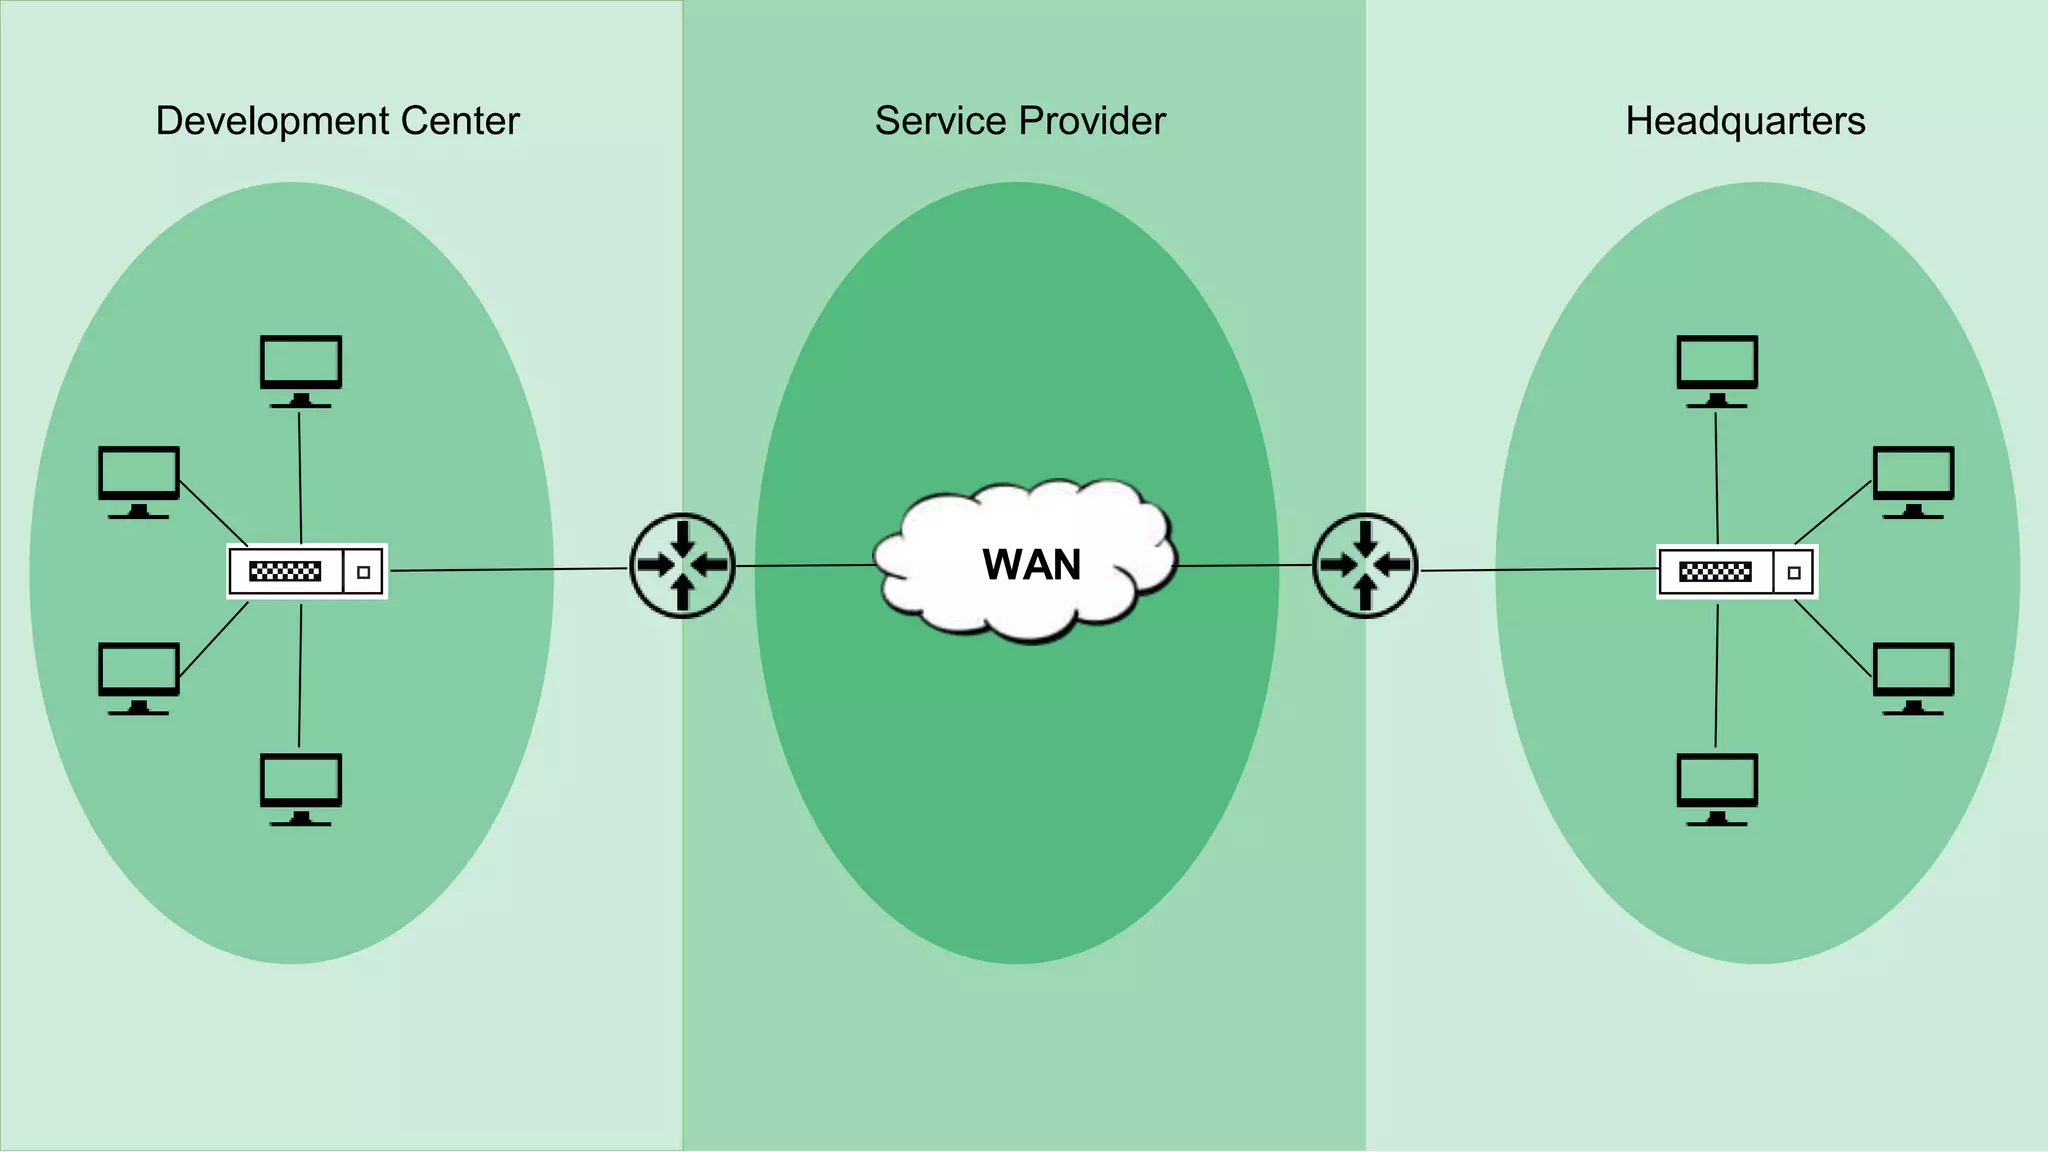
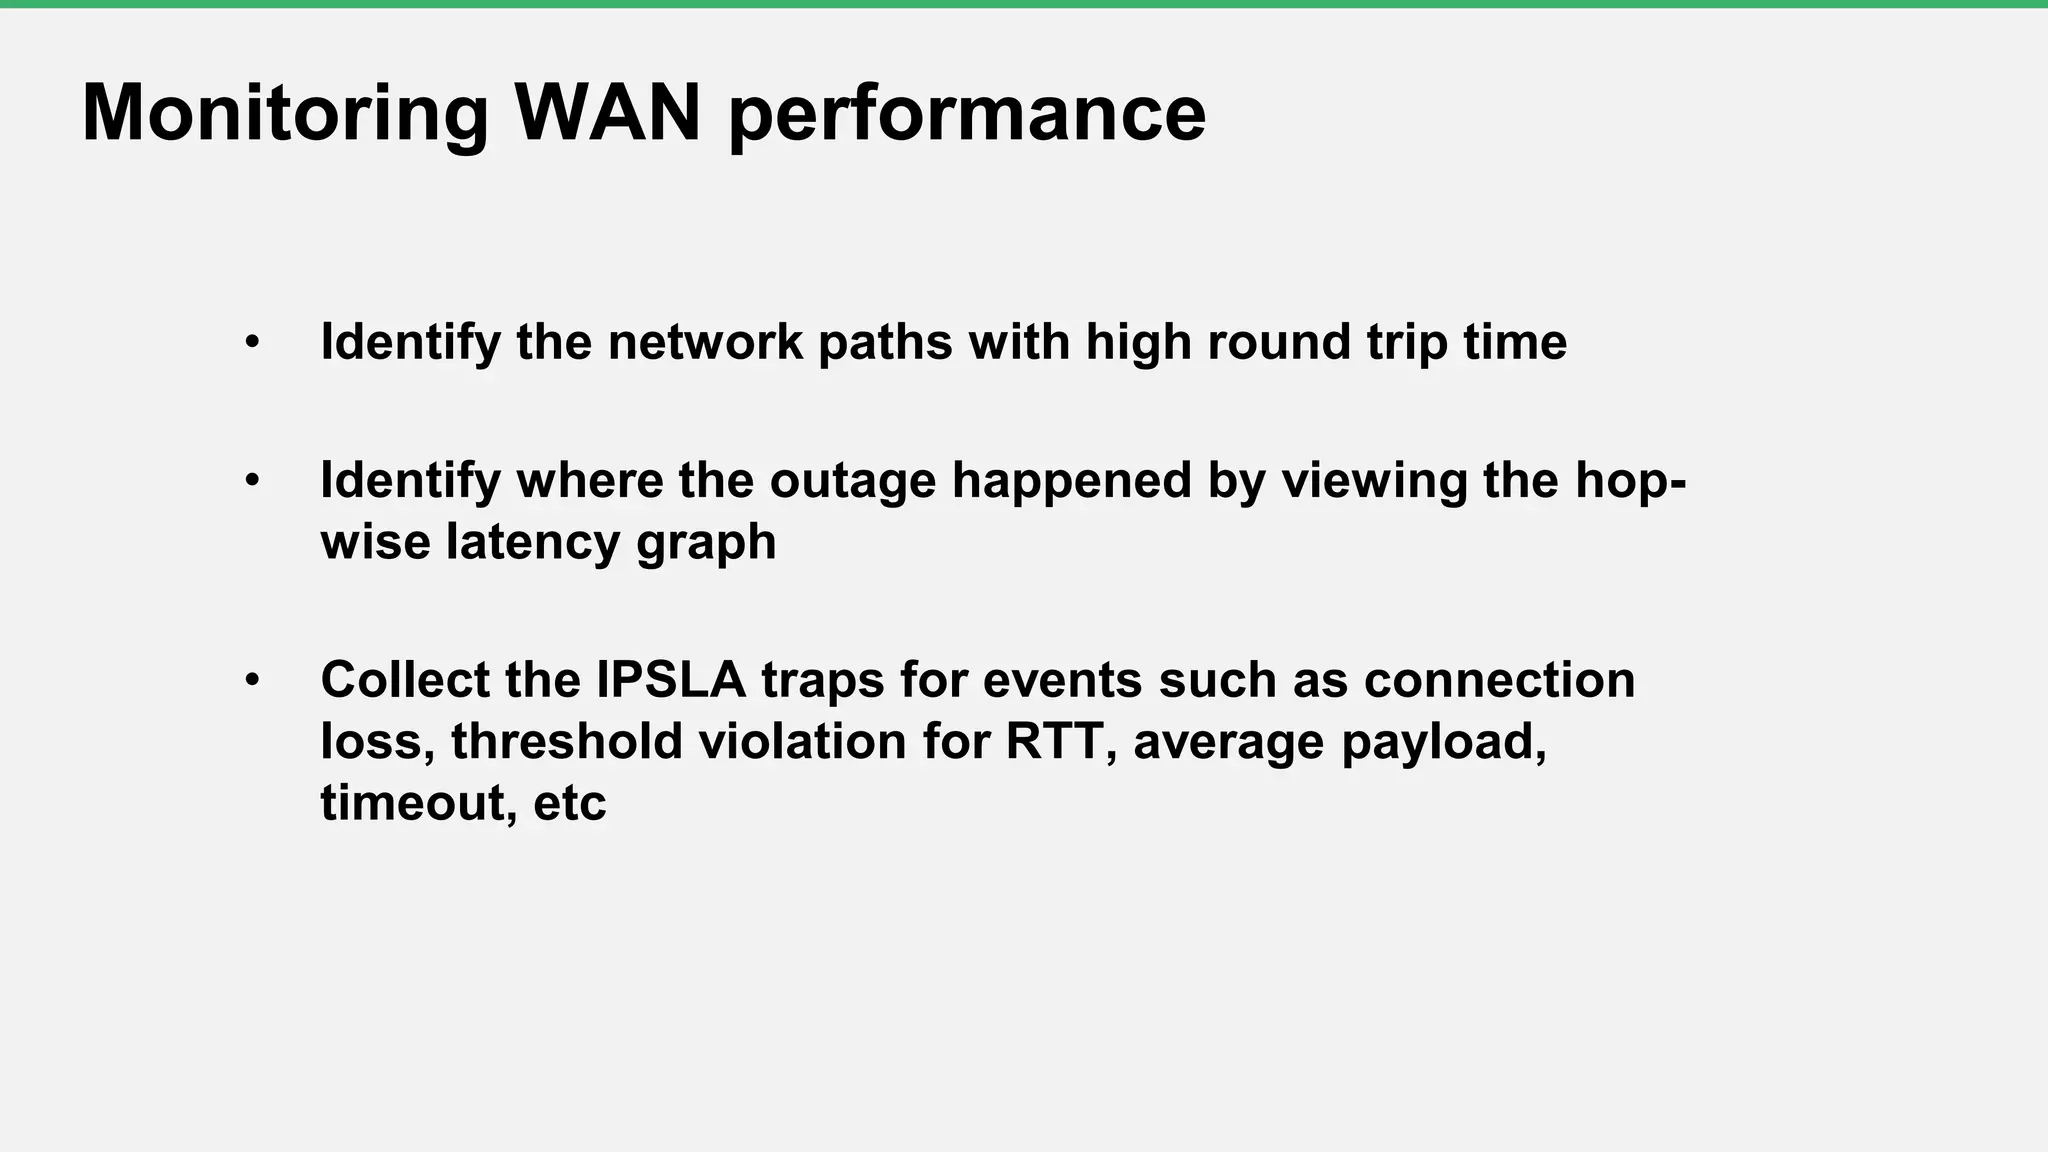
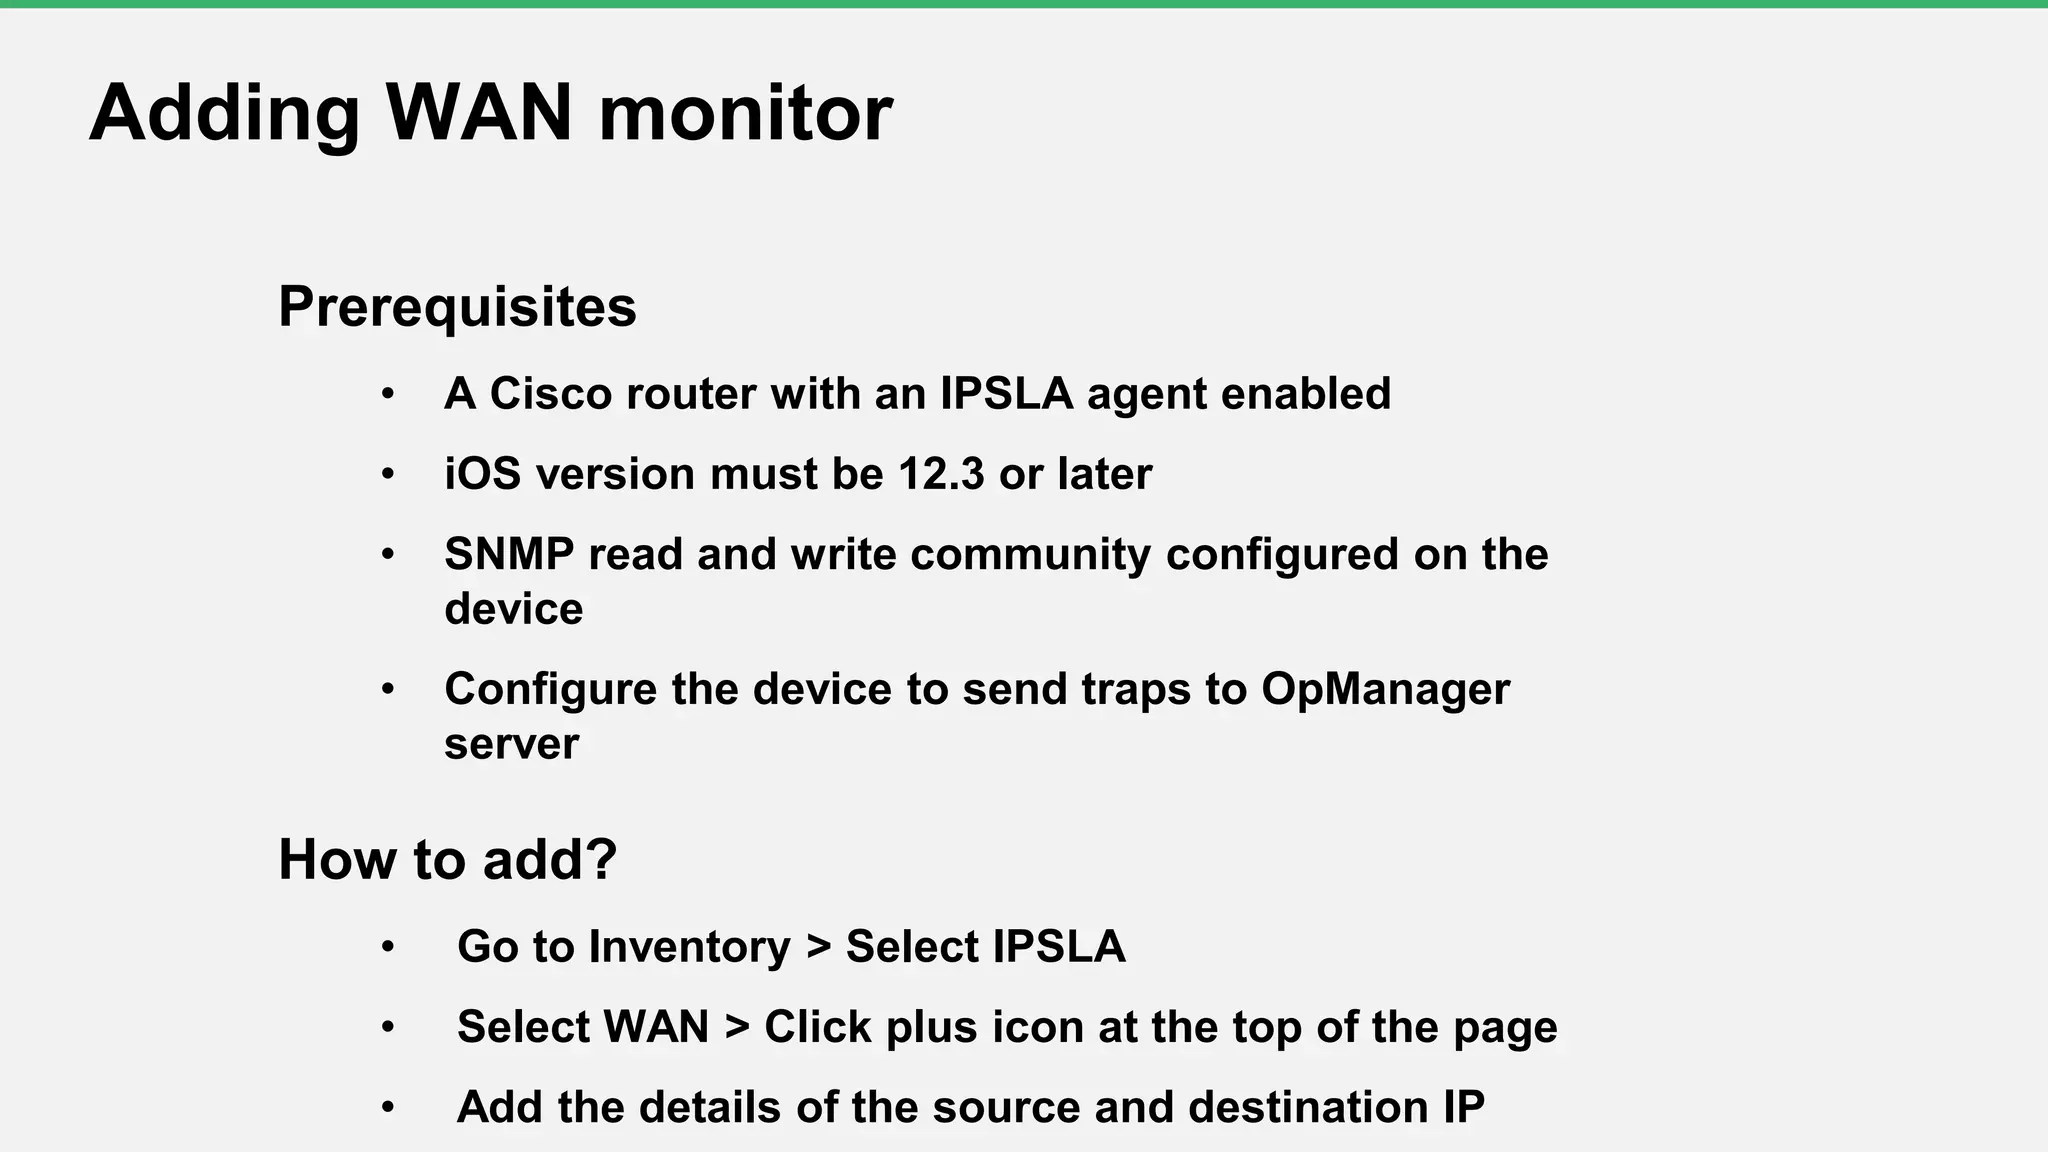
Identify network paths with outages, set up IPSLA for WAN monitoring, including necessary requirements.
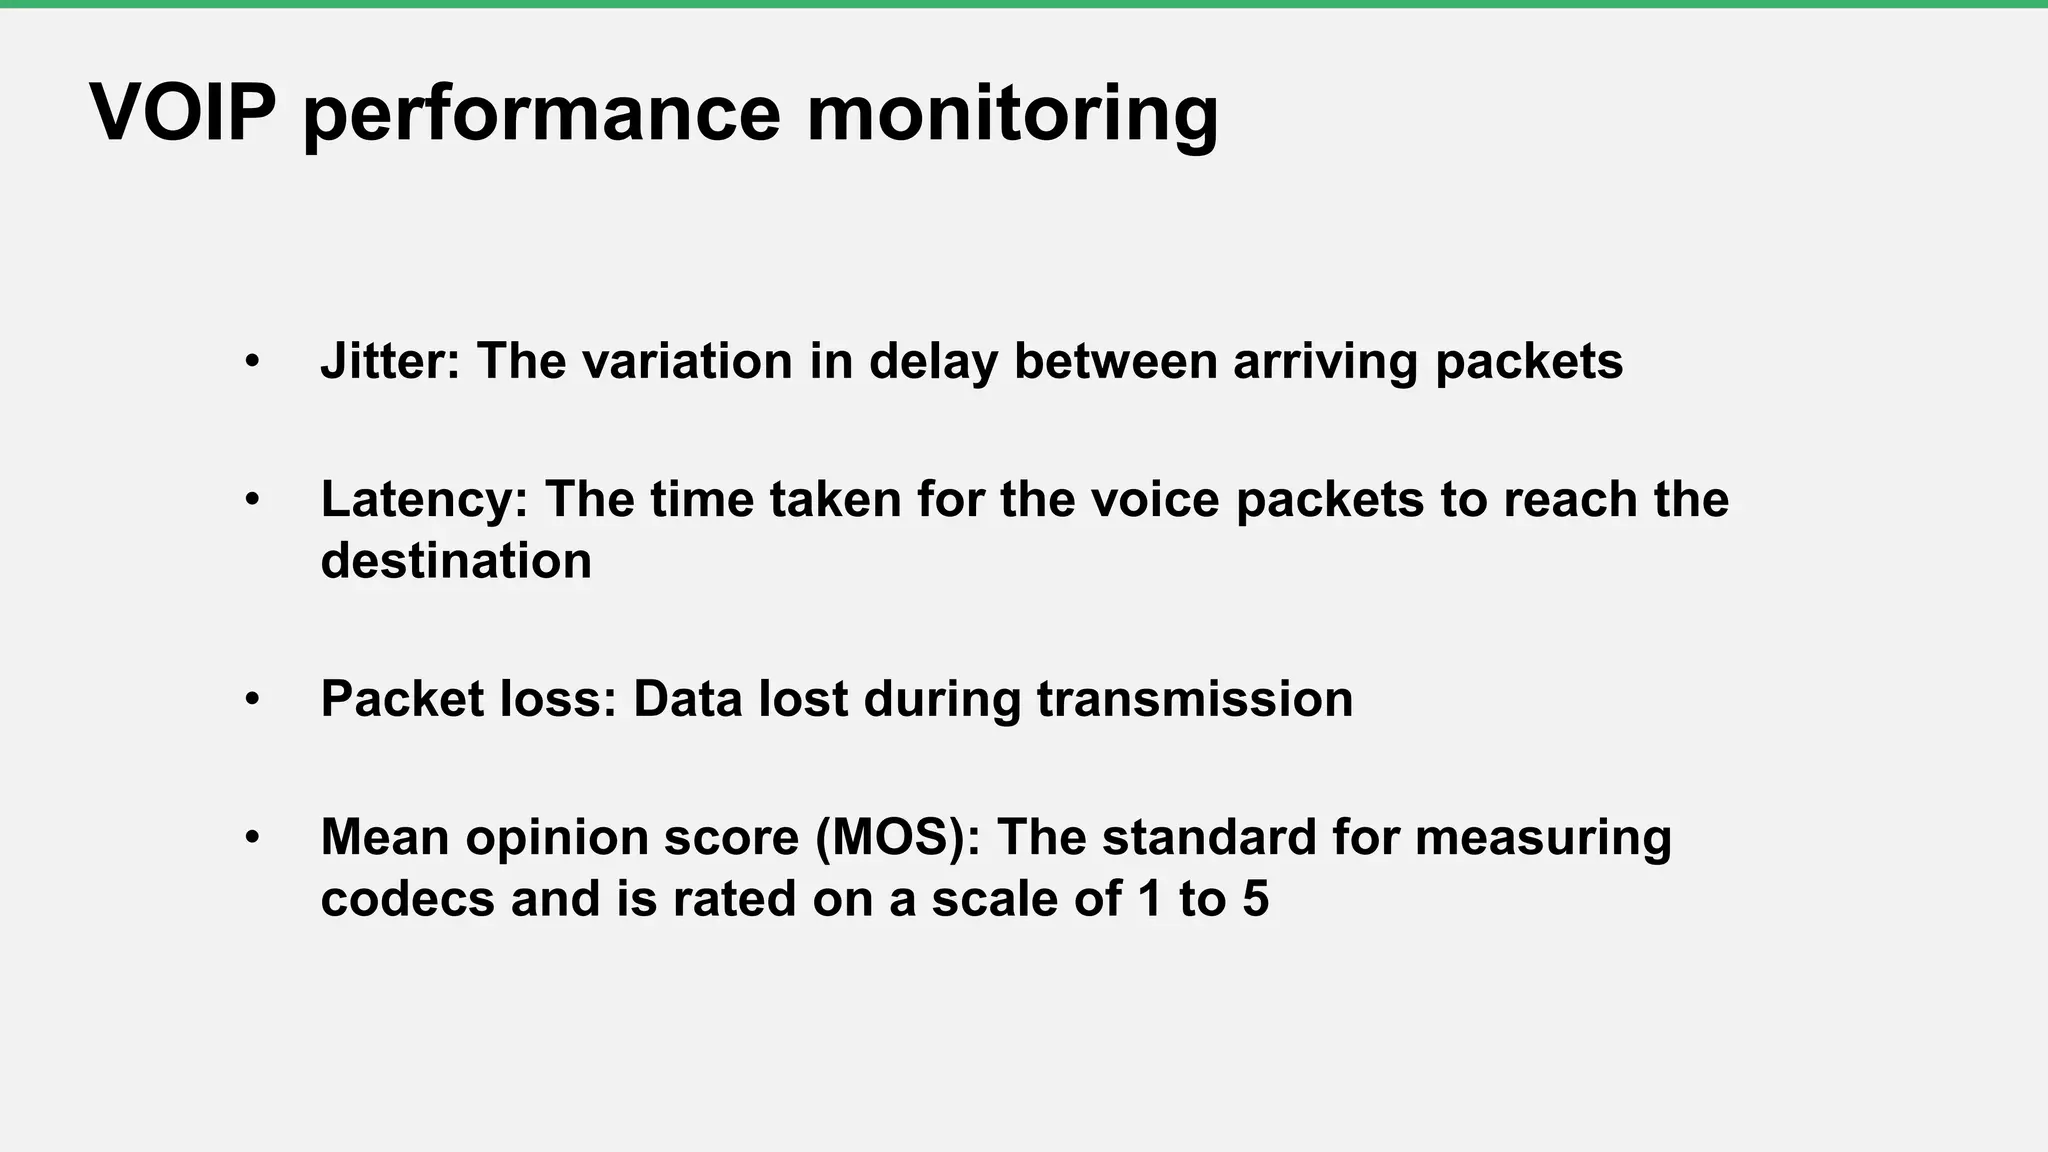
Key metrics for VOIP such as jitter, latency, packet loss, and the Mean Opinion Score (MOS) for quality evaluation.
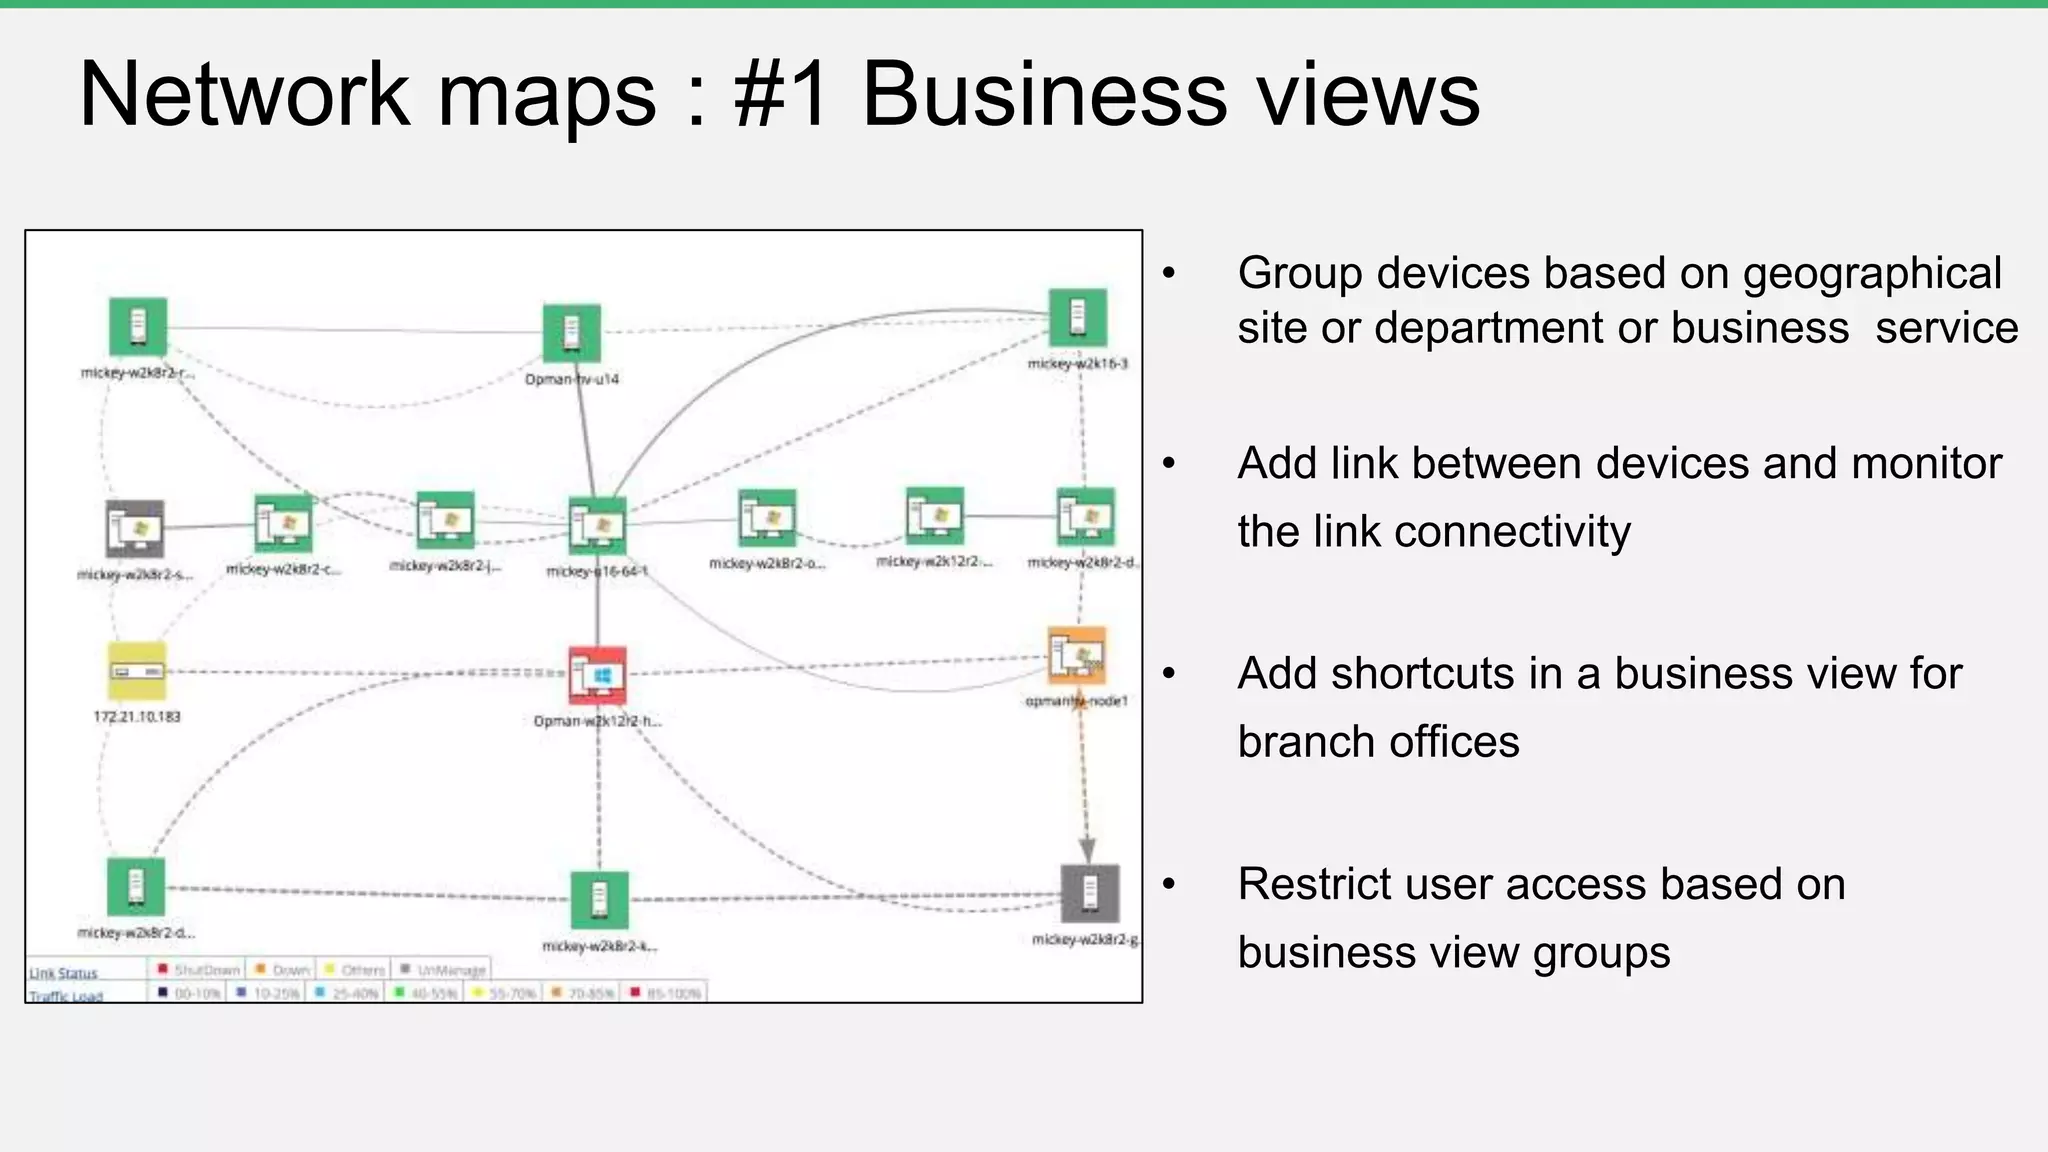
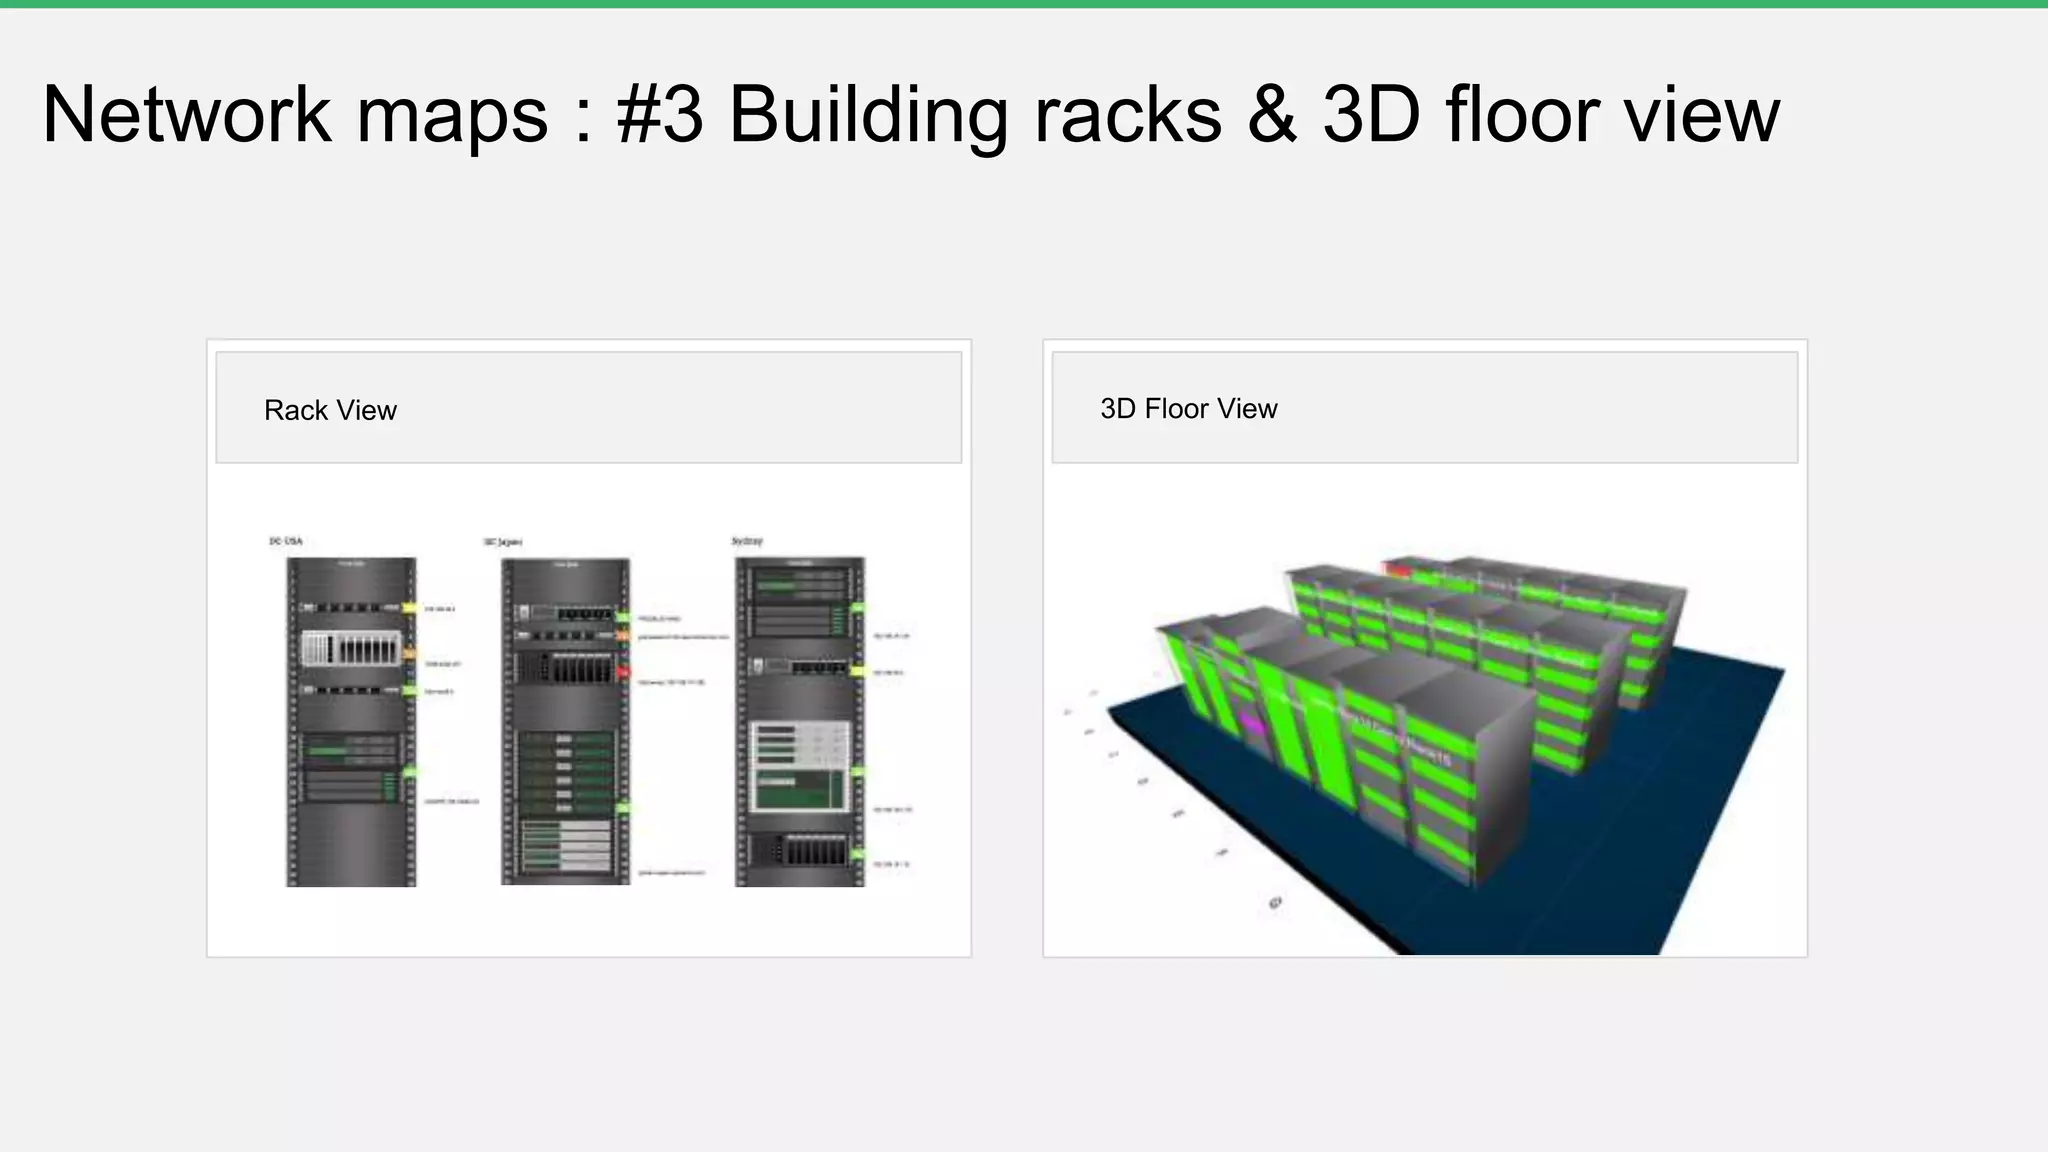
Creating network maps to visualize devices based on geographic or departmental groupings, including 3D visualization.
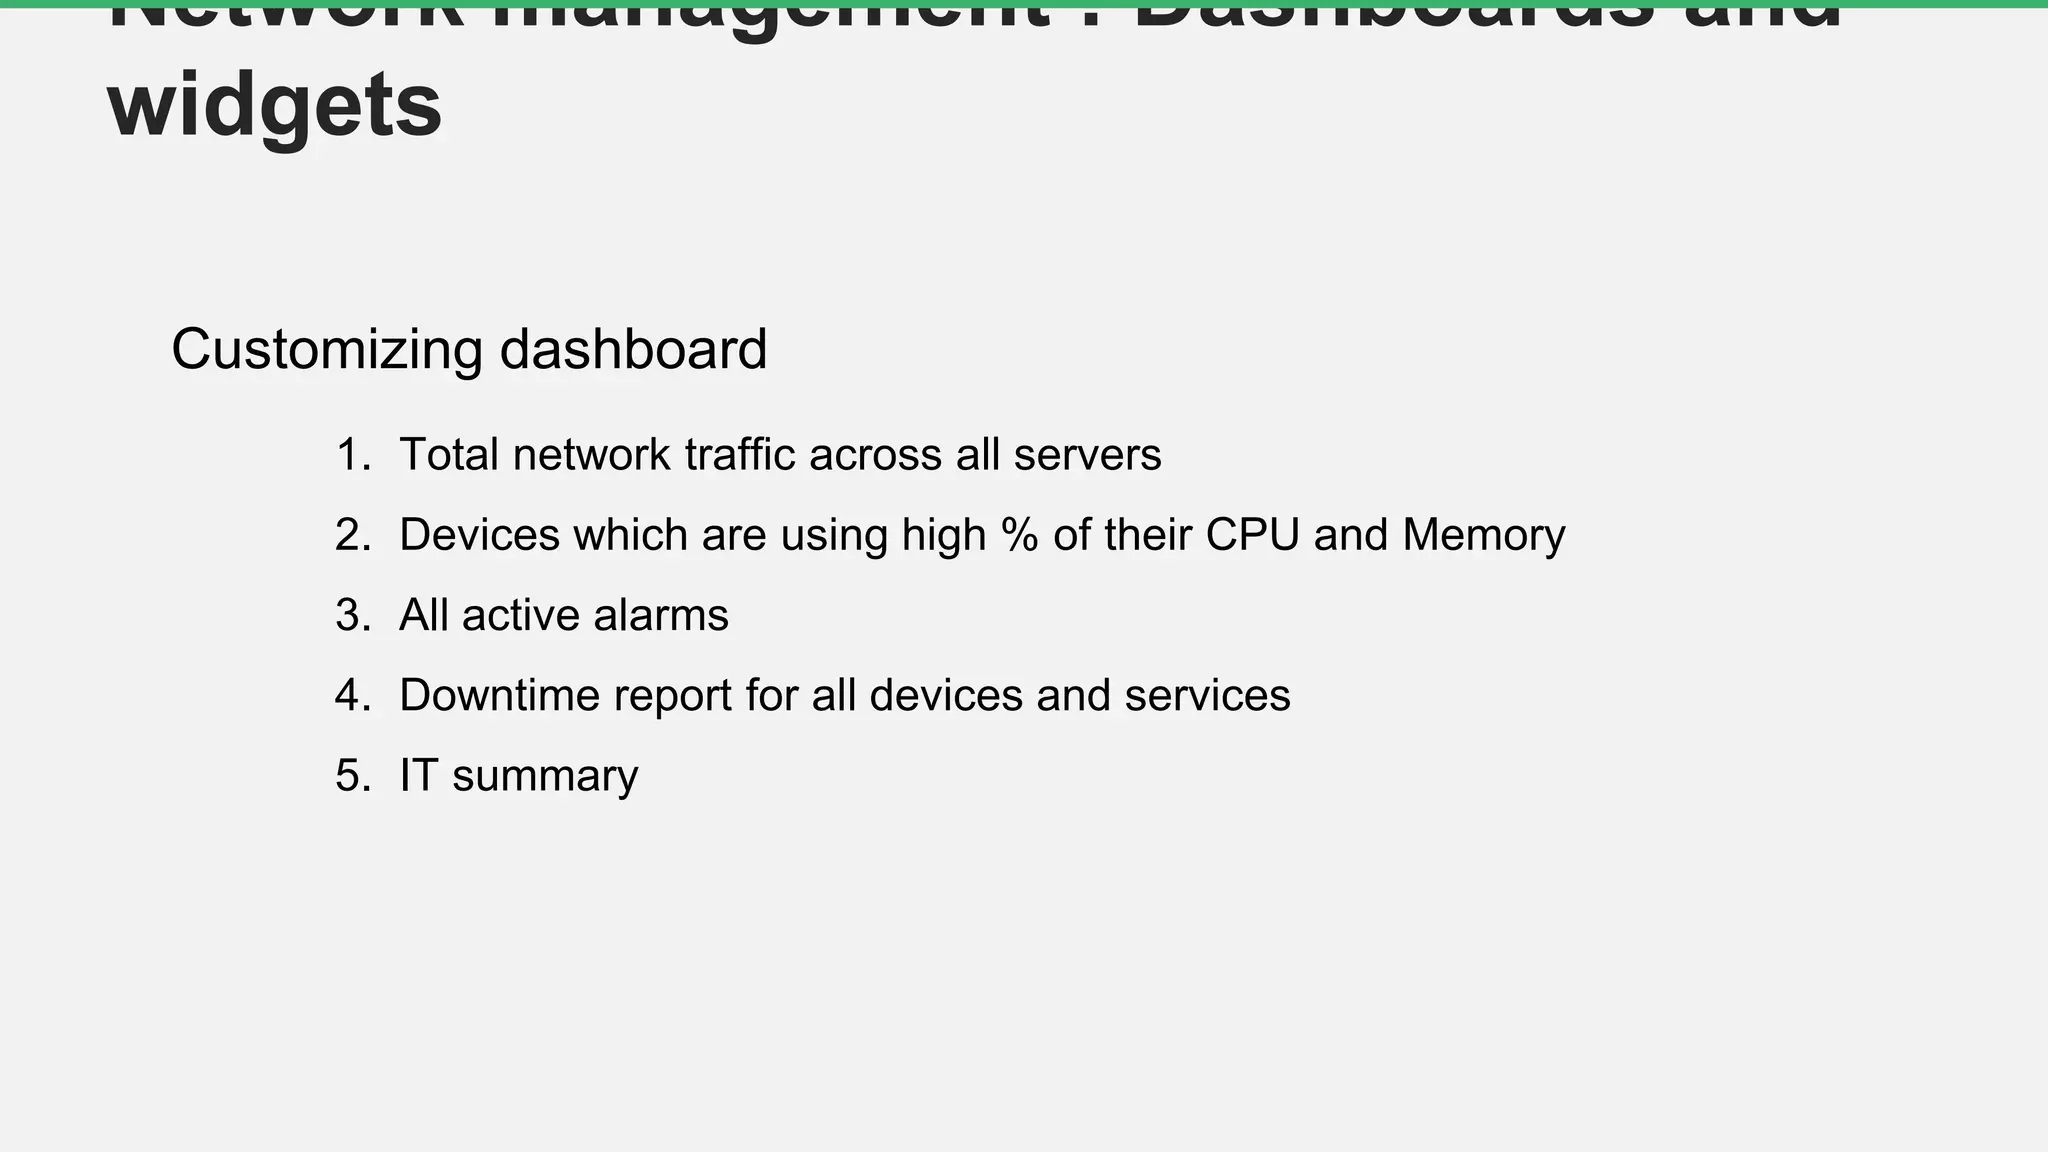
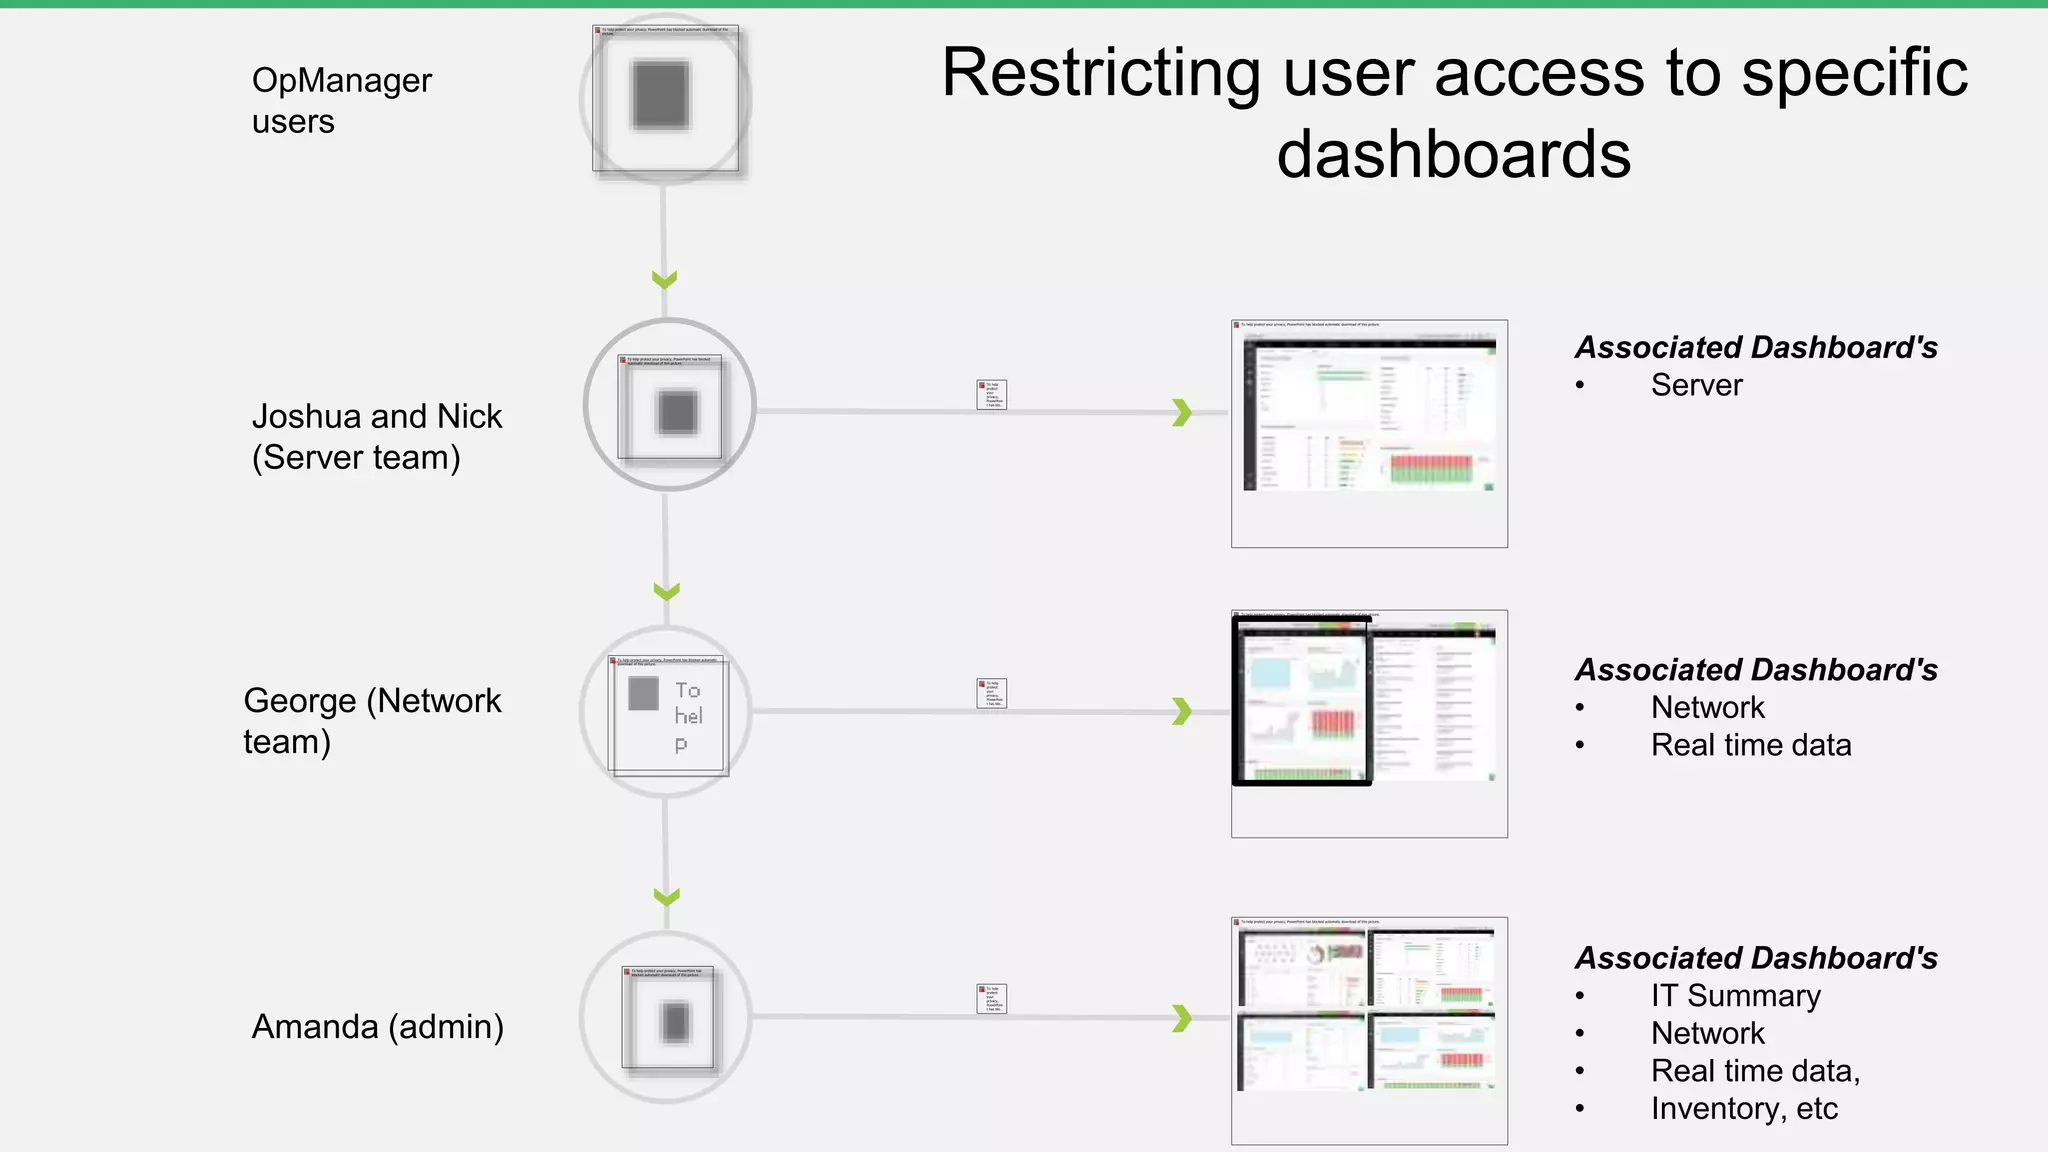
Custom dashboards display traffic, alarms, and device performance; also addresses user access restrictions.
Thank you for attending the session; invites questions and provides contact information for further inquiries.


![[OpenInfra Days Korea 2018] (Track 2) Neutron LBaaS 어디까지 왔니? - Octavia 소개](https://cdn.slidesharecdn.com/ss_thumbnails/26octavia-180704054917-thumbnail.jpg?width=640&height=640&fit=bounds)


![[OpenStack] 공개 소프트웨어 오픈스택 입문 & 파헤치기](https://cdn.slidesharecdn.com/ss_thumbnails/opensource-skimmingopenstackwithkoreausergroup-180824144737-thumbnail.jpg?width=640&height=640&fit=bounds)


![[Season - 3 OpManager Training] Monitoring Network Performance](https://cdn.slidesharecdn.com/ss_thumbnails/part3networkmonitoringfreeopmanagertraining-180517125124-thumbnail.jpg?width=640&height=640&fit=bounds)

![Season 4 [Free OpManager training] Part3 - Monitoring Network Performance](https://cdn.slidesharecdn.com/ss_thumbnails/part3networkmonitoringfreeopmanagertraining-180727075133-thumbnail.jpg?width=640&height=640&fit=bounds)