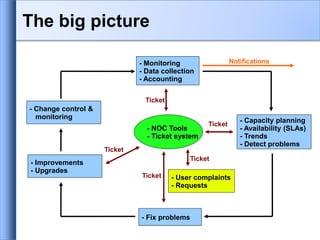
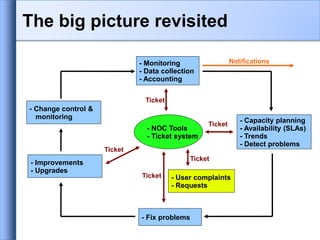
Network monitoring and management involves three key activities:
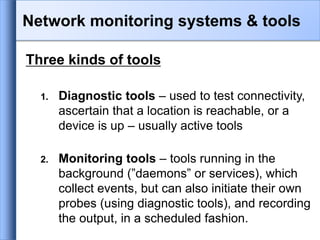
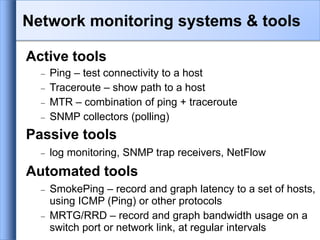
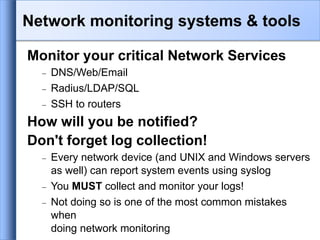
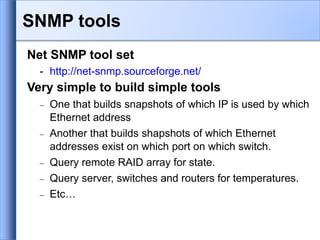
1. Monitoring networks to diagnose problems and gather statistics using tools that monitor components and notify administrators of outages or issues.
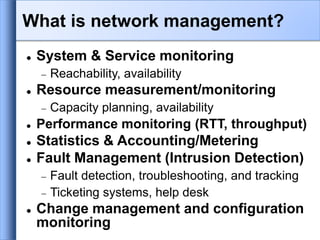
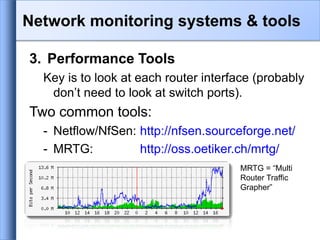
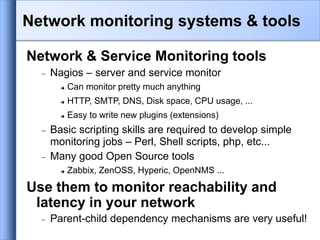
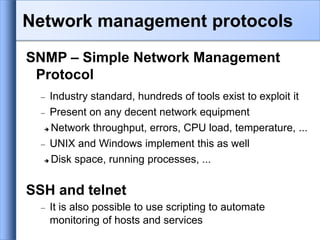
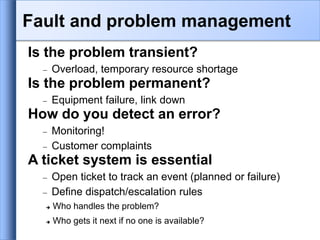
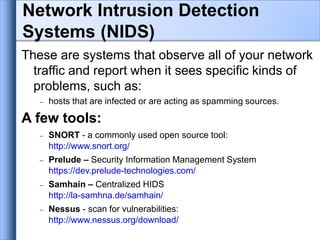
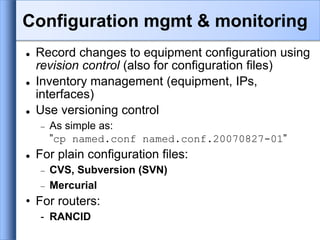
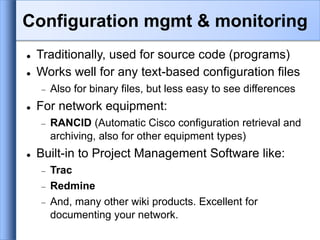
2. Managing networks by ensuring security, optimizing performance, maintaining reliability, and addressing faults and problems using systems, services, fault, change and performance monitoring.
3. Consolidating and analyzing monitoring data in a network operations center to coordinate tasks, field incidents, and improve the network over time based on trends.