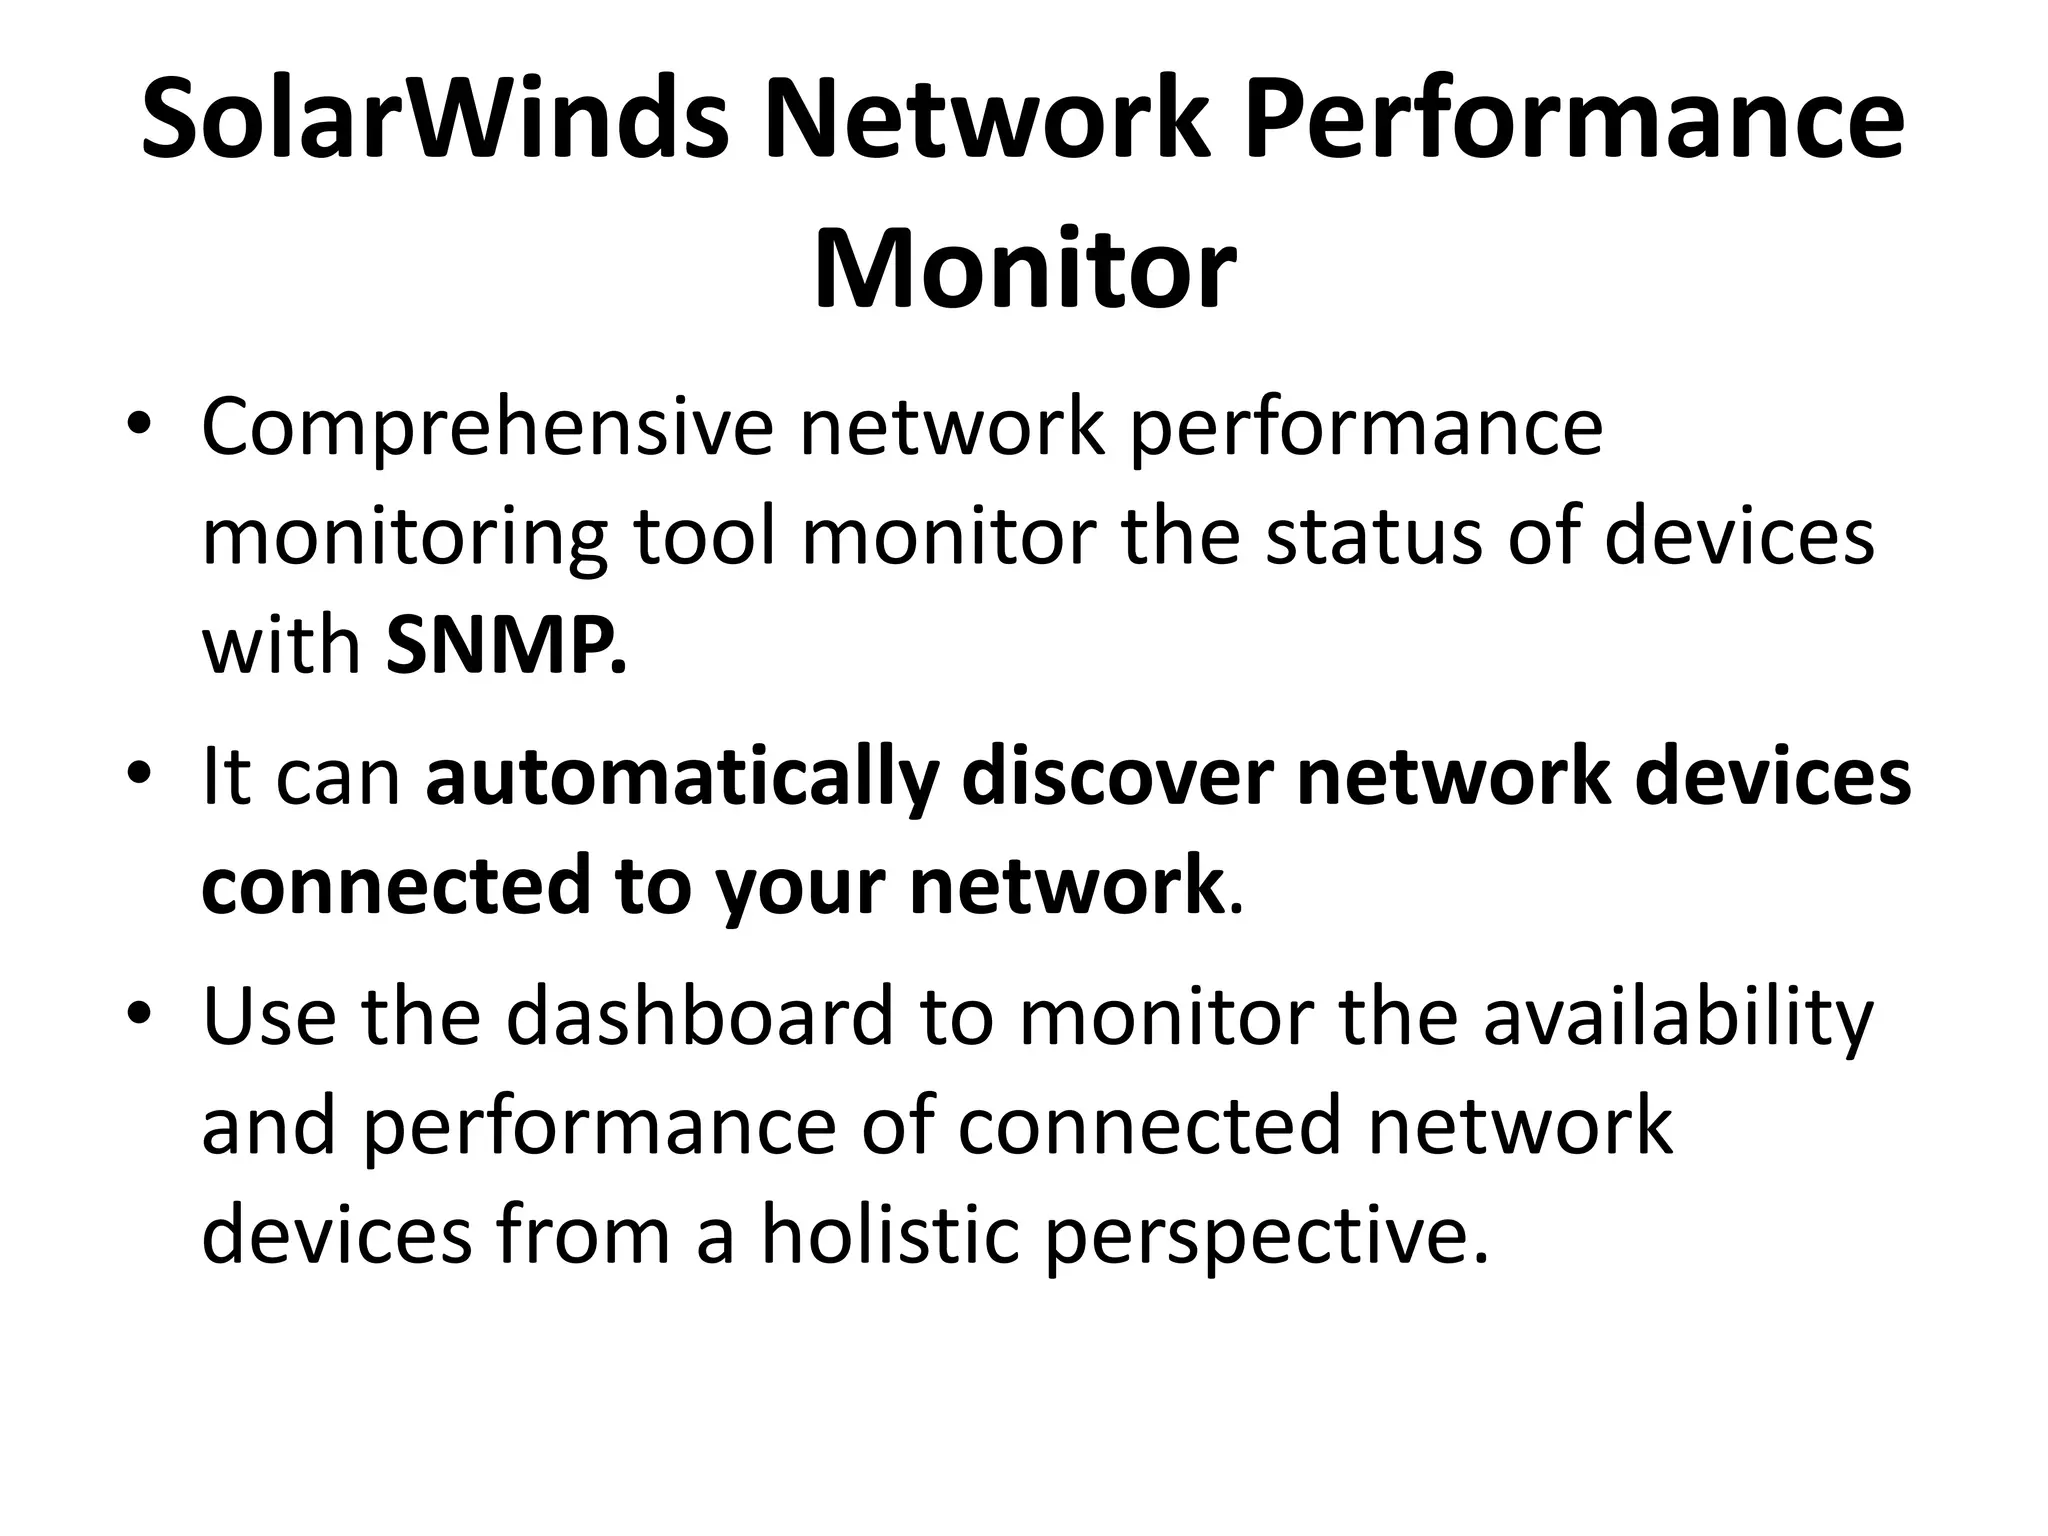
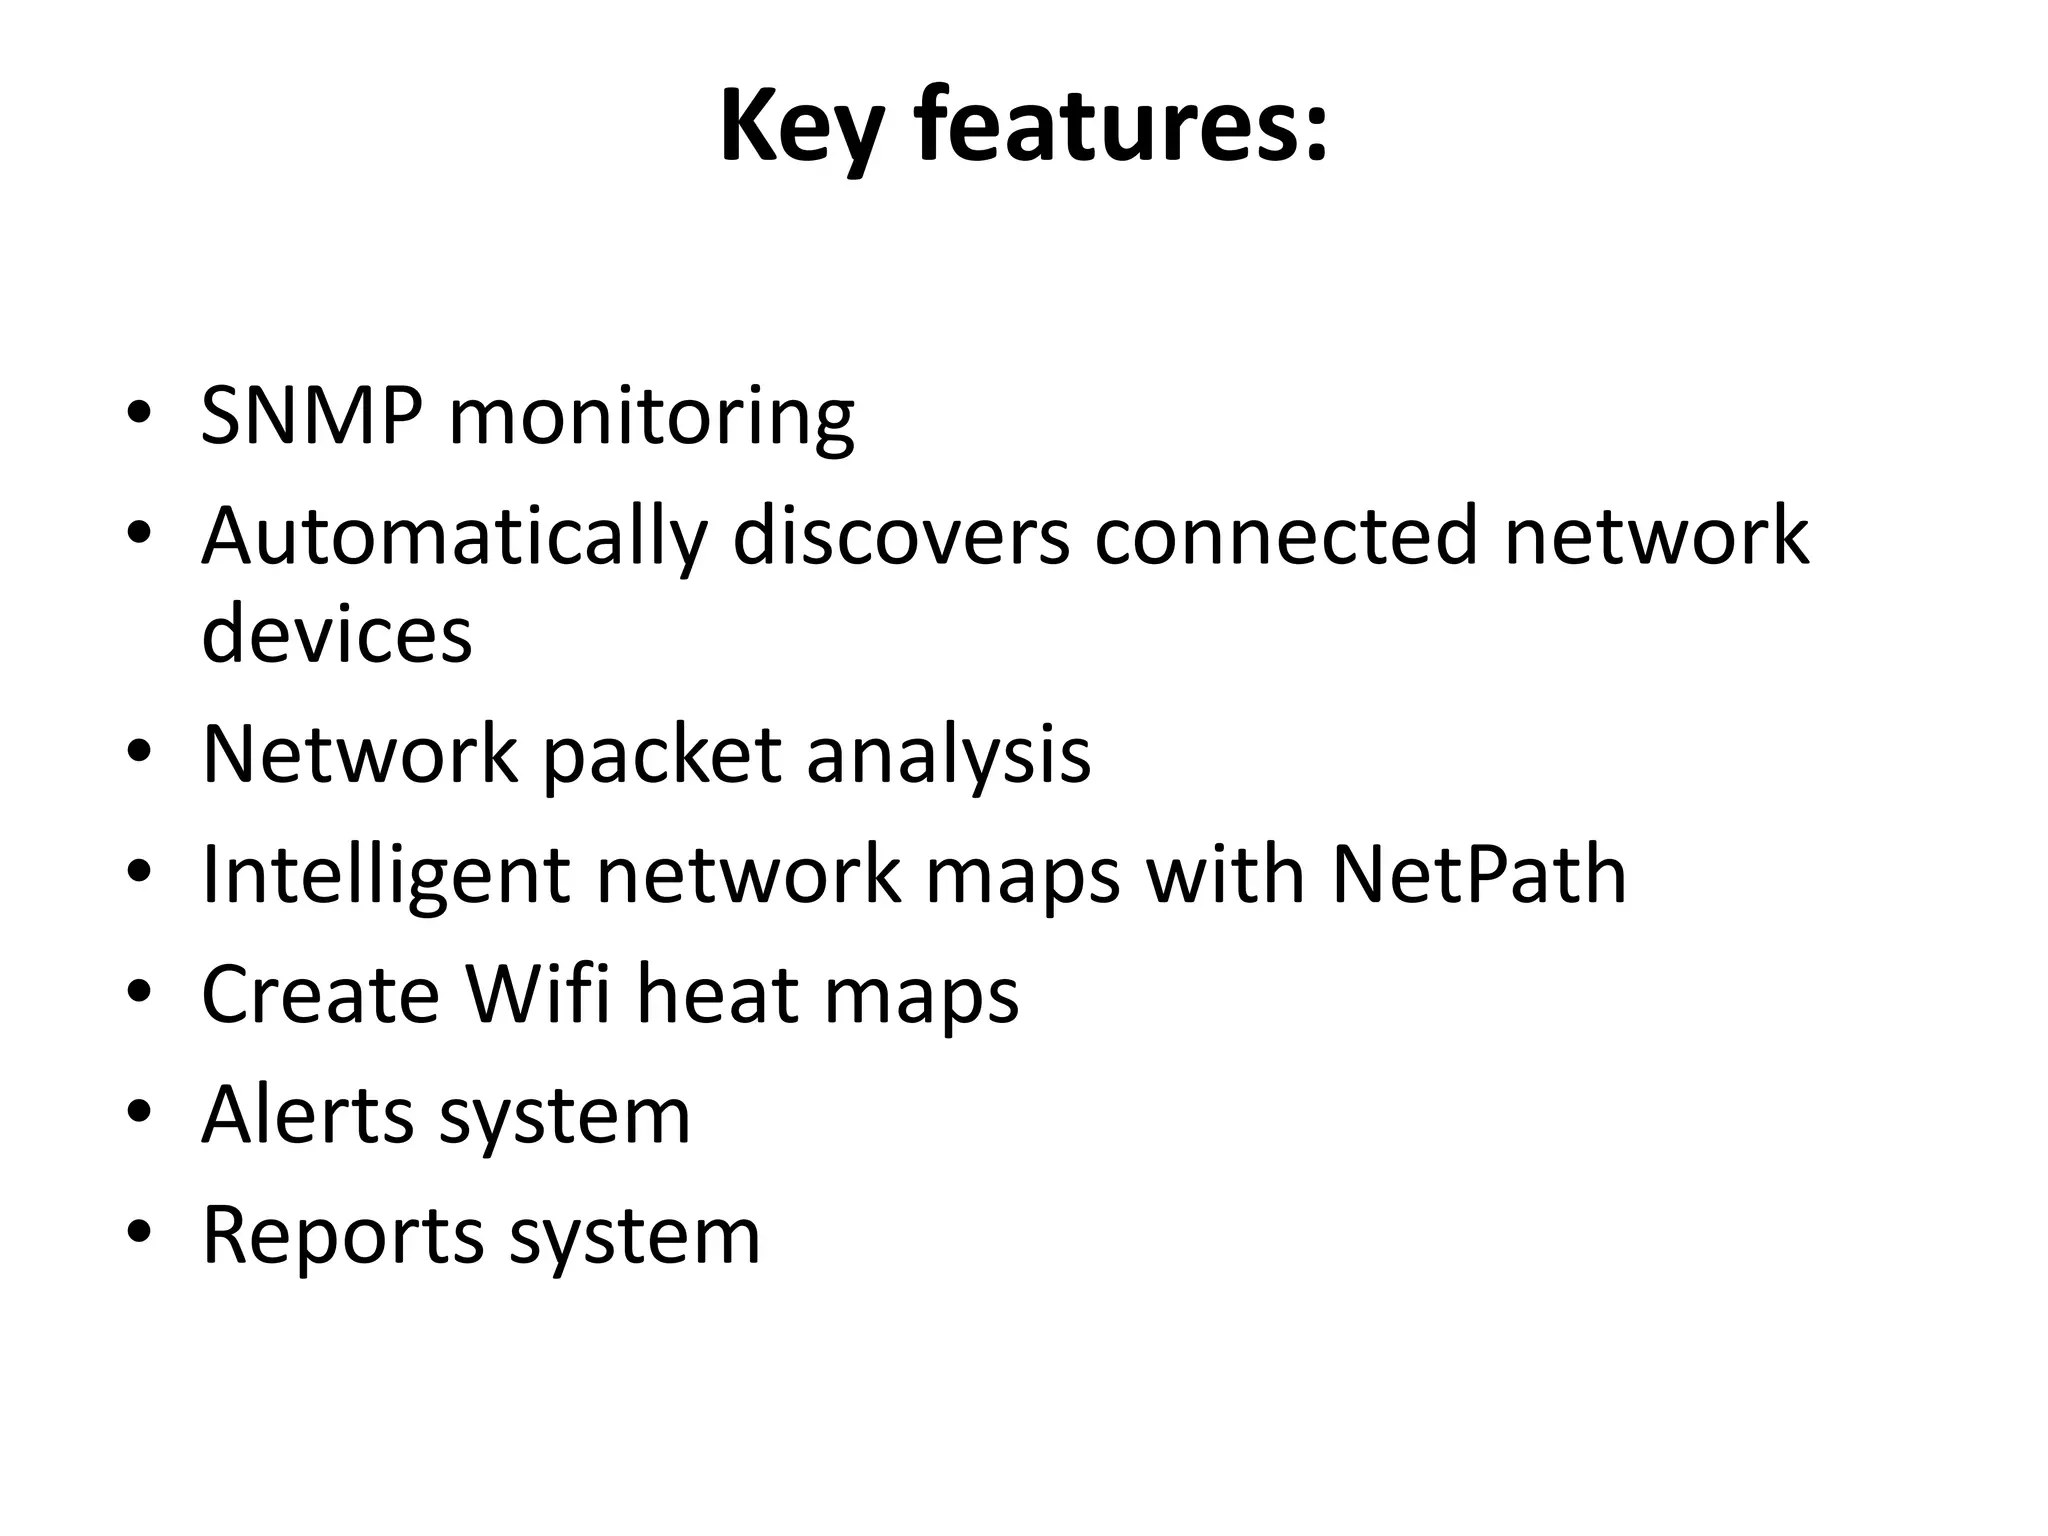
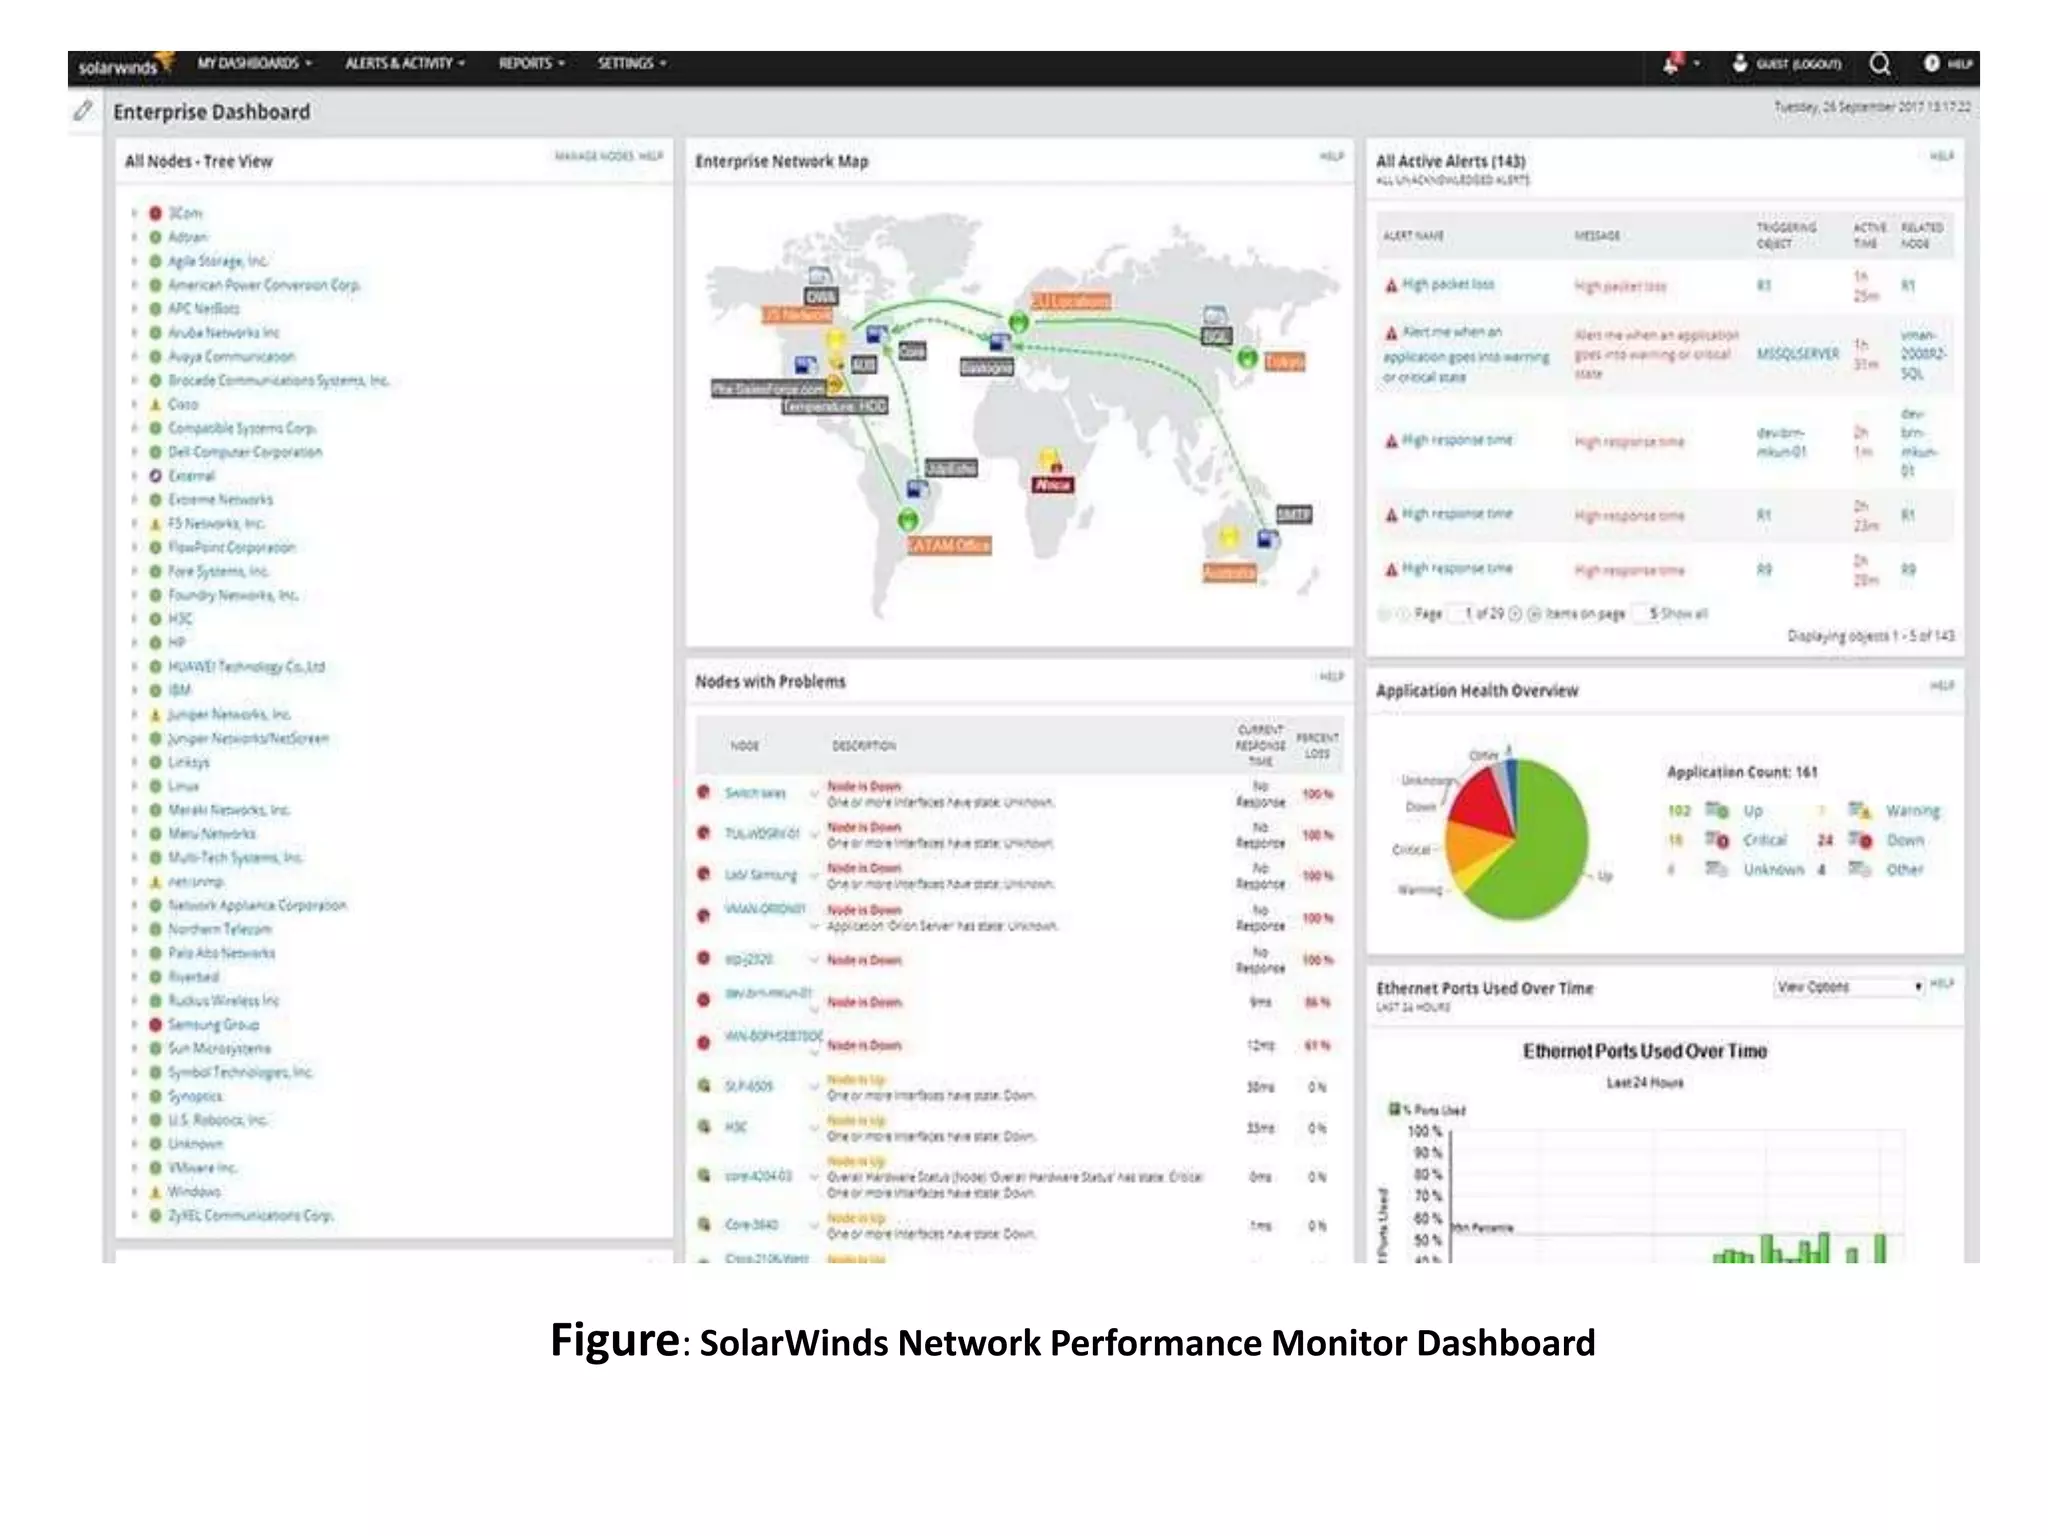
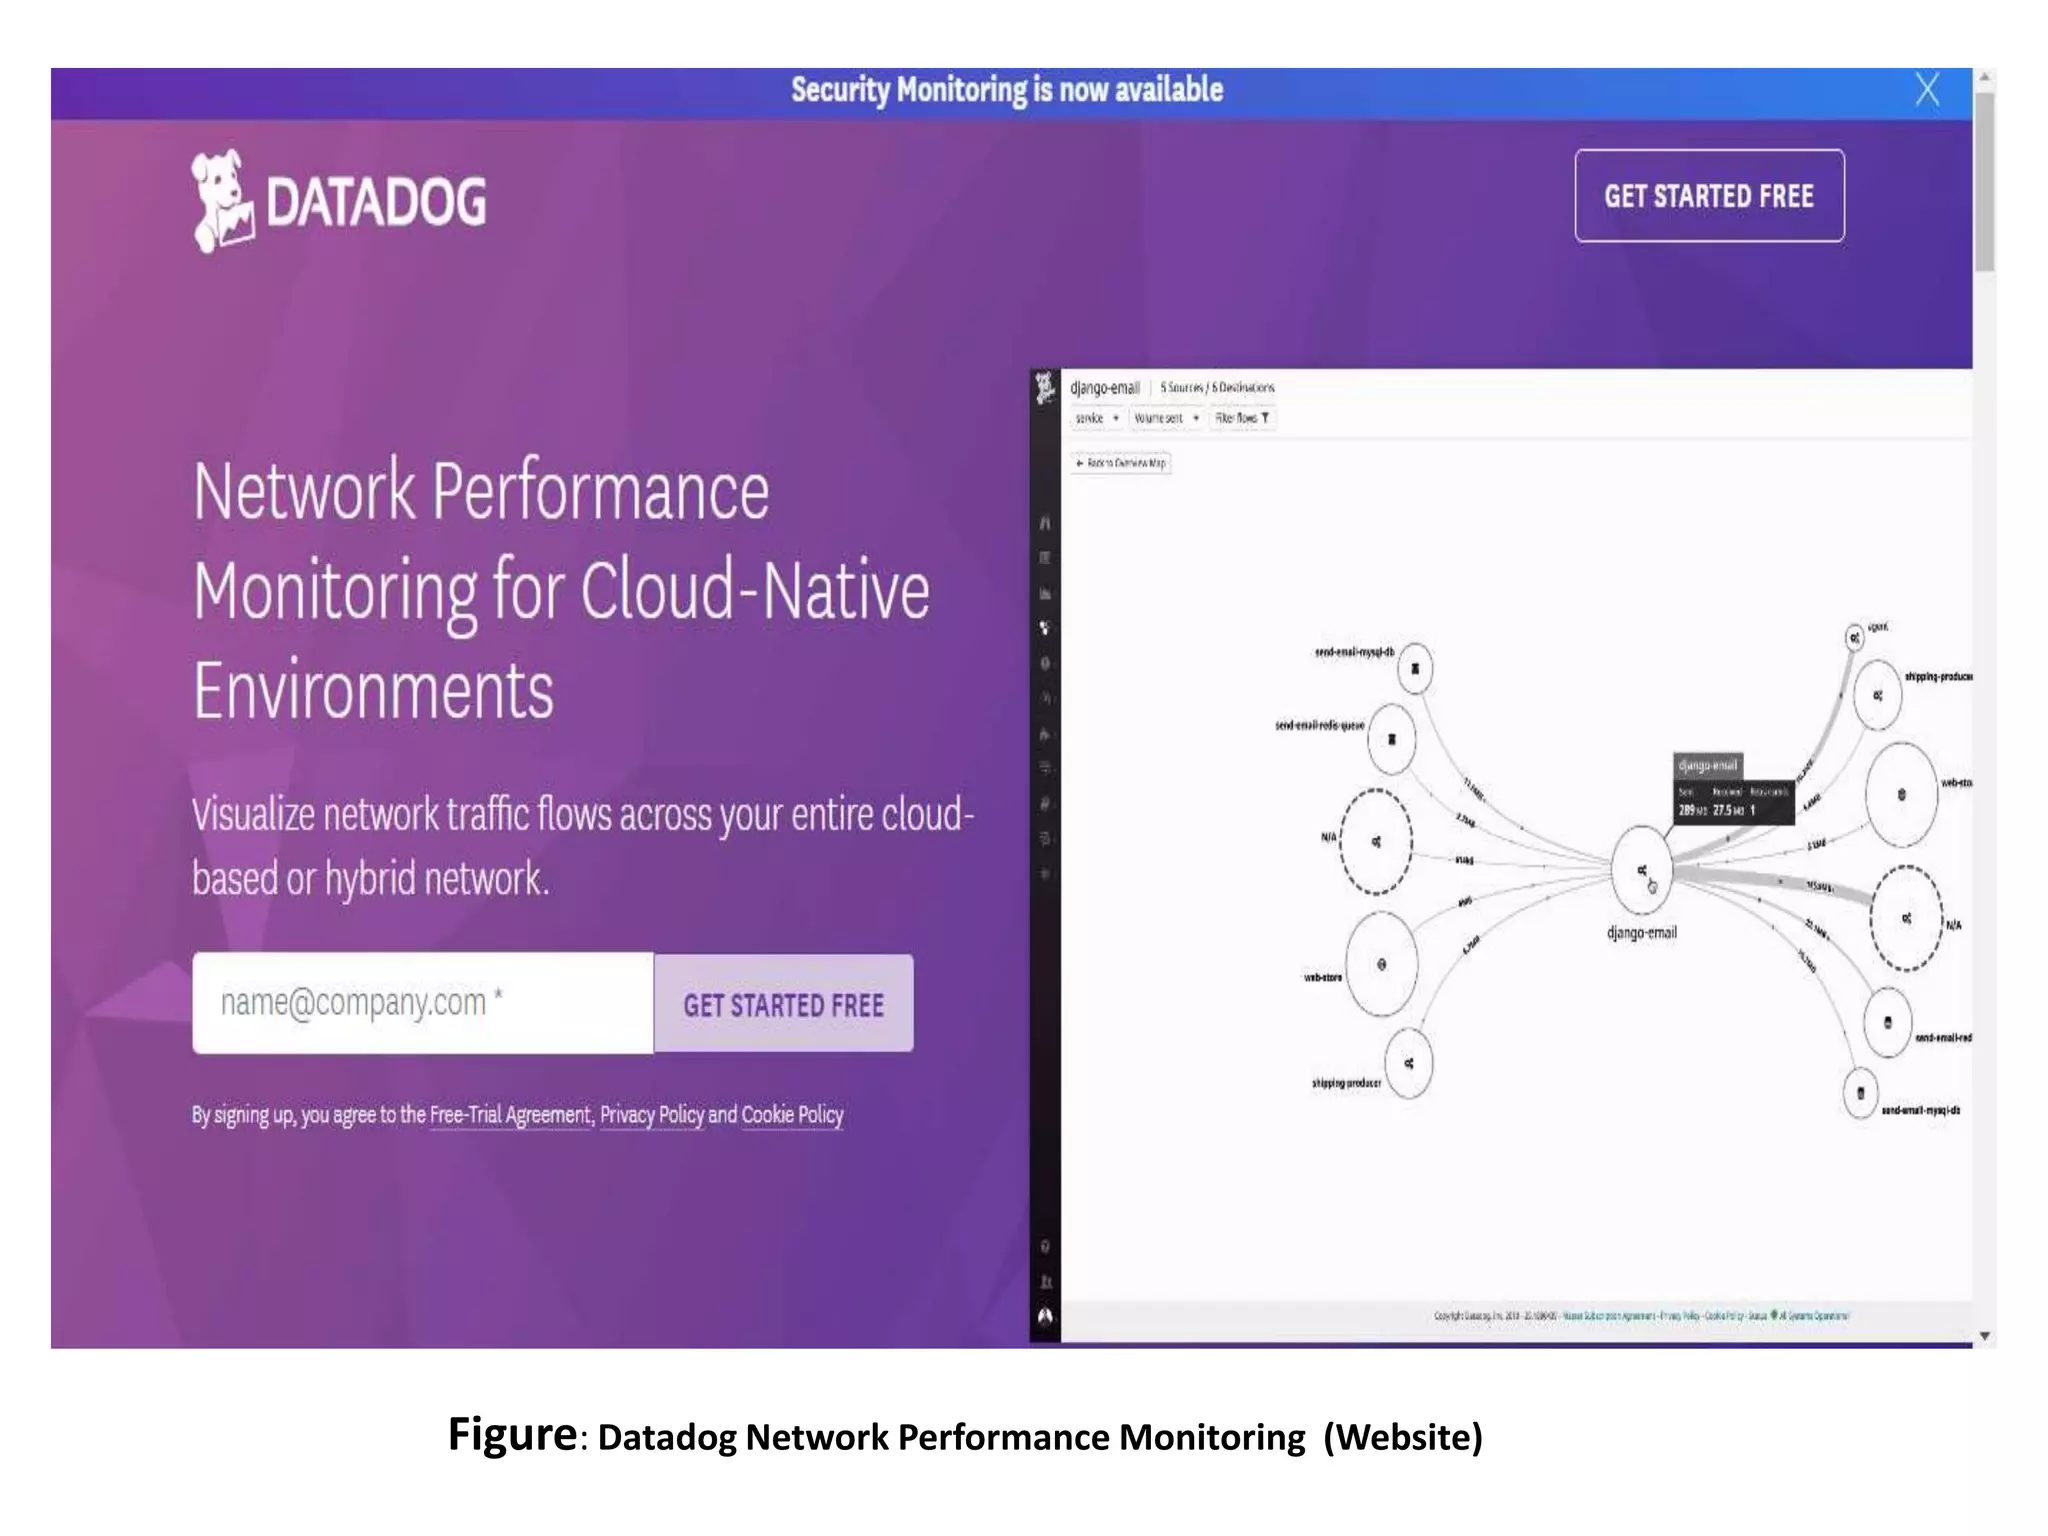
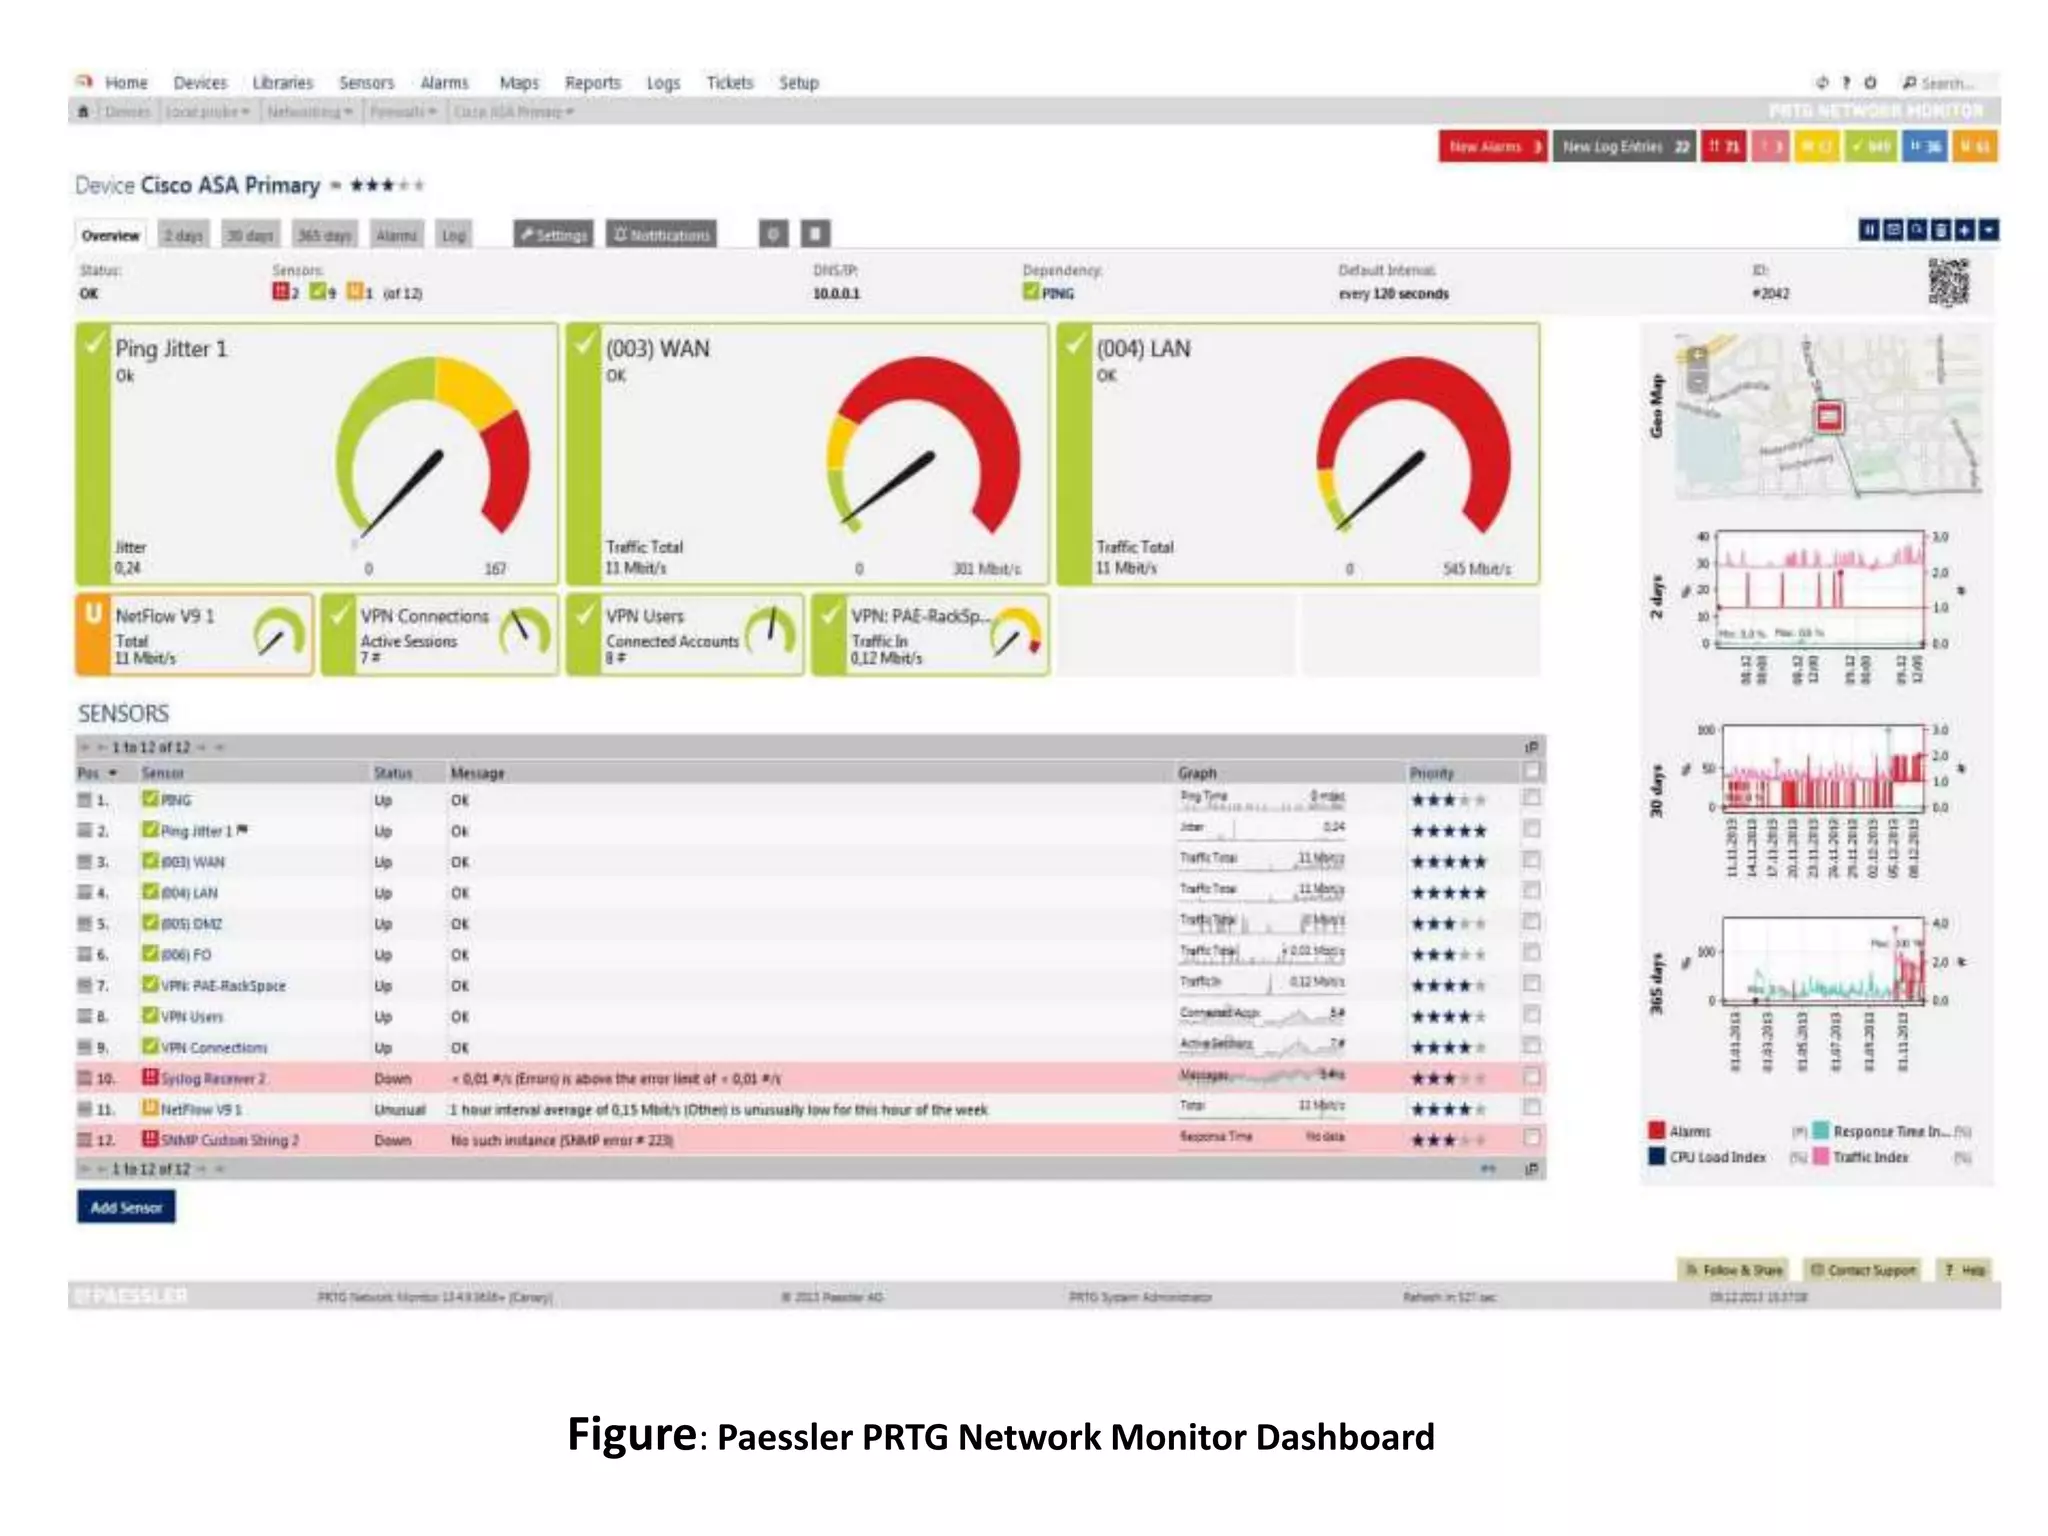
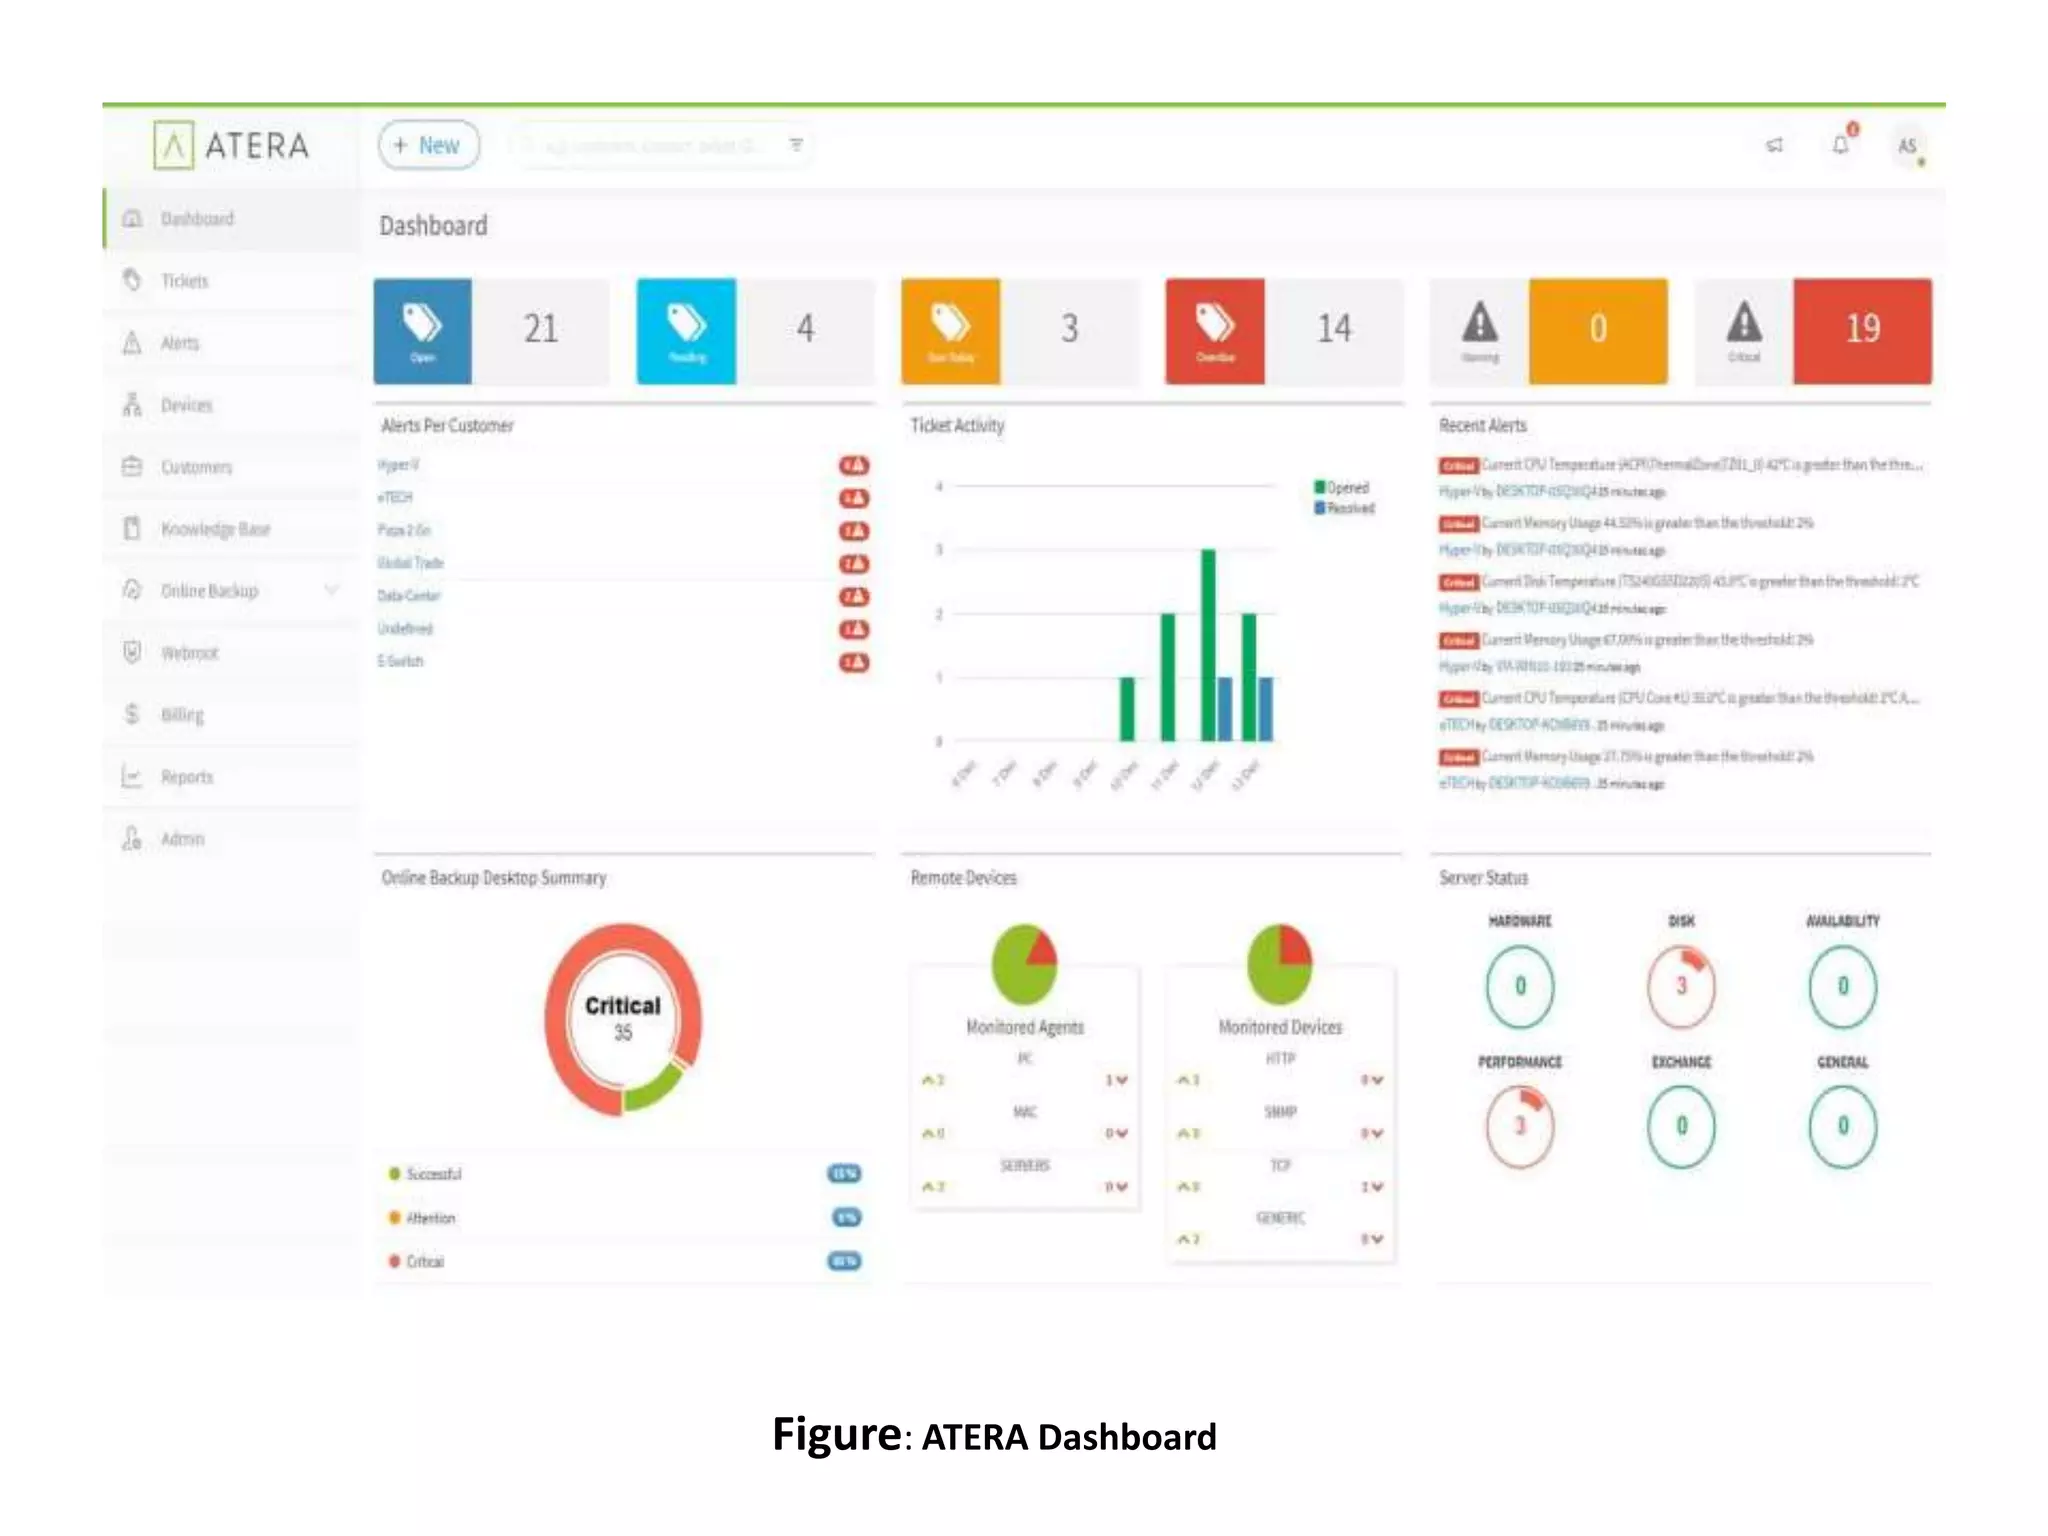
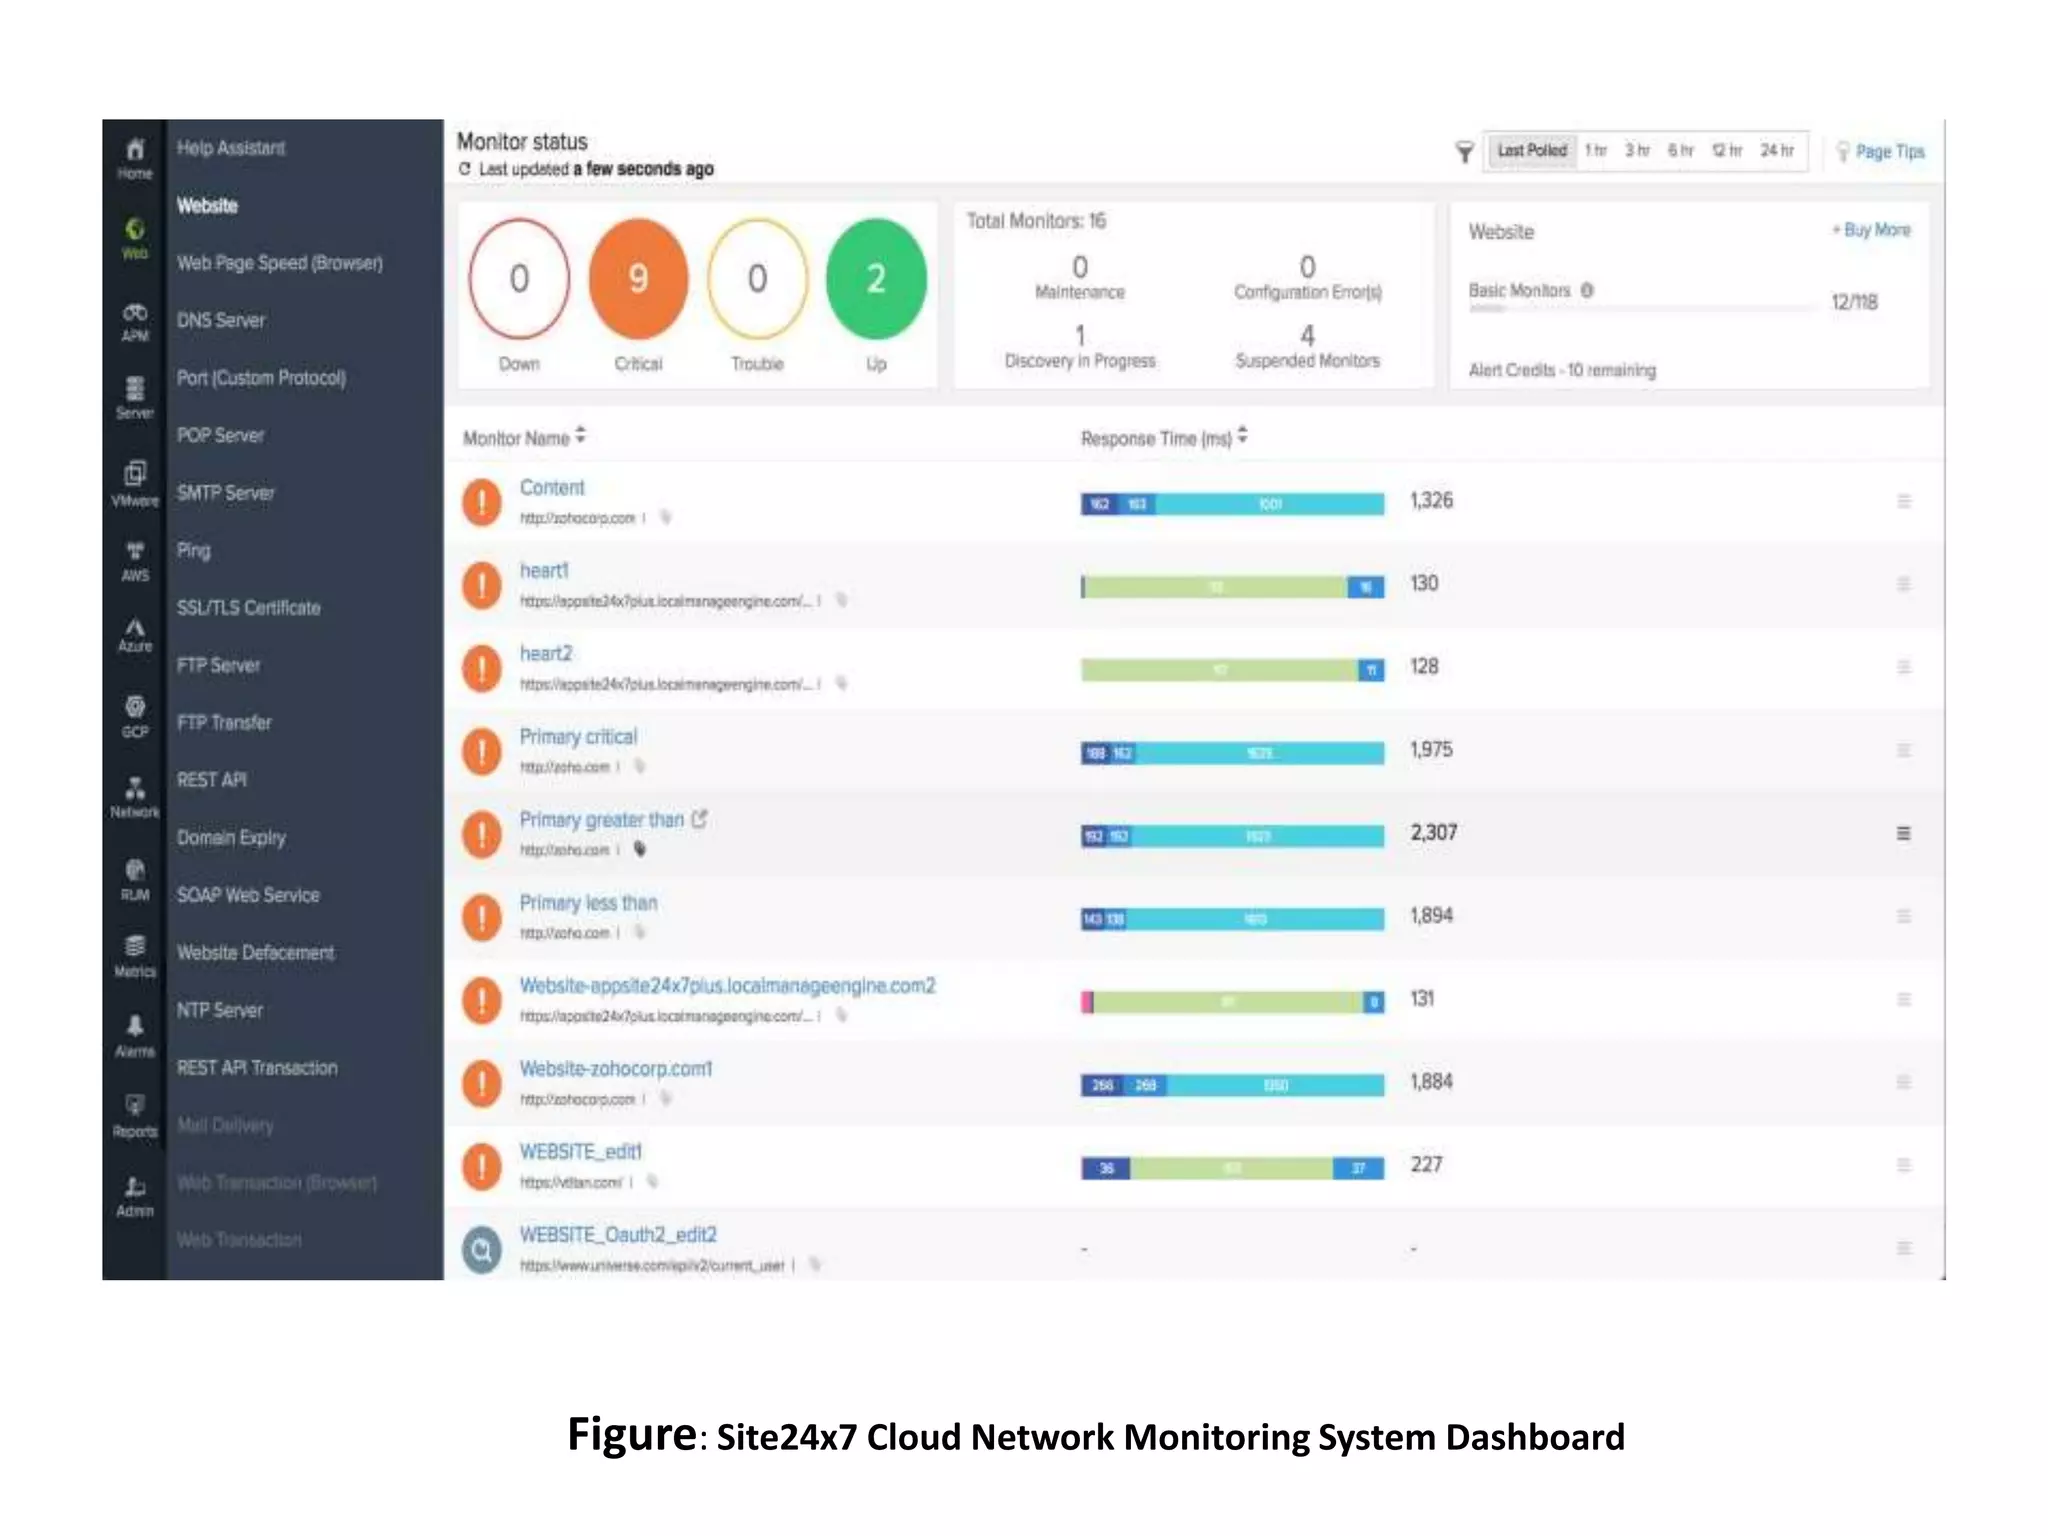
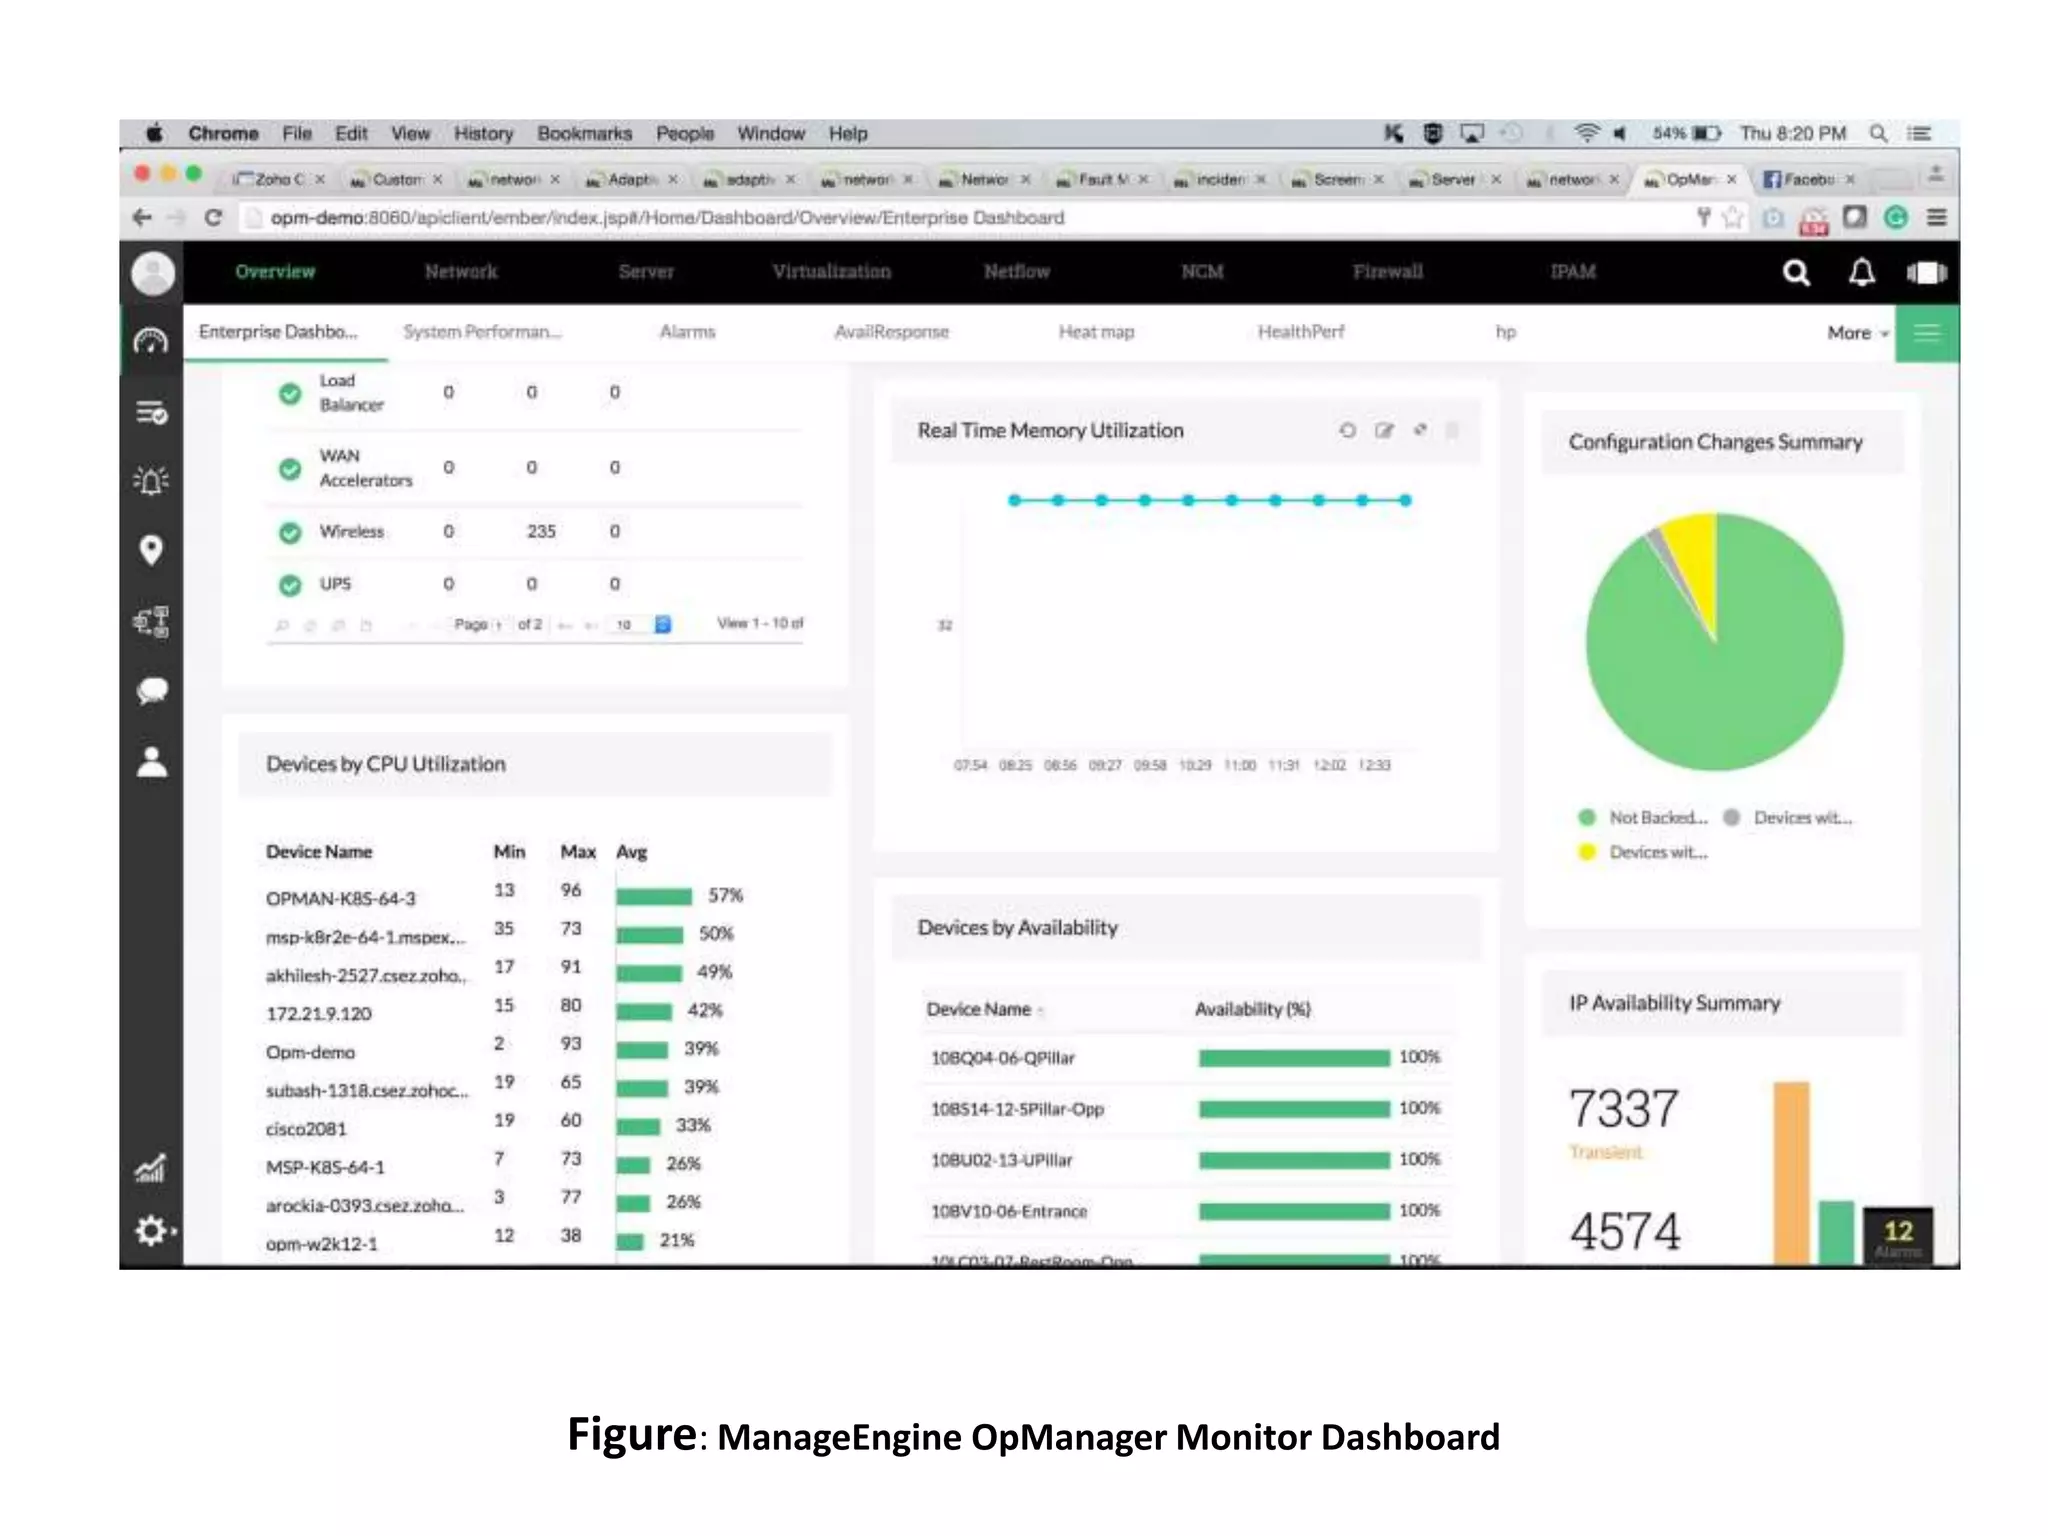
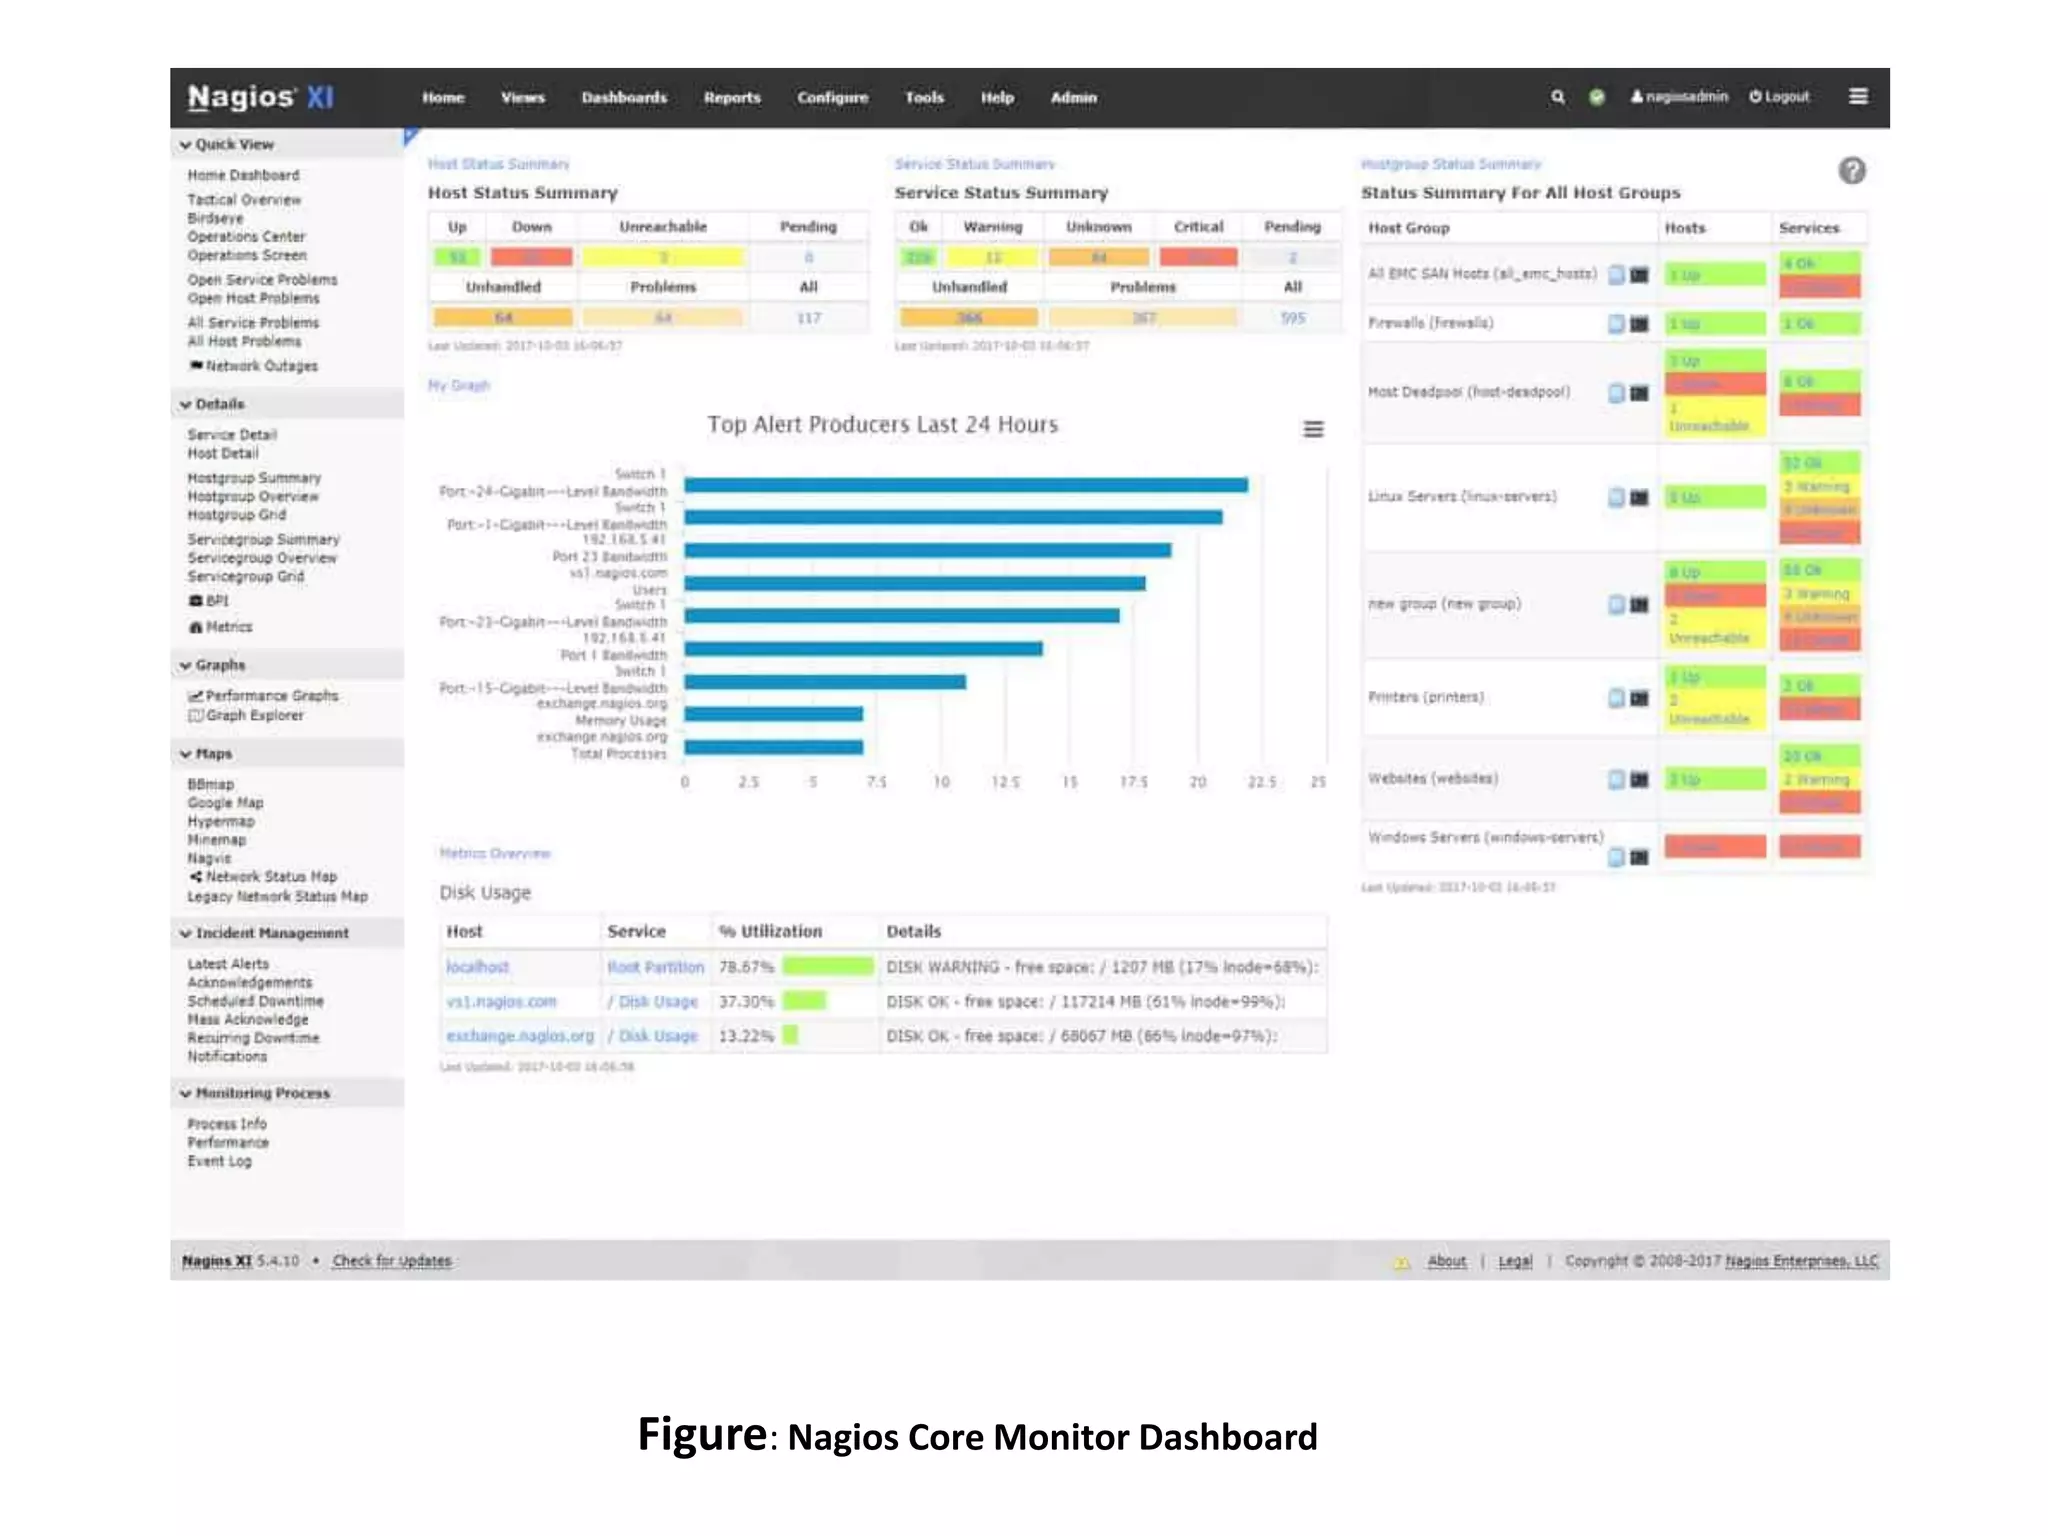
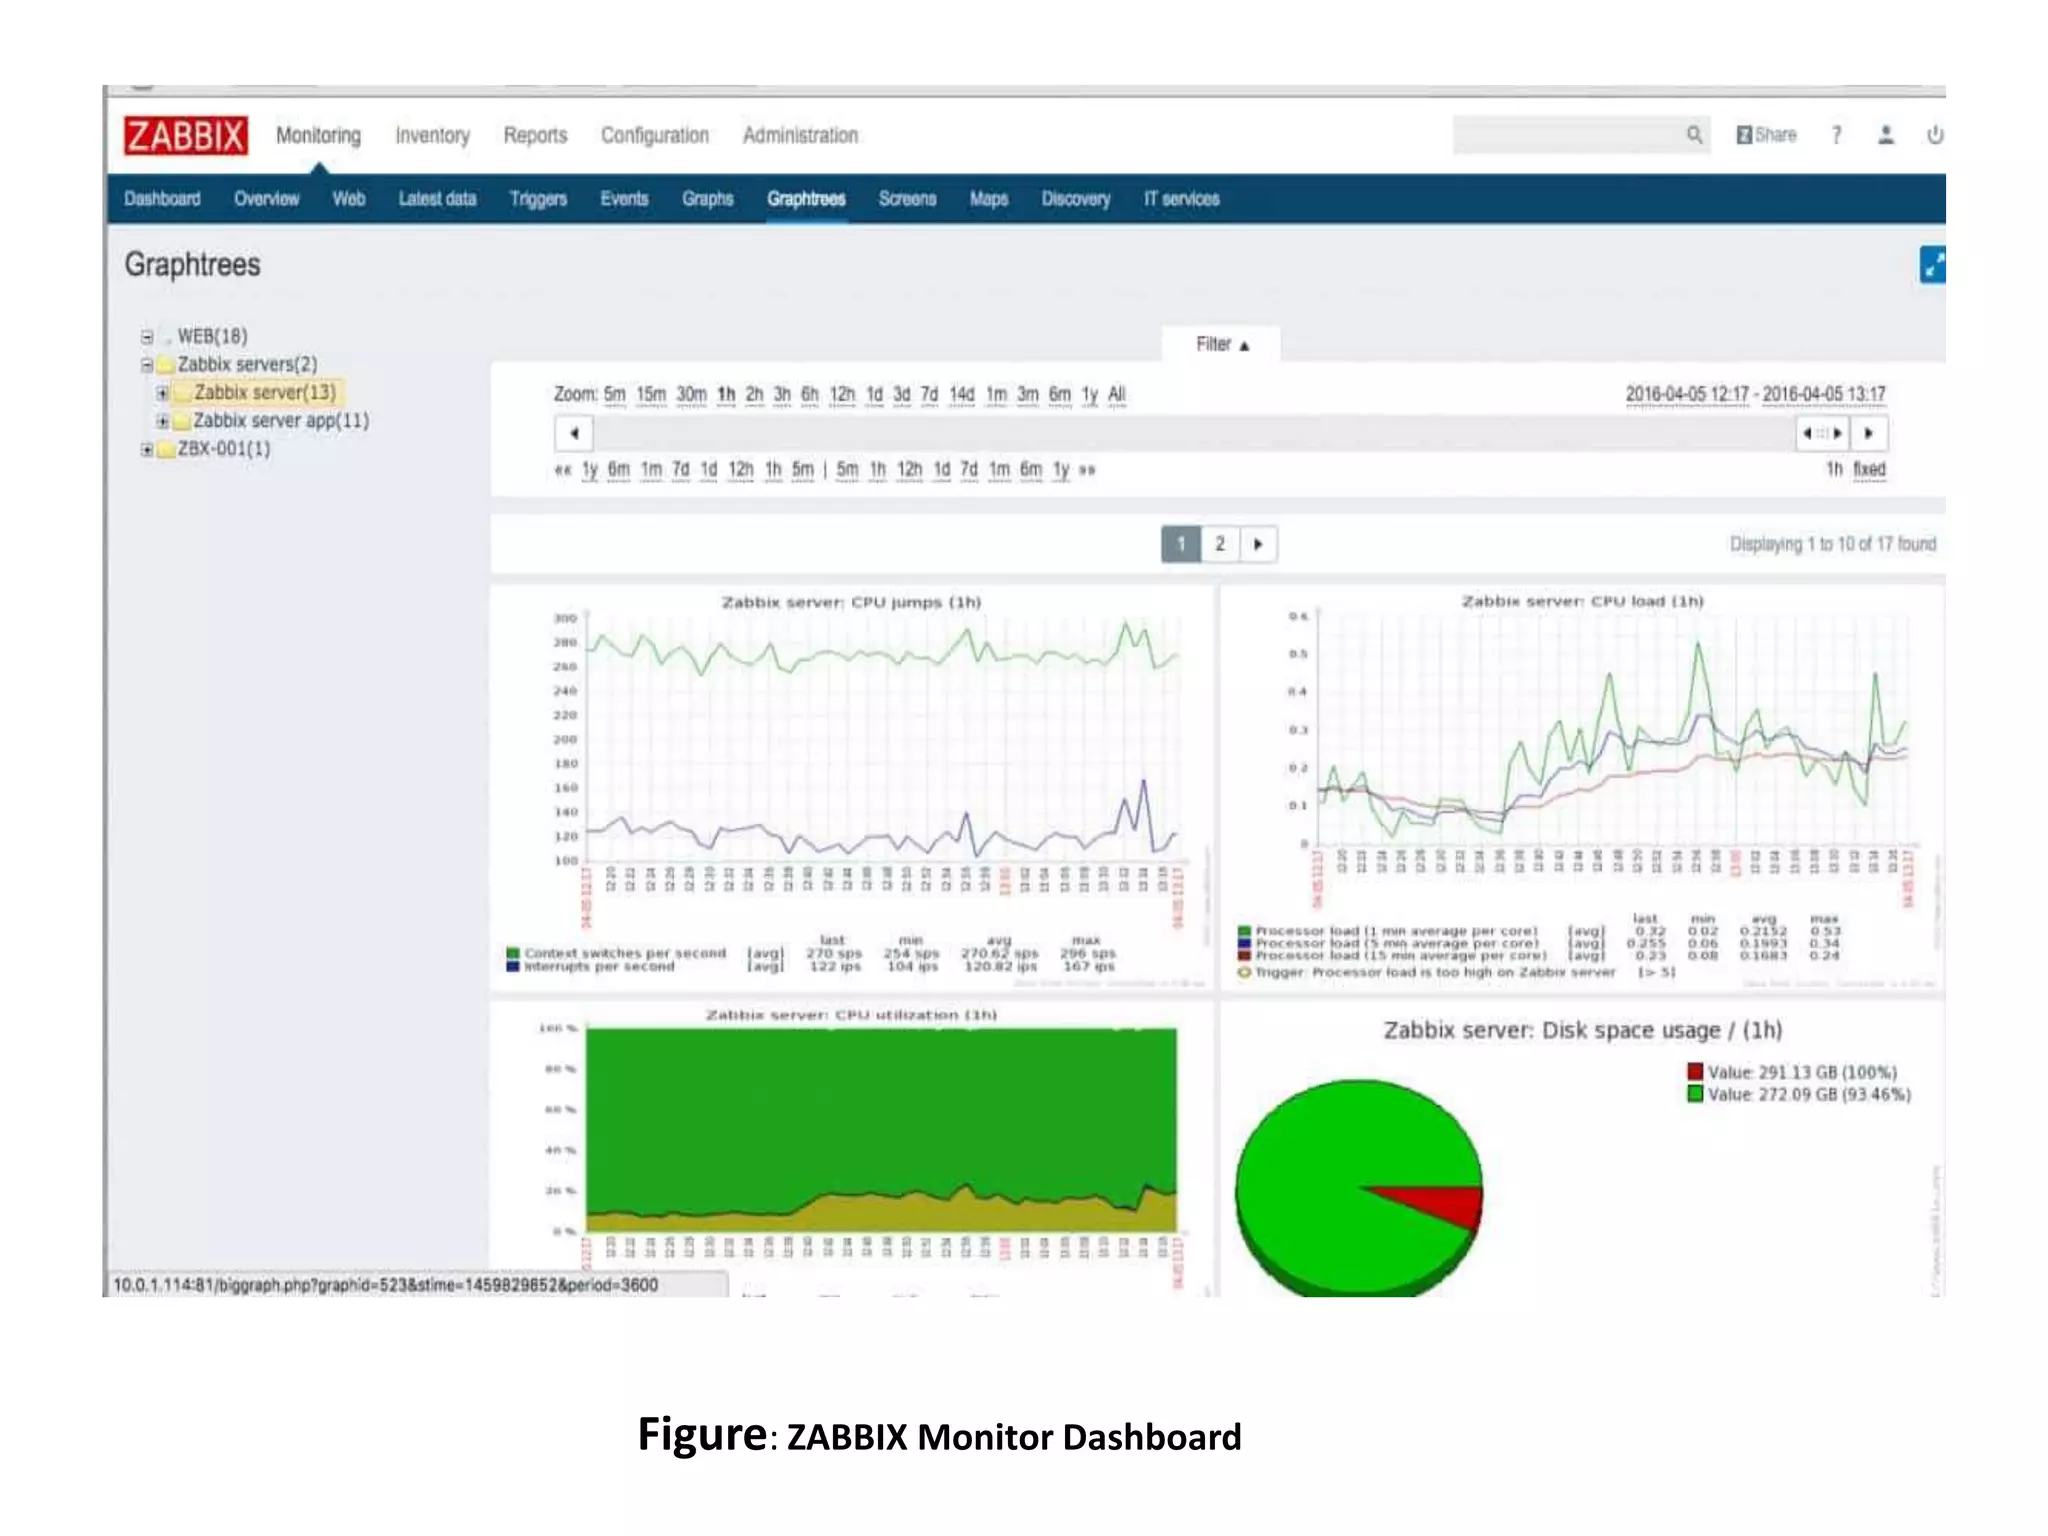
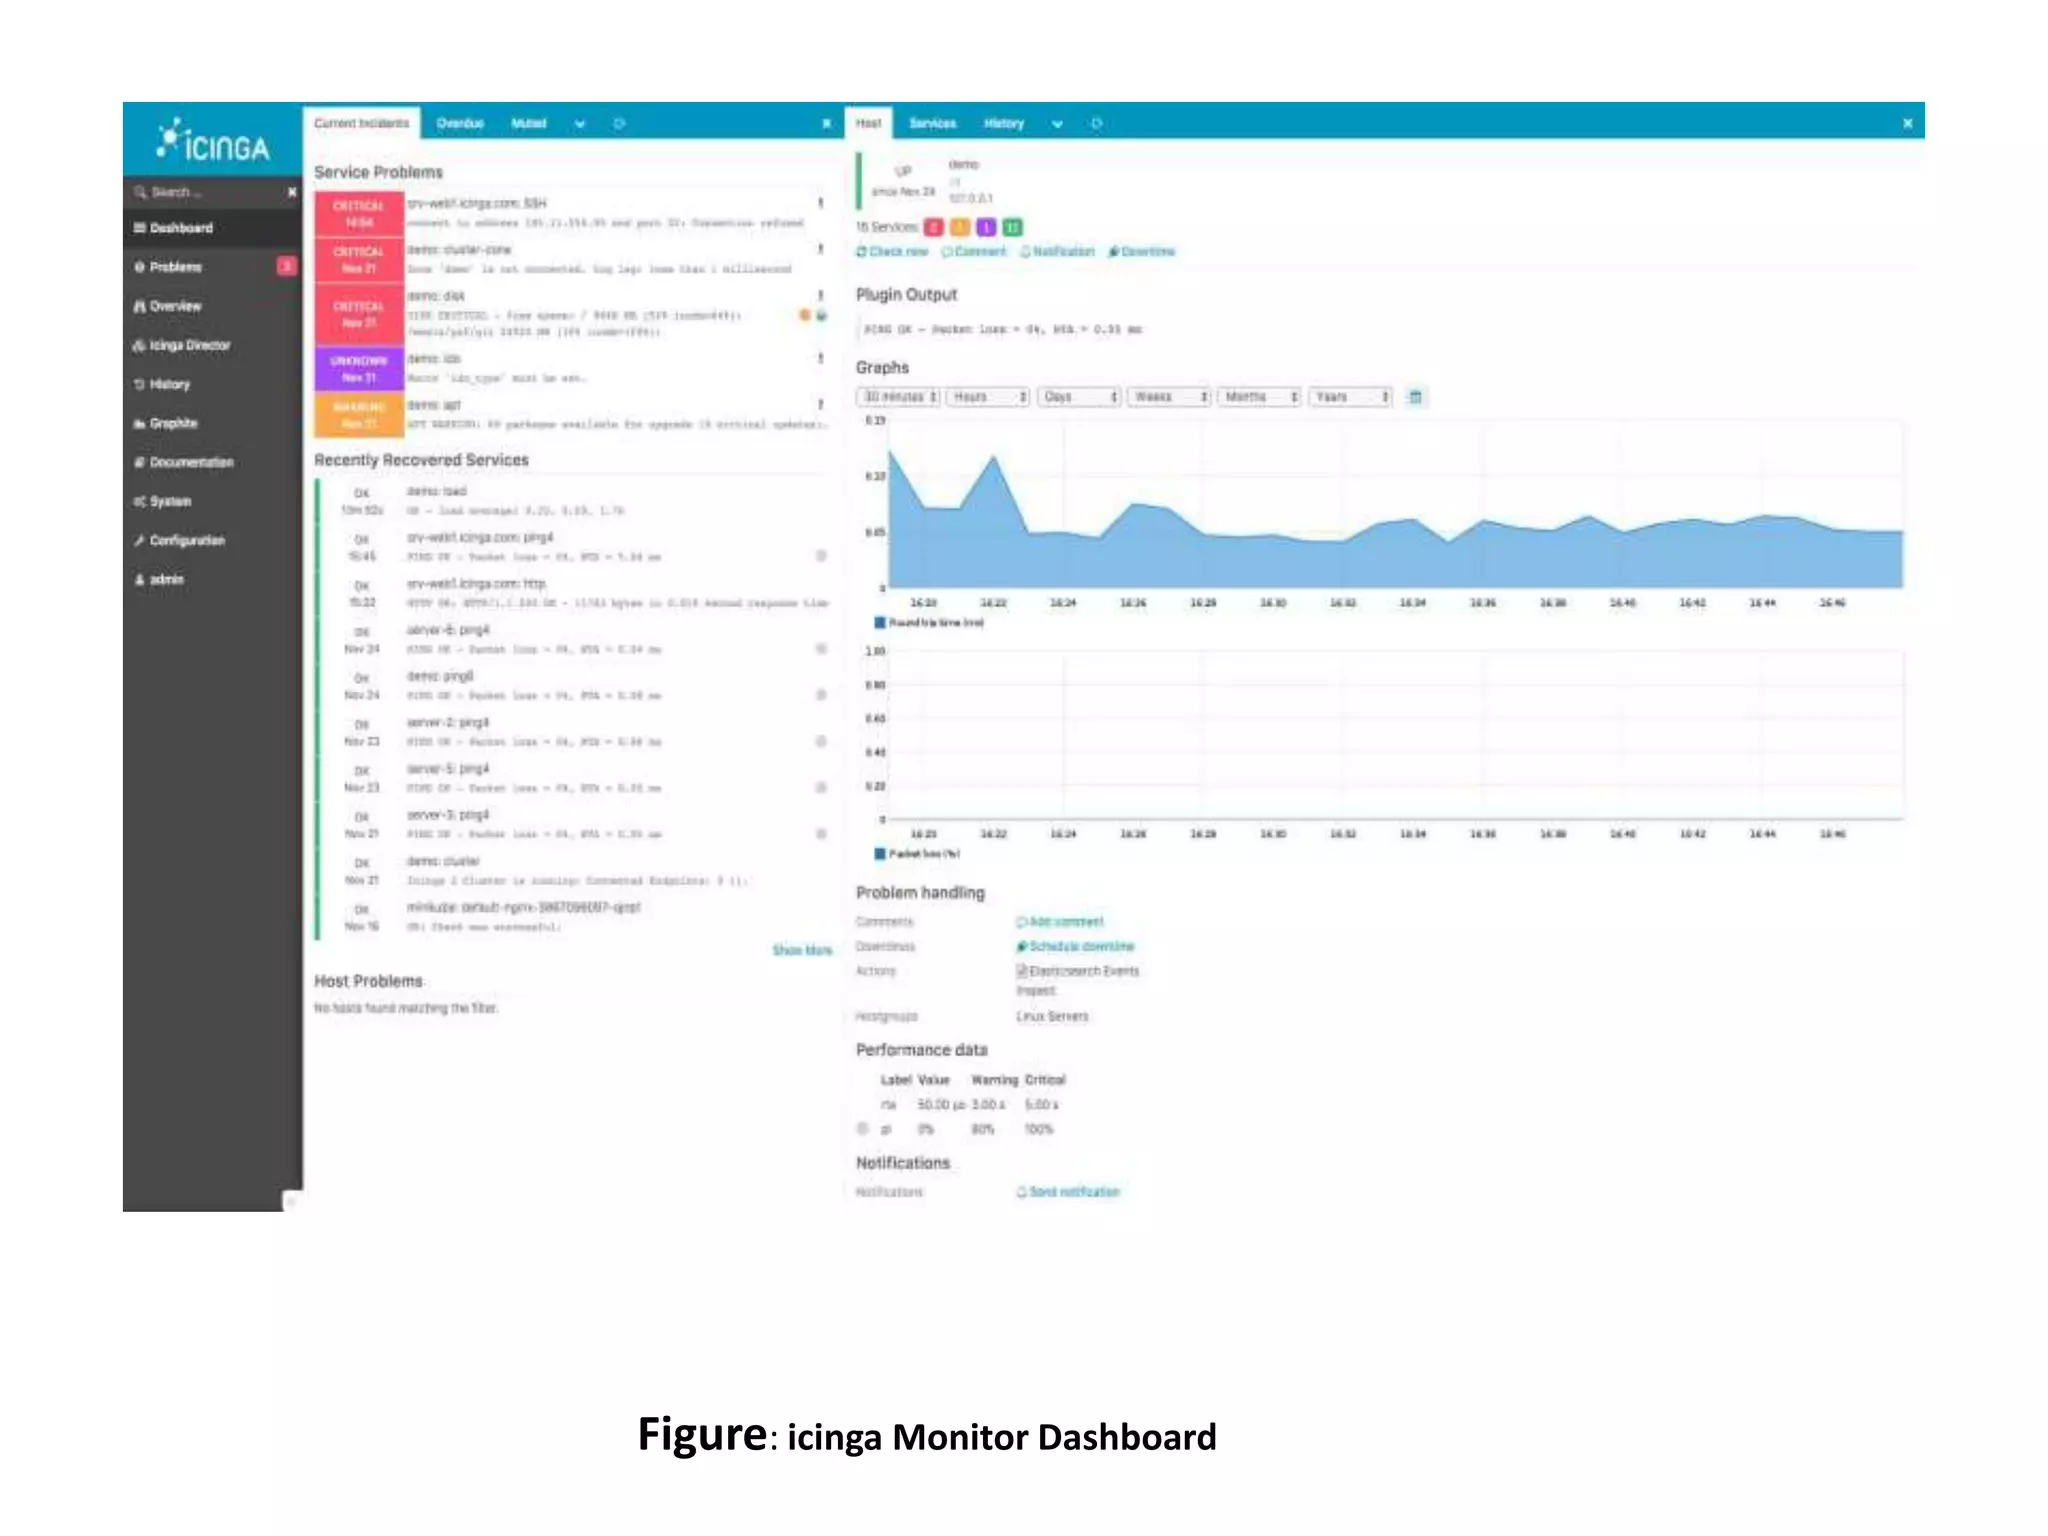
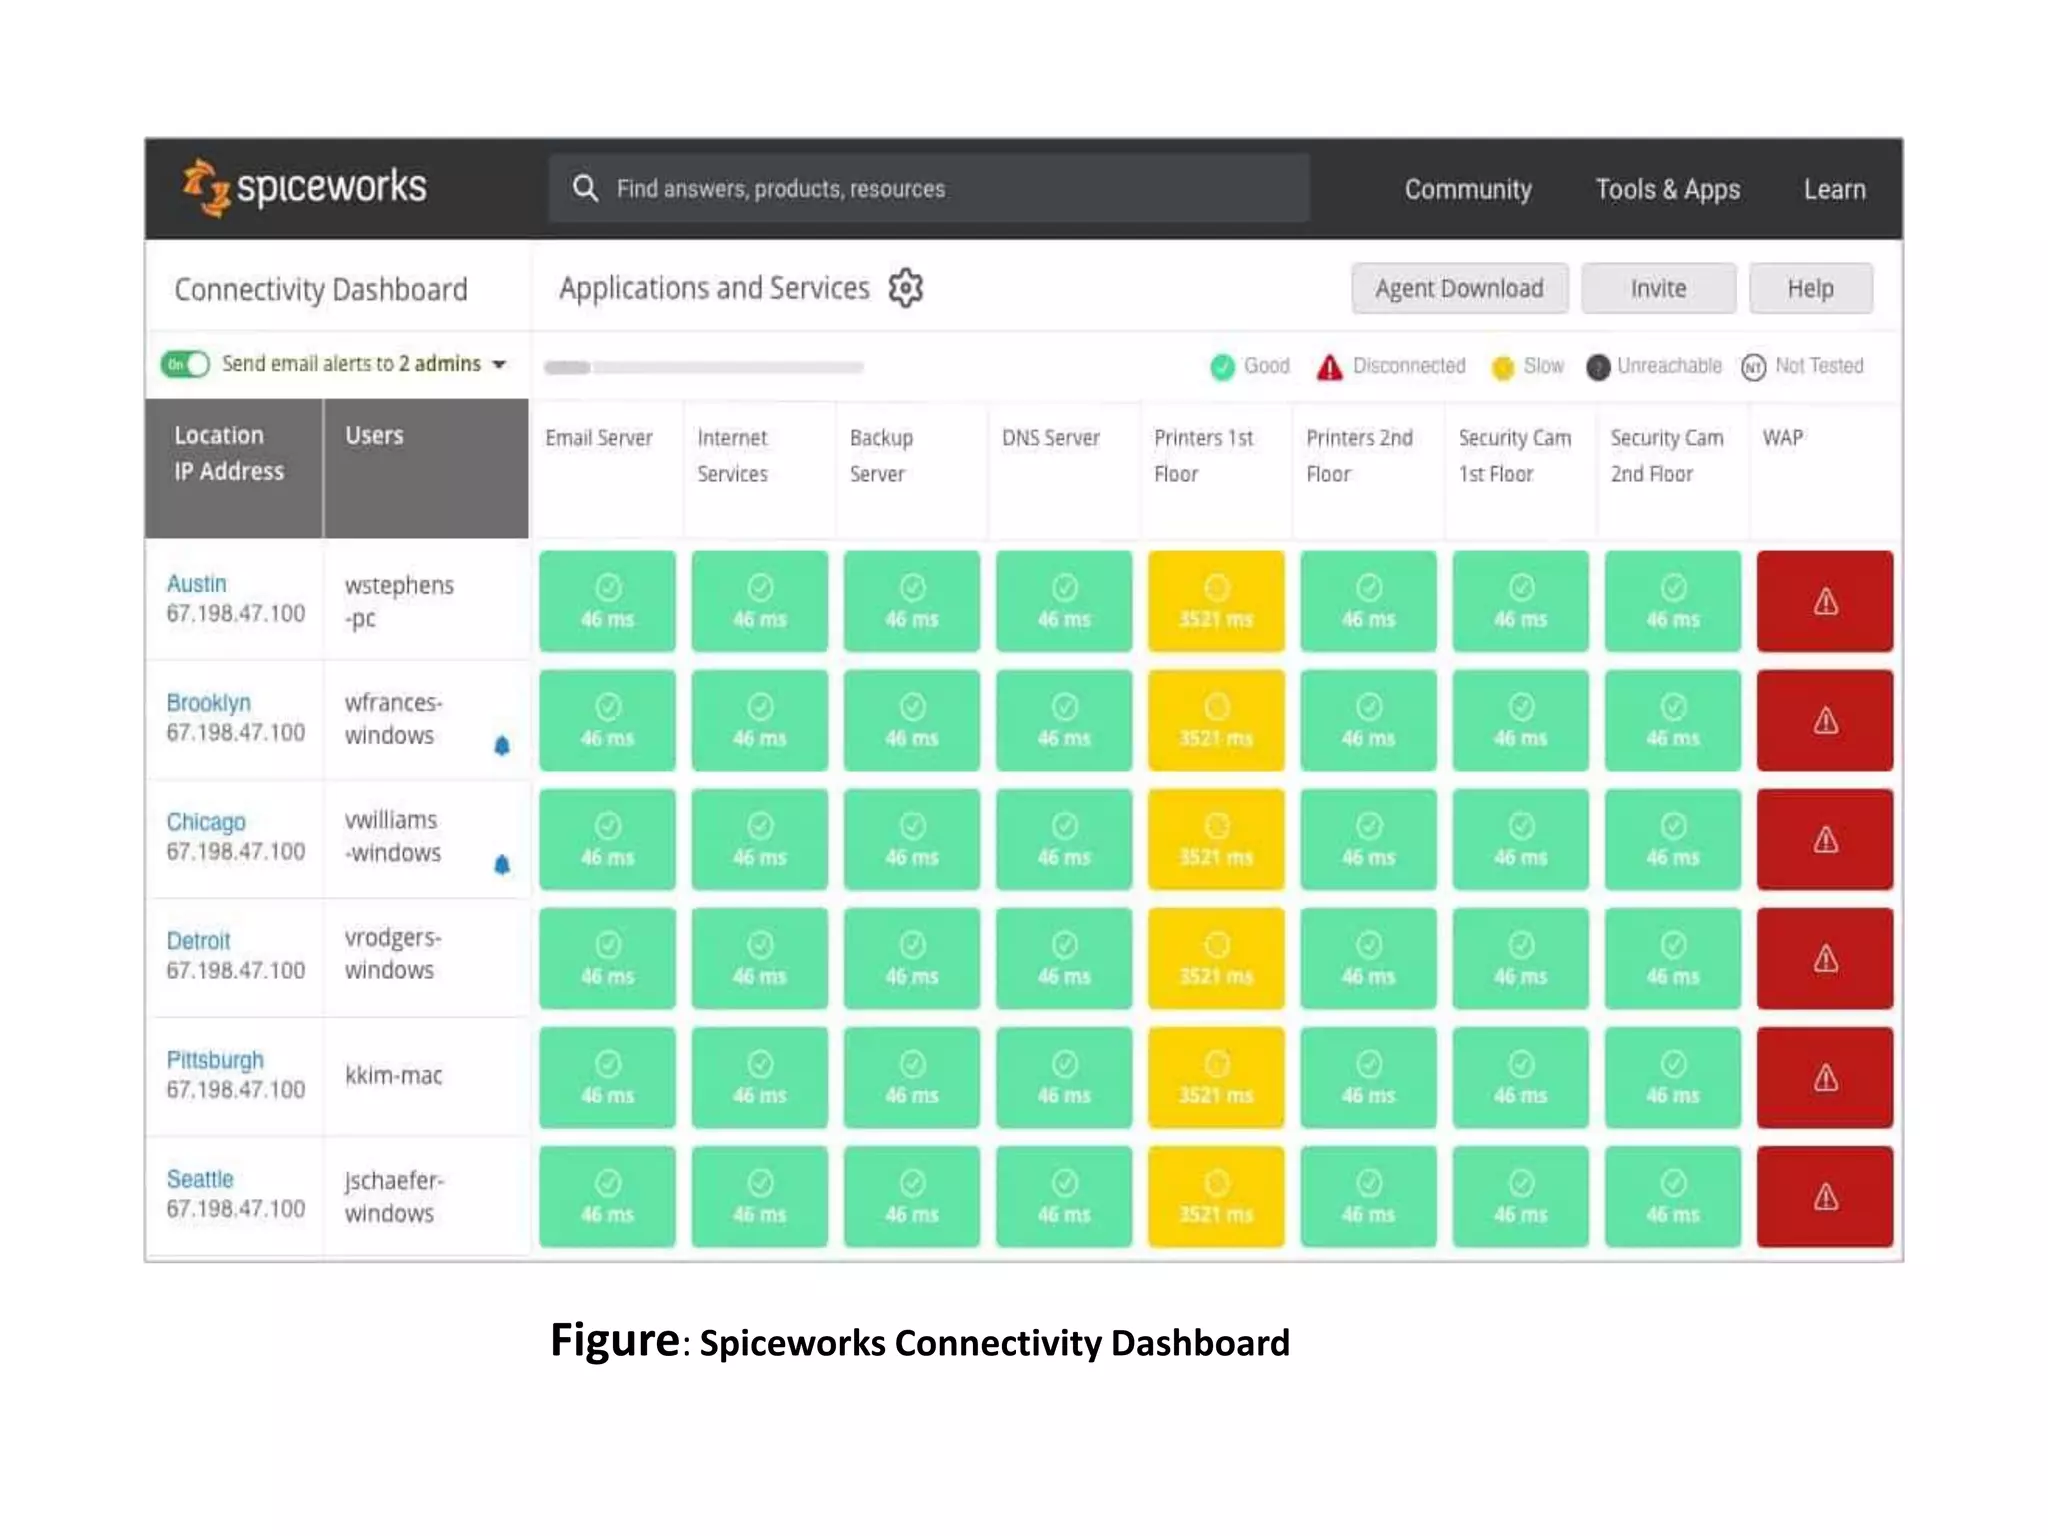
Network Monitoring Tools
 Muhammad Qawar (MIT-18-34)
 Bilal Sajjad (MIT-18-50)
 Muhammad Yaqoob (MIT-18-24)
 Khalil Ali (MIT-18-16)
 Muhammad Rehan (MIT-18-19)
Network Monitoring
• Term network monitoring is widespread throughout
the IT industry.
• Network monitoring is a critical IT process where
• All networking components like routers, switches,
firewalls, servers, and VMs are monitored.
• Fault and performance and evaluated continuously to
maintain and optimize their availability.
• One important aspect of network monitoring is that
finding performance issues and bottlenecks proactively
helps in identifying issues at the initial stage.
• Efficient proactive monitoring can prevent network
downtime or failures.
SNMP
• Simple Network Management Protocol
(SNMP)
– De facto protocol for TCP/IP networks
– Creates a managed network
• Components of SNMP
– SNMP manager
– Managed devices
– Management information bases
SNMP (cont’d.)
• SNMP manager function
– Requests and processes information from
managed devices
• Network management station (NMS)
– Specialized software run by the SNMP manager
• Agent
– Specialized software run by managed devices
Network Monitoring Tools
SolarWinds Network Performance
Monitor
• Comprehensive network performance
monitoring tool monitor the status of devices
with SNMP.
• It can automatically discover network devices
connected to your network.
• Use the dashboard to monitor the availability
and performance of connected network
devices from a holistic perspective.
Key features:
• SNMP monitoring
• Automatically discovers connected network
devices
• Network packet analysis
• Intelligent network maps with NetPath
• Create Wifi heat maps
• Alerts system
• Reports system
Figure: SolarWinds Network Performance Monitor Dashboard
Datadog Network Performance
Monitoring
• It is achieved through a cloud-based SaaS
infrastructure monitoring service.
• As the software for this service is based in the
cloud, you don’t have the worry of
maintaining a server to run the system on.
• The SaaS Datadog system even includes
storage space for the statistics that the
network monitor reaps while constantly
supervising the performance of your network.
Key features
• Scalable, cloud-based service suitable for all
network sizes and topologies
• SNMP-based monitoring with an
autodiscovery feature
• AI-based machine learning that provides
capacity predictions
Figure: Datadog Network Performance Monitoring (Website)
Paessler PRTG Network Monitor
• It is a free network monitoring suite that
uses SNMP, packet sniffing, and WMI to
monitor your network.
• Scan network segments to discover and add
devices to monitor.
• For greater visualization, the tool has
a customizable dashboard.
• Allows to produce real-time network maps of
your infrastructure.
Figure: Datadog Network Performance Monitoring (Website)
Key features
• SNMP monitoring
• Bandwidth monitoring
• Scan for network devices by IP segment
• Custom dashboards
• Threshold-based alerts system
• Reports system
• Customizable network maps
Figure: Paessler PRTG Network Monitor Dashboard
Atera
• Atera is a network monitor designed for use
by managed service providers (MSPs).
• Atera software is a service that is delivered
from the cloud.
• Do not need to maintain your own servers to
run this platform.
• The ability to just log into the system from any
device is very important because Atera
includes a high degree of automation.
Atera (cont’d.)
• The service monitors the client’s network and
only requires human attention when a
problem arises.
• In these instances, Atera generates an
alert and can send those out to the technician
through the mobile app.
• It is based on the Simple Network
Management Protocol (SNMP).
Key features
• All-in-one solution with automatic network
discovery
• Real-time application and network device
monitor
• Powerful reporting, analytics, and alerts
Figure: ATERA Dashboard
Site24x7 Cloud Network Monitoring
System
• It uses SNMP to monitor your network.
• It is very easy to configure.
• Site 24×7 automatically discovers SNMP
devices by IP range.
• From then onwards, the user can use over
4,000 device templates to starting monitoring
out-of-the-gate without configuring
everything from scratch.
Key features
• Automatically discover SNMP devices by IP
range
• Network mapping
• Over 4000 device monitoring templates
• Rest APIs
• Server monitoring
• Website monitoring
Figure: Site24x7 Cloud Network Monitoring System Dashboard
ManageEngine OpManager
• It is a network monitoring solution that can
monitor the performance of network devices,
servers, routers, switches, and virtual machines in
real-time.
• Customizable dashboards provide over 200
widgets for you to create a unique monitoring
experience.
• The alerts system helps you to respond to
performance changes quickly.
• The program sends alerts by email and SMS to
keep you updated on any emerging problems.
Key features
• Automatic discovery
• Network mapping
• SNMP monitoring
• Email and SMS alerts
• Customizable dashboards
Figure: ManageEngine OpManager Monitor Dashboard
Nagios Core
• Open-source network monitor has a web
interface for monitoring network performance.
• Through the user network interface, Can be
monitored Current Network Status with Host
Status Totals and Network Service Status
Totals broken down at the top of the page.
• Track performance events through the alerts
system, which sends out notifications
by email and SMS.
Key features
• Performance dashboard
• Alerts system
• Availability reports
• Capacity planning
• Community-created plugins
• APIs
Figure: Nagios Core Monitor Dashboard
Zabbix
• Zabbix is an open-source network monitor that
combines network, server, cloud, application, and
services monitoring into one unified solution.
• It uses SNMP and IPMP to monitor your network.
• The autodiscovery feature automatically locates
network devices and adds them to be
monitored.
• Zabbix has a notification system.
• Alerts are sent by email, SMS, messenger,
jabber, or custom scripts to update you on
evolving network security events.
Key features
• Autodiscovery feature
• SNMP and IPMP monitoring
• Application monitoring
• Server monitoring
• Network monitoring templates
• Automatic detection of configuration changes
• Alerts system
Figure: ZABBIX Monitor Dashboard
Icinga
• Icinga is an open-source network monitoring
tool that monitors the performance of your
network, cloud-service, and data center.
• The software is web-based and can be configured
through the GUI or with the Domain Specific
Language (DSL).
• Can be loged in to the GUI and use the dashboard
to view an overview of performance
management.
• The dashboard displays whether there are any
problems with performance or availability.
Key features
• Web-based GUI
• DSL configuration available
• Dashboard
• Icinga Modules / Extensions
Figure: icinga Monitor Dashboard
Spiceworks Connectivity Dashboard
• Popular free network monitoring software.
• Through the web-based GUI, you access the
dashboard and monitor the availability of your
network infrastructure in real-time.
• The alerts system lets you know about any
performance fluctuations so you receive
notifications via email.
• It is ideal for smaller enterprises that are looking
for an affordable network performance
monitoring solution.
Key features
• Web-based GUI
• Real-time dashboard
• Graphs
• Email alerts
Figure: Spiceworks Connectivity Dashboard
Thank You

Network monitoring tools

  • 1.
    Network Monitoring Tools Muhammad Qawar (MIT-18-34)  Bilal Sajjad (MIT-18-50)  Muhammad Yaqoob (MIT-18-24)  Khalil Ali (MIT-18-16)  Muhammad Rehan (MIT-18-19)
  • 2.
    Network Monitoring • Termnetwork monitoring is widespread throughout the IT industry. • Network monitoring is a critical IT process where • All networking components like routers, switches, firewalls, servers, and VMs are monitored. • Fault and performance and evaluated continuously to maintain and optimize their availability. • One important aspect of network monitoring is that finding performance issues and bottlenecks proactively helps in identifying issues at the initial stage. • Efficient proactive monitoring can prevent network downtime or failures.
  • 3.
    SNMP • Simple NetworkManagement Protocol (SNMP) – De facto protocol for TCP/IP networks – Creates a managed network • Components of SNMP – SNMP manager – Managed devices – Management information bases
  • 4.
    SNMP (cont’d.) • SNMPmanager function – Requests and processes information from managed devices • Network management station (NMS) – Specialized software run by the SNMP manager • Agent – Specialized software run by managed devices
  • 5.
  • 6.
    SolarWinds Network Performance Monitor •Comprehensive network performance monitoring tool monitor the status of devices with SNMP. • It can automatically discover network devices connected to your network. • Use the dashboard to monitor the availability and performance of connected network devices from a holistic perspective.
  • 7.
    Key features: • SNMPmonitoring • Automatically discovers connected network devices • Network packet analysis • Intelligent network maps with NetPath • Create Wifi heat maps • Alerts system • Reports system
  • 8.
    Figure: SolarWinds NetworkPerformance Monitor Dashboard
  • 9.
    Datadog Network Performance Monitoring •It is achieved through a cloud-based SaaS infrastructure monitoring service. • As the software for this service is based in the cloud, you don’t have the worry of maintaining a server to run the system on. • The SaaS Datadog system even includes storage space for the statistics that the network monitor reaps while constantly supervising the performance of your network.
  • 10.
    Key features • Scalable,cloud-based service suitable for all network sizes and topologies • SNMP-based monitoring with an autodiscovery feature • AI-based machine learning that provides capacity predictions
  • 11.
    Figure: Datadog NetworkPerformance Monitoring (Website)
  • 12.
    Paessler PRTG NetworkMonitor • It is a free network monitoring suite that uses SNMP, packet sniffing, and WMI to monitor your network. • Scan network segments to discover and add devices to monitor. • For greater visualization, the tool has a customizable dashboard. • Allows to produce real-time network maps of your infrastructure. Figure: Datadog Network Performance Monitoring (Website)
  • 13.
    Key features • SNMPmonitoring • Bandwidth monitoring • Scan for network devices by IP segment • Custom dashboards • Threshold-based alerts system • Reports system • Customizable network maps
  • 14.
    Figure: Paessler PRTGNetwork Monitor Dashboard
  • 15.
    Atera • Atera isa network monitor designed for use by managed service providers (MSPs). • Atera software is a service that is delivered from the cloud. • Do not need to maintain your own servers to run this platform. • The ability to just log into the system from any device is very important because Atera includes a high degree of automation.
  • 16.
    Atera (cont’d.) • Theservice monitors the client’s network and only requires human attention when a problem arises. • In these instances, Atera generates an alert and can send those out to the technician through the mobile app. • It is based on the Simple Network Management Protocol (SNMP).
  • 17.
    Key features • All-in-onesolution with automatic network discovery • Real-time application and network device monitor • Powerful reporting, analytics, and alerts
  • 18.
  • 19.
    Site24x7 Cloud NetworkMonitoring System • It uses SNMP to monitor your network. • It is very easy to configure. • Site 24×7 automatically discovers SNMP devices by IP range. • From then onwards, the user can use over 4,000 device templates to starting monitoring out-of-the-gate without configuring everything from scratch.
  • 20.
    Key features • Automaticallydiscover SNMP devices by IP range • Network mapping • Over 4000 device monitoring templates • Rest APIs • Server monitoring • Website monitoring
  • 21.
    Figure: Site24x7 CloudNetwork Monitoring System Dashboard
  • 22.
    ManageEngine OpManager • Itis a network monitoring solution that can monitor the performance of network devices, servers, routers, switches, and virtual machines in real-time. • Customizable dashboards provide over 200 widgets for you to create a unique monitoring experience. • The alerts system helps you to respond to performance changes quickly. • The program sends alerts by email and SMS to keep you updated on any emerging problems.
  • 23.
    Key features • Automaticdiscovery • Network mapping • SNMP monitoring • Email and SMS alerts • Customizable dashboards
  • 24.
  • 25.
    Nagios Core • Open-sourcenetwork monitor has a web interface for monitoring network performance. • Through the user network interface, Can be monitored Current Network Status with Host Status Totals and Network Service Status Totals broken down at the top of the page. • Track performance events through the alerts system, which sends out notifications by email and SMS.
  • 26.
    Key features • Performancedashboard • Alerts system • Availability reports • Capacity planning • Community-created plugins • APIs
  • 27.
    Figure: Nagios CoreMonitor Dashboard
  • 28.
    Zabbix • Zabbix isan open-source network monitor that combines network, server, cloud, application, and services monitoring into one unified solution. • It uses SNMP and IPMP to monitor your network. • The autodiscovery feature automatically locates network devices and adds them to be monitored. • Zabbix has a notification system. • Alerts are sent by email, SMS, messenger, jabber, or custom scripts to update you on evolving network security events.
  • 29.
    Key features • Autodiscoveryfeature • SNMP and IPMP monitoring • Application monitoring • Server monitoring • Network monitoring templates • Automatic detection of configuration changes • Alerts system
  • 30.
  • 31.
    Icinga • Icinga isan open-source network monitoring tool that monitors the performance of your network, cloud-service, and data center. • The software is web-based and can be configured through the GUI or with the Domain Specific Language (DSL). • Can be loged in to the GUI and use the dashboard to view an overview of performance management. • The dashboard displays whether there are any problems with performance or availability.
  • 32.
    Key features • Web-basedGUI • DSL configuration available • Dashboard • Icinga Modules / Extensions
  • 33.
  • 34.
    Spiceworks Connectivity Dashboard •Popular free network monitoring software. • Through the web-based GUI, you access the dashboard and monitor the availability of your network infrastructure in real-time. • The alerts system lets you know about any performance fluctuations so you receive notifications via email. • It is ideal for smaller enterprises that are looking for an affordable network performance monitoring solution.
  • 35.
    Key features • Web-basedGUI • Real-time dashboard • Graphs • Email alerts
  • 36.
  • 37.