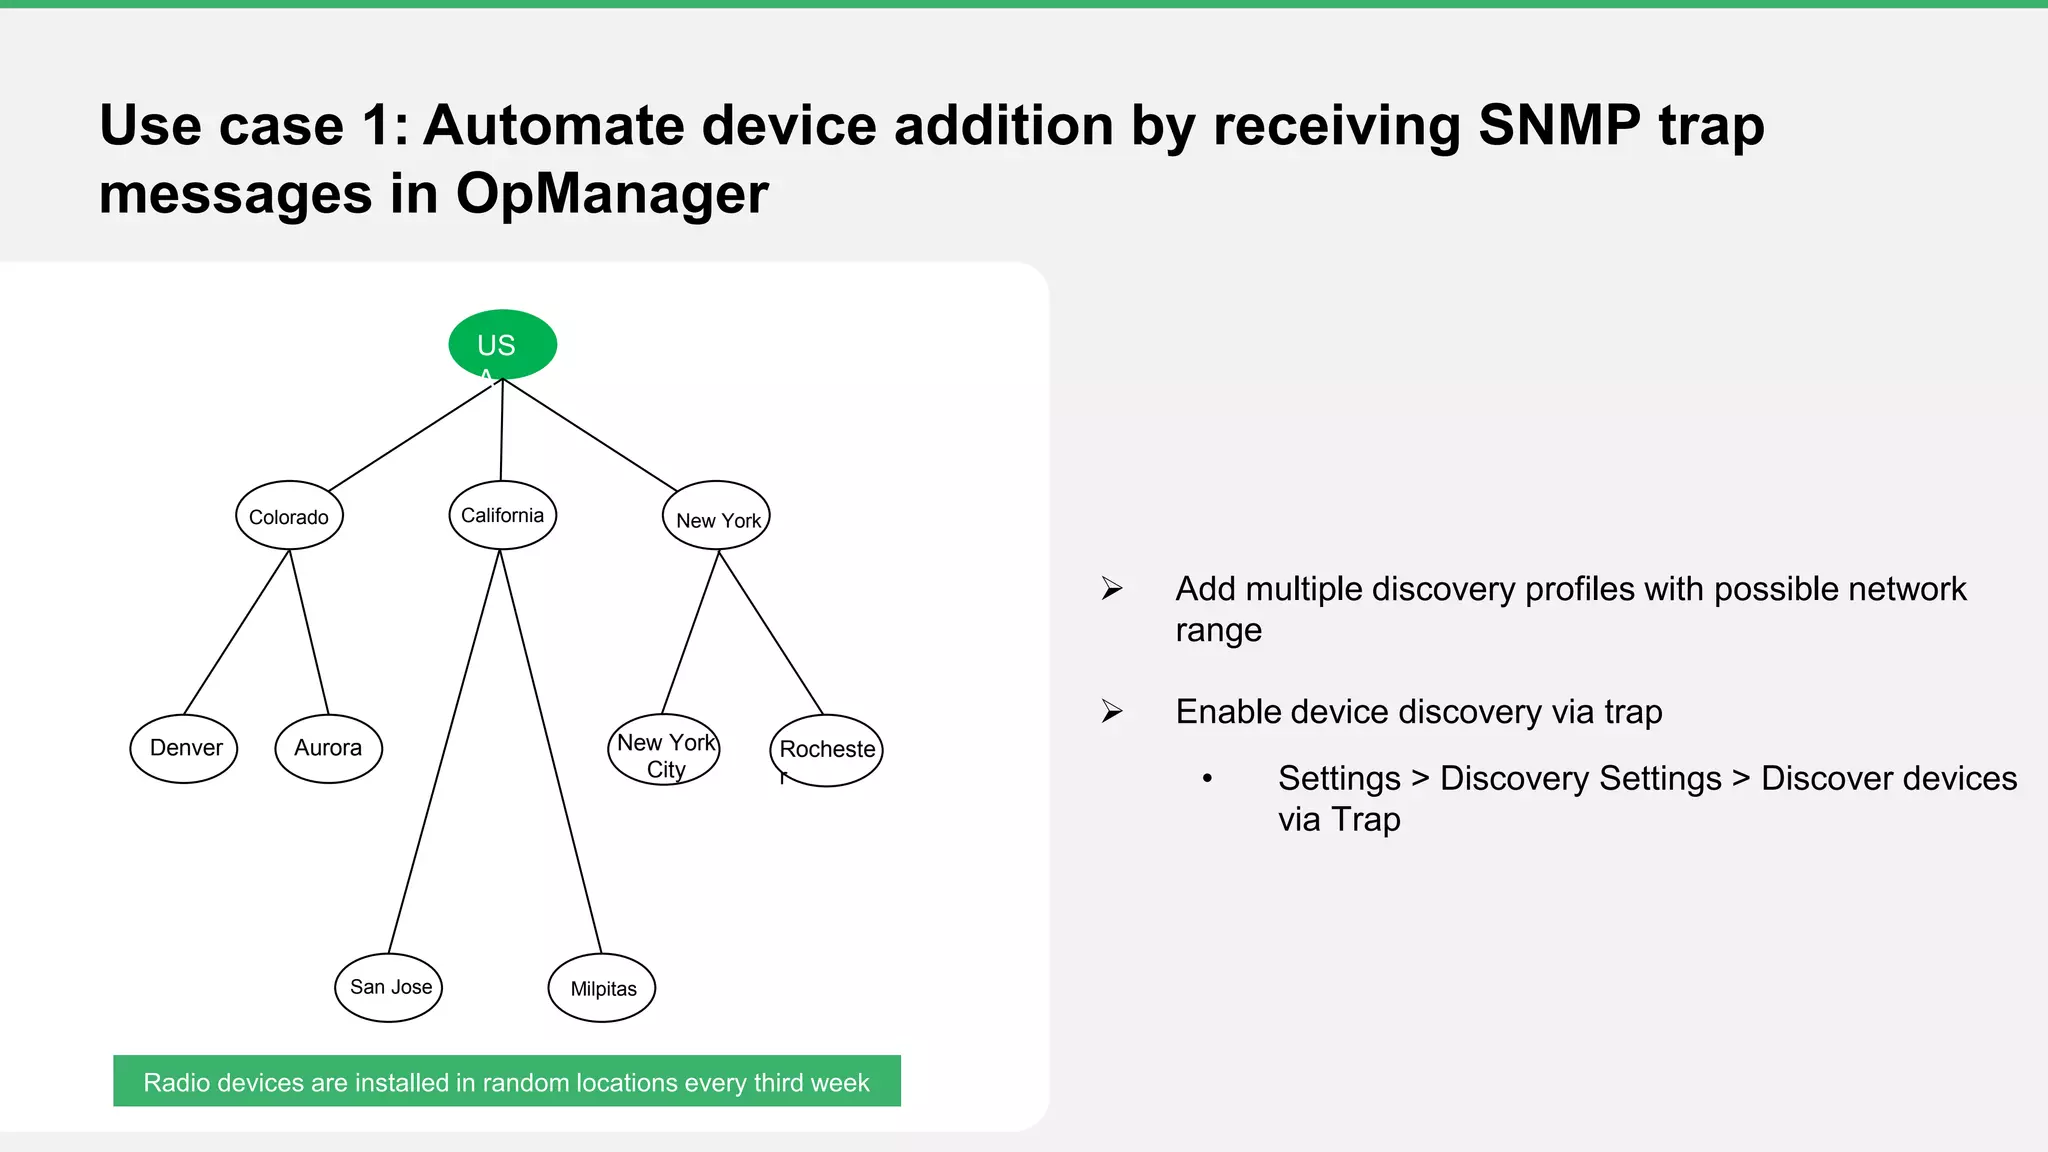
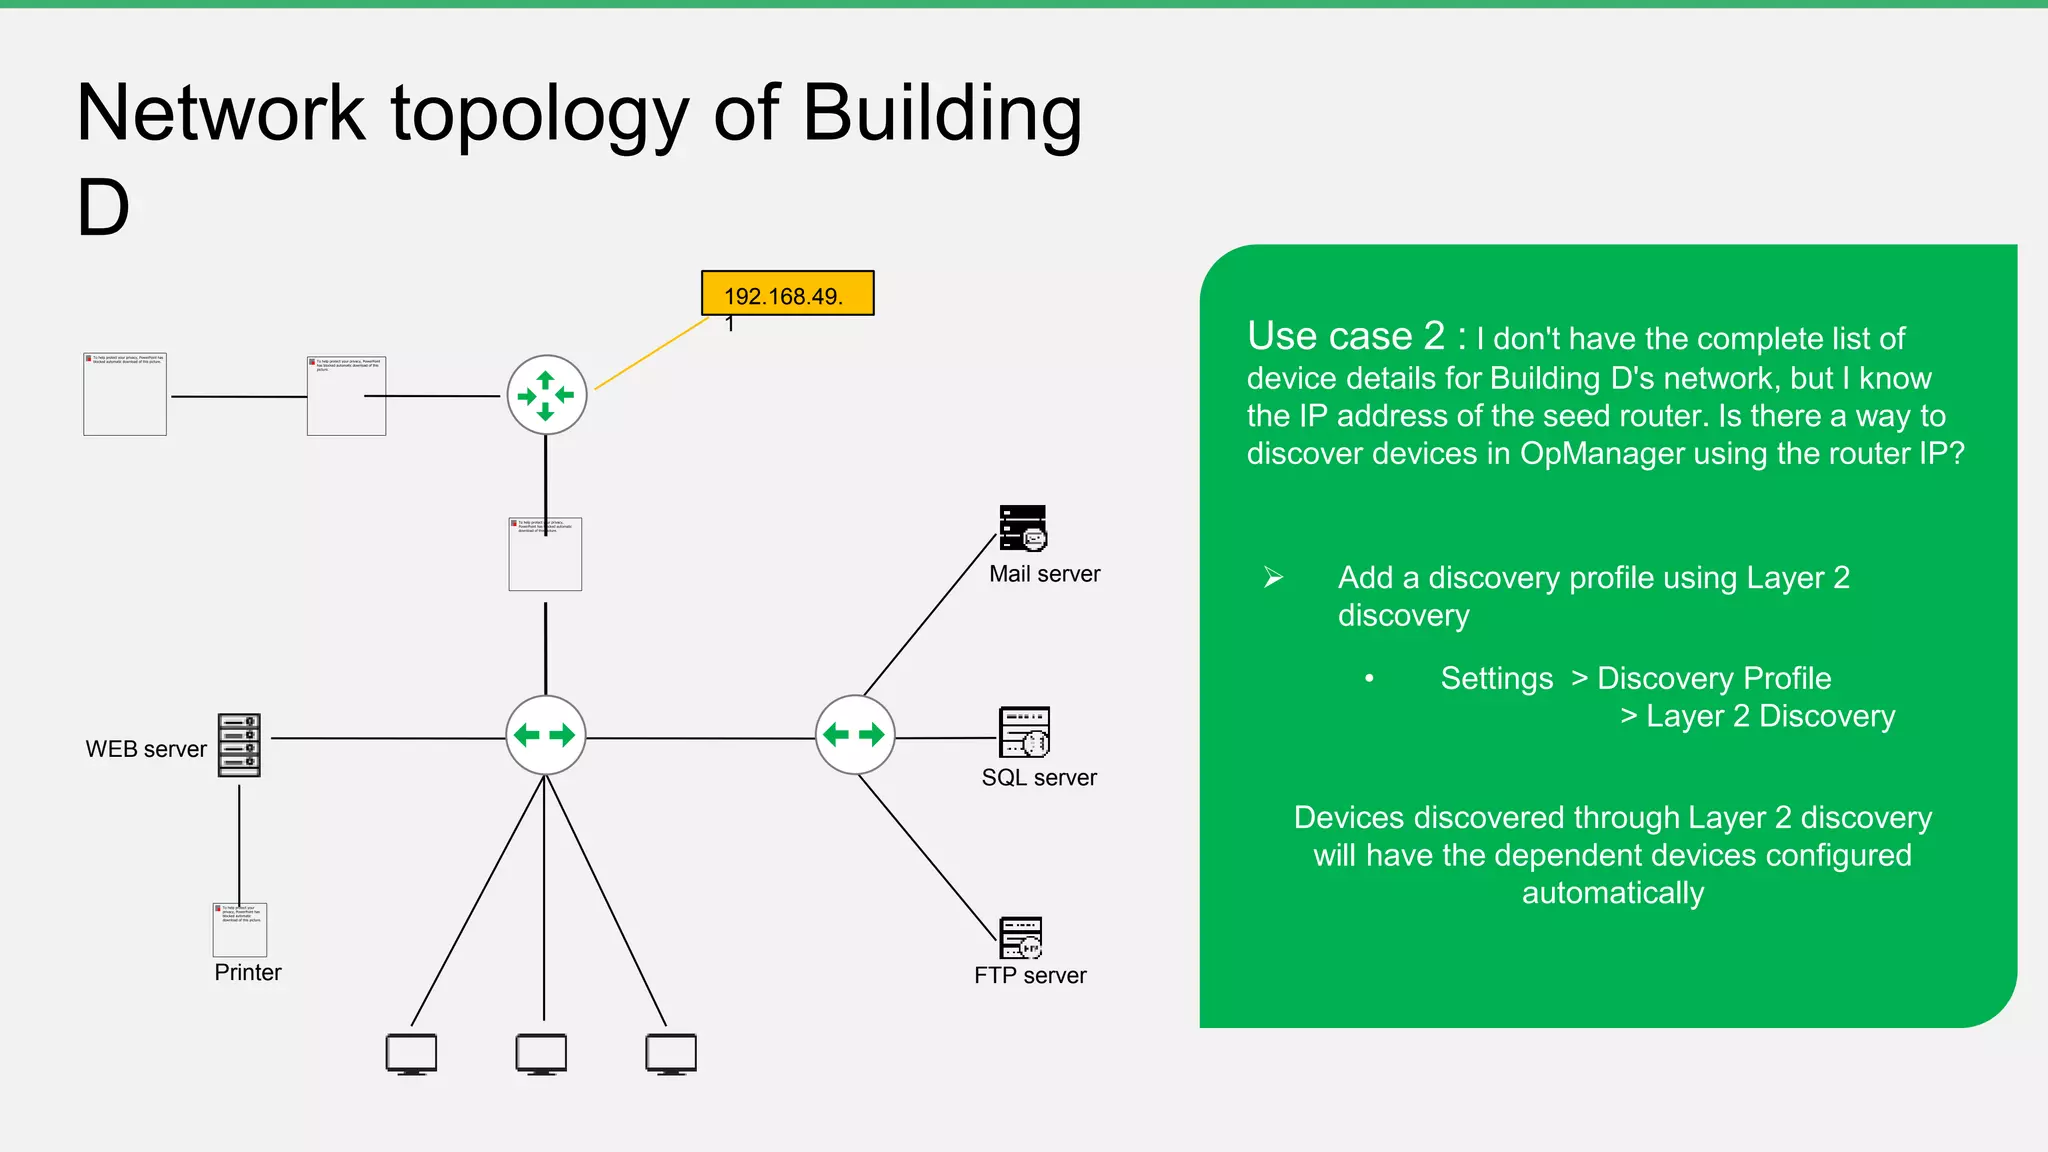
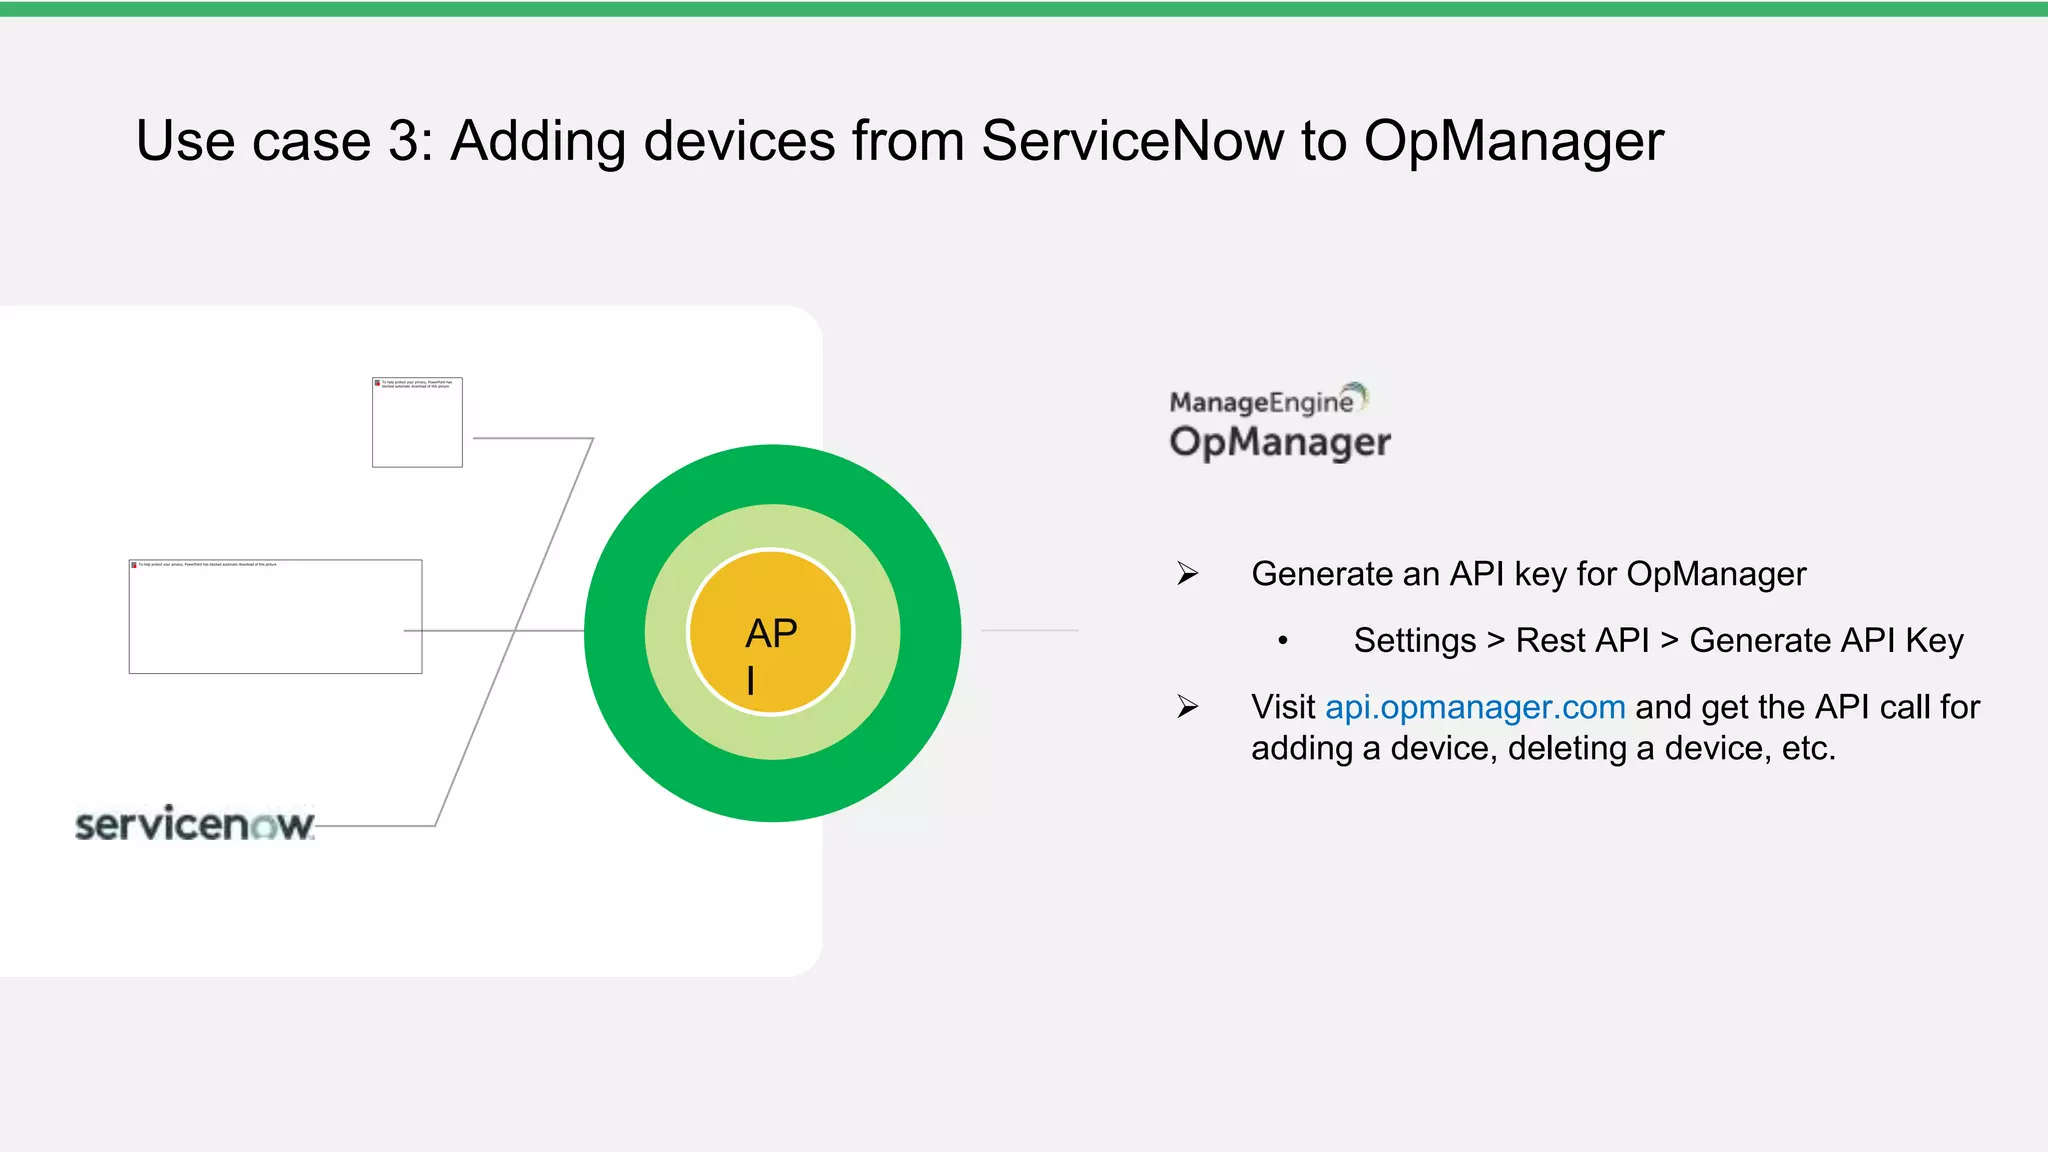
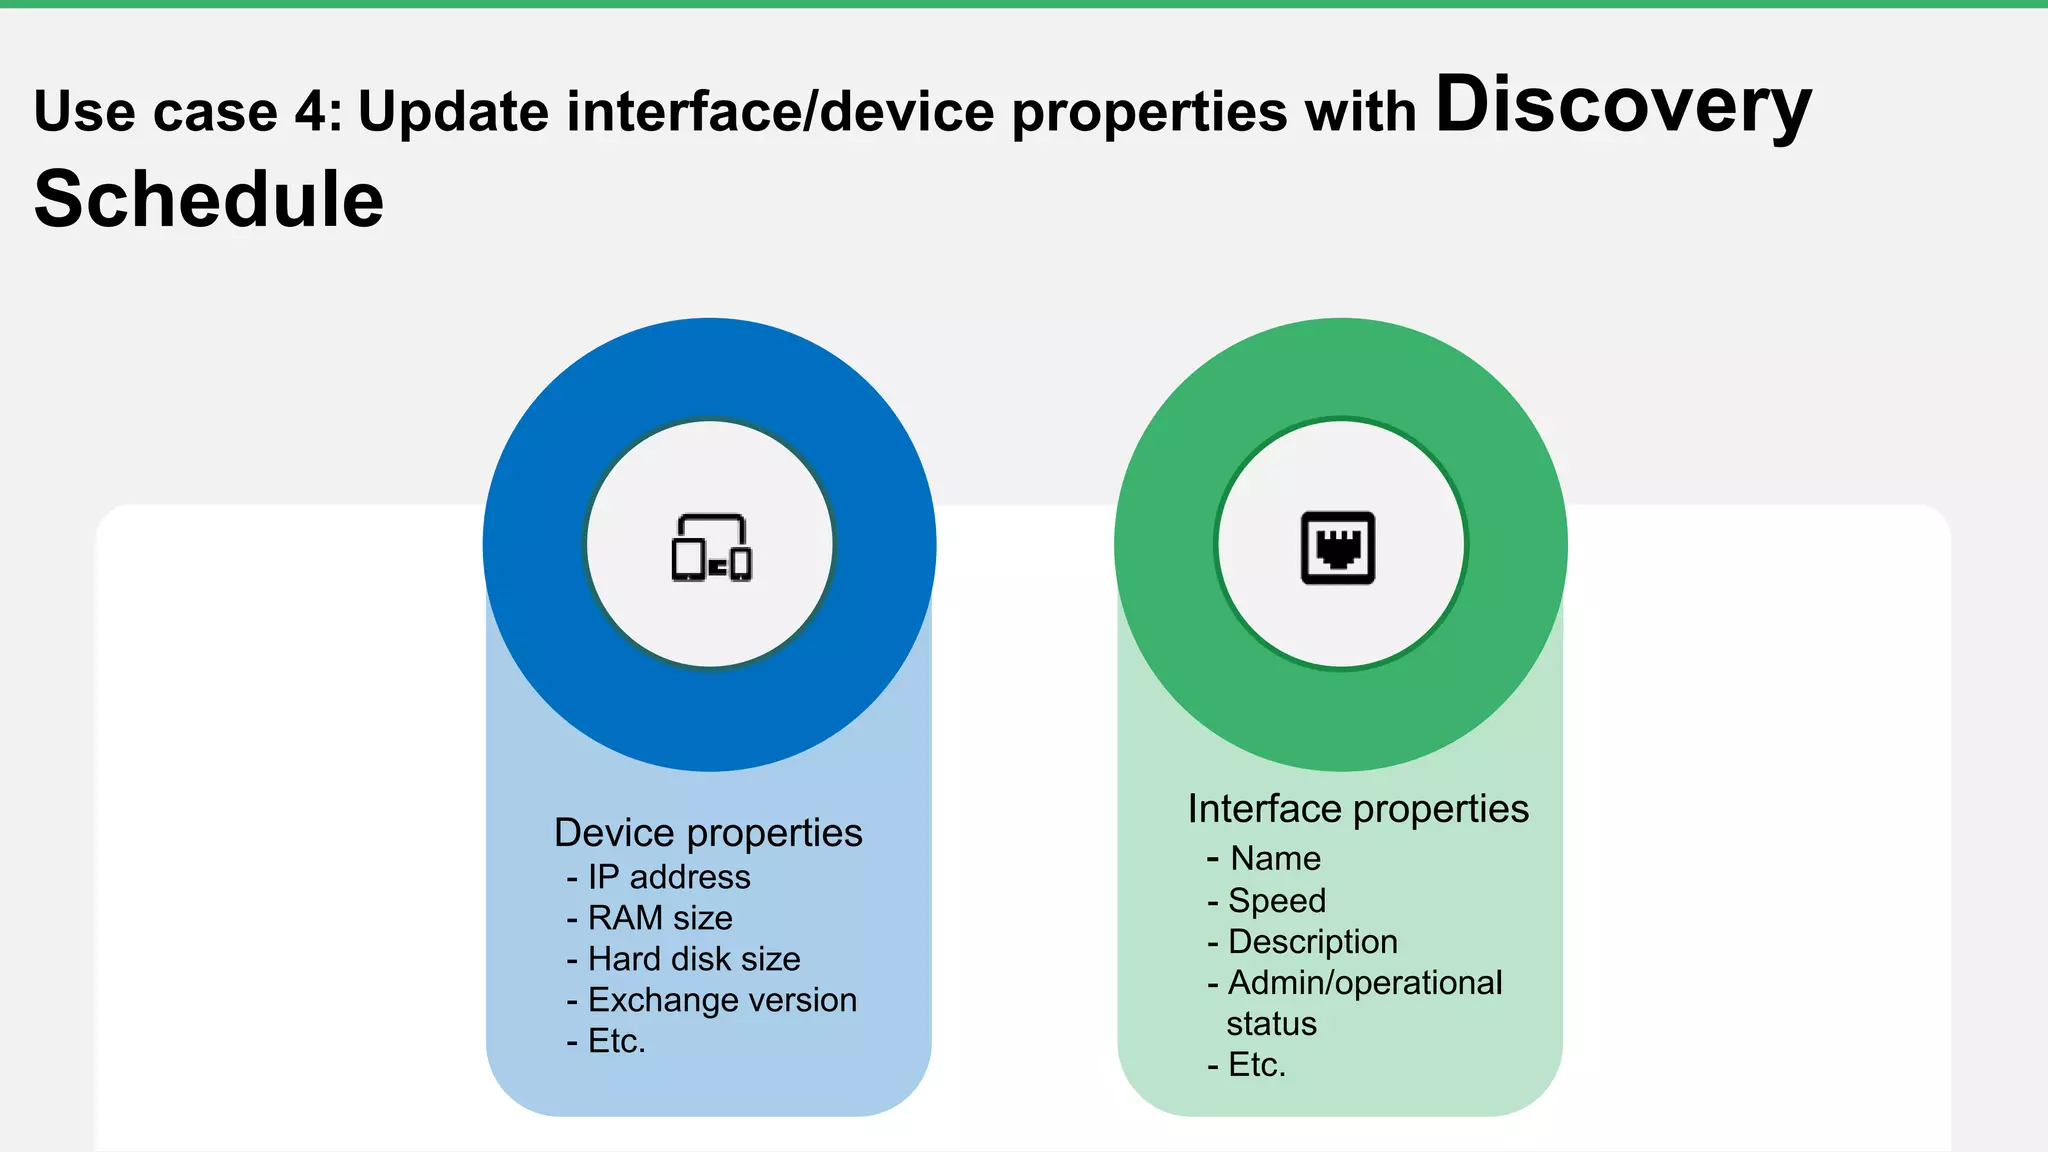
Tips and tricks to monitor your network efficiently.
Through this training, learn more about:
1) Monitoring device availability
2) Monitoring server performance
3) Monitoring virtual server performance
4) Creating custom WMI monitor
5) Script monitoring
6) Troubleshooting tips
Tips and tricks to monitor your network efficiently.
Through this training, learn more about:
1) Alarm severity levels
2) Threshold violation alarms
3) Other alarms : VMWare, Eventlogs, SNMP traps and Syslogs
Notifications
4) Using an IT workflow to remediate problems
Having trouble with IP's and switches?
Overcome these troubles with ManageEngine OpUtils
Learn more about
- IP address and switch port management
-Rogue device detection
-Bandwidth monitor and config file manager
- Troubleshooting tools
Tips and tricks to monitor your network efficiently.
Through this training, learn more about:
1) Monitoring device availability
2) Monitoring server performance
3) Monitoring virtual server performance
4) Creating custom WMI monitor
5) Script monitoring
6) Troubleshooting tips
Tips and tricks to monitor your network efficiently.
Through this training, learn more about:
1) Alarm severity levels
2) Threshold violation alarms
3) Other alarms : VMWare, Eventlogs, SNMP traps and Syslogs
Notifications
4) Using an IT workflow to remediate problems
Having trouble with IP's and switches?
Overcome these troubles with ManageEngine OpUtils
Learn more about
- IP address and switch port management
-Rogue device detection
-Bandwidth monitor and config file manager
- Troubleshooting tools
Learn about the following topics:
1) Monitoring the availability of network devices that are ping-able or SNMP enabled. Also, learn how to monitor the performance metrics of these devices.
2) Creating custom WMI monitors.
3) Creating scripts to monitor performance metrics that are not available in the OID.
4) Monitoring the log files and folders based on its content, size, etc.
Manage physical and virtual servers with OpManager. Monitor availability, health and performance while simultaneously planning for capacity and better resorce allocation.
This is the first part of our Free Training series.
The first step in monitoring your network and devices is to add them to your NMS. This training session covers how to add devices to OpManager.
Learn how to discover devices into NCM, automate & schedule configuration backups, real time change detection, & face network disasters with baseline configuration, startup-running config sync & export config.
Snmp Opc Server from Transcend Automationguestd1aebad0
SNMP OPC Server will let your automation system both monitor and manage your automation infrastructure. In addition to monitoring your PLCs and Field Devices, you will be able to communicate with all the pieces that make up your automation network, the backbone of your plant.
Top 5 server performance problems and how to resolve them using OpManagerManageEngine
Top 5 server performance problems and how to resolve them
Know the most common server performance problems and how to overcome these using OpManager viz..
# High Resource usage
# Virtualization monitoring and management
# Poor application or service component performance and more...
www.opmanager.com - The network monitoring software from ManageEngine
Learn how to track the user experience of your web applications across multiple geographical locations. Measure and understand the ways customers interact with your software. Discover the basic skills and information needed to get the most out of your synthetic monitoring.
NetFlow Analyzer lets you capture and analyze your entire network traffic. Learn how to visualize traffic details such as speed, volume, packets, and utilization with the help of our network traffic analyzer. FREE TRIAL -https://www.manageengine.com/products/netflow/download.html
This presentation gives a general overview of basic SNMP operations and troubleshooting SNMP issues. This presentation is the second of a three part series - SNMP Demystified.
Module 9: Increasing Security for Network Communication
Internet Protocol security (IPsec) is a framework of open standards for protecting communications over IP networks through cryptographic security services. IPsec supports network-level peer authentication, data-origin authentication, data integrity, data confidentiality (encryption), and replay protection. The Microsoft IPsec implementation is based on standards that the Internet Engineering Task Force (IETF) IPsec working group developed. In this module, you will learn how to implement, configure, and troubleshoot IPsec.
Lessons
Overview of IPsec
Configuring Connection Security Rules
Configuring NAP with IPsec Enforcement
Monitoring and Troubleshooting IPsec
Lab : Increasing Security for Network Communication
Selecting a Network Security Configuration
Configuring IPsec to Authenticate Computers
Testing IPsec Authentication
After completing this module, students will be able to:
Describe when and how to use IPsec.
Configure Connection Security rules.
Configure IPsec with NAP Enforcement.
Describe how to monitor and troubleshoot IPsec.
Free OpManager Training:
Part 1 - Discovery & Classification:
The first step in network monitoring is to discover and add devices to your network monitoring tool. Learn how to discover and add devices in OpManager, an integrated network monitoring & management tool.
Register here to attend the other sessions of our free OpManager training series.
https://www.manageengine.com/itom/free-training/?prd=opm-register
Learn the methods of device discovery and classification in OpManager, the network monitoring software. Learn more from https://www.manageengine.com/network-monitoring/
In this presentation, you'll learn on:
Monitoring network performance
Monitoring hardware sensor
Creating custom SNMP monitor
Monitoring WAN and VOIP links
Network reports
Troubleshooting tips
SNMP OPC Server from Transcend AutomationBaiju P.S.
SNMP OPC Server will let your automation system both monitor and manage your automation infrastructure. In addition to monitoring your PLCs and Field Devices, you will be able to communicate with all the pieces that make up your automation network, the backbone of your plant.
Transcend Automation is the Authorized business partners for Kepware Technologies. We Market ,Promote, Integrate their products for customers in India
In this session we'll see how to configure the thresholds for each parameter, the violation alarms, notifications for each violation criteria and IT workflows & Automation for repetitive tasks.
The objective of this OpManager POC is to provide step-by-step instructions about how to set up a stand-alone OpManager environment to be used for demonstrating the functions and features of
the products, using customer data, infrastructure and workloads.
OpManager is an integrated network management tool that helps you monitor your network, physical & virtual servers, bandwidth, configurations, firewall, switch ports and IP addresses
In this presentation, learn how to configure the thresholds for each parameter, the violation alarms, notifications for each violation criteria and IT workflows & Automation for repetitive tasks.
OpManager is integrated network management software that offers network monitoring, server monitoring, bandwidth analysis, configuration management, firewall log analysis, and IP & switch port management.
Positive Hack Days. Pavlov. Network Infrastructure Security AssessmentPositive Hack Days
A participant will acquire basic skills of searching for vulnerabilities on switches and routers from various vendors. The masterclass will cover both common network vulnerabilities, and exceptive cases that can be detected in the process of security assessment of real networks.
I'm talking about how Ansible helps Backbase establish testing pipeline to ensure the quality of Customer Experience Platform - the leading horizontal portal software. This is done by utilizing the concept of immutable infrastructure to provision on-demand infrastructure use it and the dispose.
Application Performance Troubleshooting 1x1 - Part 2 - Noch mehr Schweine und...rschuppe
Application Performance doesn't come easy. How to find the root cause of performance issues in modern and complex applications? All you have is a complaining user to start with?
In this presentation (mainly in German, but understandable for english speakers) I'd reprised the fundamentals of trouble shooting and have some new examples on how to tackle issues.
Follow up presentation to "Performance Trouble Shooting 101 - Schweine, Schlangen und Papierschnitte"
Similar to Free OpManager training Part1- Discovery and classification season#3 (20)
Learn how analyzing key website metrics that are related to user interactions will help you make insightful improvements. Understand how replaying individual customer transactions and analyzing every element of your webpage will help drill down to the root causes issues and create better content strategies respectively.
Learn how to how to monitor and gain code-level insights into the performance of your Java, Node.js, PHP, and .NET Core applications in real-time with the help of ManageEngine Applications Manager.
Get a complete overview of NetFlow Analyzer. Learn about the basic initial settings, configuration, customization, alerts, reports, and the various other features of the product.
Learn how to monitor the operational status of servers and virtual machines across an organization's IT infrastructure, track the status of critical metrics, tackle hardware problems, and optimize resource allocation effectively with ManageEngine Applications Manager.
Learn the various advanced monitoring, customization, troubleshooting and security features in Netflow Analyzer.
Agenda:
-Troubleshooting with forensics and ASAM
-Reporting and automation
-Traffic shaping
-Distributed Monitoring
Learn how to track key operational metrics of your Node.js and PHP infrastructure in real-time and get insight into the nuances of autonomous databases.
NetFlow Analyzer captures flow data and monitors interface bandwidth usage in real-time. This product overview will help you get the most out of NetFlow Analyzer.
LF Energy Webinar: Electrical Grid Modelling and Simulation Through PowSyBl -...DanBrown980551
Do you want to learn how to model and simulate an electrical network from scratch in under an hour?
Then welcome to this PowSyBl workshop, hosted by Rte, the French Transmission System Operator (TSO)!
During the webinar, you will discover the PowSyBl ecosystem as well as handle and study an electrical network through an interactive Python notebook.
PowSyBl is an open source project hosted by LF Energy, which offers a comprehensive set of features for electrical grid modelling and simulation. Among other advanced features, PowSyBl provides:
- A fully editable and extendable library for grid component modelling;
- Visualization tools to display your network;
- Grid simulation tools, such as power flows, security analyses (with or without remedial actions) and sensitivity analyses;
The framework is mostly written in Java, with a Python binding so that Python developers can access PowSyBl functionalities as well.
What you will learn during the webinar:
- For beginners: discover PowSyBl's functionalities through a quick general presentation and the notebook, without needing any expert coding skills;
- For advanced developers: master the skills to efficiently apply PowSyBl functionalities to your real-world scenarios.
Transcript: Selling digital books in 2024: Insights from industry leaders - T...BookNet Canada
The publishing industry has been selling digital audiobooks and ebooks for over a decade and has found its groove. What’s changed? What has stayed the same? Where do we go from here? Join a group of leading sales peers from across the industry for a conversation about the lessons learned since the popularization of digital books, best practices, digital book supply chain management, and more.
Link to video recording: https://bnctechforum.ca/sessions/selling-digital-books-in-2024-insights-from-industry-leaders/
Presented by BookNet Canada on May 28, 2024, with support from the Department of Canadian Heritage.
JMeter webinar - integration with InfluxDB and GrafanaRTTS
Watch this recorded webinar about real-time monitoring of application performance. See how to integrate Apache JMeter, the open-source leader in performance testing, with InfluxDB, the open-source time-series database, and Grafana, the open-source analytics and visualization application.
In this webinar, we will review the benefits of leveraging InfluxDB and Grafana when executing load tests and demonstrate how these tools are used to visualize performance metrics.
Length: 30 minutes
Session Overview
-------------------------------------------
During this webinar, we will cover the following topics while demonstrating the integrations of JMeter, InfluxDB and Grafana:
- What out-of-the-box solutions are available for real-time monitoring JMeter tests?
- What are the benefits of integrating InfluxDB and Grafana into the load testing stack?
- Which features are provided by Grafana?
- Demonstration of InfluxDB and Grafana using a practice web application
To view the webinar recording, go to:
https://www.rttsweb.com/jmeter-integration-webinar
Smart TV Buyer Insights Survey 2024 by 91mobiles.pdf91mobiles
91mobiles recently conducted a Smart TV Buyer Insights Survey in which we asked over 3,000 respondents about the TV they own, aspects they look at on a new TV, and their TV buying preferences.
Accelerate your Kubernetes clusters with Varnish CachingThijs Feryn
A presentation about the usage and availability of Varnish on Kubernetes. This talk explores the capabilities of Varnish caching and shows how to use the Varnish Helm chart to deploy it to Kubernetes.
This presentation was delivered at K8SUG Singapore. See https://feryn.eu/presentations/accelerate-your-kubernetes-clusters-with-varnish-caching-k8sug-singapore-28-2024 for more details.
Software Delivery At the Speed of AI: Inflectra Invests In AI-Powered QualityInflectra
In this insightful webinar, Inflectra explores how artificial intelligence (AI) is transforming software development and testing. Discover how AI-powered tools are revolutionizing every stage of the software development lifecycle (SDLC), from design and prototyping to testing, deployment, and monitoring.
Learn about:
• The Future of Testing: How AI is shifting testing towards verification, analysis, and higher-level skills, while reducing repetitive tasks.
• Test Automation: How AI-powered test case generation, optimization, and self-healing tests are making testing more efficient and effective.
• Visual Testing: Explore the emerging capabilities of AI in visual testing and how it's set to revolutionize UI verification.
• Inflectra's AI Solutions: See demonstrations of Inflectra's cutting-edge AI tools like the ChatGPT plugin and Azure Open AI platform, designed to streamline your testing process.
Whether you're a developer, tester, or QA professional, this webinar will give you valuable insights into how AI is shaping the future of software delivery.
Elevating Tactical DDD Patterns Through Object CalisthenicsDorra BARTAGUIZ
After immersing yourself in the blue book and its red counterpart, attending DDD-focused conferences, and applying tactical patterns, you're left with a crucial question: How do I ensure my design is effective? Tactical patterns within Domain-Driven Design (DDD) serve as guiding principles for creating clear and manageable domain models. However, achieving success with these patterns requires additional guidance. Interestingly, we've observed that a set of constraints initially designed for training purposes remarkably aligns with effective pattern implementation, offering a more ‘mechanical’ approach. Let's explore together how Object Calisthenics can elevate the design of your tactical DDD patterns, offering concrete help for those venturing into DDD for the first time!
Essentials of Automations: Optimizing FME Workflows with ParametersSafe Software
Are you looking to streamline your workflows and boost your projects’ efficiency? Do you find yourself searching for ways to add flexibility and control over your FME workflows? If so, you’re in the right place.
Join us for an insightful dive into the world of FME parameters, a critical element in optimizing workflow efficiency. This webinar marks the beginning of our three-part “Essentials of Automation” series. This first webinar is designed to equip you with the knowledge and skills to utilize parameters effectively: enhancing the flexibility, maintainability, and user control of your FME projects.
Here’s what you’ll gain:
- Essentials of FME Parameters: Understand the pivotal role of parameters, including Reader/Writer, Transformer, User, and FME Flow categories. Discover how they are the key to unlocking automation and optimization within your workflows.
- Practical Applications in FME Form: Delve into key user parameter types including choice, connections, and file URLs. Allow users to control how a workflow runs, making your workflows more reusable. Learn to import values and deliver the best user experience for your workflows while enhancing accuracy.
- Optimization Strategies in FME Flow: Explore the creation and strategic deployment of parameters in FME Flow, including the use of deployment and geometry parameters, to maximize workflow efficiency.
- Pro Tips for Success: Gain insights on parameterizing connections and leveraging new features like Conditional Visibility for clarity and simplicity.
We’ll wrap up with a glimpse into future webinars, followed by a Q&A session to address your specific questions surrounding this topic.
Don’t miss this opportunity to elevate your FME expertise and drive your projects to new heights of efficiency.
Encryption in Microsoft 365 - ExpertsLive Netherlands 2024Albert Hoitingh
In this session I delve into the encryption technology used in Microsoft 365 and Microsoft Purview. Including the concepts of Customer Key and Double Key Encryption.
Epistemic Interaction - tuning interfaces to provide information for AI supportAlan Dix
Paper presented at SYNERGY workshop at AVI 2024, Genoa, Italy. 3rd June 2024
https://alandix.com/academic/papers/synergy2024-epistemic/
As machine learning integrates deeper into human-computer interactions, the concept of epistemic interaction emerges, aiming to refine these interactions to enhance system adaptability. This approach encourages minor, intentional adjustments in user behaviour to enrich the data available for system learning. This paper introduces epistemic interaction within the context of human-system communication, illustrating how deliberate interaction design can improve system understanding and adaptation. Through concrete examples, we demonstrate the potential of epistemic interaction to significantly advance human-computer interaction by leveraging intuitive human communication strategies to inform system design and functionality, offering a novel pathway for enriching user-system engagements.
Neuro-symbolic is not enough, we need neuro-*semantic*Frank van Harmelen
Neuro-symbolic (NeSy) AI is on the rise. However, simply machine learning on just any symbolic structure is not sufficient to really harvest the gains of NeSy. These will only be gained when the symbolic structures have an actual semantics. I give an operational definition of semantics as “predictable inference”.
All of this illustrated with link prediction over knowledge graphs, but the argument is general.
UiPath Test Automation using UiPath Test Suite series, part 3DianaGray10
Welcome to UiPath Test Automation using UiPath Test Suite series part 3. In this session, we will cover desktop automation along with UI automation.
Topics covered:
UI automation Introduction,
UI automation Sample
Desktop automation flow
Pradeep Chinnala, Senior Consultant Automation Developer @WonderBotz and UiPath MVP
Deepak Rai, Automation Practice Lead, Boundaryless Group and UiPath MVP
State of ICS and IoT Cyber Threat Landscape Report 2024 previewPrayukth K V
The IoT and OT threat landscape report has been prepared by the Threat Research Team at Sectrio using data from Sectrio, cyber threat intelligence farming facilities spread across over 85 cities around the world. In addition, Sectrio also runs AI-based advanced threat and payload engagement facilities that serve as sinks to attract and engage sophisticated threat actors, and newer malware including new variants and latent threats that are at an earlier stage of development.
The latest edition of the OT/ICS and IoT security Threat Landscape Report 2024 also covers:
State of global ICS asset and network exposure
Sectoral targets and attacks as well as the cost of ransom
Global APT activity, AI usage, actor and tactic profiles, and implications
Rise in volumes of AI-powered cyberattacks
Major cyber events in 2024
Malware and malicious payload trends
Cyberattack types and targets
Vulnerability exploit attempts on CVEs
Attacks on counties – USA
Expansion of bot farms – how, where, and why
In-depth analysis of the cyber threat landscape across North America, South America, Europe, APAC, and the Middle East
Why are attacks on smart factories rising?
Cyber risk predictions
Axis of attacks – Europe
Systemic attacks in the Middle East
Download the full report from here:
https://sectrio.com/resources/ot-threat-landscape-reports/sectrio-releases-ot-ics-and-iot-security-threat-landscape-report-2024/
6. Agenda
• Prerequisites for installing OpManager
• Understanding network infrastructure
• Challenges of device discovery
• 5 important steps to simplify the discovery process in OpManager
• Real-life use cases
7. Prerequisites for installing OpManager: System requirements
Quad-core
processor or higher
• MSSQL
• PGSQL
40GB8GB
• Window
s
• Linux
https://www.manageengine.com/network-monitoring/help/hardware-and-software-
requirements.html
8. Protocol Ports
SNMP 161 (UDP)
SNMP Traps 162 (UDP)
WMI 135 and 445, 5000 to 6000 (TCP) bidirectional
Telnet 23 (TCP)
SSH 22 (TCP)
ICMP/TCP Used to check the availability status and add a device
Syslog 514 (UDP)
Web server (HTTPS/HTTP) 443/ 80
Prerequisites for installing OpManager: Ports
11. Network devices 75
SQL servers 25
Exchange servers 10
Desktops 650
Printers 20
Network topology of Central IT Building
Mail server
SQL server
FTP serverPrinter
RADIUS
13. How to prepare for network discovery
1. Add admin users in OpManager
2. Ensure all devices are reachable from the
OpManager server
3. Add credentials for the respective device or
network
14. Not all devices present in the CSV file need to be
monitored
What happens if you import all the devices without
applying filters?
• Costs you a license
• Adds unnecessary load to the server
Challenges with importing devices from a CSV file
15. Task 3
Task 2
Task 1
Every time I add a SQL server, I set up the same set of
services, processes, and application monitors. How do I
automate this process?
I've grouped all MSSQL servers in a Business View for our
India site, and more servers will be added in the future.
Can I place these servers in the India group automatically?
I've set up a notification profile to trigger an email notification
for service down alarms. Can I assign this notification profile
automatically when a server is added?
SQL server
Challenges in post-discovery jobs: Configurations
16. Challenges in post-discovery jobs: Interface
discovery
I only want to discover the ethernet
interfaces
from my switches. Can I select the
required
network interface type while adding the
switch?
17. Network today
Network after
two weeks Schedule network
discovery Discovery
Reports
Ensure devices added
to the network are
scanned successfully
Challenges in automating device addition: Discovery
Schedule
18. Important steps to simplify the discovery
process in OpManager5 Quick demo
20. US
A
Colorado California
Denver Aurora
MilpitasSan Jose
Rocheste
r
New York
City
New York
Radio devices are installed in random locations every third week
Use case 1: Automate device addition by receiving SNMP trap
messages in OpManager
Add multiple discovery profiles with possible network
range
Enable device discovery via trap
• Settings > Discovery Settings > Discover devices
via Trap
21. Mail server
SQL server
FTP serverPrinter
WEB server
192.168.49.
1
Network topology of Building
D
Use case 2 : I don't have the complete list of
device details for Building D's network, but I know
the IP address of the seed router. Is there a way to
discover devices in OpManager using the router IP?
Add a discovery profile using Layer 2
discovery
• Settings > Discovery Profile
> Layer 2 Discovery
Devices discovered through Layer 2 discovery
will have the dependent devices configured
automatically
22. AP
I
Use case 3: Adding devices from ServiceNow to OpManager
Generate an API key for OpManager
• Settings > Rest API > Generate API Key
Visit api.opmanager.com and get the API call for
adding a device, deleting a device, etc.
23. Device properties
- IP address
- RAM size
- Hard disk size
- Exchange version
- Etc.
Use case 4: Update interface/device properties with Discovery
Schedule
Interface properties
- Name
- Speed
- Description
- Admin/operational
status
- Etc.
25. Top fixes for failure
1
2
3
Open the recommended port in your firewall
Visit https://www.manageengine.com/network-monitoring/help/hardware-and-software-requirements.html
for a list of recommended ports
Update the password in OpManager
- Settings > Discovery > Credentials
Test the credentials periodically and see when the test fails
- Settings > Discovery > Test Credentials
Create a new device template for the respective model
- Settings > Configuration > Device Template > Add Template
26. We have added a new feather to our cap
• Creating groups based on site,
department, customers, etc
• Threshold settings based on custom
groups
• Dashboard for groups and sub
groups
• Filters based on groups in widgets
and reports
Grouping