ManageEngine OpManager 7 Features And Functionality
Overview Complete Network Monitoring Software - Automatic Discovery - Smart Classifiction - Performance Monitoring - Fault Management - Database Support - Scheduled Reports
Automatic Discovery .Opmanager uses ICMP/Nmap to discover devices on a network - Can use an IP range to discover devices - Can specify the Network IP to discover the  entire network. - Discovers services running on the network
Smart Classification Comes with over 300 device templates enabling smart classification into servers, firewalls, switches, etc..  Can define new templates Infrastructure and Business view to for grouping systems and applications together for effective management. Bulk import devices into different categories for easy management
Performance Monitoring Server Management - offers real time data on the health of the  servers - Supports monitoring of HTTP, FTP, HTTPS,  DNS, LDAP, NTP, MySQL, Oracle,  MSSQL, and more. - Monitors CPU, Memory and Disk Utilization - Provides graphs and reports for servers  availability, response time and utilization. - Monitors Windows Services and Event Logs - Notification of response time degradation
Performance Monitoring WAN Management - View routers and Links - analyze traffic and error statistics - Historical reports and graphs Switch Monitoring - Live view of switches for port utilization UPS monitoring - Monitor UPS load, status, battery status Firewall Monitoring  - Monitor resources like CPU, memory, active  connections
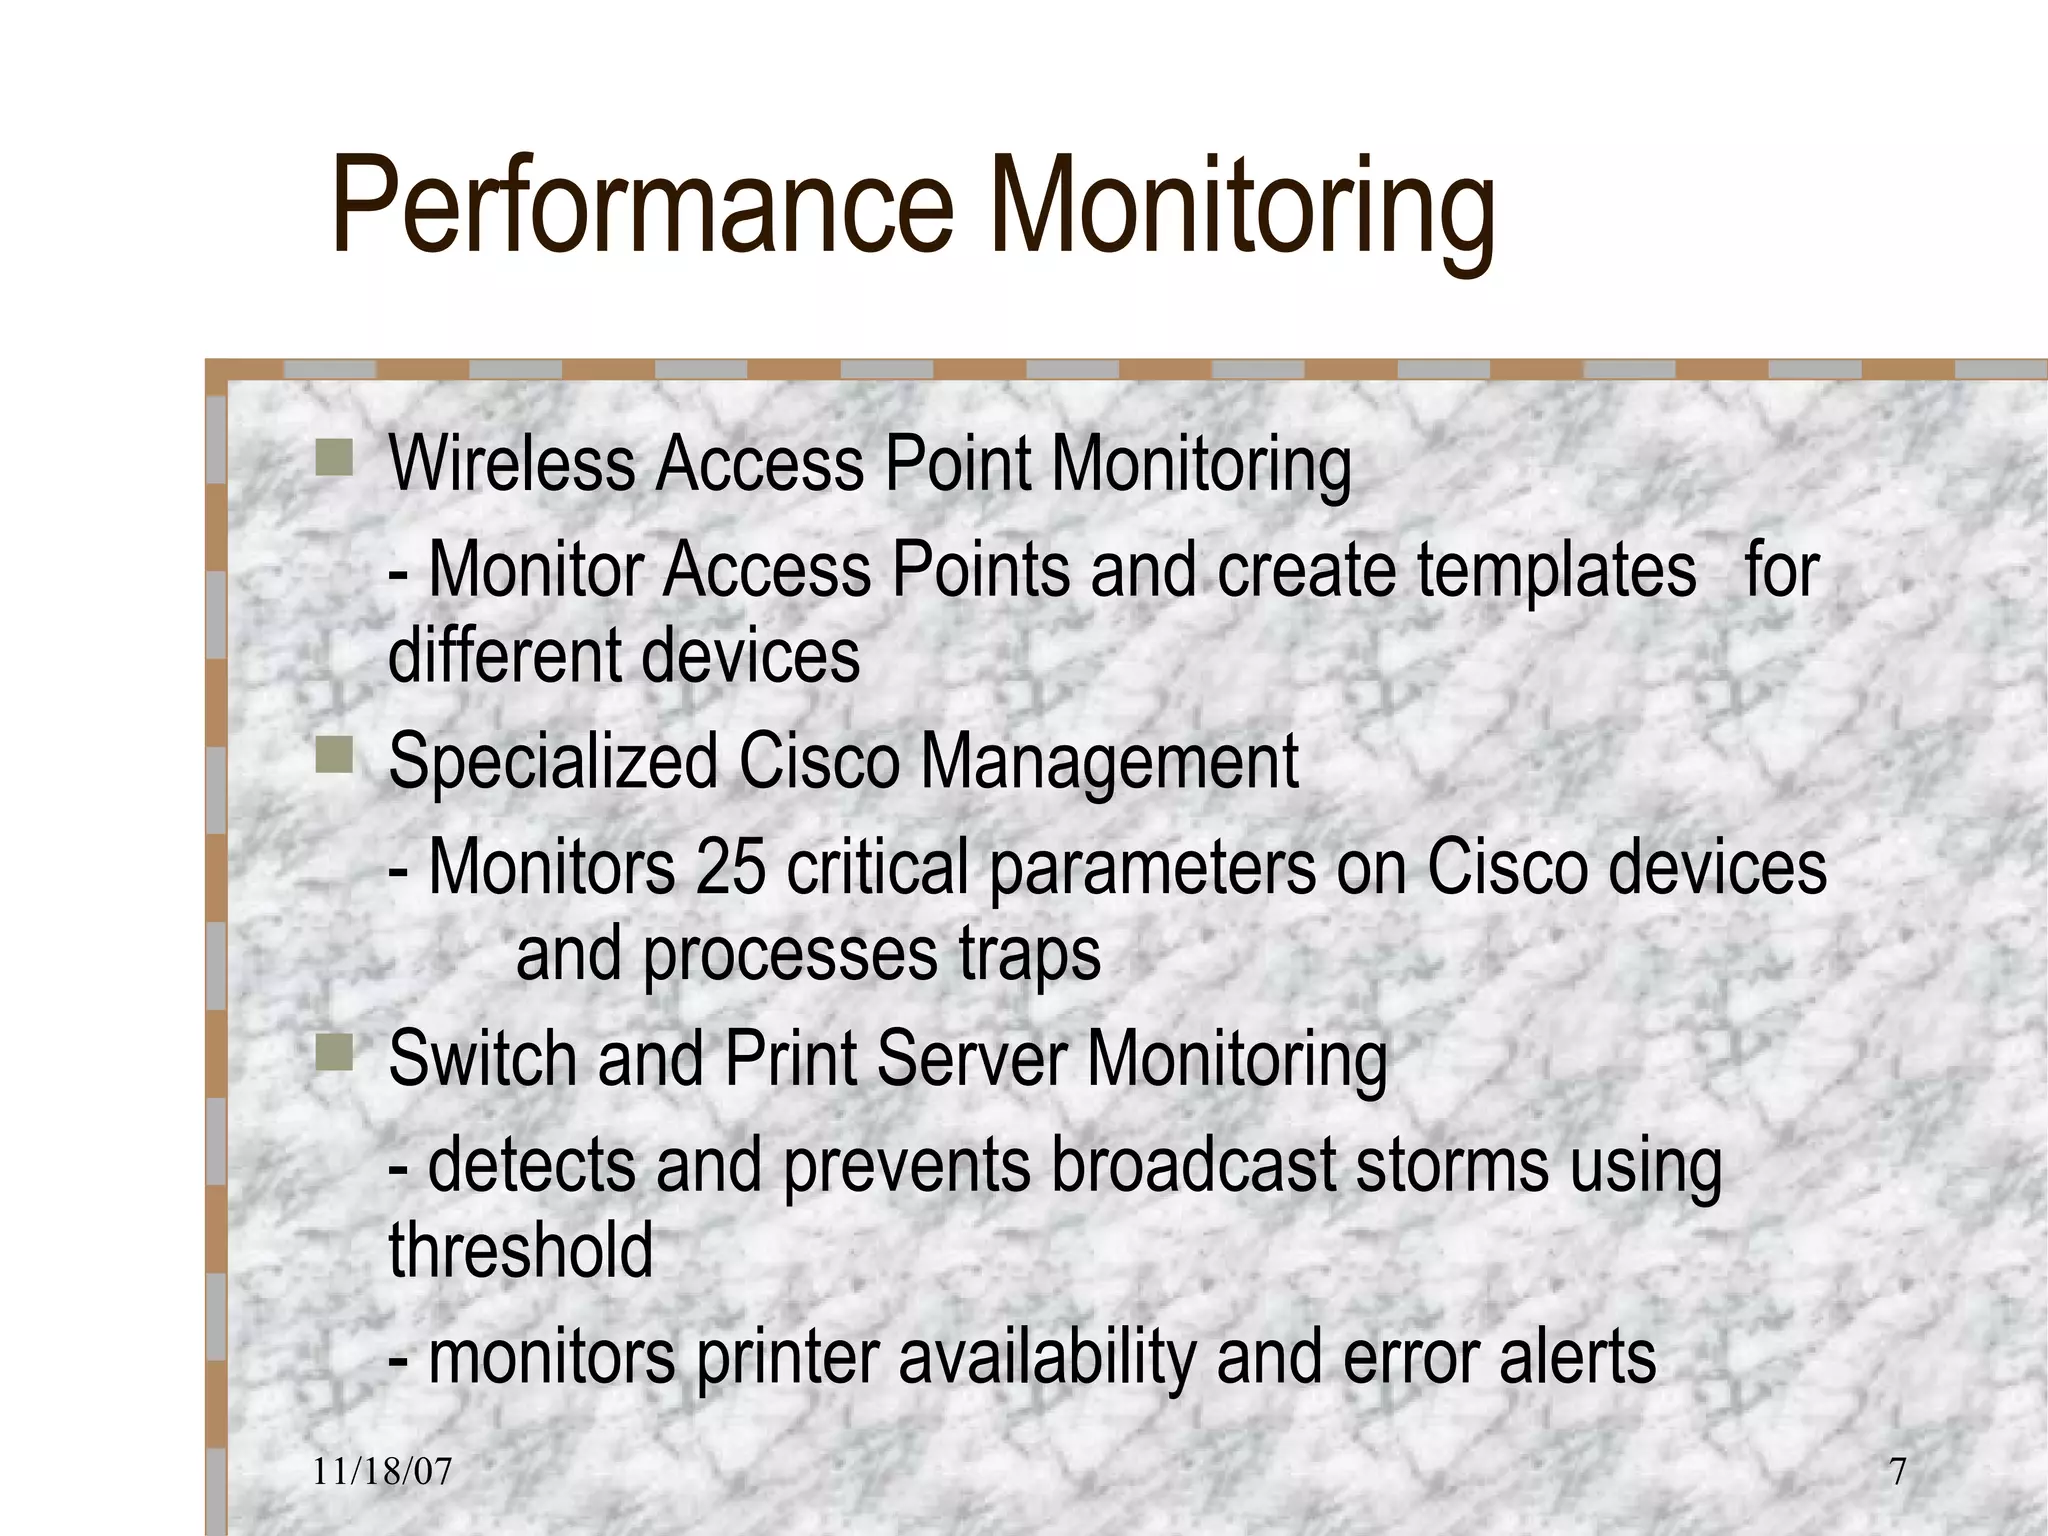
Performance Monitoring Wireless Access Point Monitoring - Monitor Access Points and create templates  for different devices Specialized Cisco Management - Monitors 25 critical parameters on Cisco devices  and processes traps Switch and Print Server Monitoring - detects and prevents broadcast storms using  threshold - monitors printer availability and error alerts
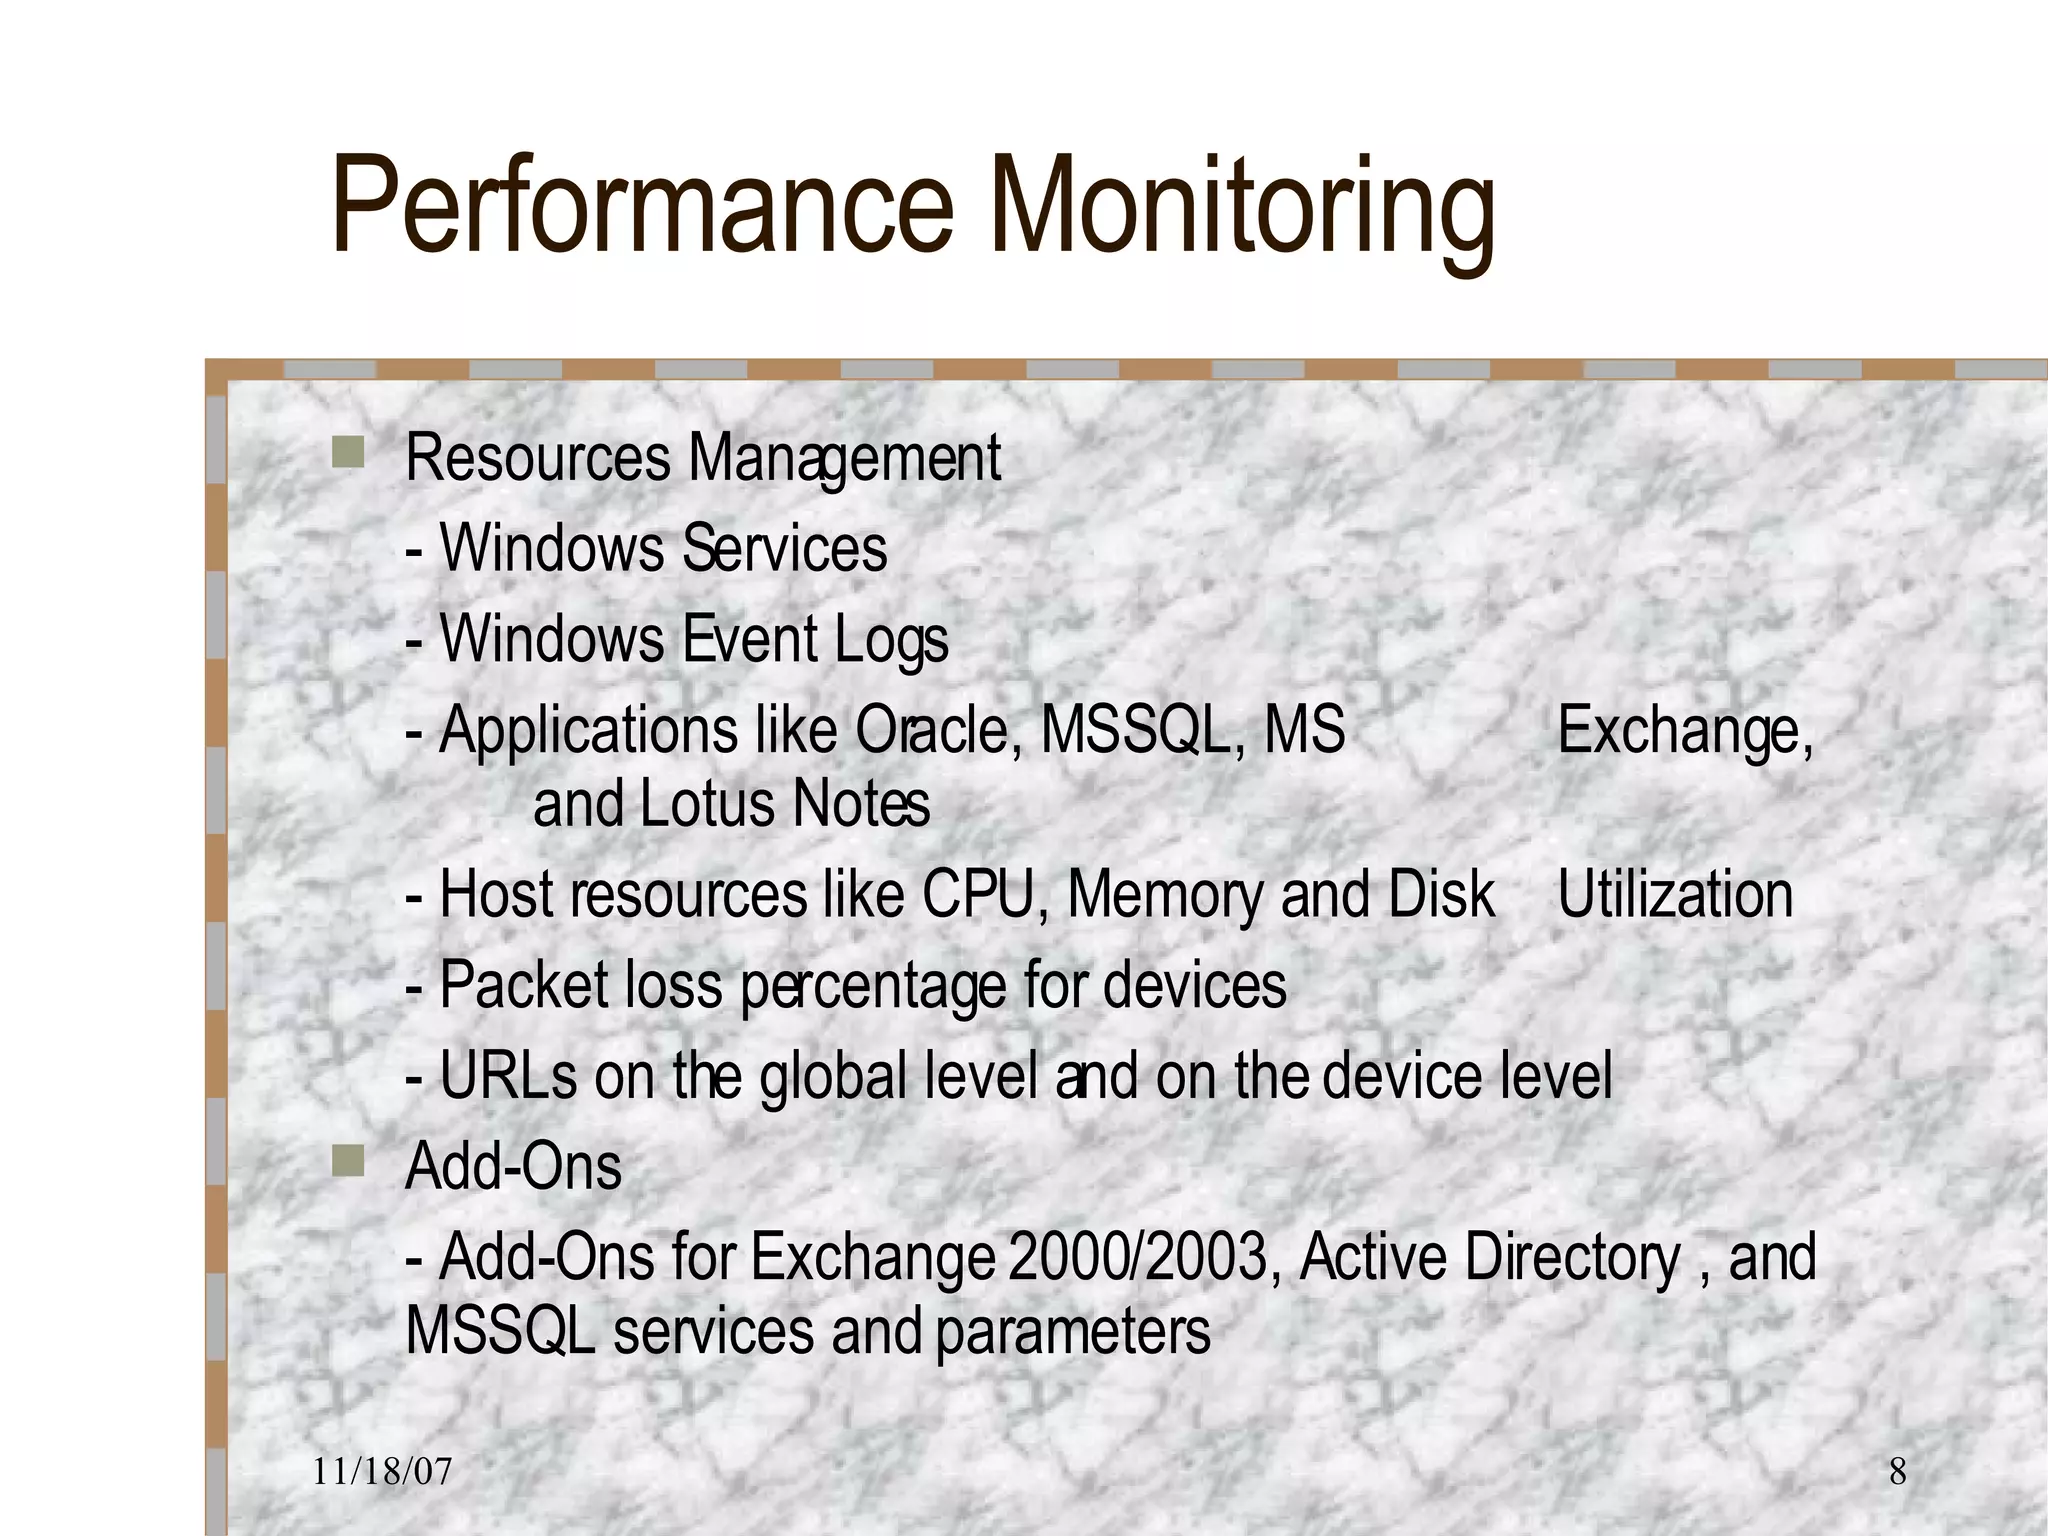
Performance Monitoring Resources Management - Windows Services - Windows Event Logs - Applications like Oracle, MSSQL, MS  Exchange,  and Lotus Notes - Host resources like CPU, Memory and Disk  Utilization - Packet loss percentage for devices - URLs on the global level and on the device level Add-Ons - Add-Ons for Exchange 2000/2003, Active Directory , and MSSQL services and parameters
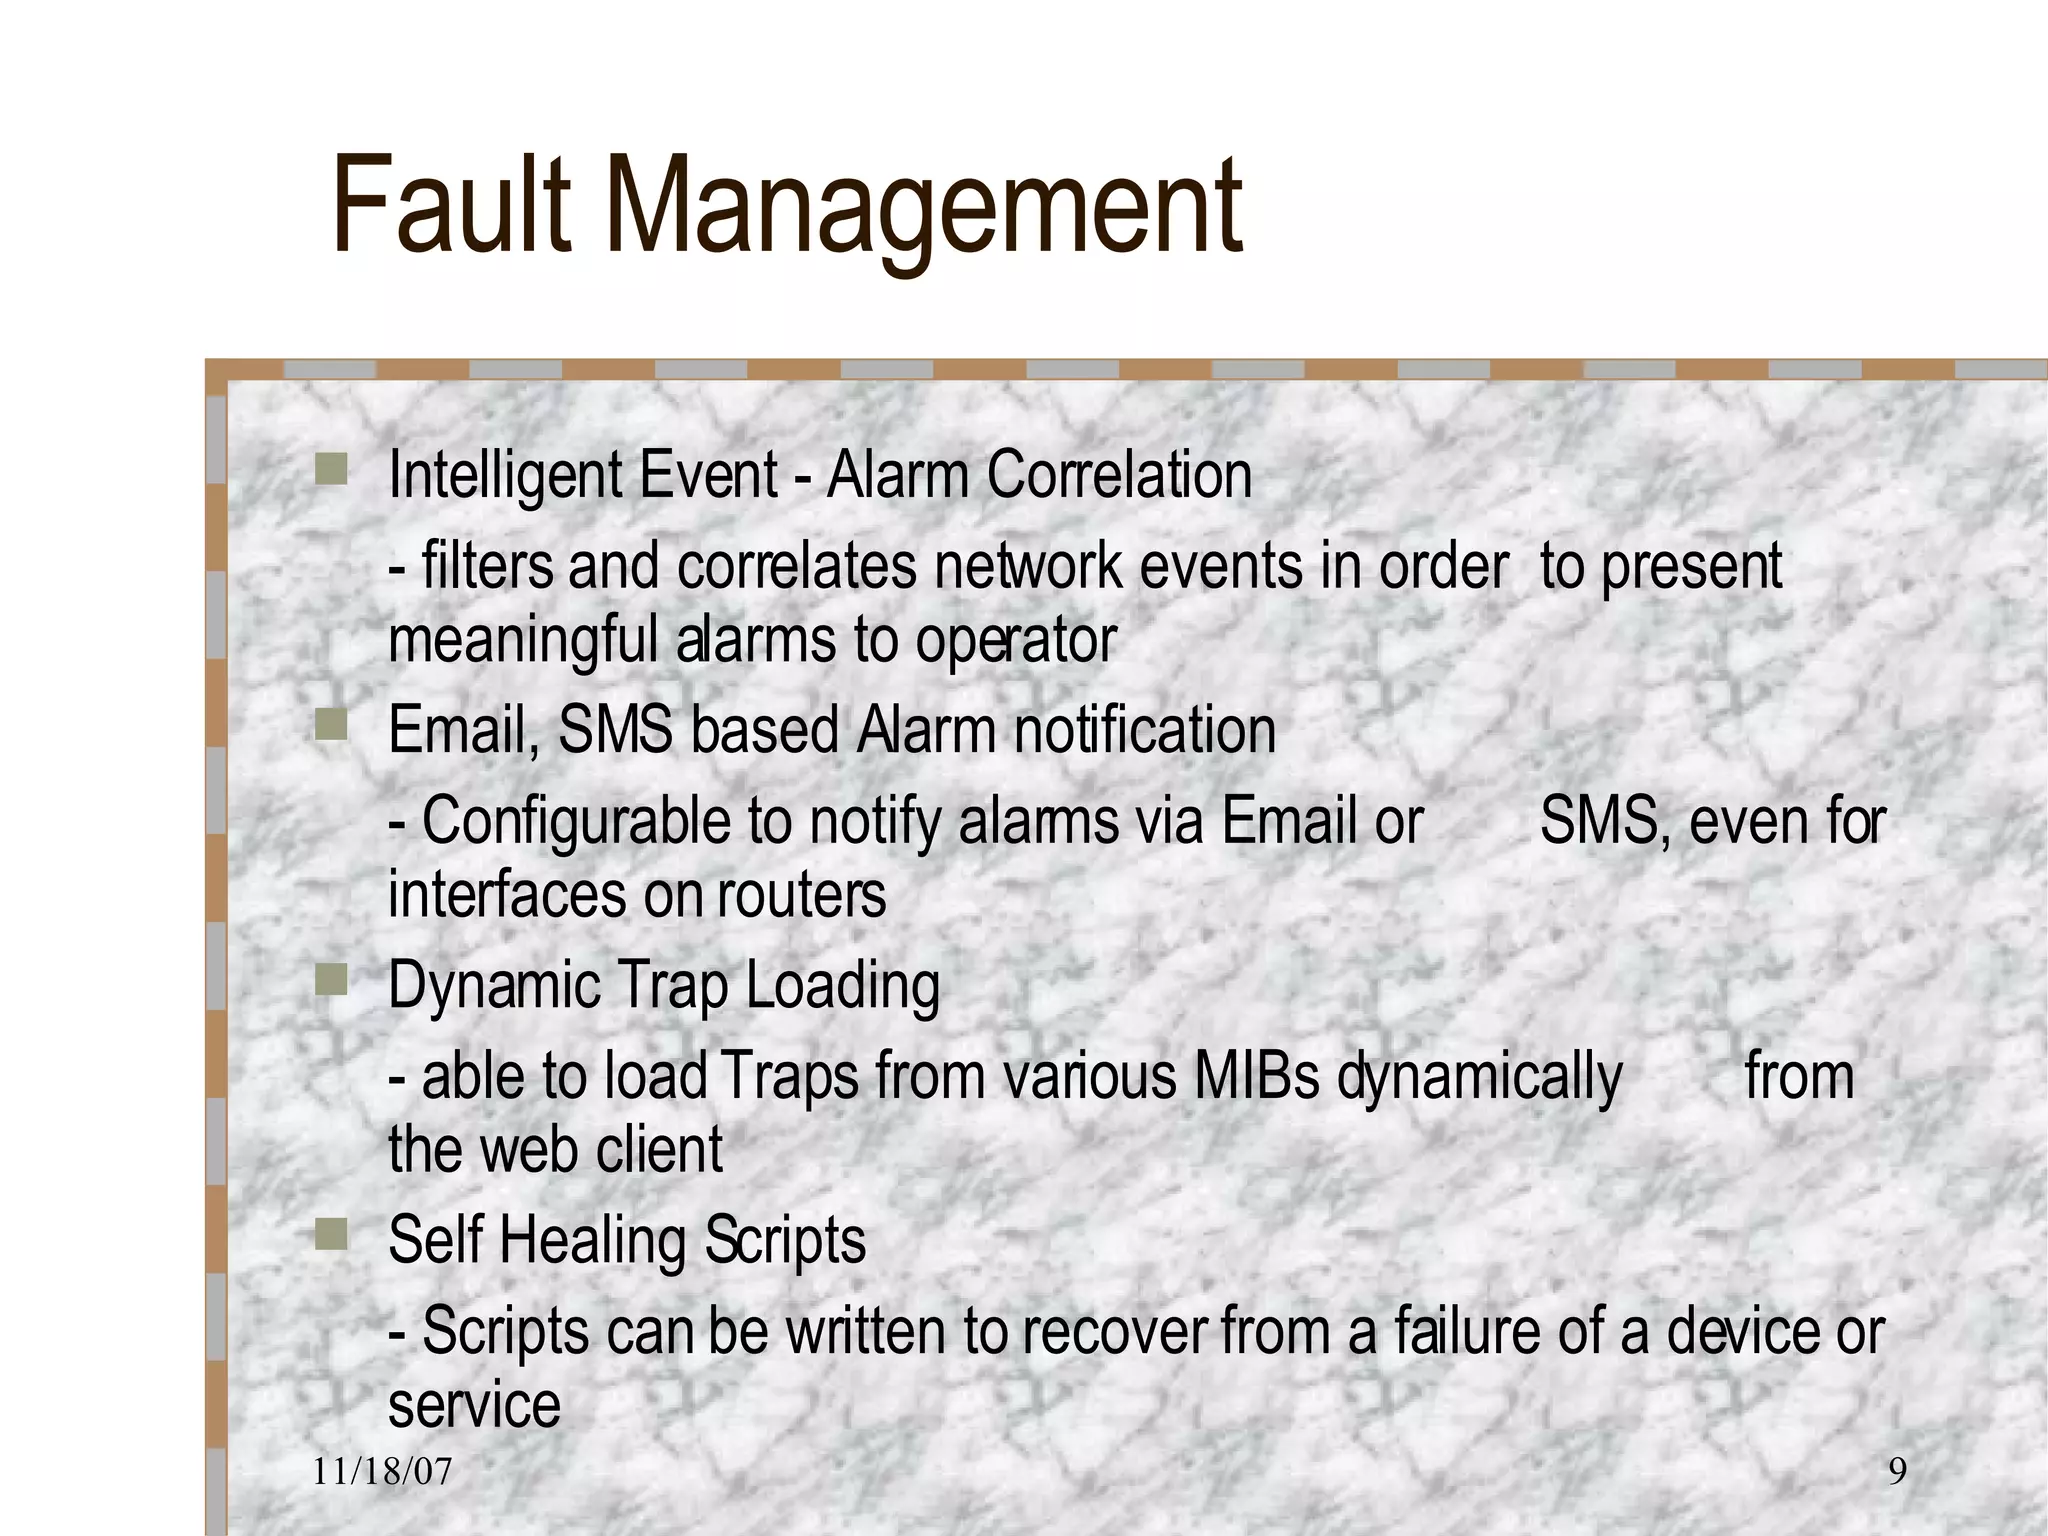
Fault Management Intelligent Event - Alarm Correlation - filters and correlates network events in order  to present meaningful alarms to operator Email, SMS based Alarm notification - Configurable to notify alarms via Email or  SMS, even for interfaces on routers Dynamic Trap Loading - able to load Traps from various MIBs dynamically  from the web client Self Healing Scripts - Scripts can be written to recover from a failure of a device or service
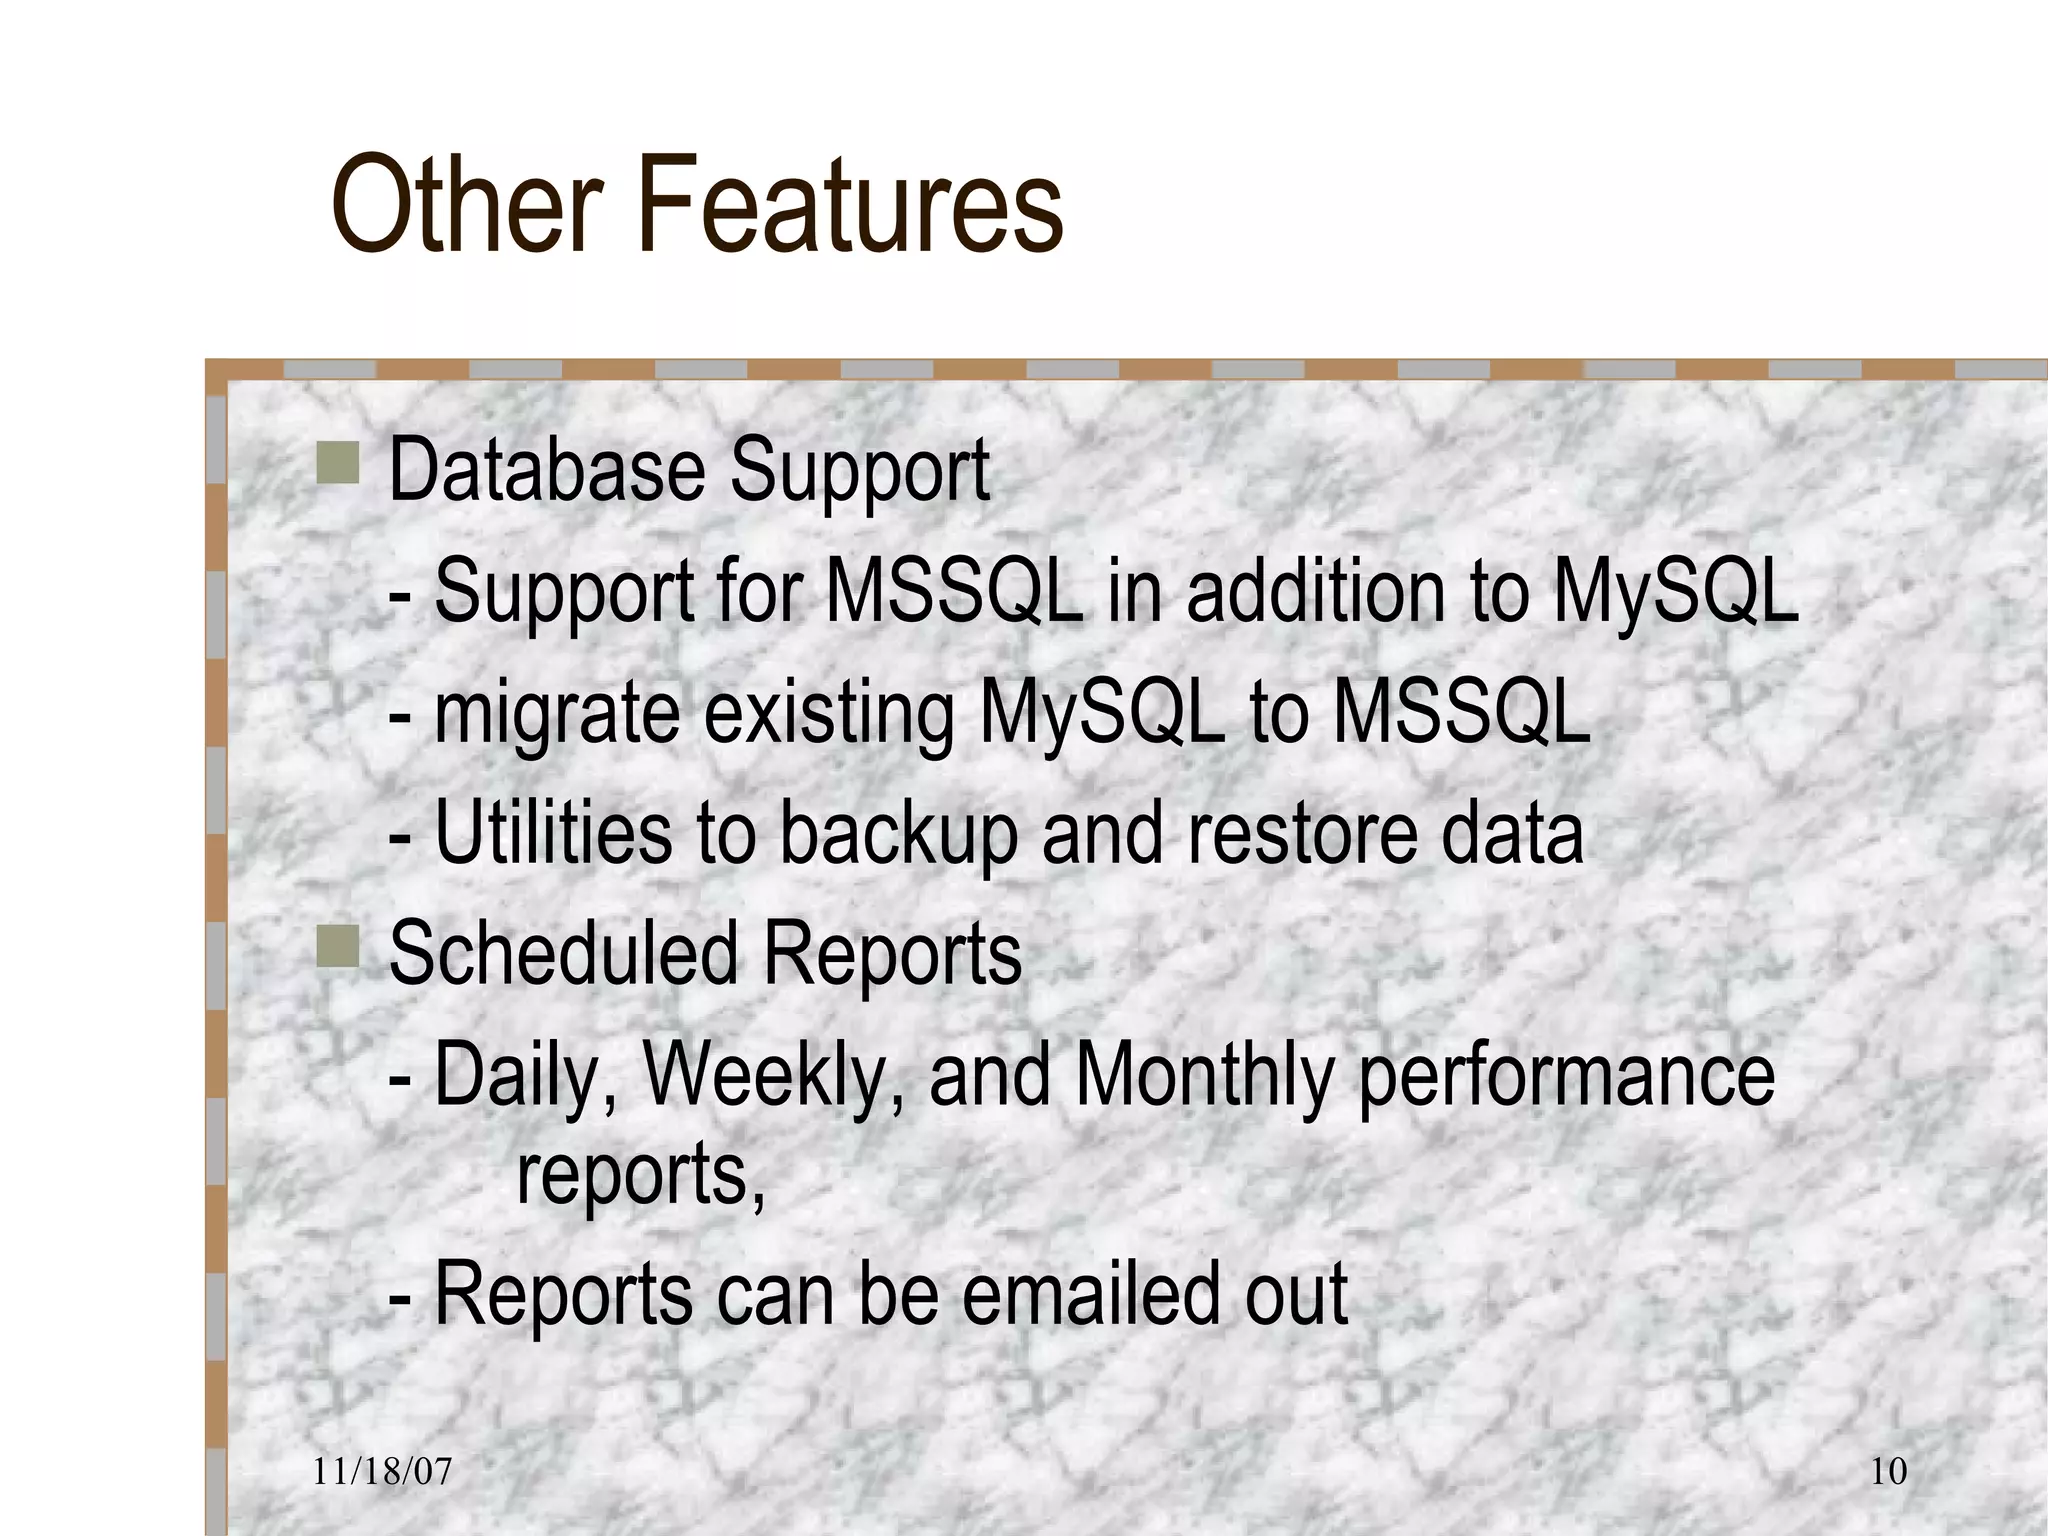
Other Features Database Support - Support for MSSQL in addition to MySQL - migrate existing MySQL to MSSQL - Utilities to backup and restore data Scheduled Reports - Daily, Weekly, and Monthly performance  reports,  - Reports can be emailed out

Irizarry M Cis516 Week7

  • 1.
    ManageEngine OpManager 7Features And Functionality
  • 2.
    Overview Complete NetworkMonitoring Software - Automatic Discovery - Smart Classifiction - Performance Monitoring - Fault Management - Database Support - Scheduled Reports
  • 3.
    Automatic Discovery .Opmanageruses ICMP/Nmap to discover devices on a network - Can use an IP range to discover devices - Can specify the Network IP to discover the entire network. - Discovers services running on the network
  • 4.
    Smart Classification Comeswith over 300 device templates enabling smart classification into servers, firewalls, switches, etc.. Can define new templates Infrastructure and Business view to for grouping systems and applications together for effective management. Bulk import devices into different categories for easy management
  • 5.
    Performance Monitoring ServerManagement - offers real time data on the health of the servers - Supports monitoring of HTTP, FTP, HTTPS, DNS, LDAP, NTP, MySQL, Oracle, MSSQL, and more. - Monitors CPU, Memory and Disk Utilization - Provides graphs and reports for servers availability, response time and utilization. - Monitors Windows Services and Event Logs - Notification of response time degradation
  • 6.
    Performance Monitoring WANManagement - View routers and Links - analyze traffic and error statistics - Historical reports and graphs Switch Monitoring - Live view of switches for port utilization UPS monitoring - Monitor UPS load, status, battery status Firewall Monitoring - Monitor resources like CPU, memory, active connections
  • 7.
    Performance Monitoring WirelessAccess Point Monitoring - Monitor Access Points and create templates for different devices Specialized Cisco Management - Monitors 25 critical parameters on Cisco devices and processes traps Switch and Print Server Monitoring - detects and prevents broadcast storms using threshold - monitors printer availability and error alerts
  • 8.
    Performance Monitoring ResourcesManagement - Windows Services - Windows Event Logs - Applications like Oracle, MSSQL, MS Exchange, and Lotus Notes - Host resources like CPU, Memory and Disk Utilization - Packet loss percentage for devices - URLs on the global level and on the device level Add-Ons - Add-Ons for Exchange 2000/2003, Active Directory , and MSSQL services and parameters
  • 9.
    Fault Management IntelligentEvent - Alarm Correlation - filters and correlates network events in order to present meaningful alarms to operator Email, SMS based Alarm notification - Configurable to notify alarms via Email or SMS, even for interfaces on routers Dynamic Trap Loading - able to load Traps from various MIBs dynamically from the web client Self Healing Scripts - Scripts can be written to recover from a failure of a device or service
  • 10.
    Other Features DatabaseSupport - Support for MSSQL in addition to MySQL - migrate existing MySQL to MSSQL - Utilities to backup and restore data Scheduled Reports - Daily, Weekly, and Monthly performance reports, - Reports can be emailed out