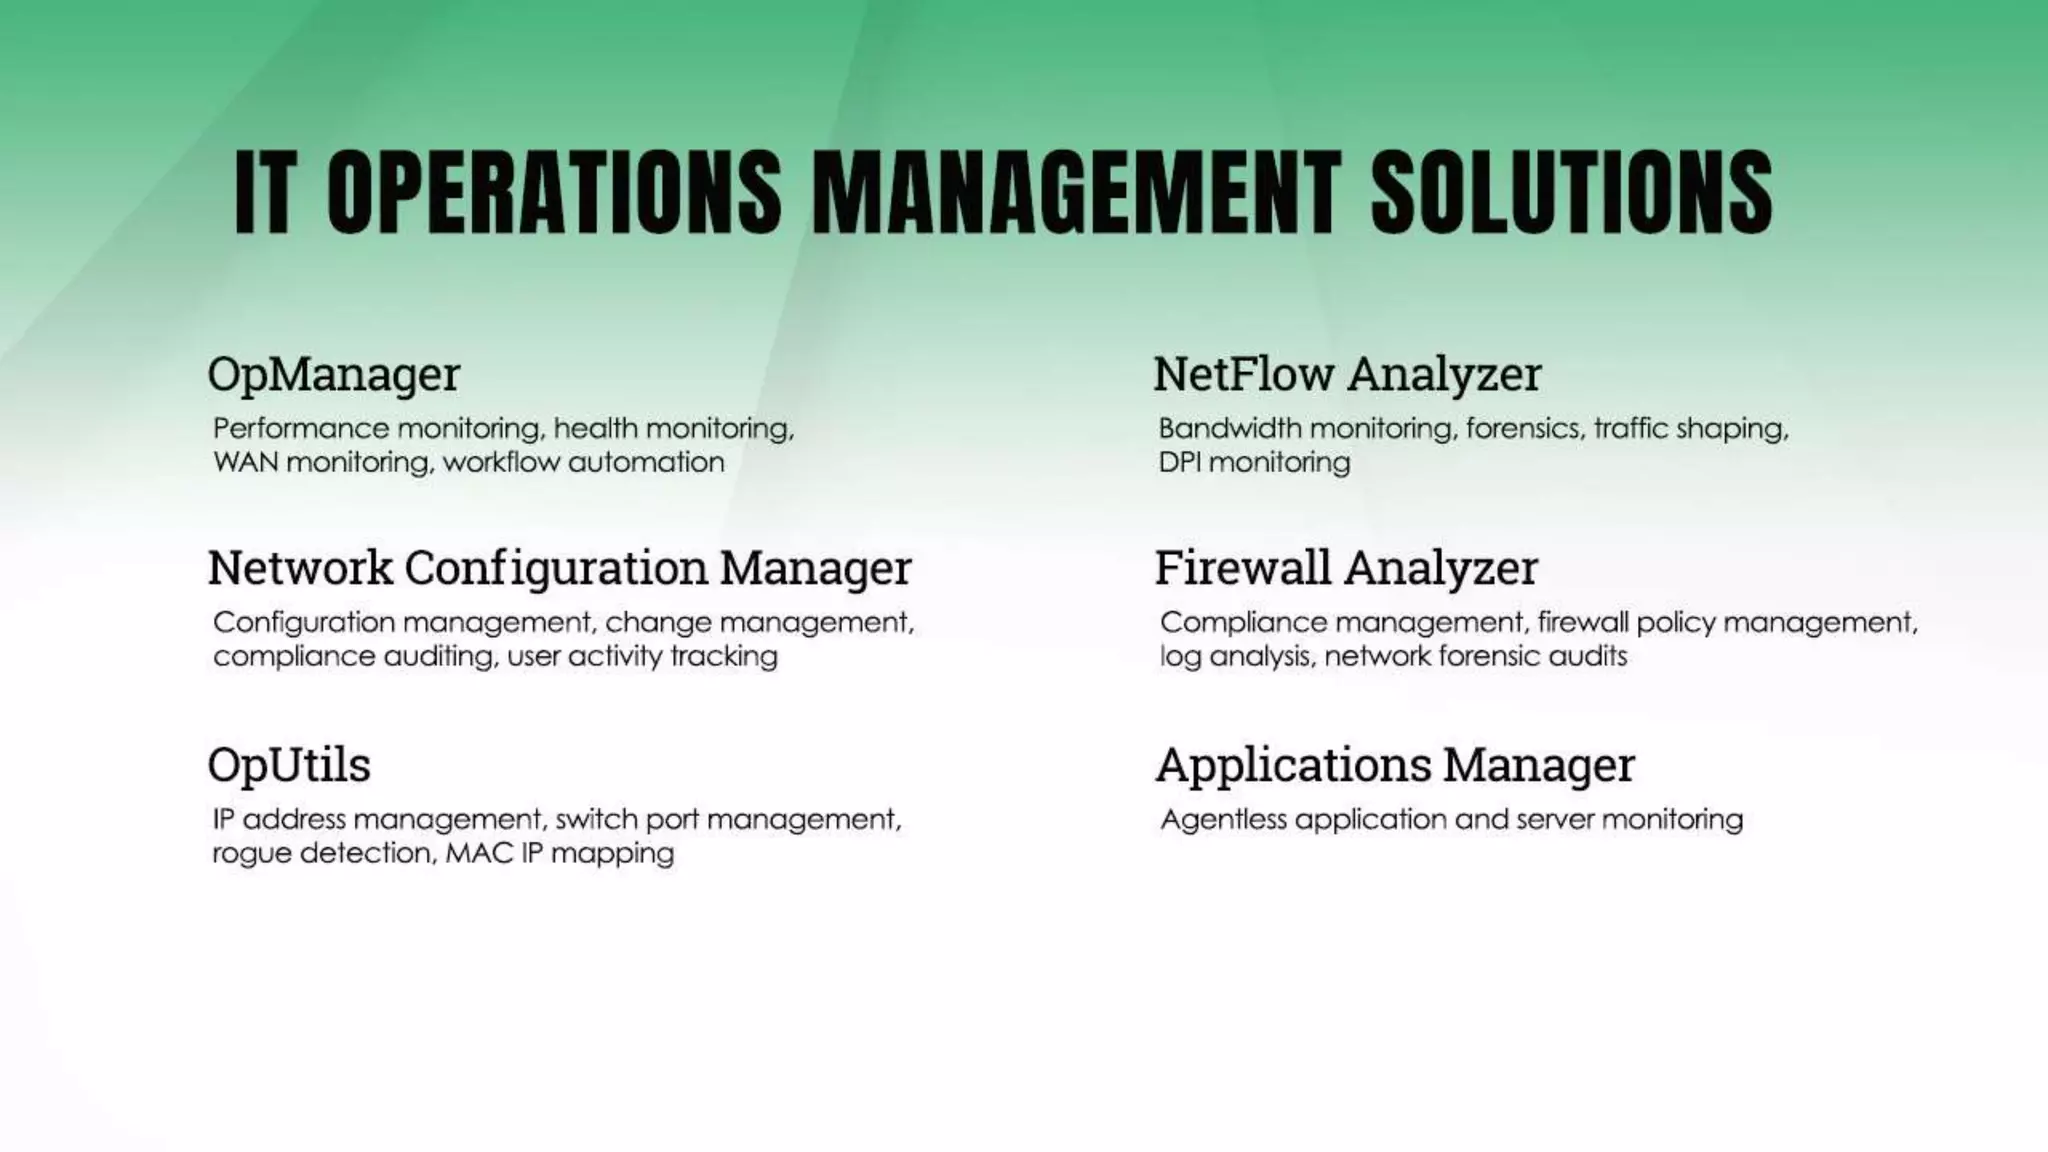
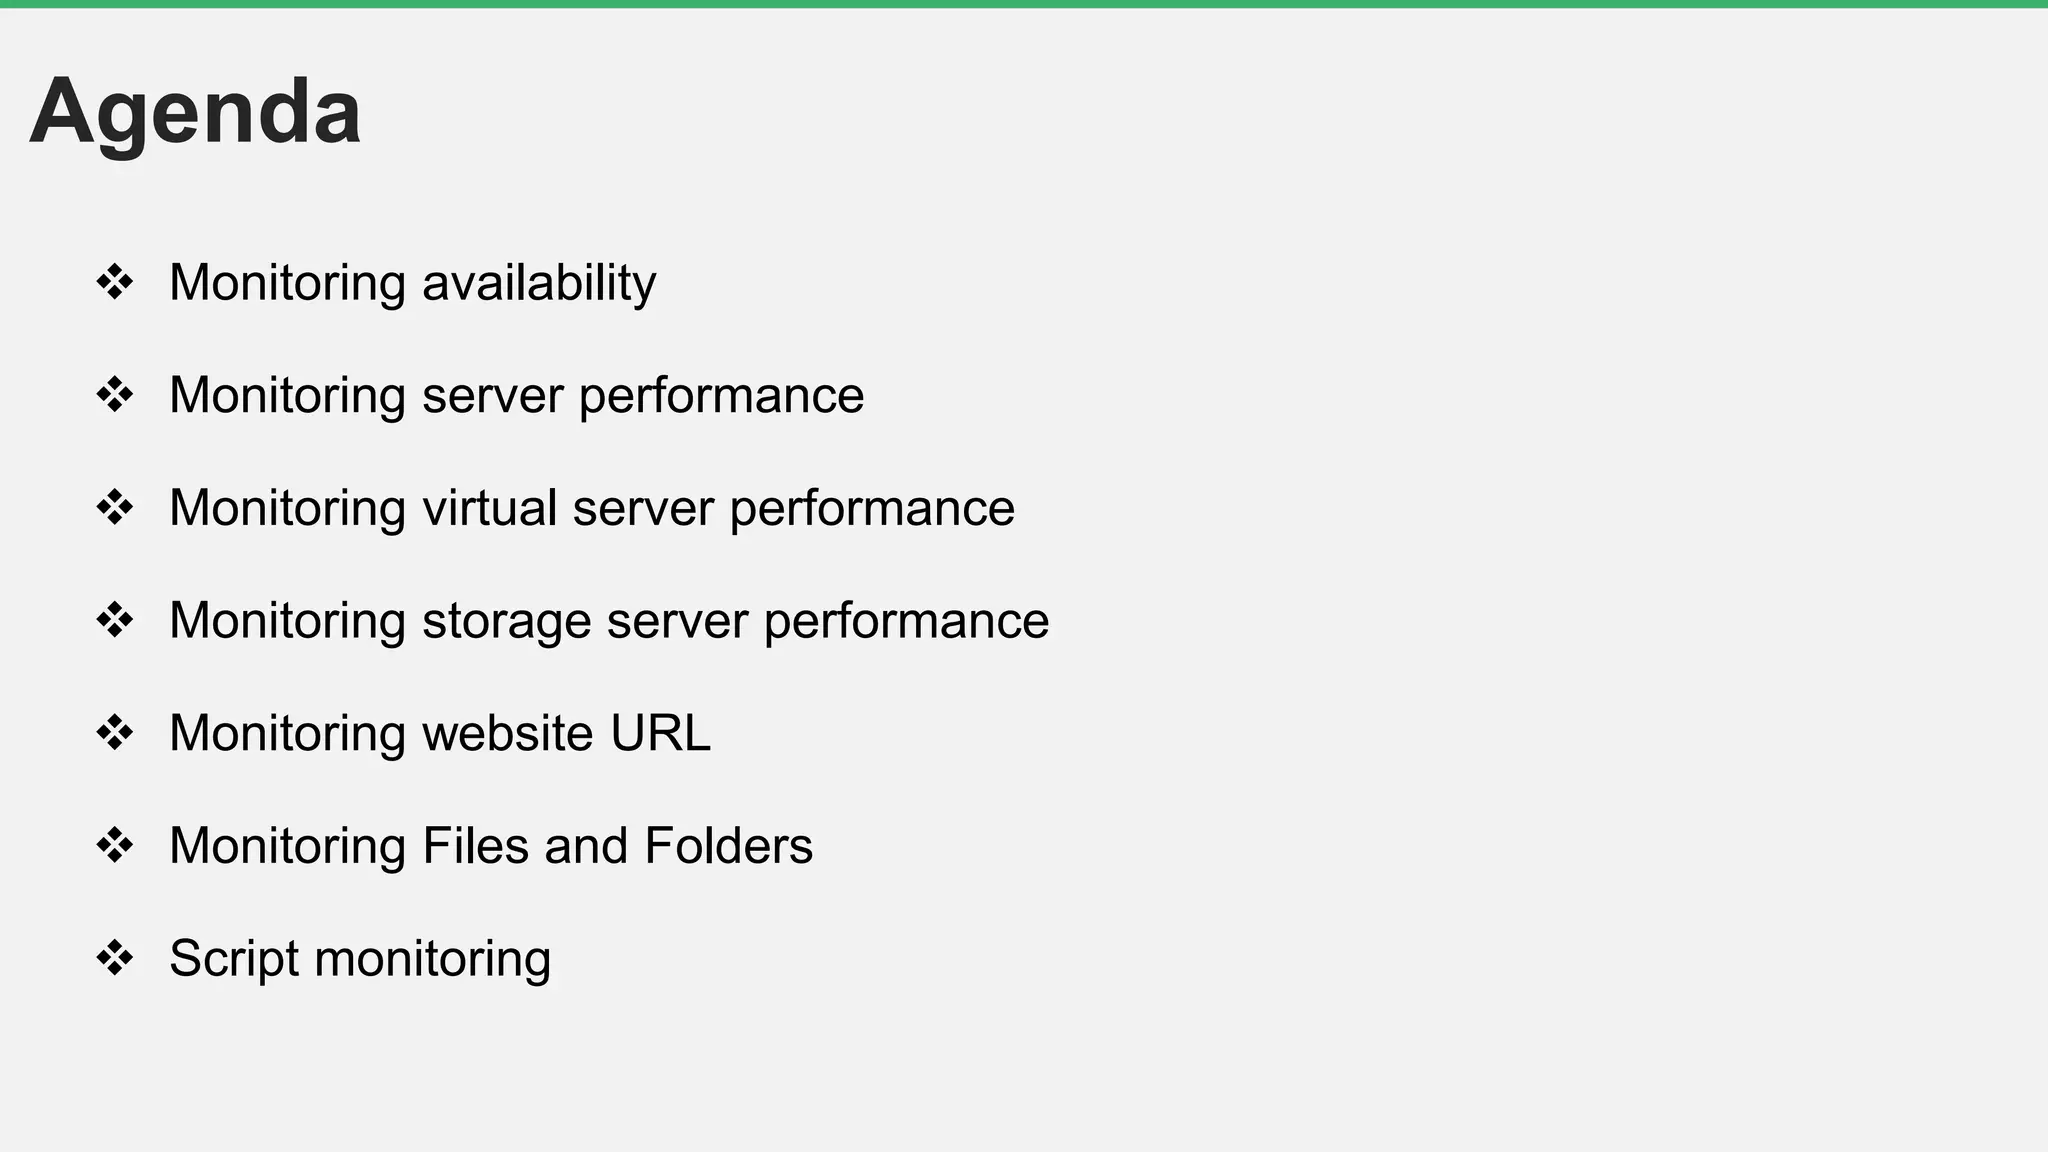
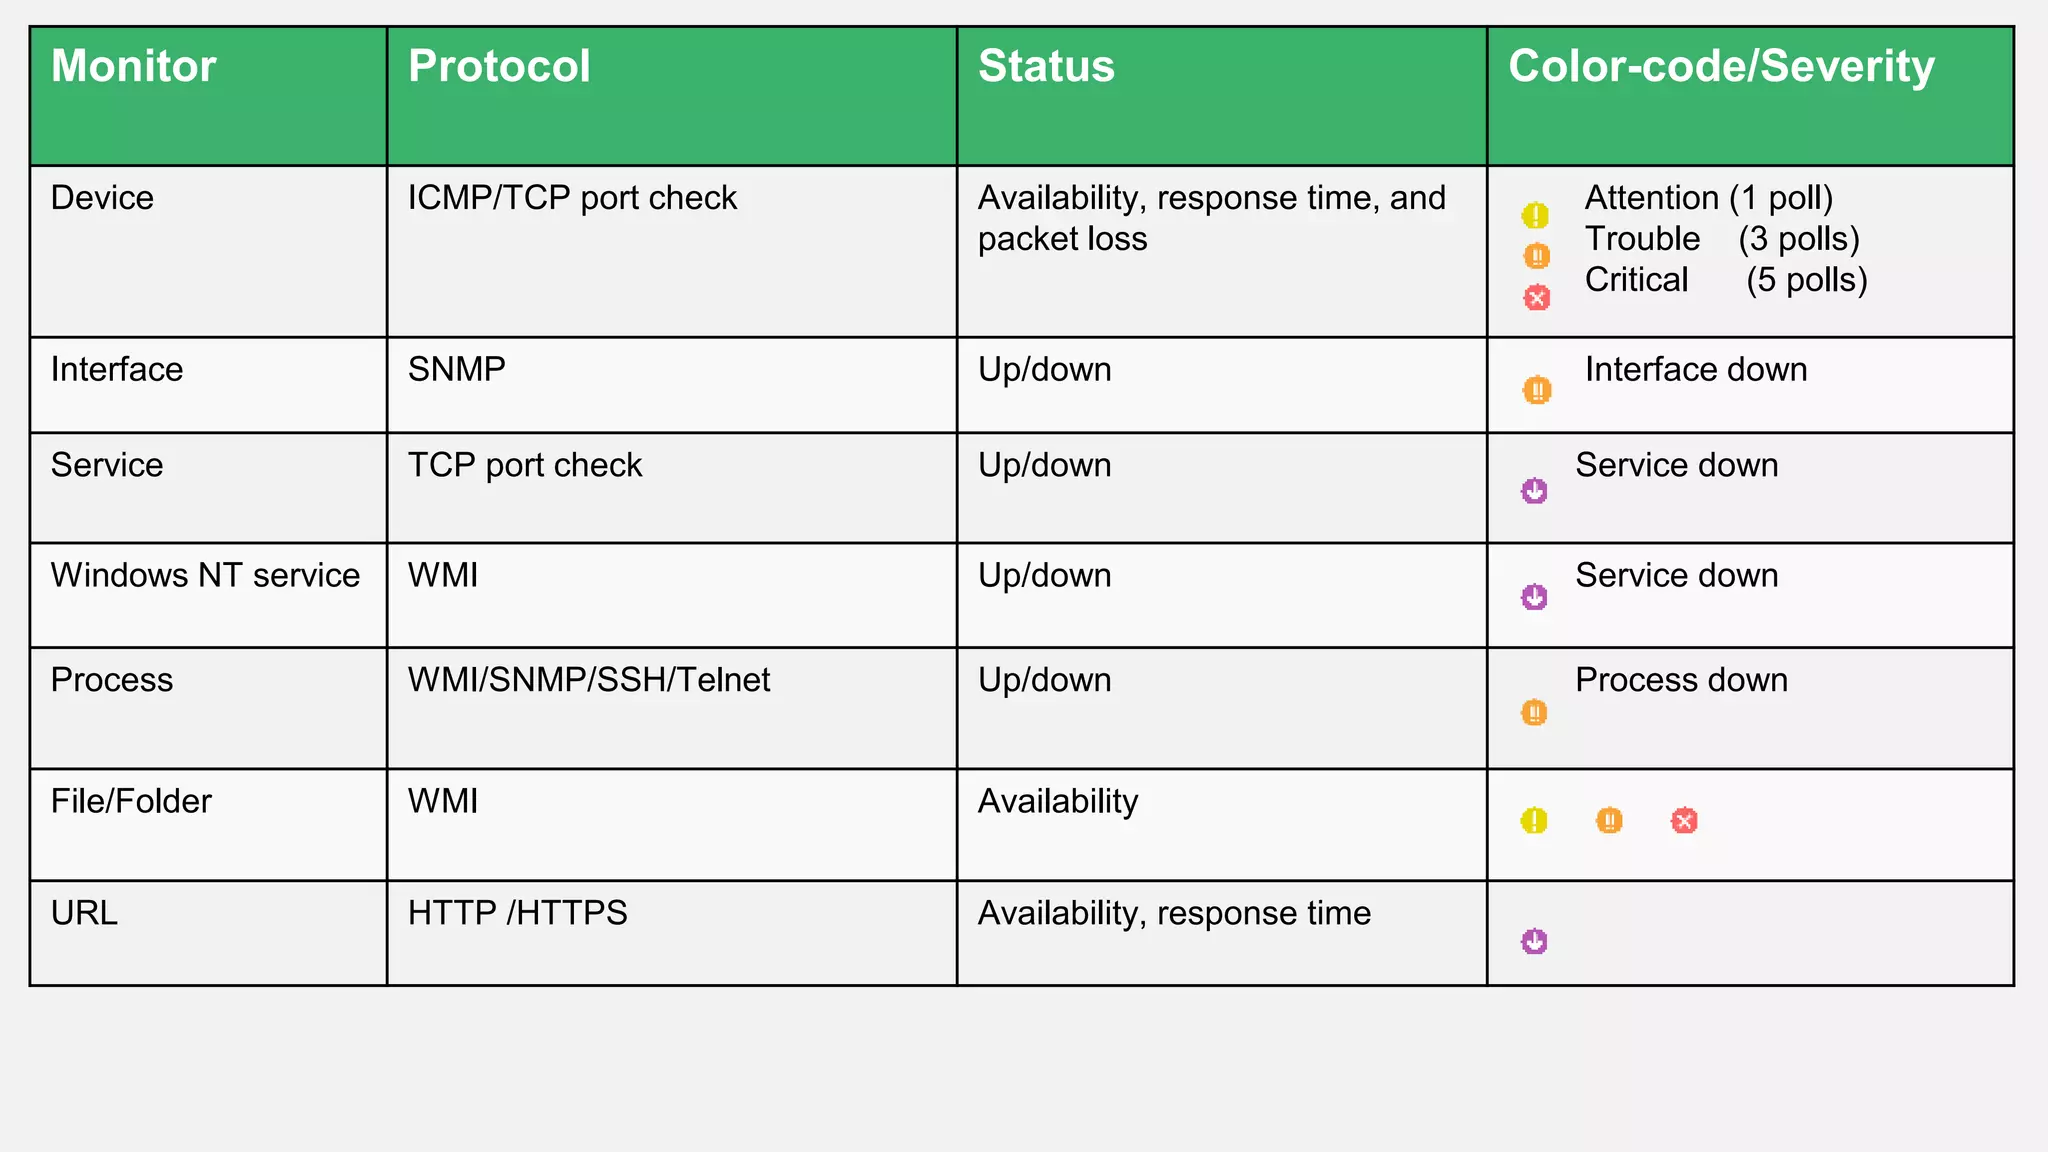
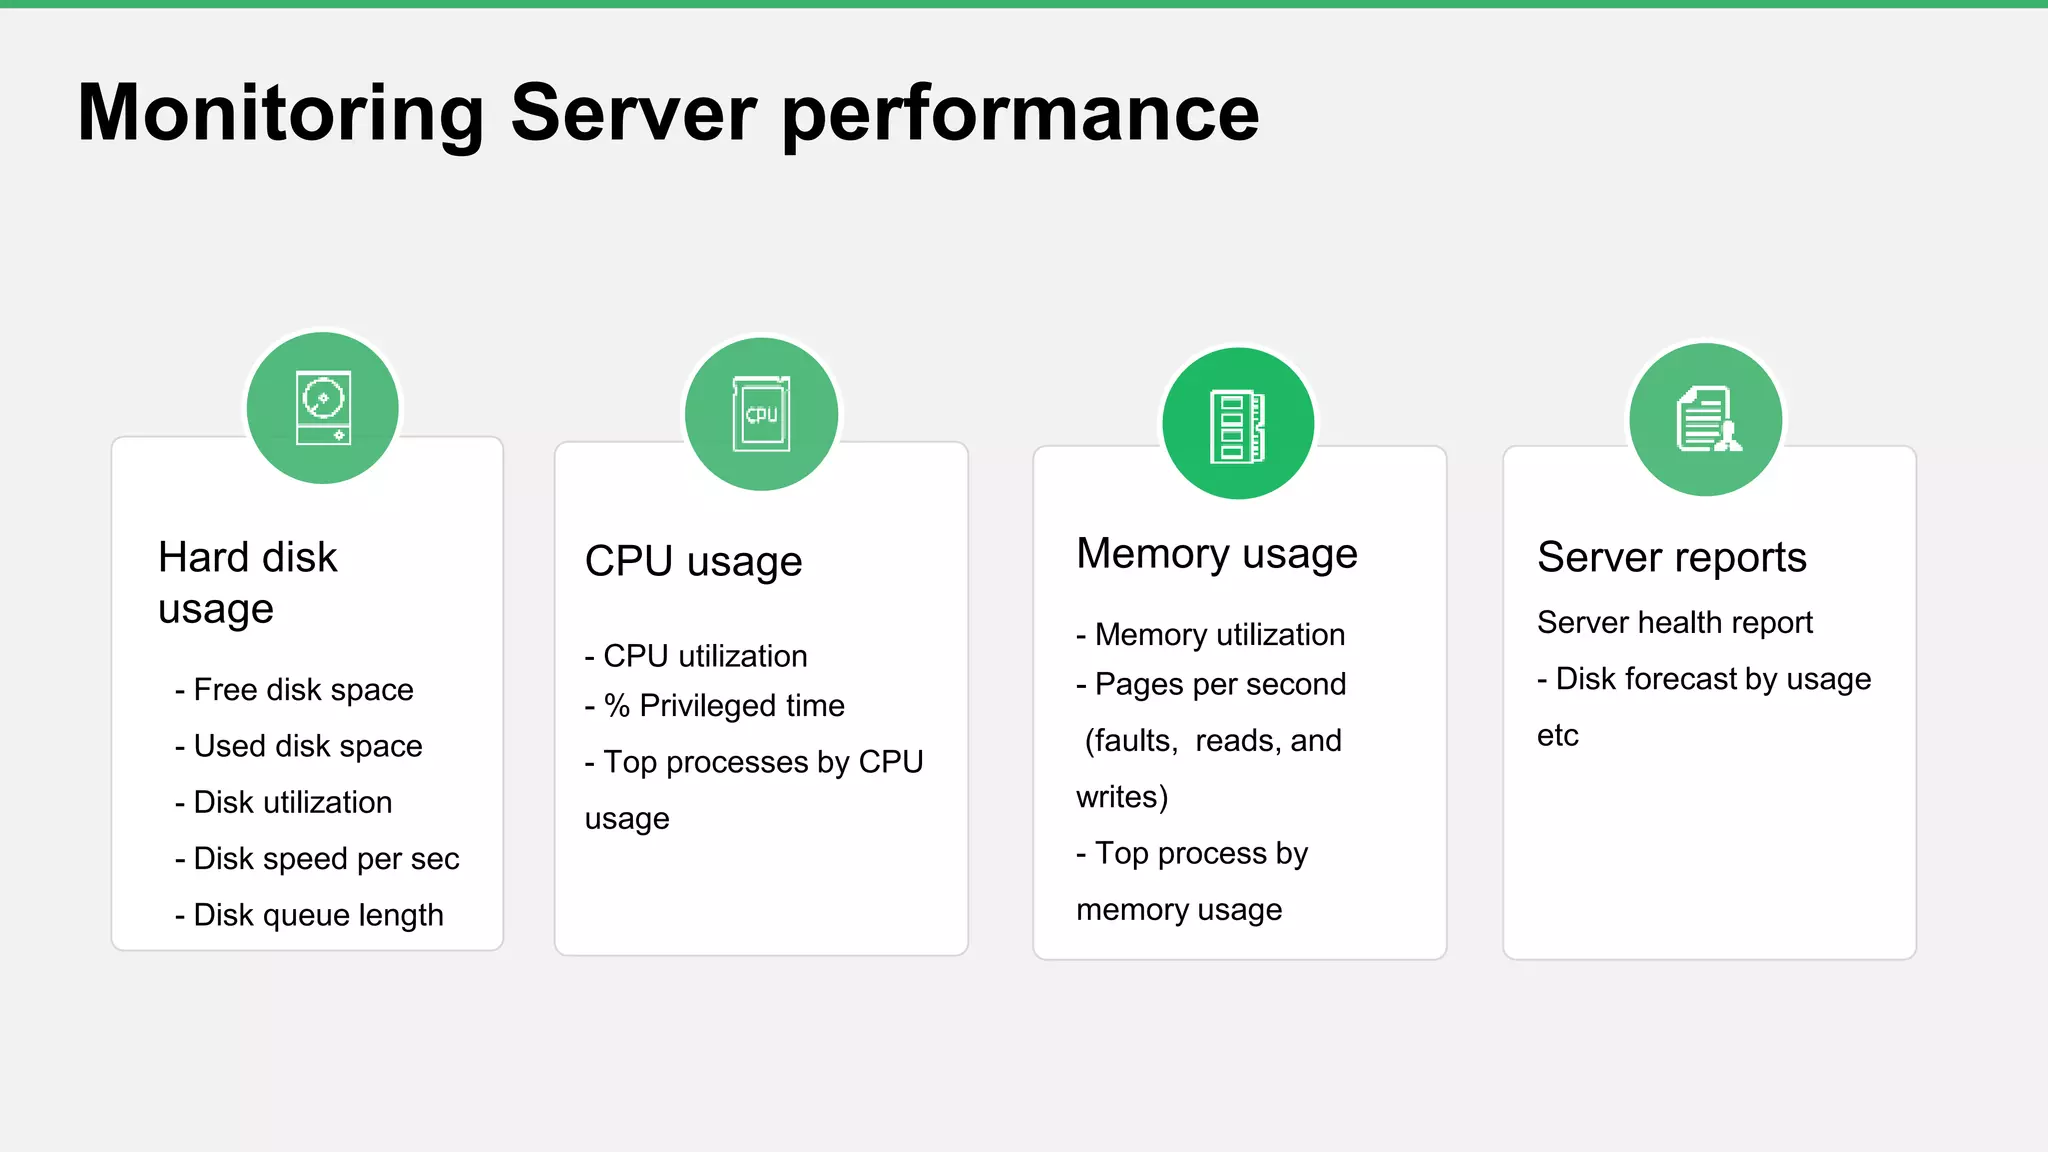
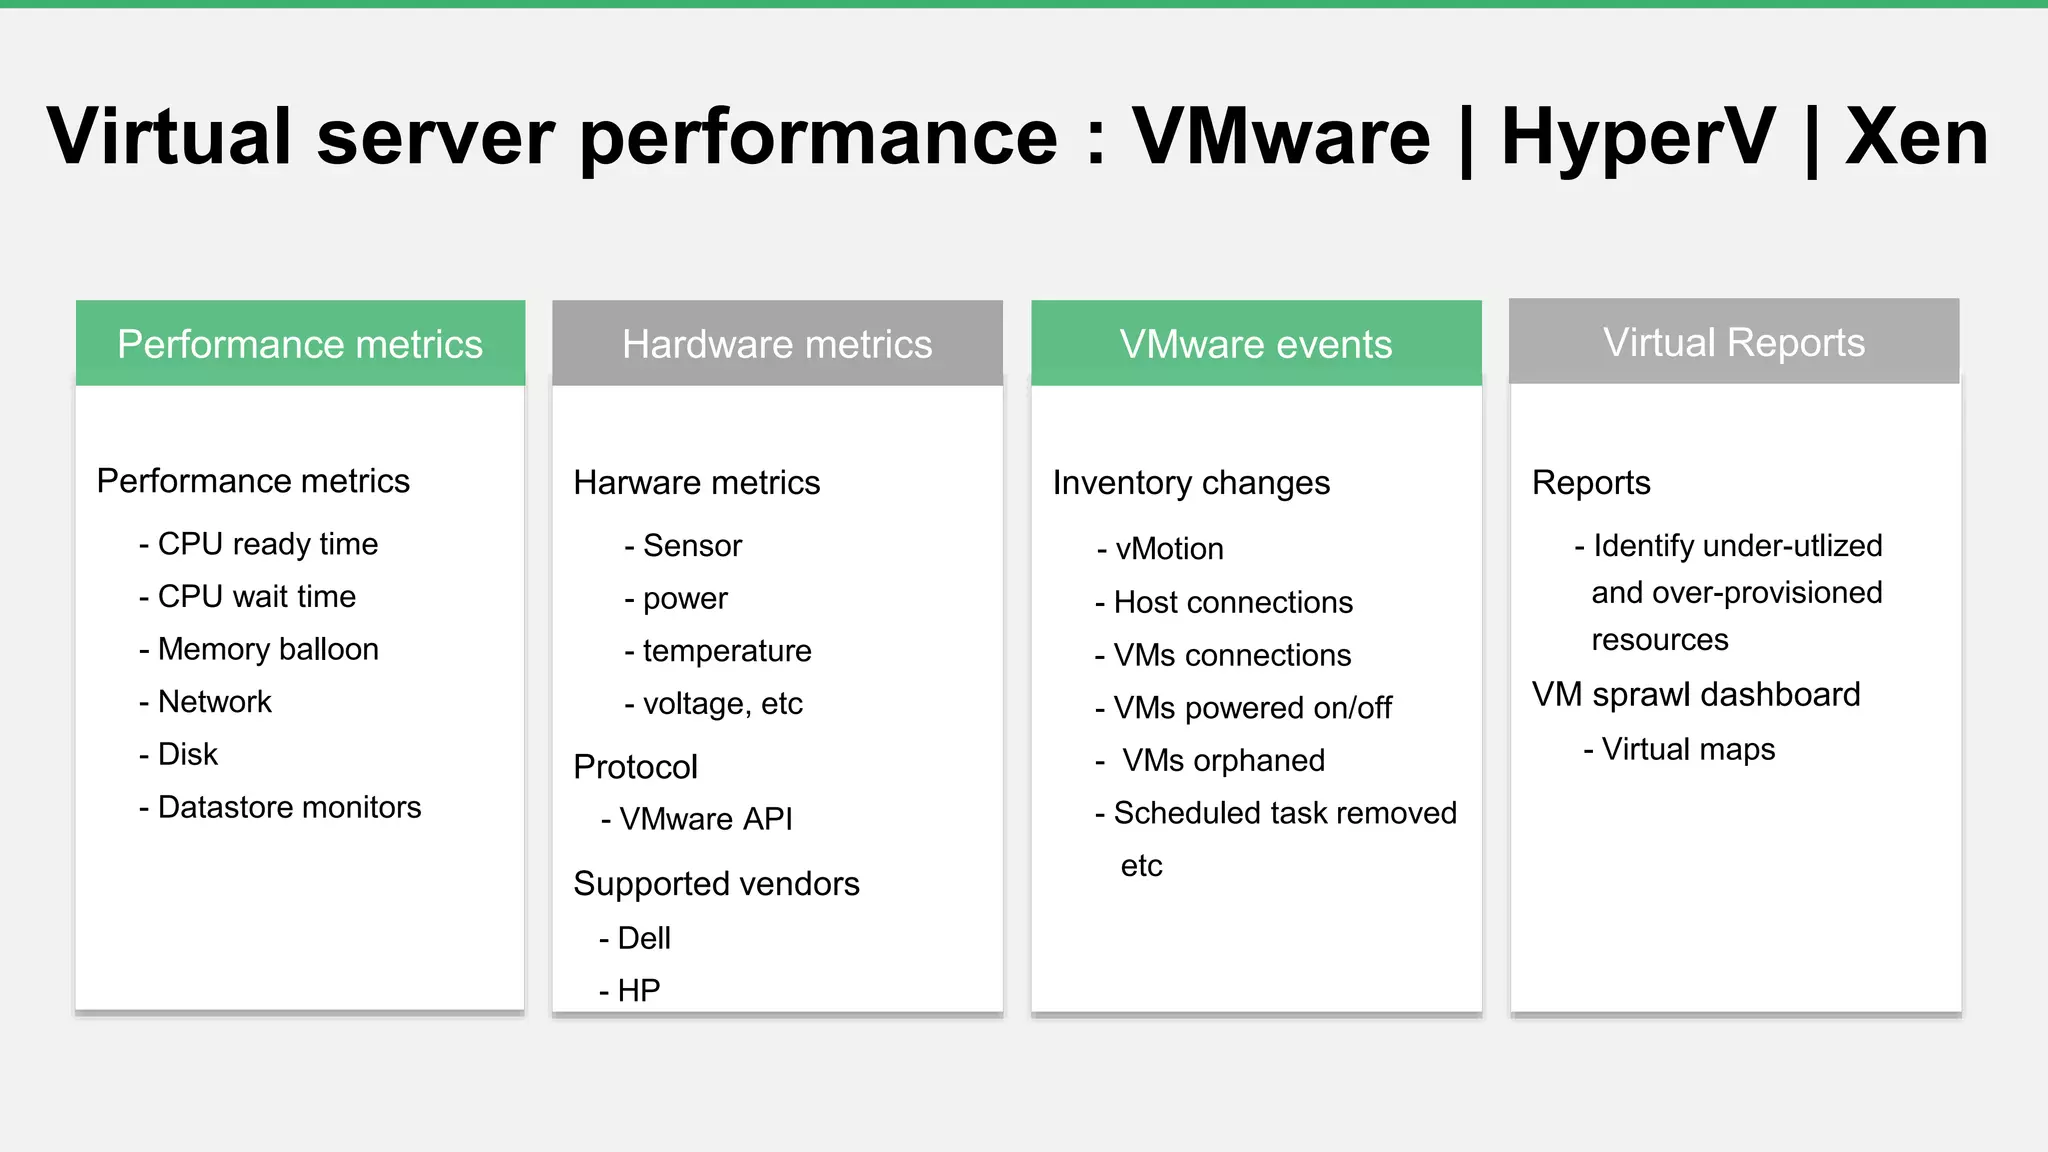
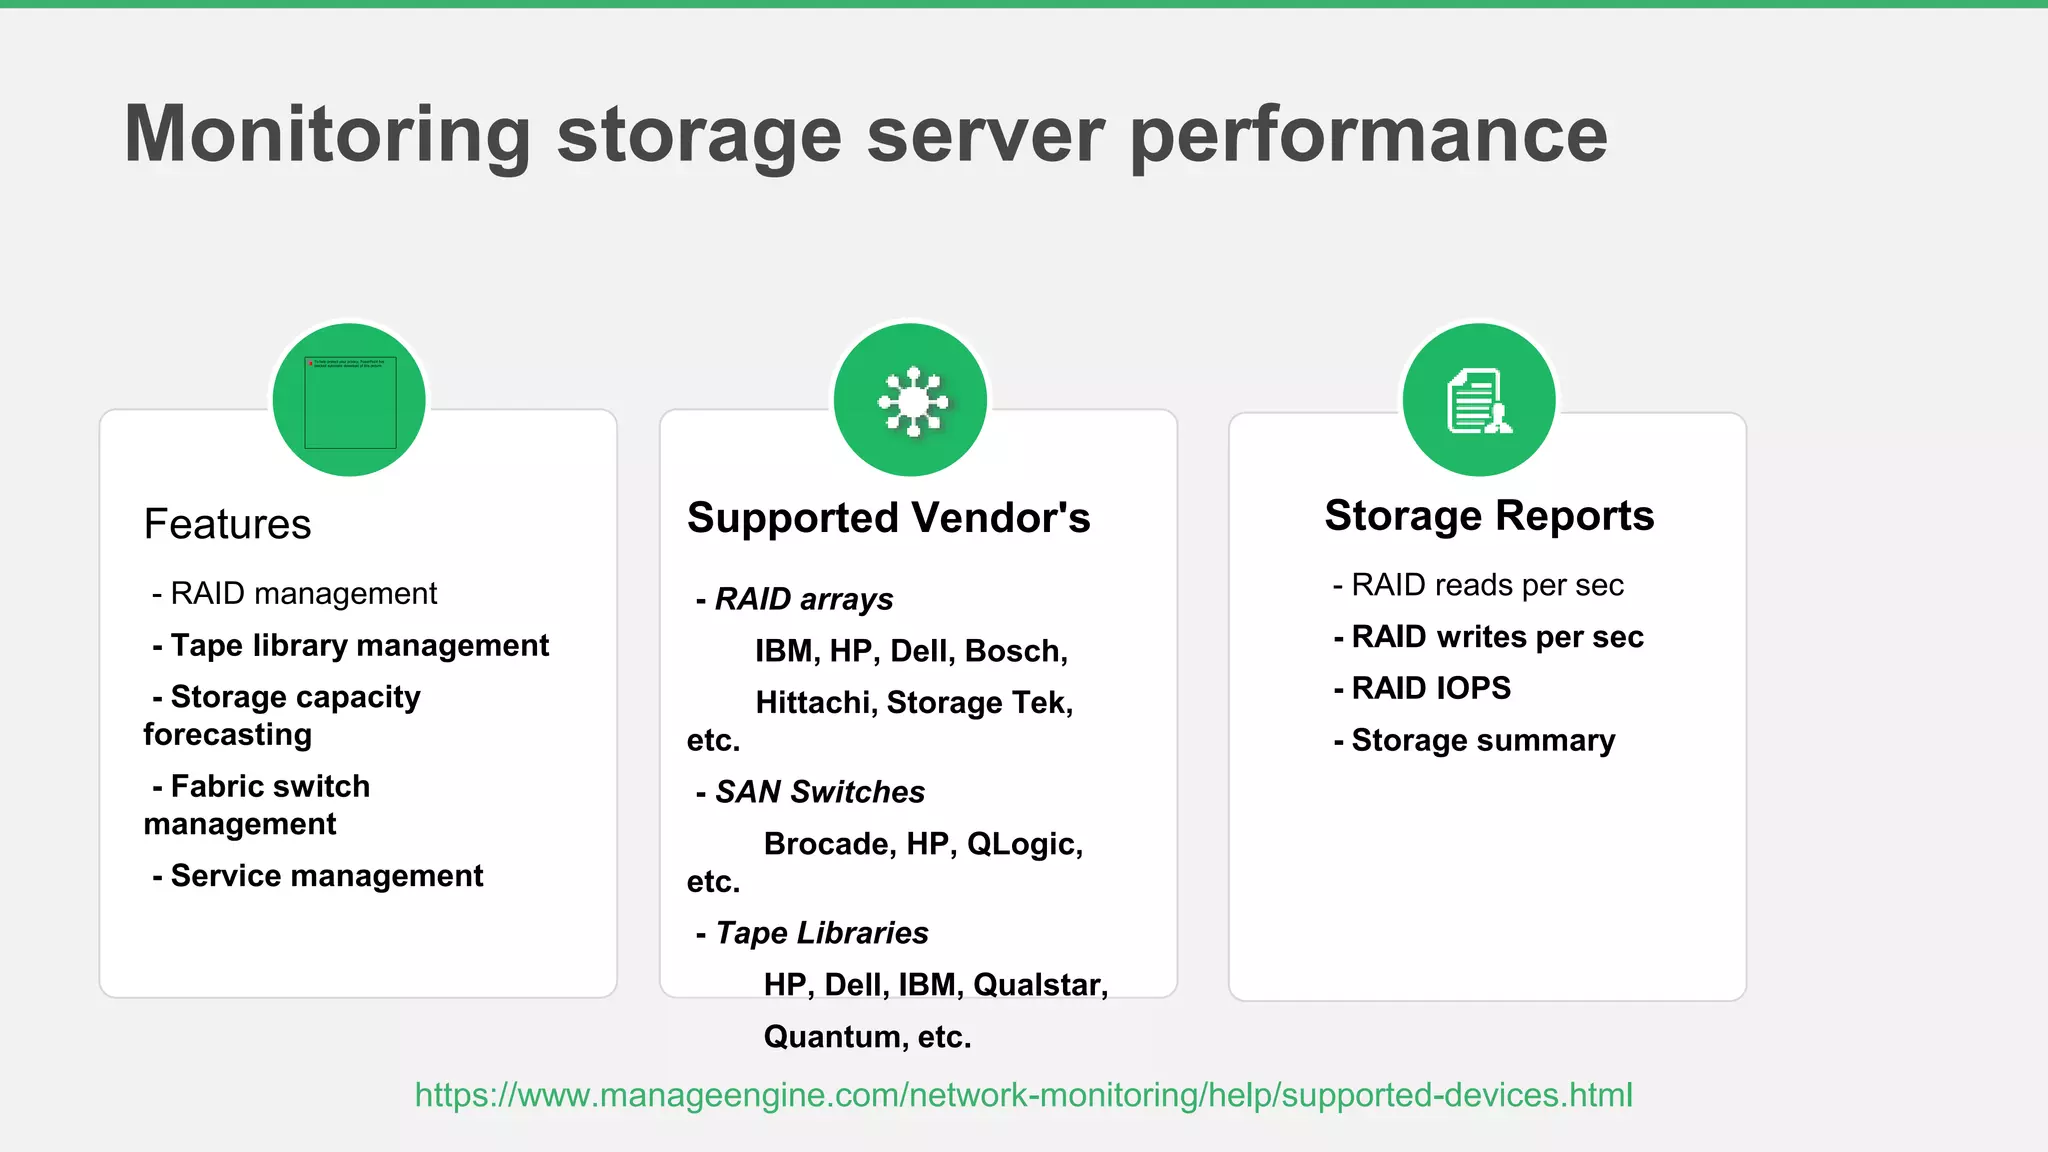
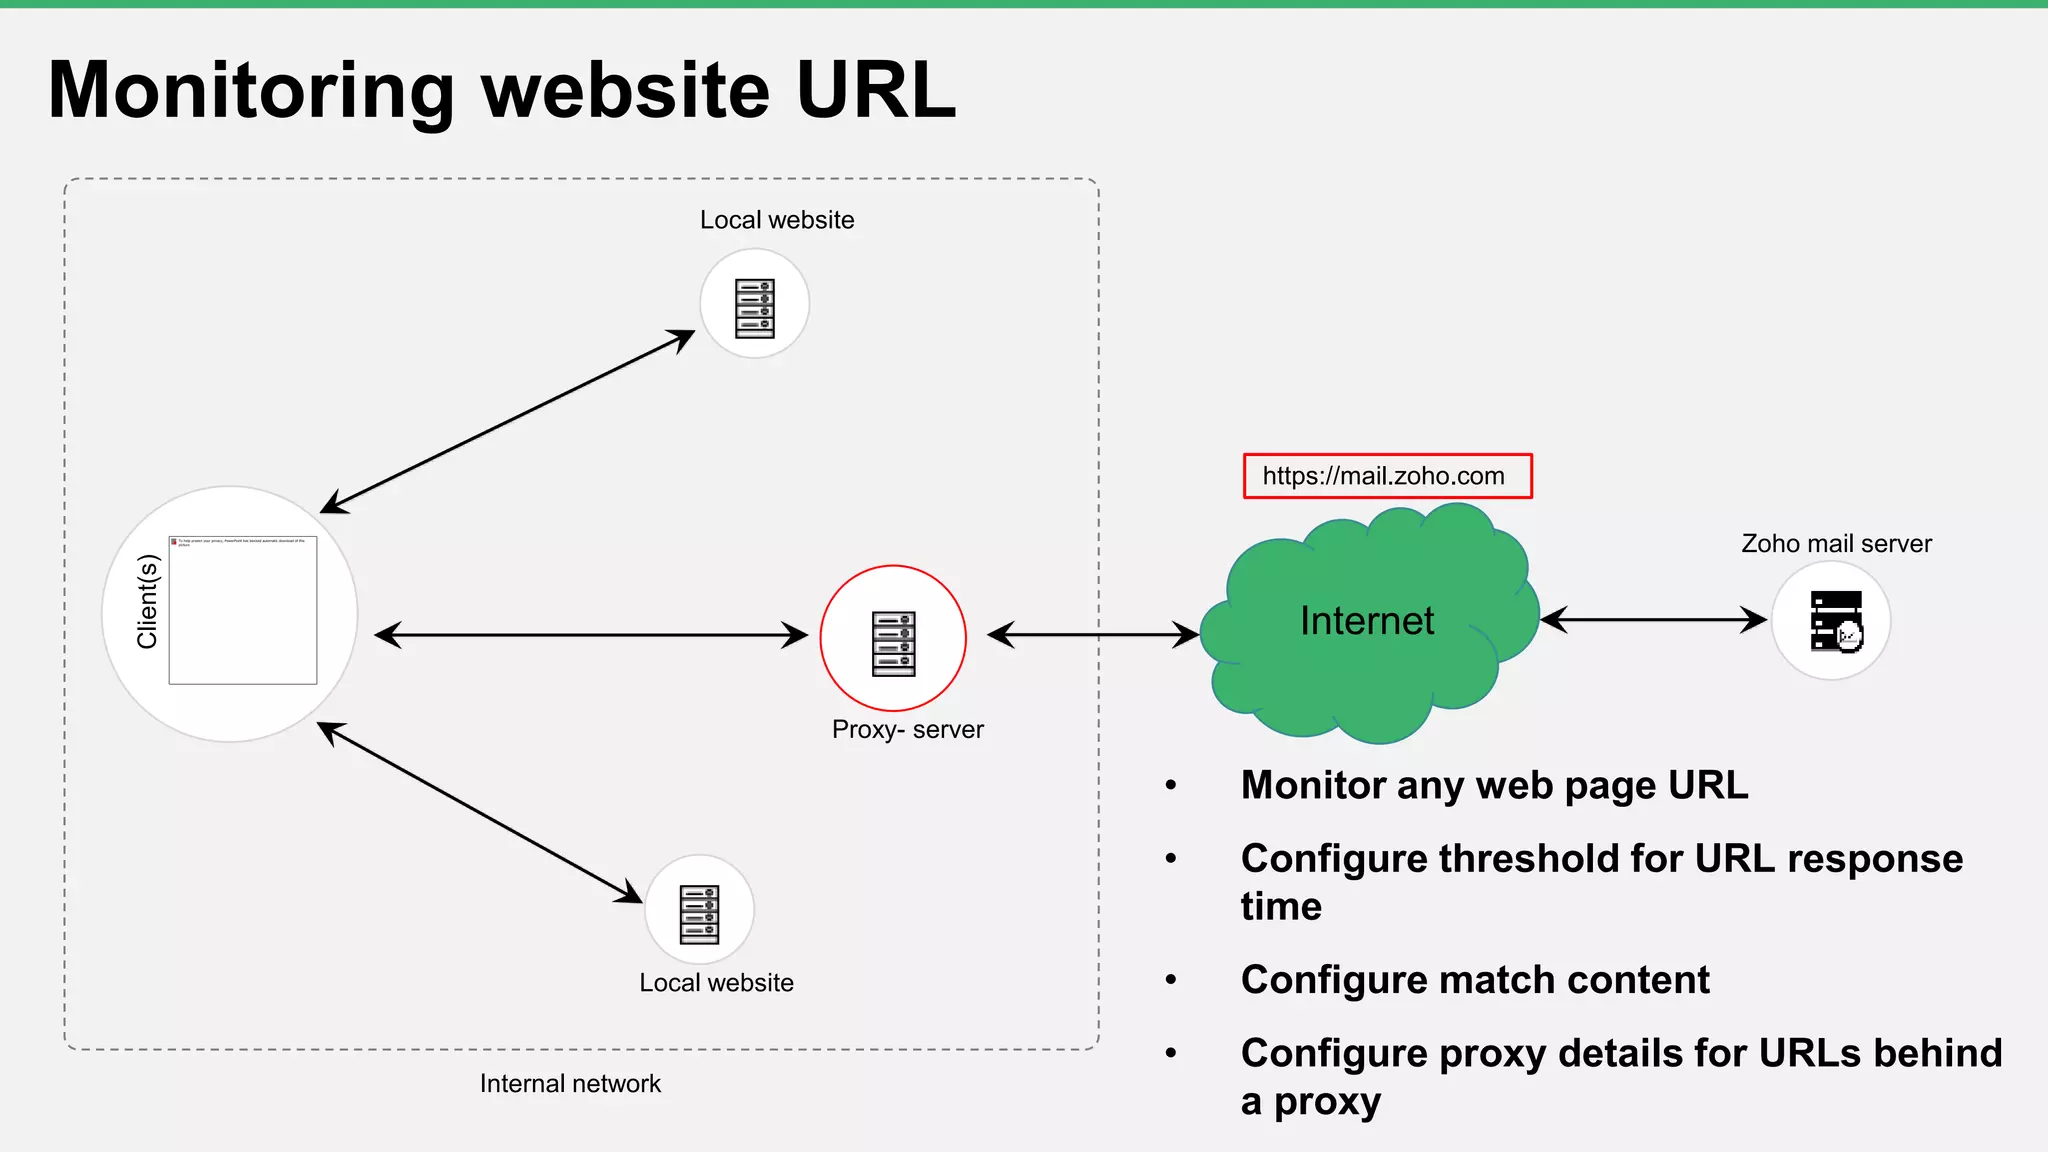
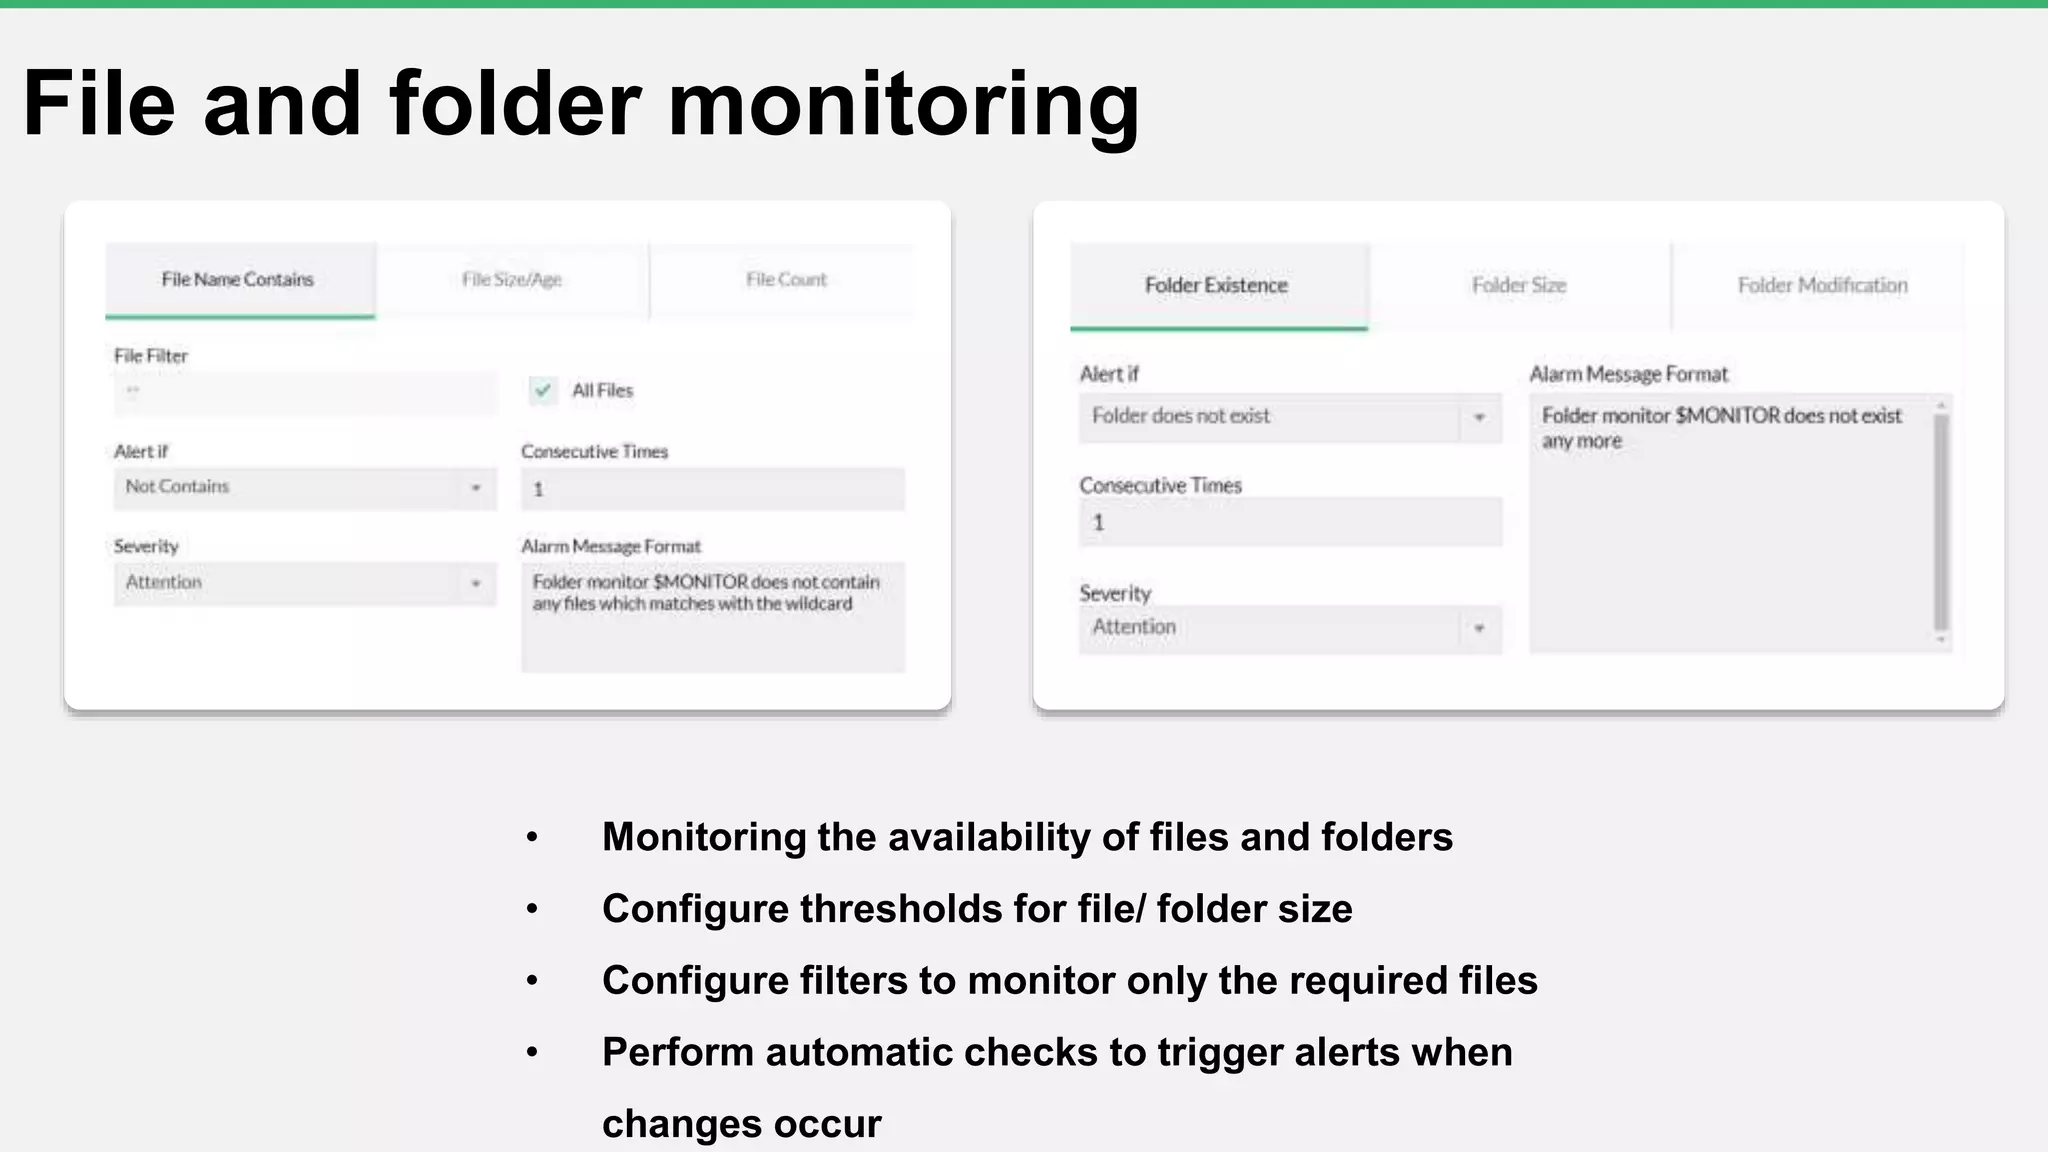
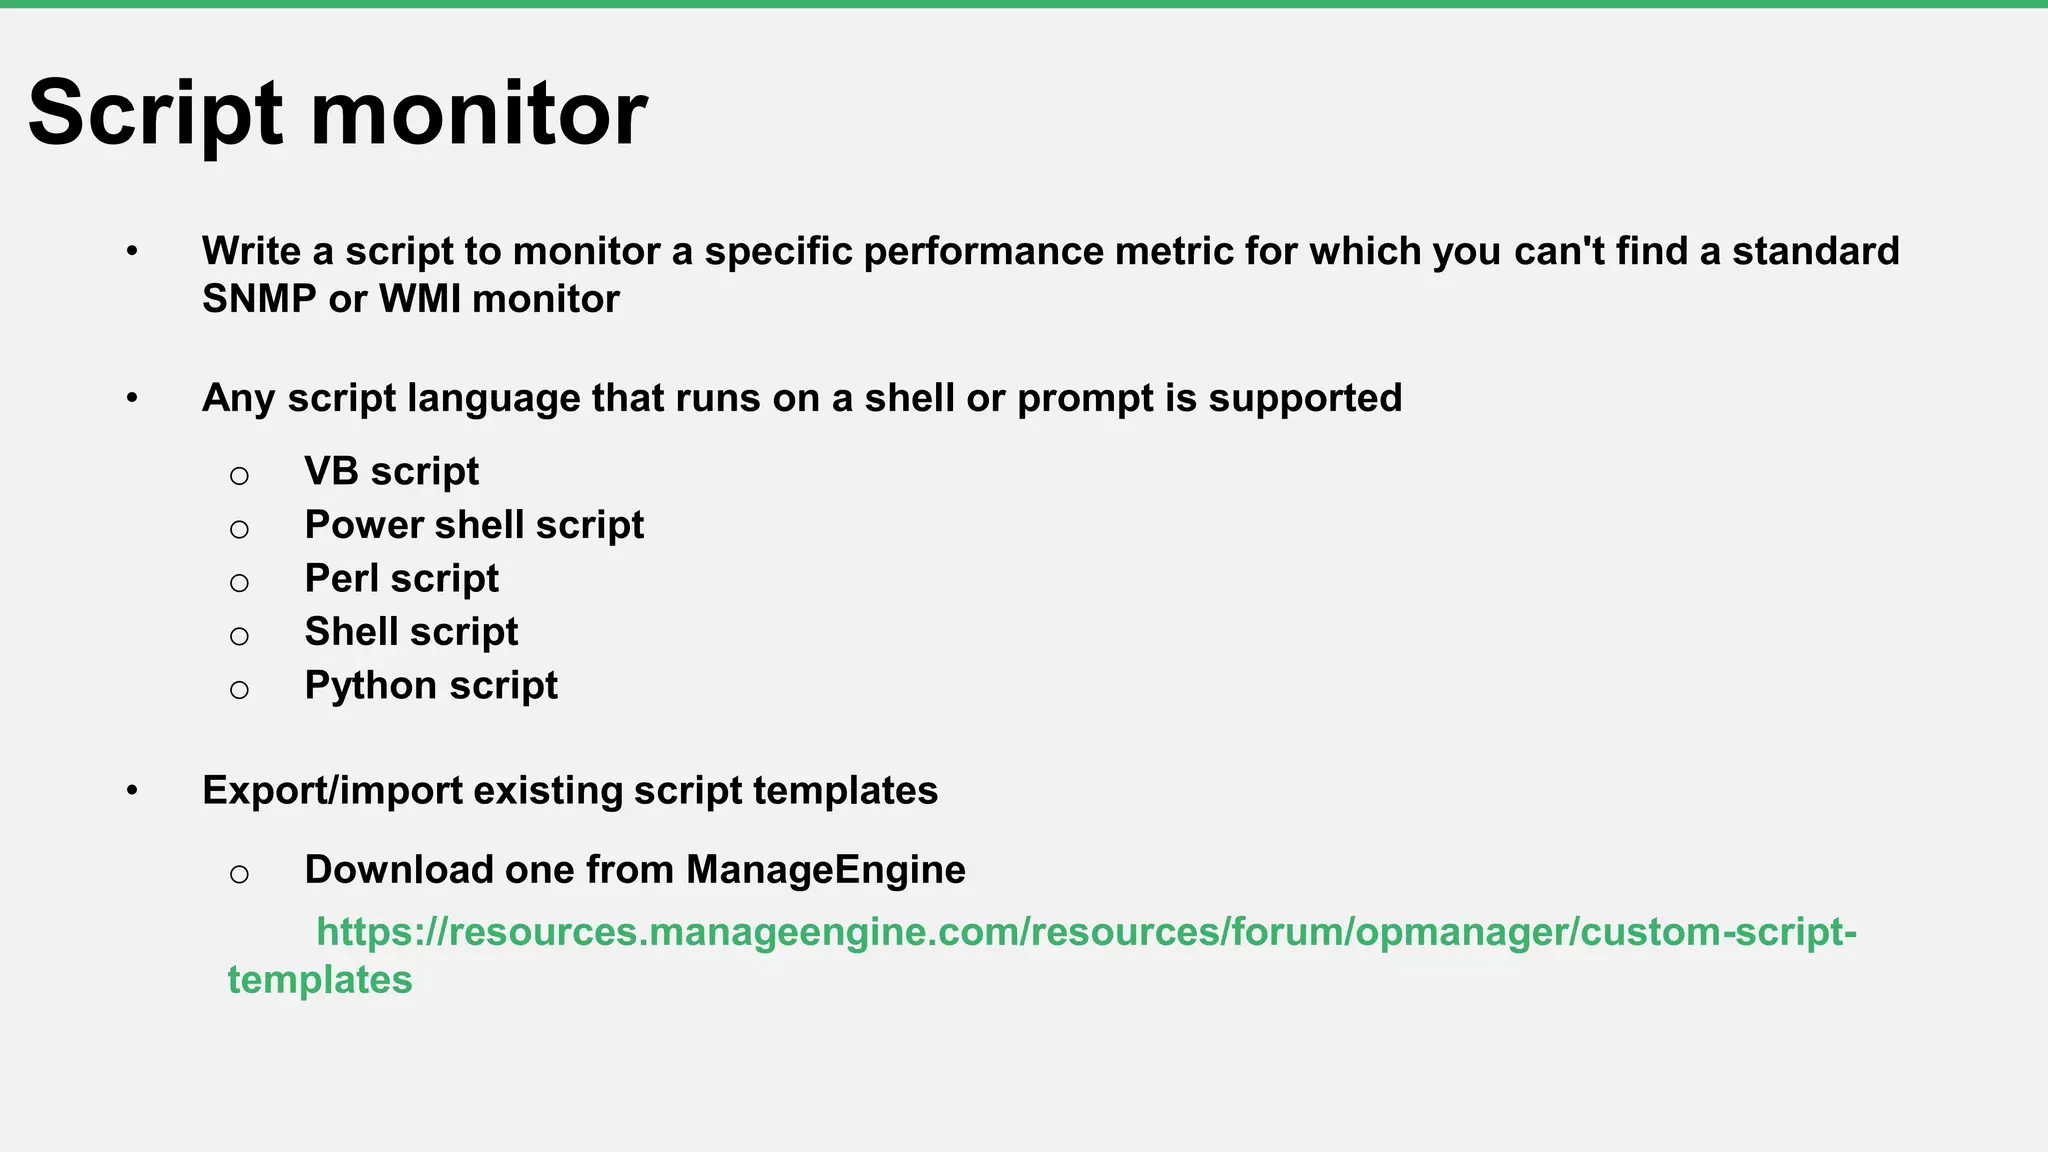
Welcome to a free OpManager training
session
Can you hear me? Can you see
the presentation?
Please confirm by commenting in the webinar chat panel
Trainer
Suresh Bagavathy
Evangelist for ManageEngine's ITOM suite
11 years' experience
Part 2
Monitoring
server performance
Agenda
 Monitoring availability
 Monitoring server performance
 Monitoring virtual server performance
 Monitoring storage server performance
 Monitoring website URL
 Monitoring Files and Folders
 Script monitoring
Monitor Protocol Status Color-code/Severity
Device ICMP/TCP port check Availability, response time, and
packet loss
Attention (1 poll)
Trouble (3 polls)
Critical (5 polls)
Interface SNMP Up/down Interface down
Service TCP port check Up/down Service down
Windows NT service WMI Up/down Service down
Process WMI/SNMP/SSH/Telnet Up/down Process down
File/Folder WMI Availability
URL HTTP /HTTPS Availability, response time
• ICMP/TCP
• Configuring thresholds for packet loss and response time
• Configuring uplink dependency
Monitoring device availability
UP DownOn
maintenance
On holdDependent
unavailable
Not
monitored
Outage historyAvailability statistics
Statu
s
Monitoring service availability
TCP service
Windows
service
Monitoring processes availability
• Processes up/down status
• Configure threshold for critical process
• Process template
Hard disk
usage
- Free disk space
- Used disk space
- Disk utilization
- Disk speed per sec
- Disk queue length
CPU usage
- CPU utilization
- % Privileged time
- Top processes by CPU
usage
Memory usage
- Memory utilization
- Pages per second
(faults, reads, and
writes)
- Top process by
memory usage
Server reports
Server health report
- Disk forecast by usage
etc
Monitoring Server performance
Performance metrics
- CPU ready time
- CPU wait time
- Memory balloon
- Network
- Disk
- Datastore monitors
Harware metrics
- Sensor
- power
- temperature
- voltage, etc
Protocol
- VMware API
Supported vendors
- Dell
- HP
Inventory changes
- vMotion
- Host connections
- VMs connections
- VMs powered on/off
- VMs orphaned
- Scheduled task removed
etc
Reports
- Identify under-utlized
and over-provisioned
resources
VM sprawl dashboard
- Virtual maps
Hardware metricsPerformance metrics VMware events Virtual Reports
Virtual server performance : VMware | HyperV | Xen
c
Monitoring storage server performance
Features
- RAID management
- Tape library management
- Storage capacity
forecasting
- Fabric switch
management
- Service management
Supported Vendor's
- RAID arrays
IBM, HP, Dell, Bosch,
Hittachi, Storage Tek,
etc.
- SAN Switches
Brocade, HP, QLogic,
etc.
- Tape Libraries
HP, Dell, IBM, Qualstar,
Quantum, etc.
Storage Reports
- RAID reads per sec
- RAID writes per sec
- RAID IOPS
- Storage summary
https://www.manageengine.com/network-monitoring/help/supported-devices.html
Internal network
Proxy- server
Internet
Client(s)
Zoho mail server
Local website
https://mail.zoho.com
Monitoring website URL
• Monitor any web page URL
• Configure threshold for URL response
time
• Configure match content
• Configure proxy details for URLs behind
a proxy
Local website
File and folder monitoring
• Monitoring the availability of files and folders
• Configure thresholds for file/ folder size
• Configure filters to monitor only the required files
• Perform automatic checks to trigger alerts when
changes occur
• Write a script to monitor a specific performance metric for which you can't find a standard
SNMP or WMI monitor
• Any script language that runs on a shell or prompt is supported
o VB script
o Power shell script
o Perl script
o Shell script
o Python script
• Export/import existing script templates
o Download one from ManageEngine
https://resources.manageengine.com/resources/forum/opmanager/custom-script-
templates
Script monitor
Questions?

Free OpManager training Part 2 Monitoring Server Performance- season#3

  • 2.
    Welcome to afree OpManager training session
  • 3.
    Can you hearme? Can you see the presentation? Please confirm by commenting in the webinar chat panel
  • 4.
    Trainer Suresh Bagavathy Evangelist forManageEngine's ITOM suite 11 years' experience
  • 5.
  • 6.
    Agenda  Monitoring availability Monitoring server performance  Monitoring virtual server performance  Monitoring storage server performance  Monitoring website URL  Monitoring Files and Folders  Script monitoring
  • 7.
    Monitor Protocol StatusColor-code/Severity Device ICMP/TCP port check Availability, response time, and packet loss Attention (1 poll) Trouble (3 polls) Critical (5 polls) Interface SNMP Up/down Interface down Service TCP port check Up/down Service down Windows NT service WMI Up/down Service down Process WMI/SNMP/SSH/Telnet Up/down Process down File/Folder WMI Availability URL HTTP /HTTPS Availability, response time
  • 8.
    • ICMP/TCP • Configuringthresholds for packet loss and response time • Configuring uplink dependency Monitoring device availability
  • 9.
  • 10.
    Monitoring service availability TCPservice Windows service
  • 11.
    Monitoring processes availability •Processes up/down status • Configure threshold for critical process • Process template
  • 12.
    Hard disk usage - Freedisk space - Used disk space - Disk utilization - Disk speed per sec - Disk queue length CPU usage - CPU utilization - % Privileged time - Top processes by CPU usage Memory usage - Memory utilization - Pages per second (faults, reads, and writes) - Top process by memory usage Server reports Server health report - Disk forecast by usage etc Monitoring Server performance
  • 13.
    Performance metrics - CPUready time - CPU wait time - Memory balloon - Network - Disk - Datastore monitors Harware metrics - Sensor - power - temperature - voltage, etc Protocol - VMware API Supported vendors - Dell - HP Inventory changes - vMotion - Host connections - VMs connections - VMs powered on/off - VMs orphaned - Scheduled task removed etc Reports - Identify under-utlized and over-provisioned resources VM sprawl dashboard - Virtual maps Hardware metricsPerformance metrics VMware events Virtual Reports Virtual server performance : VMware | HyperV | Xen
  • 14.
    c Monitoring storage serverperformance Features - RAID management - Tape library management - Storage capacity forecasting - Fabric switch management - Service management Supported Vendor's - RAID arrays IBM, HP, Dell, Bosch, Hittachi, Storage Tek, etc. - SAN Switches Brocade, HP, QLogic, etc. - Tape Libraries HP, Dell, IBM, Qualstar, Quantum, etc. Storage Reports - RAID reads per sec - RAID writes per sec - RAID IOPS - Storage summary https://www.manageengine.com/network-monitoring/help/supported-devices.html
  • 15.
    Internal network Proxy- server Internet Client(s) Zohomail server Local website https://mail.zoho.com Monitoring website URL • Monitor any web page URL • Configure threshold for URL response time • Configure match content • Configure proxy details for URLs behind a proxy Local website
  • 16.
    File and foldermonitoring • Monitoring the availability of files and folders • Configure thresholds for file/ folder size • Configure filters to monitor only the required files • Perform automatic checks to trigger alerts when changes occur
  • 17.
    • Write ascript to monitor a specific performance metric for which you can't find a standard SNMP or WMI monitor • Any script language that runs on a shell or prompt is supported o VB script o Power shell script o Perl script o Shell script o Python script • Export/import existing script templates o Download one from ManageEngine https://resources.manageengine.com/resources/forum/opmanager/custom-script- templates Script monitor
  • 18.